
From highly polluted inland city of China to "Lanzhou Blue":The air-pollution characteristics
2018-04-08 00:52:03SuPingZhaoYeYuDaHeQin
SuPing Zhao , Ye Yu , DaHe Qin
1. Key Laboratory of Land Surface Process and Climate Change in Cold and Arid Regions, Northwest Institute of Eco-Environment and Resources, Chinese Academy of Sciences, Lanzhou, Gansu 730000, China
2. Shanghai Key Laboratory of Atmospheric Particle Pollution and Prevention (LAP3), Shanghai 200433, China
3. State Key Laboratory of Cryospheric Sciences, Northwest Institute of Eco-Environment and Resources, Chinese Academy of Sciences, Lanzhou, Gansu 730000, China
1 Introduction
The eastern part of China, especially the North China Plain (NCP), has frequently suffered large-scale,severe haze-pollution events in recent years due to rapid urbanization, economic expansion, and industrialization (Chan and Yao, 2008; Wanget al., 2016;Yanget al., 2016; Yin and Wang, 2016). The high concentration of particulate matter and poor visibility have been a serious threat for human (Denget al.,2014; Vander Zeeet al., 2016) and ecological health(Zhanget al., 2010; Chenet al., 2014). Many studies on physicochemical properties and the formation mechanism of winter haze pollution on the NCP have been conducted using different methods, such as satellite remote sensing and ground observations (Guoet al., 2014; Liet al., 2016; Sunet al., 2016; Chenet al., 2017), numerical models (Fuet al., 2016; Longet al., 2016; Yanget al., 2016), and some statistical analyses (Battermanet al., 2016; Zhang Jet al., 2016;Zhaoet al., 2016). The hygroscopic growth of high levels of secondary inorganic aerosols during haze episodes and the weakening of winds over the years were found to be dominant factors leading to the decadal increase in winter aerosol concentrations and haze days over eastern China during recent decades(Yanget al., 2016; Tieet al., 2017). To improve urban air quality and solve traffic congestion, a series of emission-restriction measures has been implemented during several recent important events in Beijing and surrounding regions,e.g., the 2014 Asia-Pacific Economic Cooperation (APEC) summit and the 2015 Grand Military Parade, commonly referred to as"APEC Blue" and "Parade Blue", respectively, and has been shown to be an effective measure of emission reduction (Chenet al., 2015; Huanget al., 2015;Liuet al., 2016; Sunet al., 2016; Wang and Dai,2016). All aerosol species and NO2columns were shown to have significant decreases of 40% to 80%during APEC from those measured before APEC(Chenet al., 2015; Liuet al., 2016; Sunet al., 2016),indicating that emission control on a regional scale substantially reduced air-pollutant levels.
Lanzhou, the capital of Gansu Province, is located in the northwest of China and has experienced heavy air-pollution issues since the 1960s, as a result of large-scale emissions from the petrochemical industry and the valley basin, which is conducive to forming stagnant meteorological conditions (Zhanget al., 2000). The Xigu District of Lanzhou City is an important petrochemical and other major industrial base and also the first place in China that photochemical smog occurs (Zhanget al., 2000; Gaoet al., 2004).The air-pollution characteristics in urban Lanzhou and its formation mechanisms were studied intensively by previous researchers using methods of statistical analysis and numerical modeling (Zhang and Hu, 1992;Chenet al., 1994; Hu and Zhang, 1999; Savij?rvi and Jin, 2001; Zhang, 2001; Zhanget al., 2001; Zhenget al., 2006; Zhang and Li, 2011). Half of the days in winter exceeded the national grade II standard (Chenet al., 2010). It was shown that the daytime temperature inversion induced by aerosol-meteorology feedback and the peak-heating effect and calm wind conditions in the lower atmosphere due to valley terrain were two key factors in controlling air-pollution concentration. Although some proposals and measures such as mountain-slope afforestation and changing local terrain were able to break the long-standing boundary-layer temperature inversion, there was little improvement in air quality (Chuet al., 2008a; Yuet al., 2016). However, with implementation of the Air Pollution Prevention Battle (APPB) in 2012 and the Plan for the Control of Air Pollution (PCAP) in 2015 in Lanzhou, the air quality of urban Lanzhou improved (http://news.qq.com/a/20130115/000007.htm)and appeared frequently in the phenomenon of "Lanzhou Blue" (Figure 1). Lanzhou City was awarded the Prize for Today Change Progress at the United Nations climate-change conference in Paris in 2015, due to innovation and remarkable achievements in air-pollution control. The air quality of urban areas has gradually improved, but a shift in the characteristics of the main air pollutants has been unclear. The scientific research on the Lanzhou Blue phenomenon has not been published, which has been of no help to the other polluted Chinese cities in terms of learning about the Lanzhou experience of air-pollution prevention.
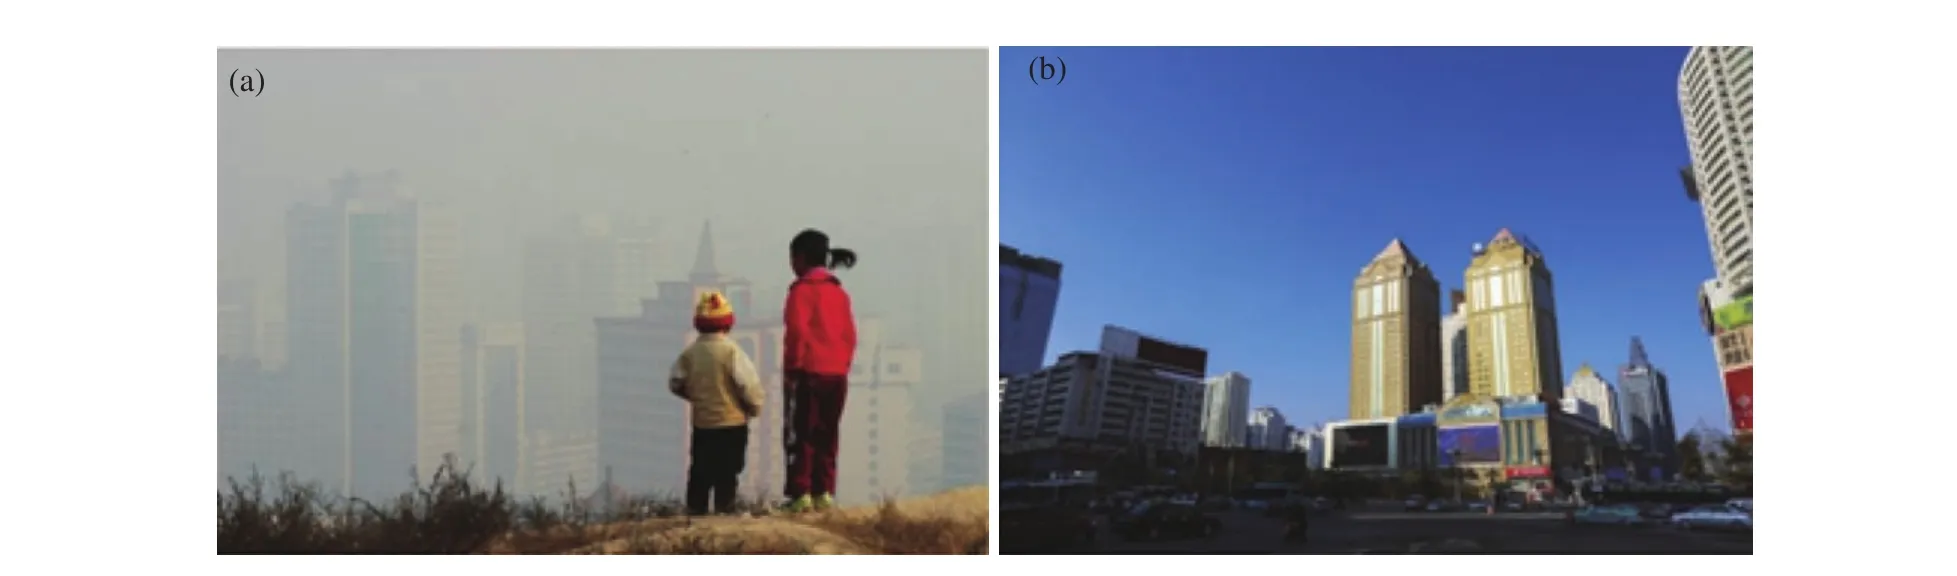
Figure 1 Comparison of winter air pollution over urban Lanzhou between (a) December 13, 2004 and (b) December 13, 2015(The pictures were downloaded from the following website: http://lz.gansudaily.com.cn/system/2016/01/11/015849516.shtml)
In this study, interannual, annual, and diurnal variations of six criterion air pollutants (PM2.5, PM10,SO2, NO2, CO, and O3) in Lanzhou from 2013 to 2016 were analyzed using air-quality data from the China National Environmental Monitoring Centre.The interannual variation trends of the air pollutants were fitted using unary linear regression (ULR) to quantify variation of the pollutants. The study provides deep analysis of the variation of air-pollution characteristics in urban areas of Lanzhou, along with the shift of polluted air quality from the most to the less, which provides a basis for the formulation of future urban air-pollution control measures in central or eastern China, especially on the North China Plain.
2 Data and methods
2.1 Air-quality data
The air-quality data of urban areas and the outer suburbs of Lanzhou City used in this study were from state-controlled sites of the China National Environmental Monitoring Center(http://113.108.142.147:20035/emcpublish/). The applicable rules of state-controlled air-monitoring sites,the instruments measuring gaseous and particulate matter pollutants, the quality assurance measures, and the control of data were described in detail by Zhaoet al. (2016).
A automated monitoring systems were installed to measure concentrations of gaseous pollutants (SO2,NO2, CO, and O3) at each site. Each monitoring system of gaseous pollutants is made up of a sample unit,a calibration unit, an analytical instrument, and a data-collection and transport unit. SO2, NO2, and O3are measured by the ultraviolet fluorescence method(TEI, Model 43i from Thermo Fisher Scientific Inc.,USA), the chemiluminescence method (TEI Model 42i from Thermo Fisher Scientific Inc., USA), and the UV-spectrophotometry method (TEI model 49i from Thermo Fisher Scientific Inc., USA), respectively.CO is measured using the nondispersive infrared-absorption method and the gas-filter correlation/infrared-absorption method (TEI, Model 48i from Thermo Fisher Scientific Inc., USA). The PM2.5and PM10continuous monitoring system consists of the sample-collection unit, the sample-measurement unit,the data-collection and transport unit, and accessory equipment. The micro-oscillating balance method(TEOM from Rupprecht & Patashnick Co., Inc.,USA) and the β-absorption method (BAM 1,020 from Met One Instrument Inc., USA) are used to measure PM2.5and PM10.
The interannual variation trends of six criterion air pollutants at each state-controlled site of Lanzhou from 2013 to 2016 were fitted using unary linear regression (ULR) for domestic- (November to March of the next year) and no-domestic-heating seasons (April to October). The equation of unary linear regression can be expressed as follows:

whereyis a specific air pollutant, such as PM2.5,PM10, SO2, NO2, CO, or O3;xis the number of years;andbis the rate of change for the specific air pollutant concentrations from 2013 to 2016.
2.2 Monitoring sites
Lanzhou is a typical valley city in an arid area,with a population of approximately 3.5 million, annual rainfall of 327.7 mm, and mean temperature of 9.3 °C. It is located in a long valley running mainly east to west with a length of about 30 km, maximum width of 8 km, and depth of 200-600 m. Due to the effect of the valley terrain, mean surface wind speed is only 0.3 m/s in winter; and the monthly calm frequency reaches as high as 81% (Wanget al., 1999).Furthermore, a lot of industries are based in the city,including an oil refinery, petrochemical industries,machinery and metallurgical industries, textile mills,food-processing centers, cement manufacturing, coal mining, rubber processing, electrical power generation, medical industries, lead and zinc mining and smelting, and fertilizer plants (Zhang XWet al.,2012). The air pollutants emitted from the industries were difficult to disperse due to weak winds and stable stratification inhibiting the turbulent diffusion aspect in urban Lanzhou, with the aspect ratio of the valley (depth versus width) of 0.07 (Chuet al., 2008).
The five state-controlled monitoring sites of Lanzhou are shown in Figure 2: (1) LLBG (103.63°E,36.10°N) in the Xigu District, an industrial area with an oil-refinery company, petrochemical plant, textile mill, and other small industries; (2) ZGYY (103.71°E,36.07°N) in the Qilihe District, residential and commercial areas near the Lanzhou Petro-Chemical Machinery Plant, which produces large machines for oil production; (3) SWZPS (103.84°E, 36.07°N) in the Chengguan District, a residential area near the Lanzhou Institute of Biological Products, which performs research and manufacturing of biological products;(4) TLSJY (103.83°E, 36.04°N) in the Chengguan District, residential and commercial areas near a machinery industry; and (5) YZLDXQ (104.14°E,35.94°N) in Yuzhong County of Lanzhou City, which can be used as rural background regions. The interannual variations of PM2.5concentrations for daytime(the white bar) and nighttime (the black bar) in winter(the narrow bar) and summer (the wide bar) at each monitoring site are also given in Figure 2. The column of PM2.5concentration in 2016 is different from other years in Figure 2, mainly due to the lack of PM2.5data in winter 2016.
3 Results and discussion
3.1 Variations in the air pollutants
Concentrations of six criterion air pollutants and the differences between domestic- and no-domestic-heating seasons at the five stated-controlled monitoring sites of Lanzhou City were calculated in Table 1 to know the contribution of domestic heating to urban air pollution. The concentrations of particulate matter, CO, SO2, and NO2at all monitoring sites for the domestic-heating season were significantly higher than those for the no-domestic-heating season,due to the effect of coal burning for heating and poor diffusion conditions, while higher concentrations of ozone were found in the no-domestic-heating season.Furthermore, the monitoring site with the highest concentration of a specific pollutant among the five sites was different for domestic- and no-domestic-heating seasons, due to variation of pollution sources during the two seasons (Table 1). For example, for the no-domestic-heating season, concentrations of PM2.5and SO2at LLBG, PM10at ZGYY, CO and NO2at TLSJY, and CO at SWZPS were higher than the corresponding air pollutant at the other monitoring sites.These figures indicate that the air quality at LLBG and ZGYY was mainly affected by industry and construction fugitive dust, respectively, while the air pollution at TLSJY and SWZPS was mainly induced by motor vehicles. The mean SO2concentration at YZLDXQ in the domestic-heating season was 19.6 μg/m3, which was 1.4 times higher than that in the no-domestic-heating season, suggesting that the urban air quality in winter in northern China was largely affected by coal burning for heating.
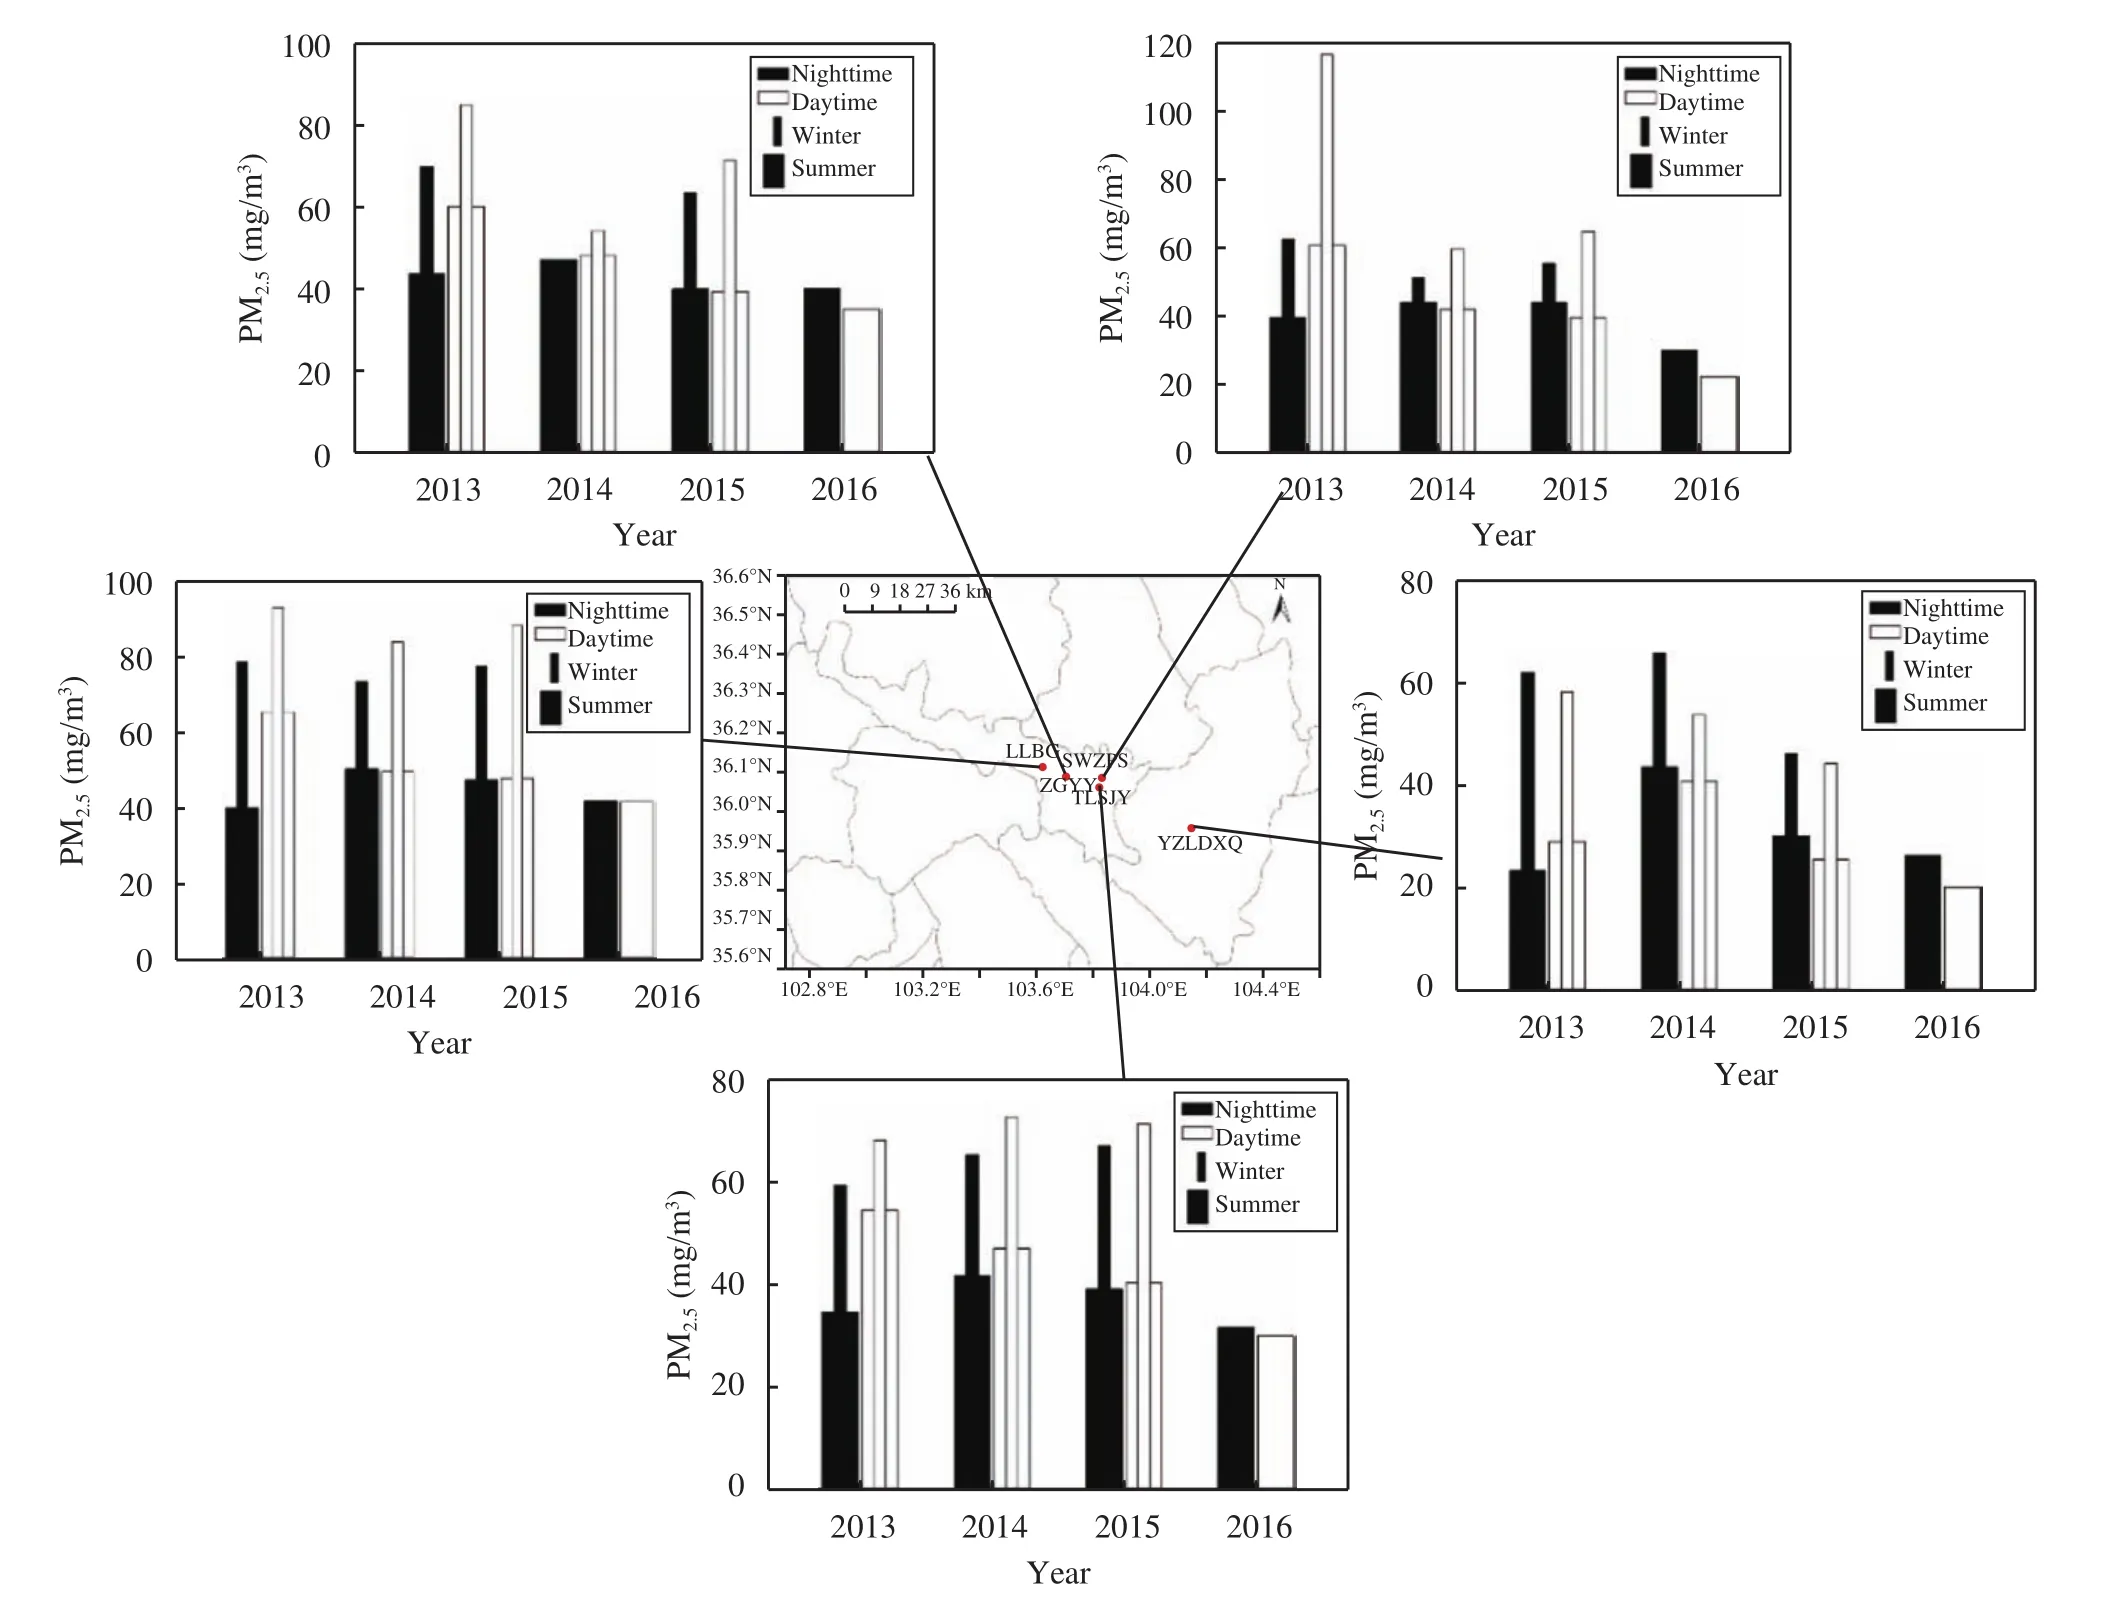
Figure 2 Locations of the state-controlled monitoring sites of Lanzhou and interannual variations of PM2.5 concentrations for daytime (the white bar) and nighttime (the black bar) in winter (December to February of the next year, the narrow bar)and summer (June to August, the wide bar) at each monitoring site. PM2.5 data for winter 2016 are missing
The AQI, PM2.5, PM10, and especially SO2gradually decreased from 2013 to 2016 for urban and rural areas of Lanzhou as production of some industries has been strictly controlled since 2013 in urban Lanzhou(Lanzhou Statistical Yearbook, 2016). The daily mean PM10concentrations also decreased gradually during the study period, with rates of -0.0297 μg/(m3·d)(urban areas) and -0.0303 μg/(m3·d) (rural areas).However, CO and NO2concentrations had slightly increasing trends (Figure 3), especially in urban areas,due to the large number of motor vehicles—804.6 thousand in urban Lanzhou in 2015, with an annual growth rate of 30.87% (Lanzhou Statistical Yearbook,2016). The differences in Figure 3 were obtained by subtracting AQI or the concentration of the specific pollutant in rural areas from that in urban areas. The NO2and SO2concentrations in urban areas were higher than those in rural areas, especially NO2, suggesting the large effect of emissions from industries and motor vehicles on urban air quality. Additionally,it is more interesting to us that the O3concentration in rural areas was much higher than that in urban areas in 2016, with the maximum value larger than 200 μg/m3in June 2016, which has seriously impacted crops and human health. With the lower NO2concentration in rural areas in June 2016, the high concentration of O3in rural areas may be mainly affected by VOCs (volatile organic compounds) emitted from biology in rural areas, as NOxand VOCs were the main precursors of O3(NRC, 1991). Ozone pollution is likely to worsen in the future despite recent reductions in the emission of particulate matter (PM2.5and PM10) and SO2(Wanget al., 2013). For example, recent severe air pollution in summer in Chengdu, located in the Sichuan Basin, was partly induced by high ozone concentrations (http://www.sc.gov.cn/10462/12771/2015/8/20/10349299.shtml). Therefore,fine particulate-matter (PM2.5) and ozone pollution should be prevented collaboratively over China in the future to improve urban air quality effectively.
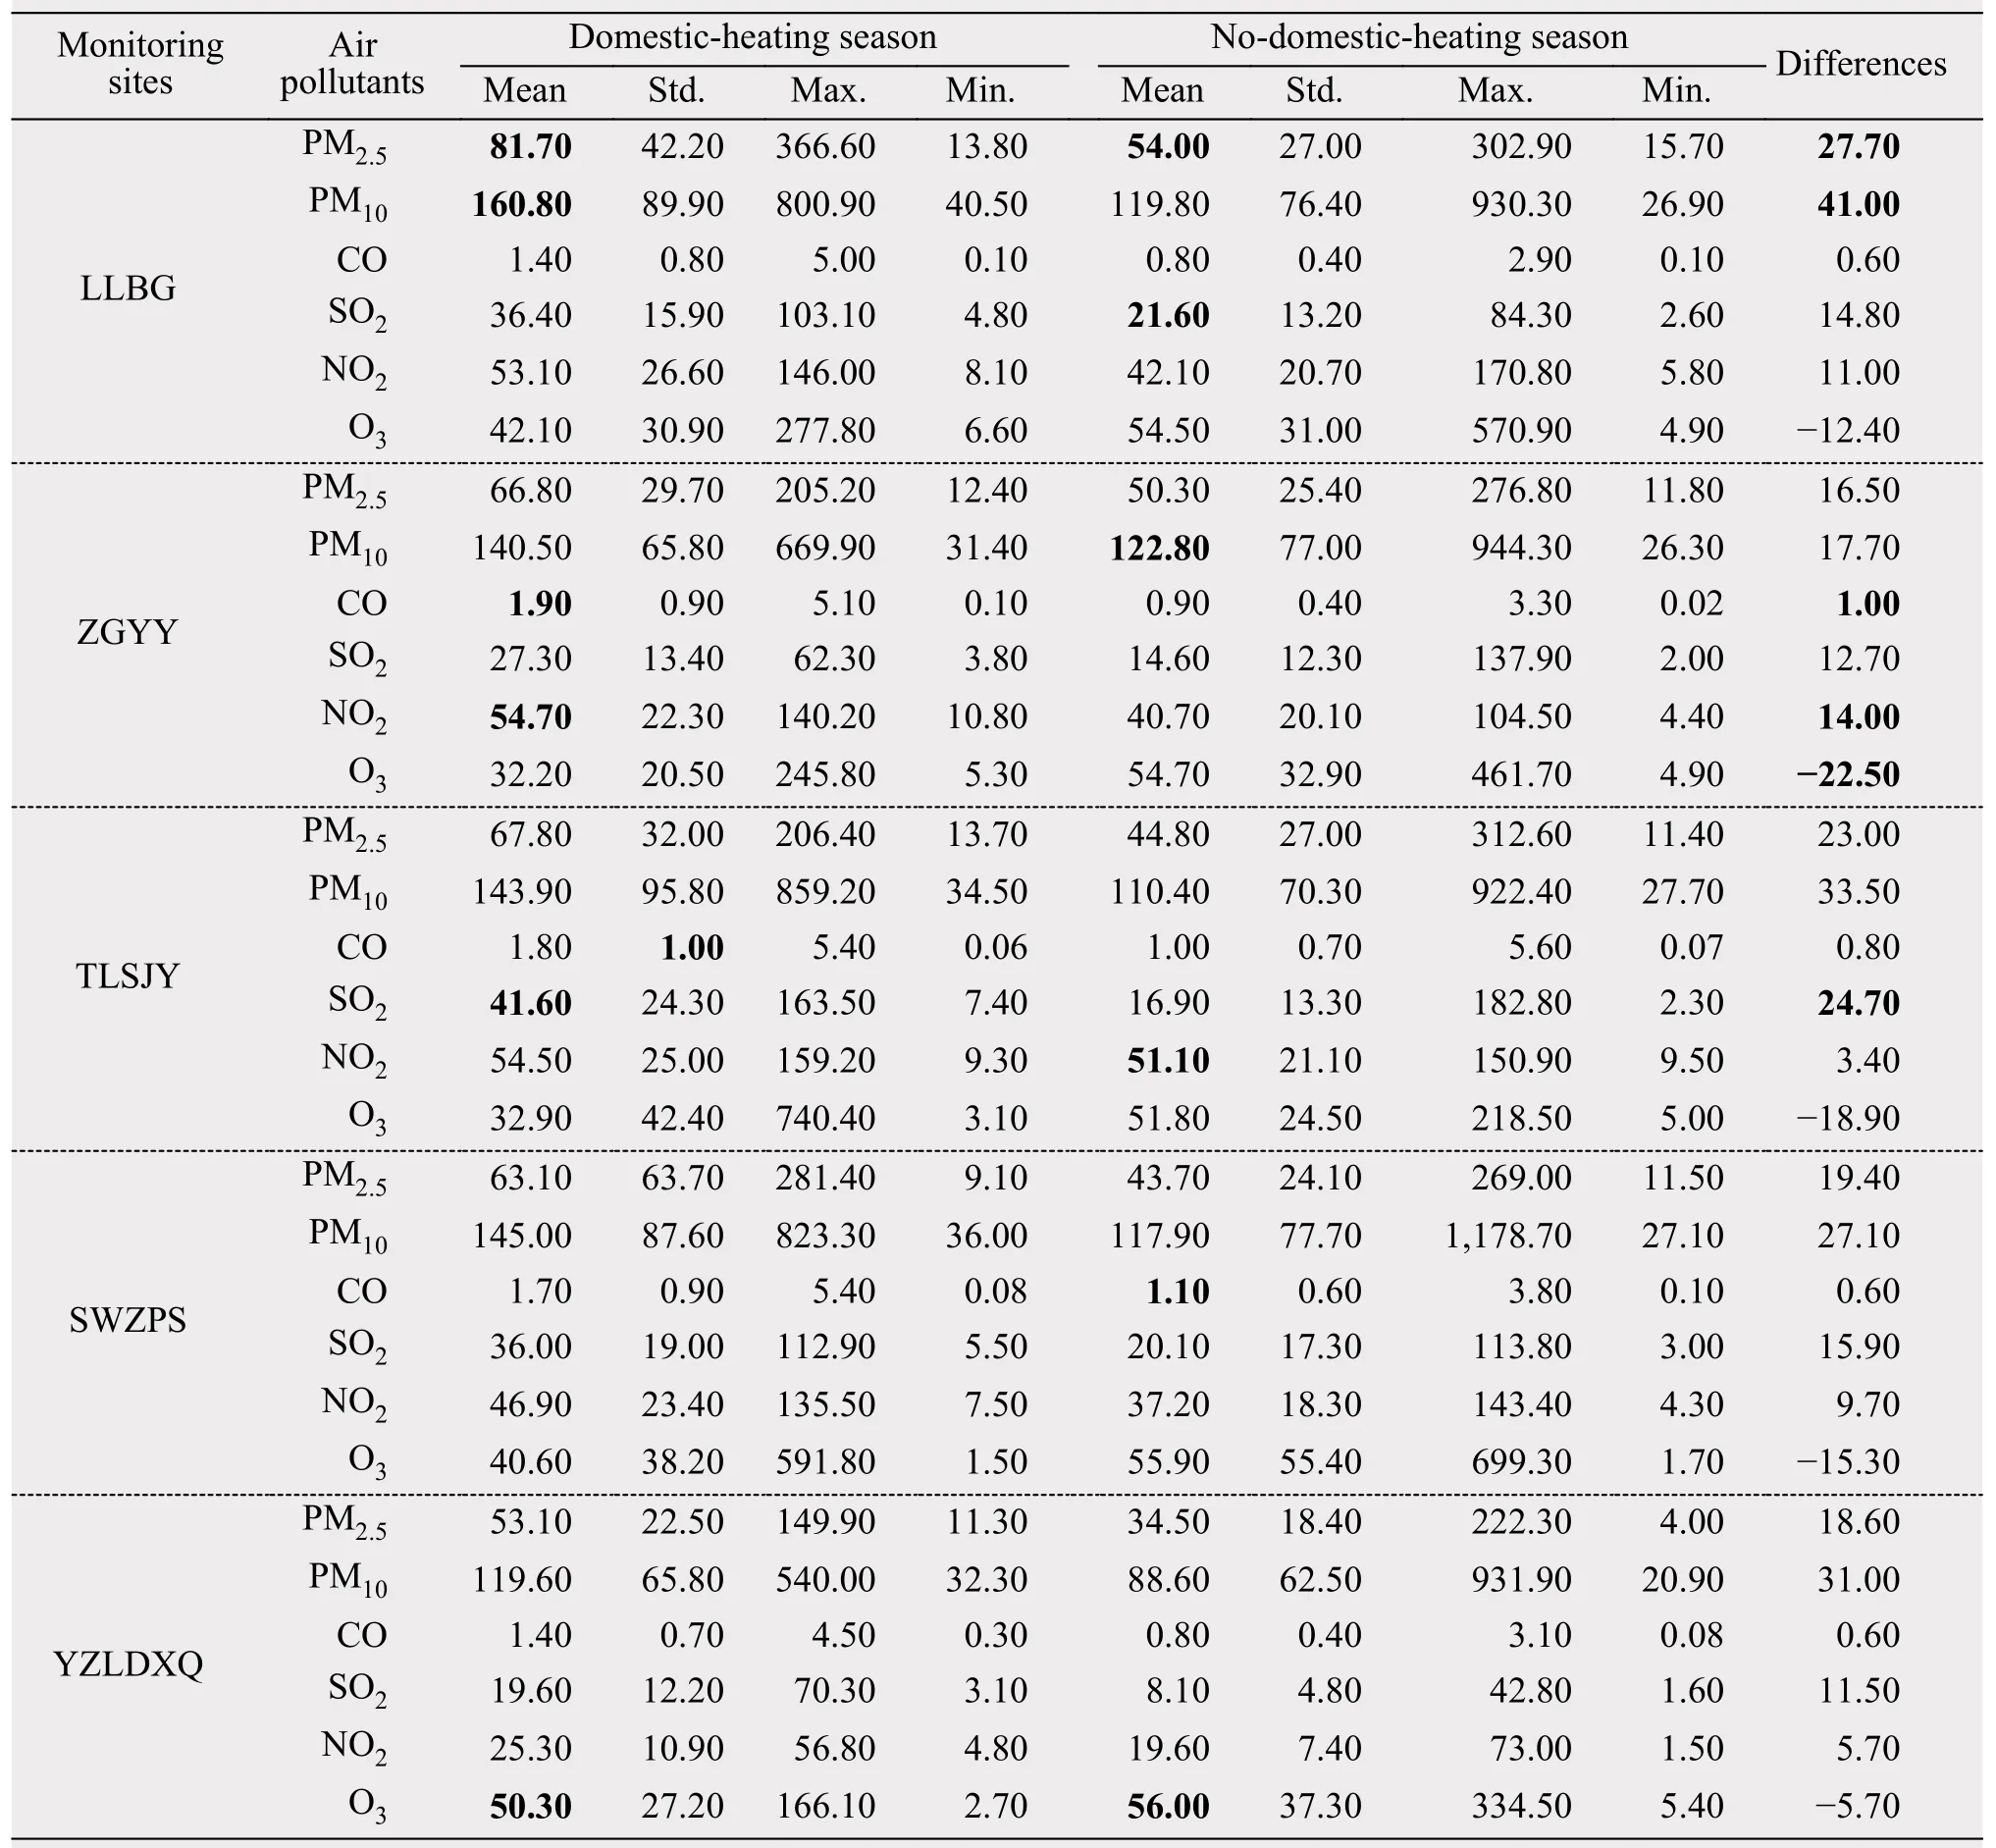
Table 1 Statistics of six criterion air pollutants for domestic- and no-domestic-heating seasons at the five stated-controlled monitoring sites of Lanzhou City
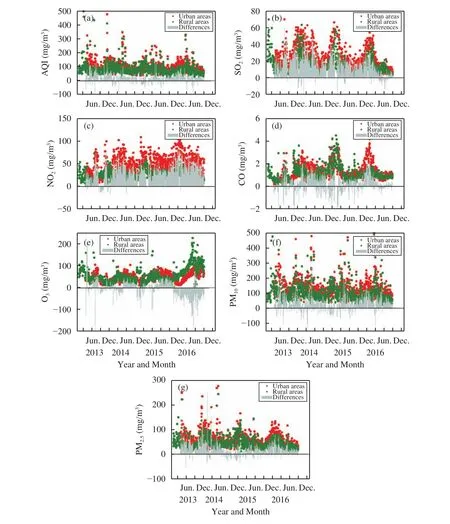
Figure 3 Interannual variations of daily mean AQI (Air Quality Index) and concentrations of six criterion air pollutants for urban and rural areas of Lanzhou and the corresponding differences between the two areas from 2013 to 2016 (Differences were obtained by subtracting AQI or the concentration of the specific pollutant in rural areas from that in urban areas)
To quantify the increase or decrease of a specific air pollutant each year from 2013 to 2015, interannual variable rates of the annual mean AQI (Air Quality Index) and six criterion air pollutants at the five sites for domestic- and no-domestic-heating seasons were fitted by unary linear regression (Figure 4 and Table 2;figures for LLBG, TLSJY, SWZPS, and YZLDXQ are similar to Figure 4 and so were omitted here). The concentrations of PM2.5, PM10, and SO2were obviously reduced by a more significant decrease of PM2.5in daytime of summer (Figure 2), while the other three pollutants gradually increased (Table 2), which was in accordance with the above conclusions. The variations of the air pollutants in the no-domestic-heating season were more significant than those in the domestic-heating season, especially PM10in ZGYY decreasing 19.85 μg/m3each year as building construction was mainly deployed in warm seasons(Figure 4 and Table 2). As an indicator of motor-vehicle pollution, CO concentration increased by 0.21 mg/m3per year for the no-domestic-heating season at SWZPS, with a dense population, 3.2 times higher than that for the domestic-heating season, indicating vehicle-exhaust pollution was increasingly serious with the rapid increase in the number of motor vehicles (Lanzhou Statistical Yearbook, 2016). Addi-tionally, the increase in ozone concentration for the domestic-heating season at YZLDXQ background station was the most significant among the five monitoring sites, while for the no-domestic-heating season,the increase was more obvious at LLBG and SWZPS due to low particulate-matter concentrations' leading to strong solar radiation during the no-domestic-heating season (Zhaoet al., 2016).
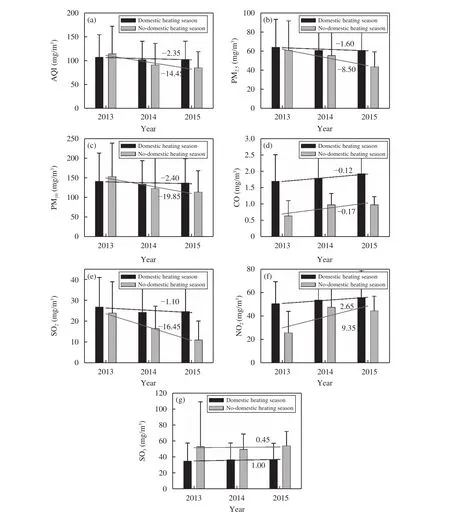
Figure 4 Interannual variation trends of annual mean AQI (Air Quality Index) and concentrations of six criterion air pollutants at ZGYY for domestic- (the black bar) and no-domestic-heating (the gray bar) seasons during the years from 2013 to 2015. The variation trends were fitted by unary linear regression. The 2016 data were not included in this figure due to lack of data in winter 2016. The error bars indicate the standard deviations of AQI or the concentrations of the pollutants each year
Interannual variations of probability-distribution functions (PDF) of AQI (Air Quality Index) and the six air pollutants at the five monitoring sites from 2013 to 2015 were selected to better understand airpollution characteristics in recent years. Due to the small differences among the sites of urban areas, the PDF variations of AQI and the pollutants at ZGYY were given in Figure 5 as representative of urban areas. The logarithmic scale was used in the vertical axes of AQI, PM2.5, and PM10, and the horizontal axes of CO, SO2, NO2, and O3to better display interannual differences of PDFs of AQI and the pollutants in Lanzhou. As can be seen from Figure 5, the peaks of probability-distribution functions of AQI, PM2.5, and PM10changed less from 2013 to 2015; but the air-pollution episodes with high PM2.5or PM10significantly reduced in Lanzhou, findings inconsistent with the frequent severe haze pollution on the North China Plain (NCP) in recent winters (Battermanet al., 2016;Yanet al., 2016; Yanget al., 2016). For example, the results from Yanget al. (2016) indicated that observed winter haze days averaged over eastern China(105°E-122.5°E, 20°N-45°N) increased from 21 days in 1980 to 42 days in 2014 and from 22 to 30 days from 1985 to 2005. The pollution days with an SO2concentration higher than 10 μg/m3obviously decreased from 2013 to 2015 in Lanzhou, as a series of strict emission-control measures were taken in recent years. However, high CO and NO2pollution events considerably increased in Lanzhou from 2013 to 2015, which may be partly due to less restriction of motor-vehicle exhaust emissions. Generally, the shapes of the probability-distribution functions (PDF)were comparable between urban and rural areas.However, the peaks of the PDFs were lower in rural areas than those in urban areas, due to more primary emission in urban areas. In addition, ozone pollution was increasingly severe in urban and rural areas of Lanzhou in recent years, which presented a large threat to human and ecological health (Chenet al.,2014). Ground-level ozone pollution and its precursors (NOxand VOCs) should be strictly controlled over China in the future to protect crops and human health(Wanget al., 2017).
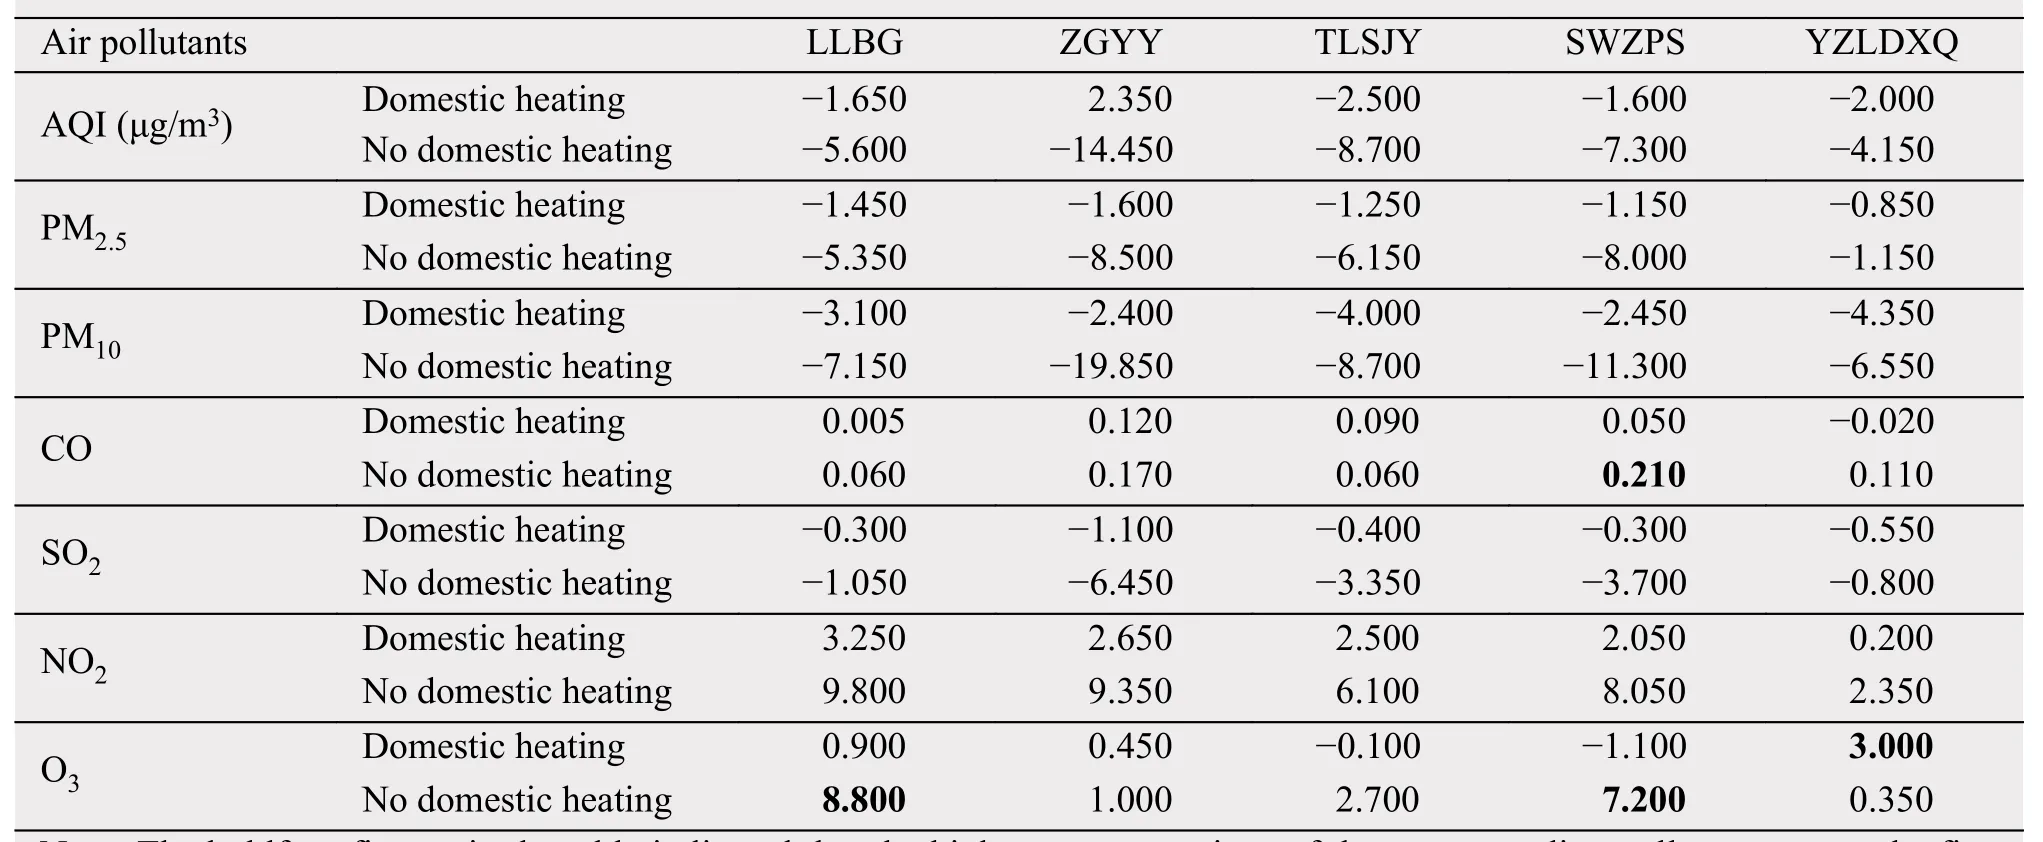
Table 2 Summary of interannual variable rates of annual mean AQI (Air Quality Index) and six criterion air pollutants at the five sites for domestic- and no-domestic-heating seasons, fitted by unary linear regression
To better understand the difference in major air pollutants among the five monitoring sites of Lanzhou (Figure 2), mean annual variations of hourly mean AQI and six criterion air pollutants for the sites from 2013 to 2016 are shown in Figure 6. As can be seen from Figure 6, annual variations of AQI and PM10for all sites were bimodal, with two peaks in spring and winter months due to attacks of dust plumes from upstream Taklimakan and Gobi Deserts in spring and more anthropogenic pollutants such as domestic heating, as well as poor diffusion conditions,in winter. The chemical composition of PM10had a large difference between urban and rural areas due to varying sources. The ions of Ca2+and Mg2+of PM10were much higher in spring than in winter due to the impact of frequent dust plumes in spring, while the ionsandmainly originated from anthropogenic sources had much higher concentrations in winter than in summer. The concentrations of PM2.5,CO, SO2, and NO2had maximum values in the winter months as a result of more emissions, in combination with weak winds and a long-standing temperature inversion (Chenet al., 1994). However, winter ozone concentrations were the lowest of the year, contrasting with the other air pollutants; these results were consistent with those from previous studies (Zhaoet al., 2016; Yinet al., 2017). In addition, concentrations of all pollutants were much lower at the rural background station YZLDXQ than at other sites, with the exception of ozone, while the AQI and particulatematter concentrations (PM2.5and PM10) at LLBG were almost always the highest among the five monitoring sites over the year, due to a number of industries in Xigu District of Lanzhou (Lanzhou Statistical Yearbook, 2016). The highest monthly SO2concentrations variously appeared at LLBG (June to November), TLSJY (January to March, December), and SWZPS (April to May). CO and NO2concentrations for no-domestic-heating seasons (April to October) at TLSJY and SWZPS were much higher than those at the other monitoring sites, as a result of higher population and more motor vehicles in the Chengguan District of urban Lanzhou. The ozone concentrations were comparable among the five sites from January to September.
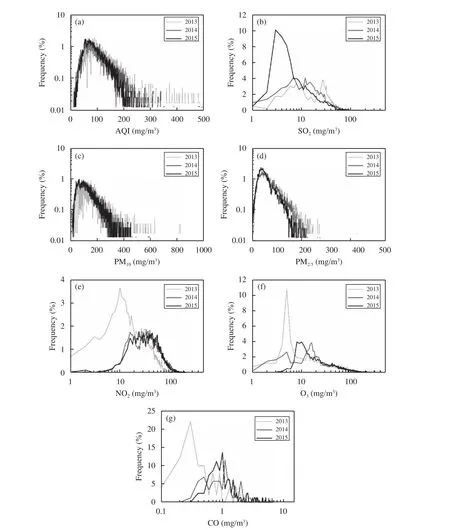
Figure 5 Interannual variations of probability-distribution functions (PDF) of AQI and six air pollutants (PM2.5, PM10, SO2, NO2,CO, and O3) at ZGYY from 2013 to 2015. The PDFs of AQI and the pollutants were not given in this figure due to lack of data in the winter of 2016. The logarithmic scale was used in the vertical axes of AQI, PM2.5, and PM10, and the horizontal axes of CO, SO2, NO2, and O3 to better display the interannual differences of PDFs of AQI and the pollutants in Lanzhou
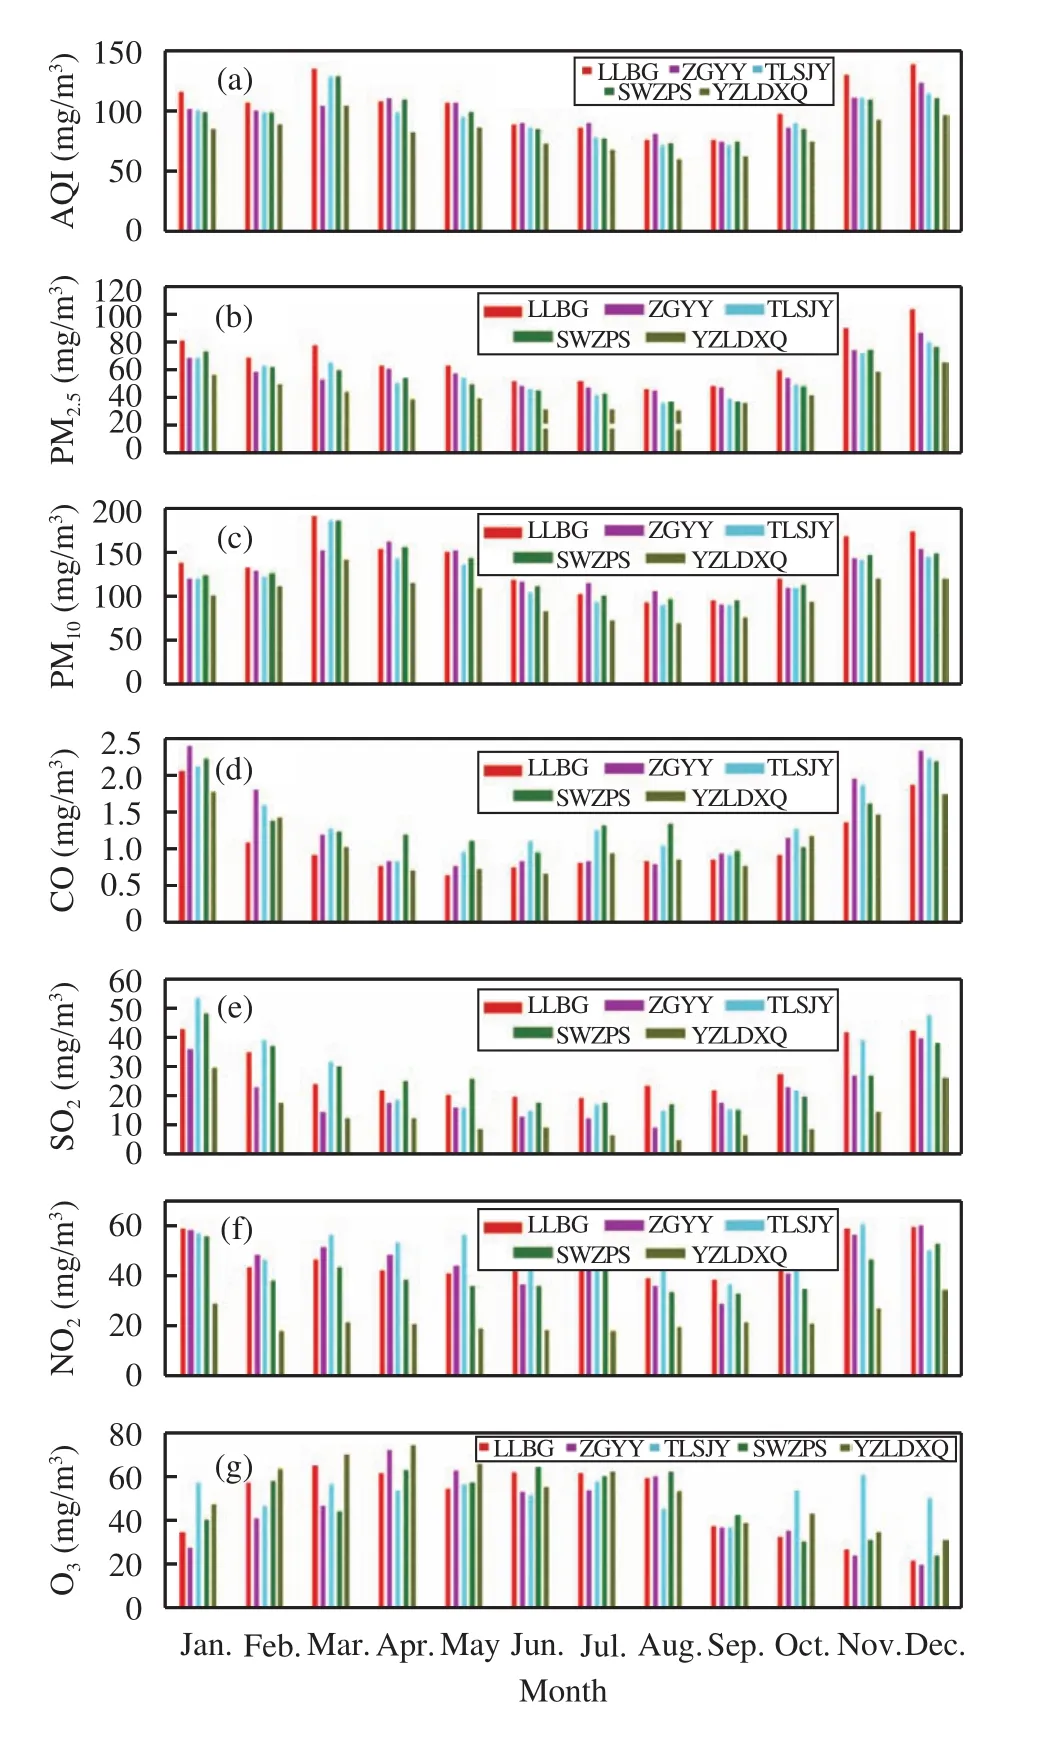
Figure 6 Mean annual variations of monthly averaged AQI(Air Quality Index) and six criterion air pollutants (PM2.5,PM10, SO2, NO2, CO, and O3) for the five monitoring sites (LLBG, ZGYY, TLSJY, ZGYY, and YZLDXQ)of Lanzhou from 2013 to 2016
The interannual differences of mean diurnal variations of AQI and six criterion air pollutants in urban and rural areas of Lanzhou from 2013 to 2015 are shown in Figures 7 (urban areas) and 8 (rural areas),respectively. The differences of corresponding concentrations between 2013 and 2015 are also given in the two figures. For urban areas, the diurnal variation trends of AQI and the pollutants were similar among the three years; but the reductions of AQI, SO2,PM2.5, PM10, and PM2.5—accounting for PM10in daytime (08:00-20:00)—were more significant than those at nighttime (21:00-07:00), especially PM2.5(Figure 7), indicating fine particulate-matter pollution induced by human activities was controlled effectively due to implementing some strict emission-restriction measures in recent years. Additionally, increasing trends of NO2and CO concentrations varied with time of day, with the maximum at morning and evening rush hours, especially for CO, suggesting that motorvehicle pollution is getting worse as the number of vehicles increases rapidly. Ground-level ozone concentrations obviously increased after noon, with the maximum increase of 15 μg/m3at 17:00 from 2013 to 2015, as solar radiation reaching the earth surface obviously increased, caused by decreases of ambient particulate matter, which was beneficial to formation of secondary pollutants (Wanget al., 2017). Unlike the findings in urban areas, in rural areas of Lanzhou,interannual difference of mean diurnal variation trends of the pollutants was large (Figure 8). For example, not only the concentrations of SO2, PM2.5, and PM10obviously decreased from 2013 to 2015, but the peak of diurnal varia tions of the pollutants shifted from 13:00 to 11:00 in rural areas as well. Furthermore, the difference of ozone concentration between 2013 and 2015 had a maximum at 19:00 in rural areas, about two hours ahead of that in urban areas, which may be related to regional transportation of secondary pollutants formed, as YZLDXQ was located to the southeast of the urban areas of Lanzhou (Figure 2).
3.2 Variation of air-quality level and primary air pollutants
Frequencies of air-quality level (AQL) and the primary air pollutant at the five monitoring sites of Lanzhou City and their annual and interannual variation from 2013 to 2016 are showed (only summer is given), respectively, in Figures 9, 10, and 11 to explain the Lanzhou Blue phenomenon better. The number of days with good air quality (Good) at LLBG,mainly concentrated in summer (Figure 10), was obviously less than those at other monitoring sites; extremely and seriously polluted days and the days with PM2.5as the primary air pollutant were much more than at other sites, as LLBG is located in the Xigu District, an industrial area with many heavy industries. The impact is especially noticed in winter, as a result of more local emissions combining with poor diffusion conditions (Figures 9 and 10). The number of days with PM2.5as the primary air pollutant at YZLDXQ was comparable to that of other monitoring sites; but it had 5 days more with O3as the primary air pollutant than the other sites, mainly concentrated in April, May, and June (Figure 10). The days with PM2.5as the primary pollutant mainly appeared in winter (December, January, and February),as more fine particles were emitted from coal combustion or biomass burning for heating (Zhang HFet al., 2012; Zhang JKet al., 2016). However, the days with PM10as the primary pollutant chiefly occurred in the spring months (March to May) in Lanzhou City due to frequent dust plumes' being transported from Taklimakan and Gobi Deserts in its upstream regions(Zhaoet al., 2015).
The number of summer days with good air quality increased from 2013 to 2016 in urban and rural areas of Lanzhou, while the slightly and moderately polluted days considerably reduced in recent years.Additionally, the days with PM2.5as the primary air pollutant obviously decreased in summer, especially at the background station YZLDXQ. However, the days with ozone as the primary pollutant began to appear in Lanzhou in 2015 and 2016, especially in 2016,which may be related to the increase of the concentration of NO2, a main chemical precursor for formation of ozone (Wanget al., 2017). The above analyses indicate that particulate-matter pollution became slight in formerly highly polluted Lanzhou City in recent years, while secondary pollution such as ozone was increasingly severe, especially in rural areas. Some synergetic measures in urban and rural areas of Lanzhou should be taken by the local government to control fine particulate-matter and ozone pollution simultaneously.

Figure 7 Mean diurnal variations of AQI and six criterion air pollutants (PM2.5, PM10, SO2, NO2, CO, and O3) in urban areas of Lanzhou for each year from 2013 to 2015 and their differences (the gray bars) between 2013 and 2015. The averaged values of the specific pollutant in urban areas were calculated using those at the four urban monitoring sites (LLBG, ZGYY, TLSJY, and ZGYY)
4 Conclusions
Air quality improved in Lanzhou in recent years due to implementation of a series of strict emission-control measures, as evidenced in frequent appearances of the phenomenon of Lanzhou Blue. To better under-stand whether the concentration of each air pollutant was decreased significantly under the background of Lanzhou Blue and to provide some suggestions for urban air-quality improvement in the near future, the interannual, annual, and diurnal variations of AQI(Air Quality Index) and six criterion air pollutants(PM2.5, PM10, CO, SO2, NO2, and O3) and variations of air-quality levels and the primary air pollutant at the five state-controlled monitoring sites of Lanzhou from 2013 to 2016 were studied using air-quality data from the China National Environmental Monitoring Centre. Some main conclusions were obtained, as follow.
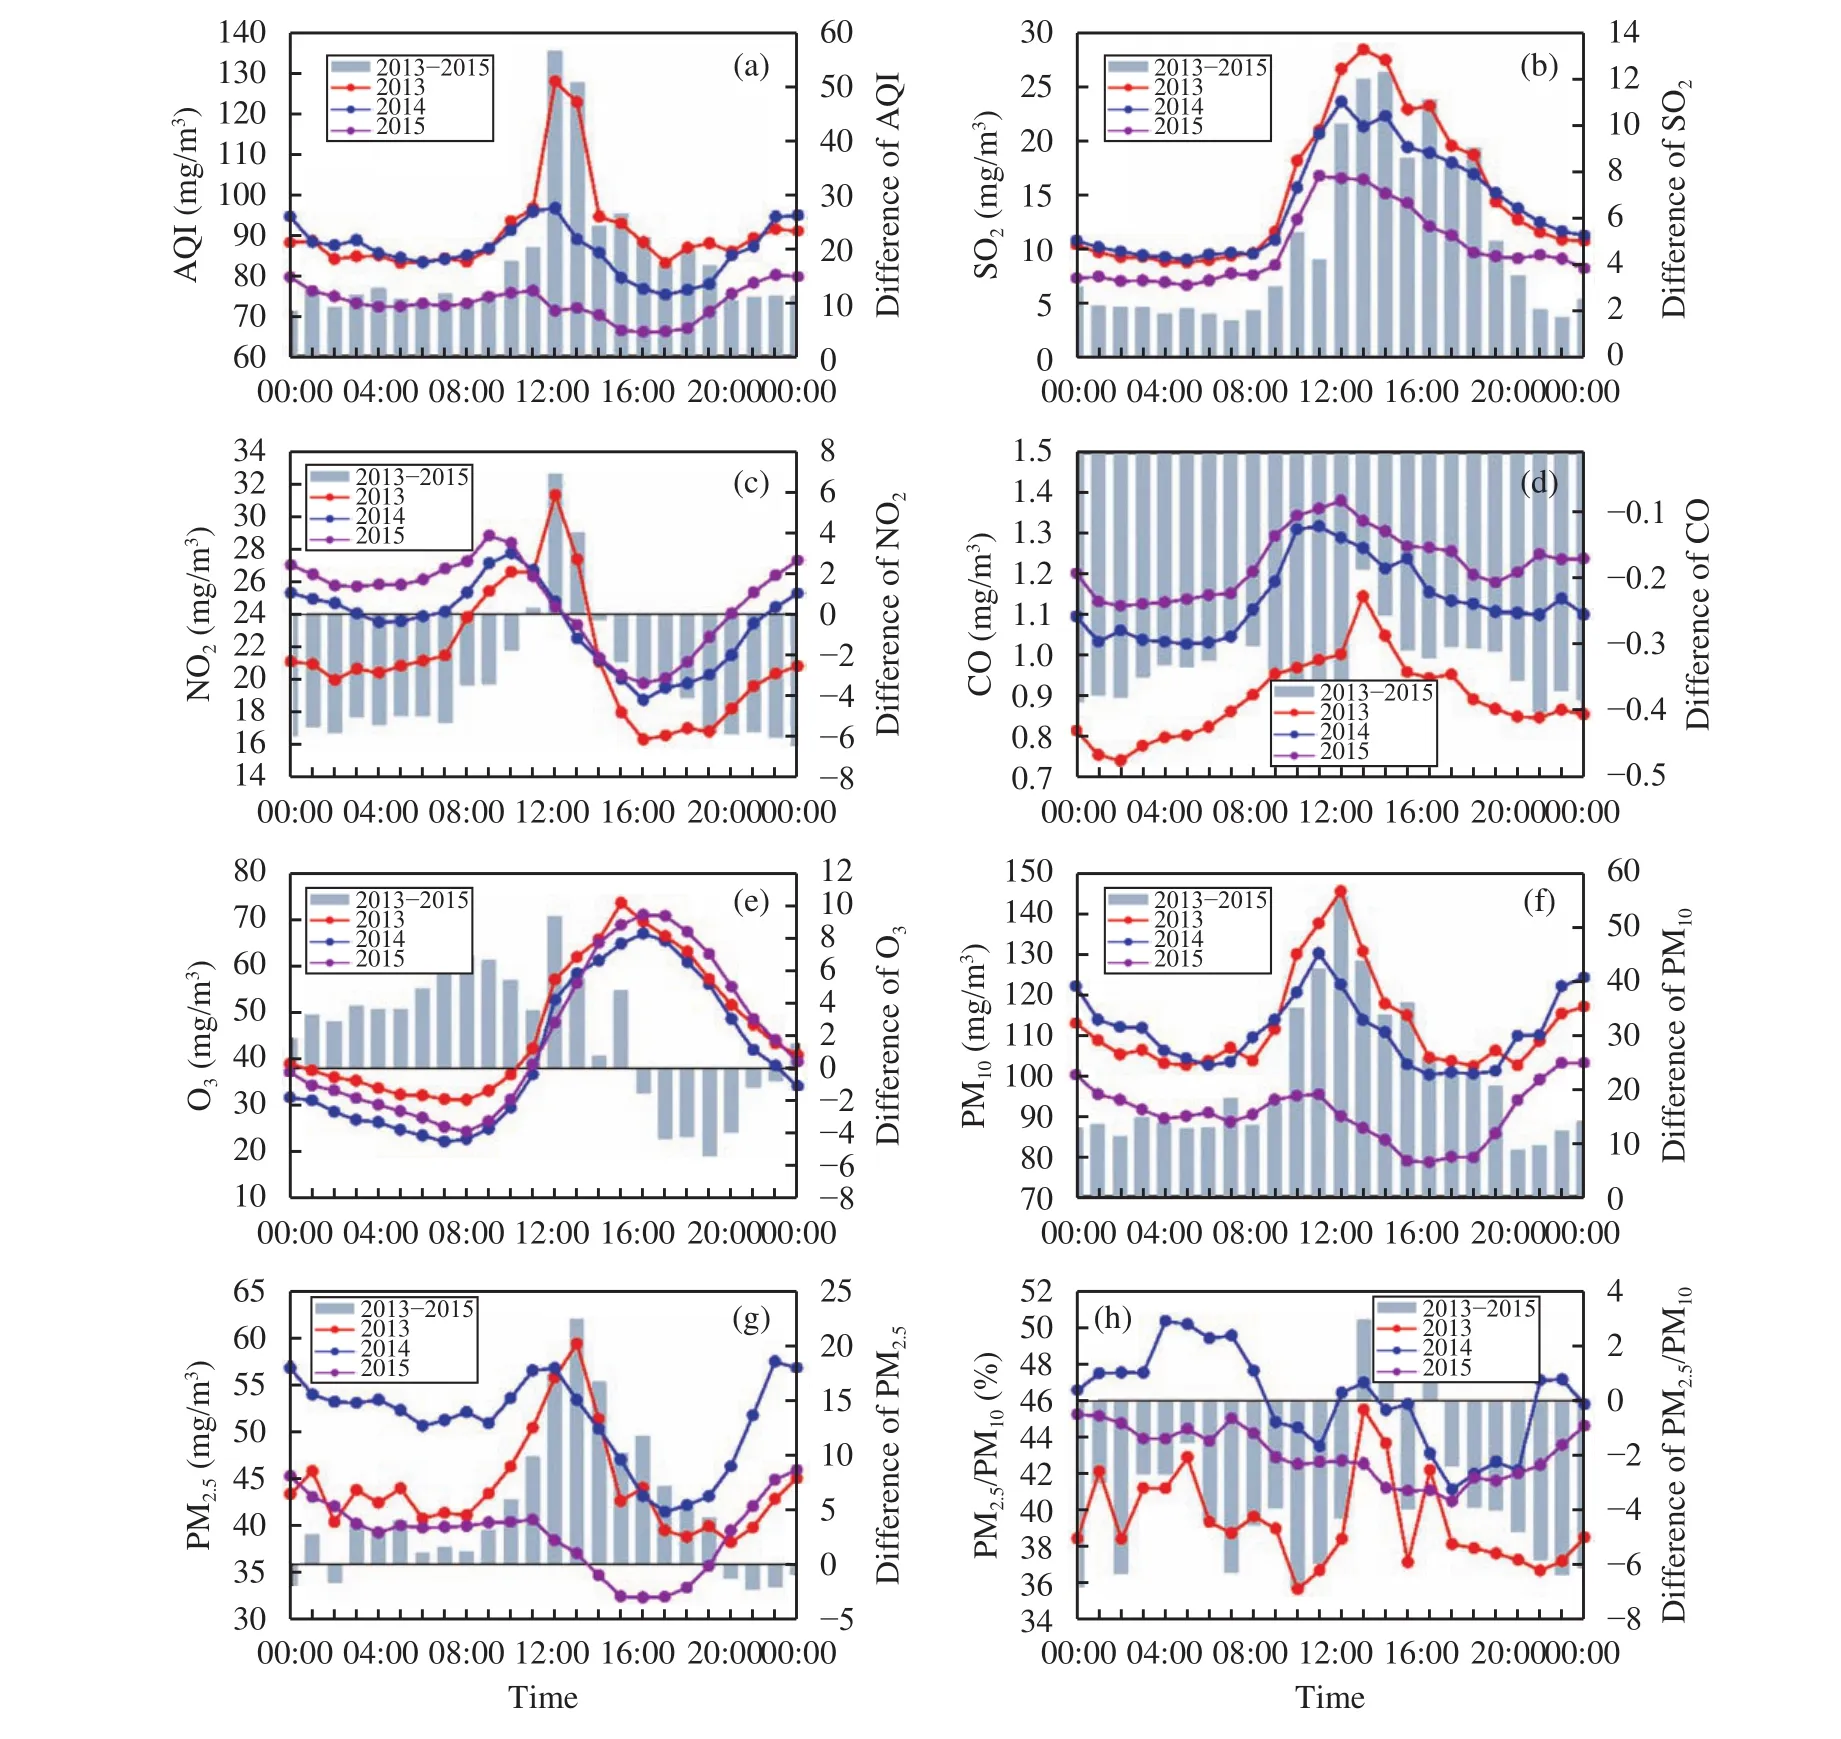
Figure 8 Mean diurnal variations of AQI and six criterion air pollutants (PM2.5, PM10, SO2, NO2, CO, and O3) in rural areas of Lanzhou (YZLDXQ) for each year from 2013 to 2015 and their differences (the gray bars) between 2013 and 2015
The AQI, PM2.5, PM10, and especially SO2gradually decreased from 2013 to 2016 for urban and rural areas of Lanzhou, while CO and NO2concentrations had slightly increasing trends, especially in urban areas. The pollution days with SO2concentration higher than 10 μg/m3obviously decreased from 2013 to 2015 in Lanzhou. The extremely and seriously polluted days and the days with PM2.5as the primary air pollutant at LLBG were much more than at other sites. The variation of the air pollutants in the no-domestic-heating season were more significant than those in the domestic-heating season. The increase of ozone concentration for the domestic-heating season at the YZLDXQ background station was the most significant among the five monitoring sites; while for the no-domestic-heating season, the increase was more obvious at LLBG and SWZPS. The number of the days with O3as the primary air pollutant at YZLDXQ was 5 days more than at the other sites and mainly concentrated in April, May, and June. Ozone pollution was increasingly severe in urban and rural areas of Lanzhou in recent years.

Figure 9 Frequencies of (a) each air-quality level (AQL) and (b) each pollutant acting as primary air pollutant at the five monitoring sites of Lanzhou City from 2013 to 2016. The air quality was divided into six levels according to AQI values: i.e.,good (AQI of 0 to 50), moderate (51 to 100), slightly polluted (101 to 150), moderately polluted (151 to 200),extremely polluted (201 to 300), and seriously polluted (more than 300)
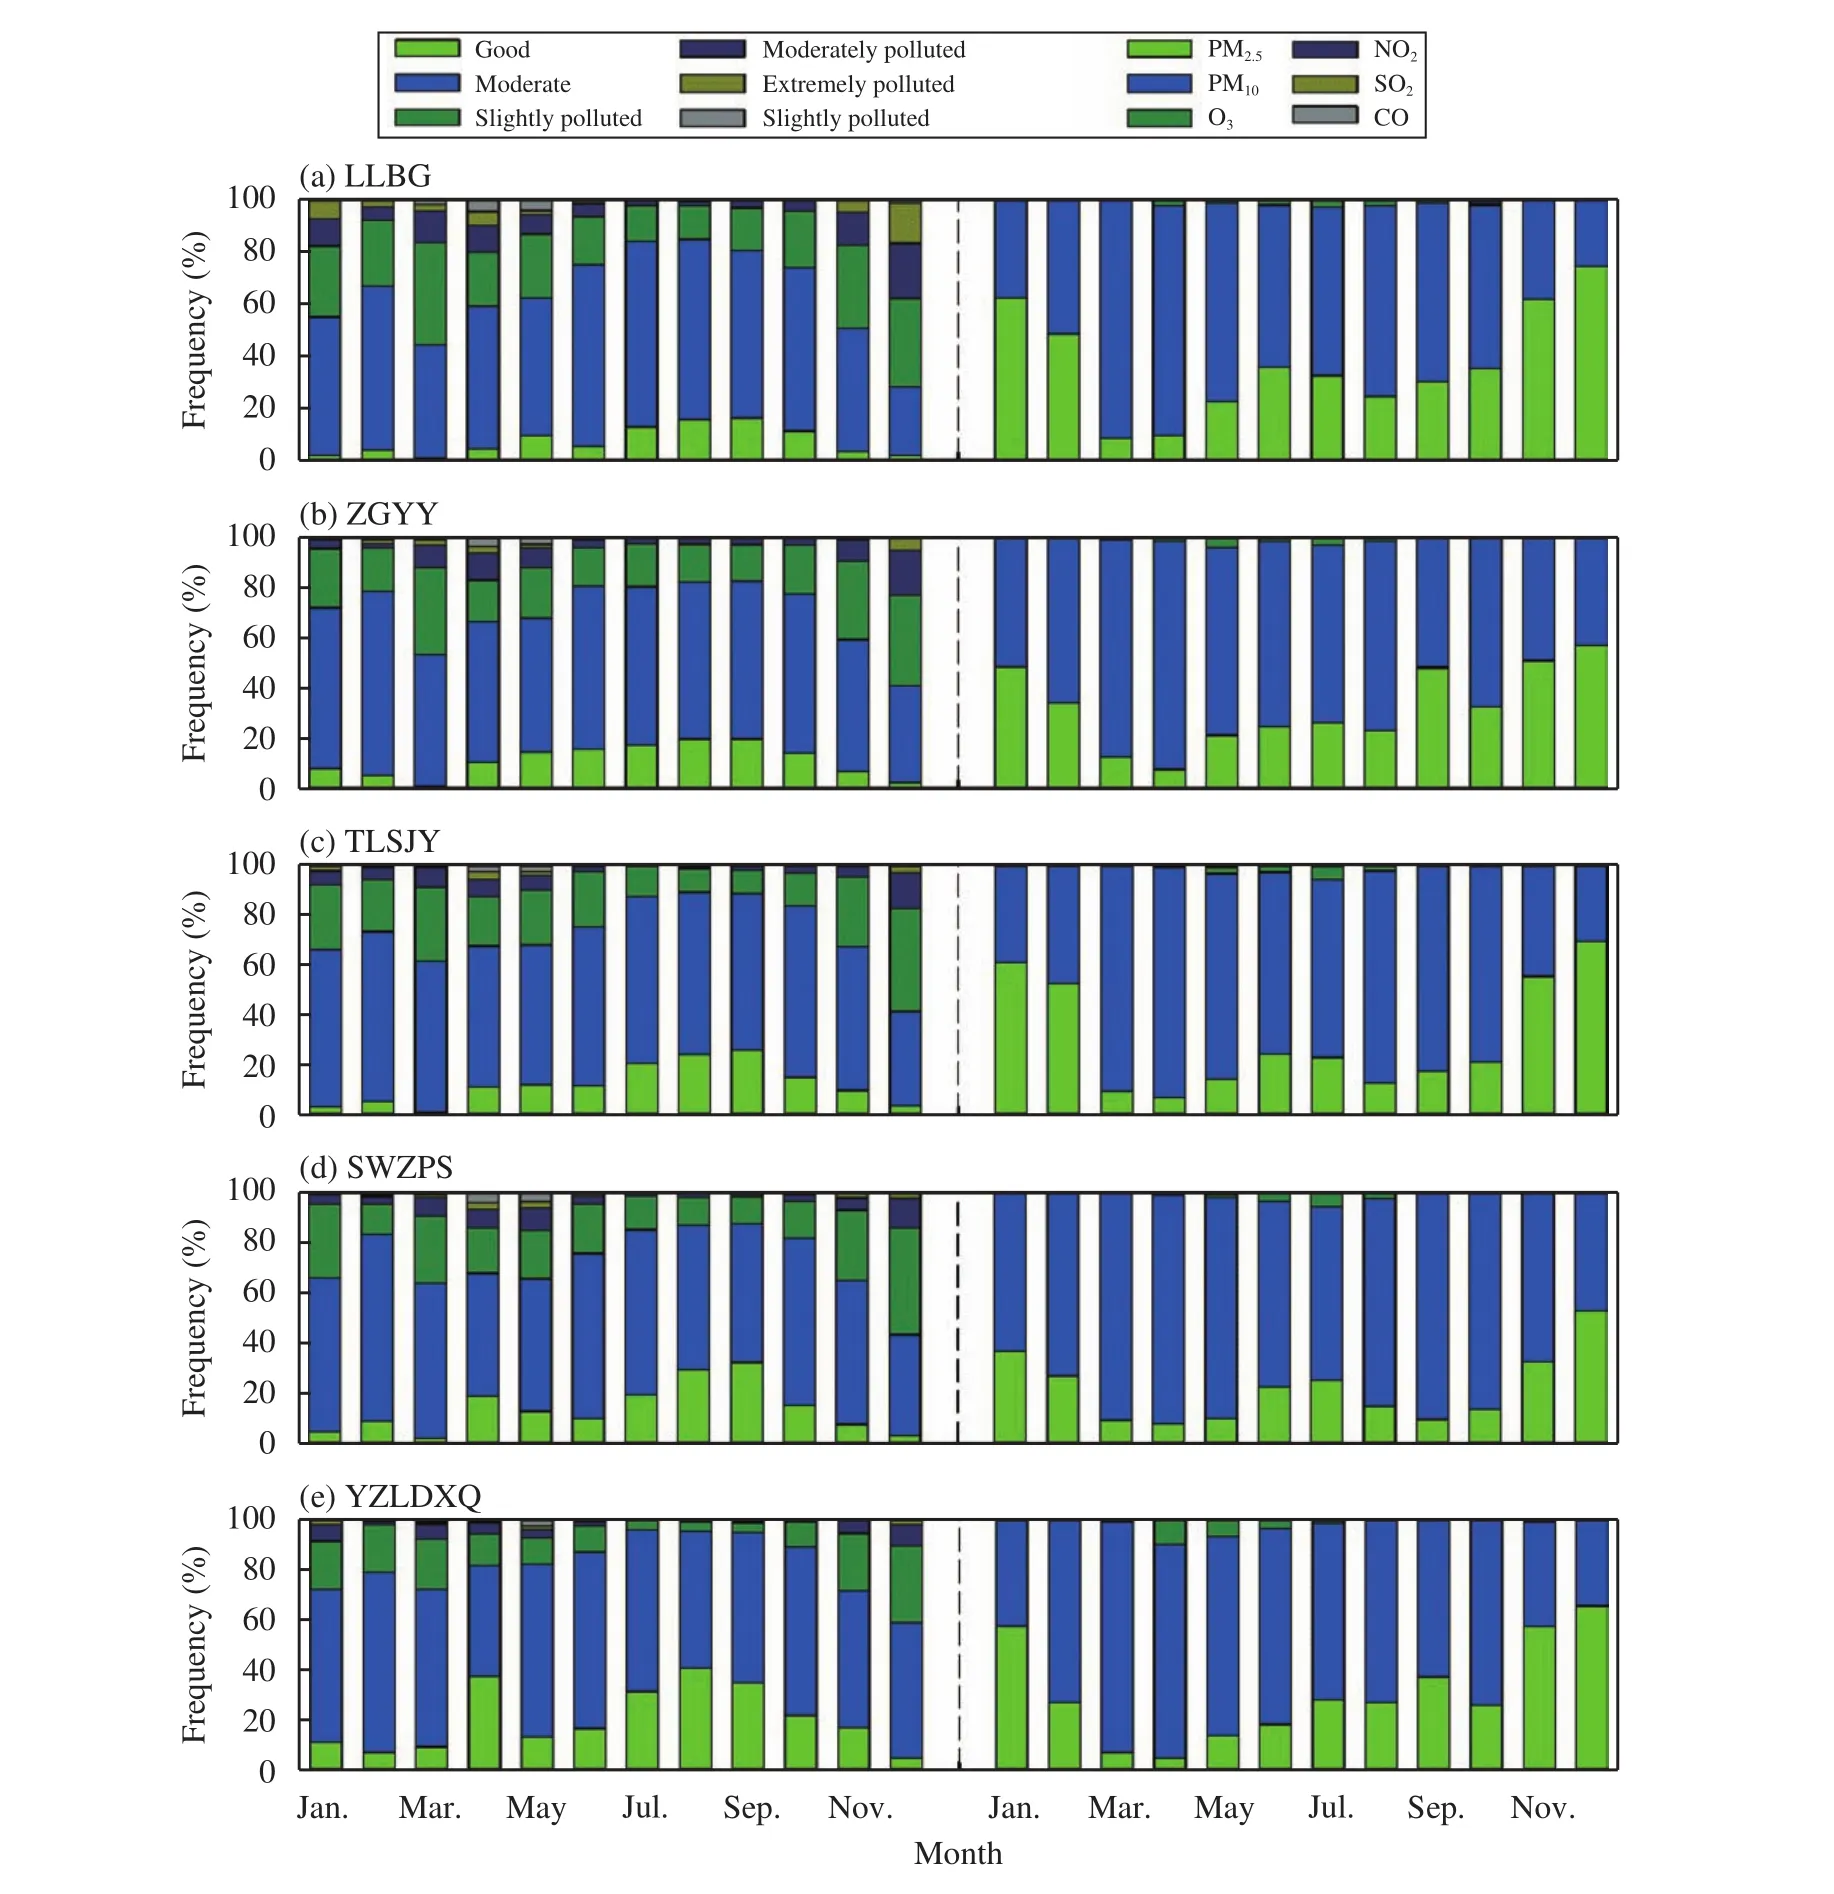
Figure 10 Mean annual variations of frequencies of each air-quality level (AQL, the left column) and each pollutant acting as primary air pollutant (the right column) at the five monitoring sites of Lanzhou City from 2013 to 2016. The air quality was divided into six levels according to AQI values: i.e., good (AQI of 0 to 50), moderate (51 to 100), slightly polluted (101 to 150),moderately polluted (151 to 200), extremely polluted (201 to 300), and seriously polluted (more than 300)
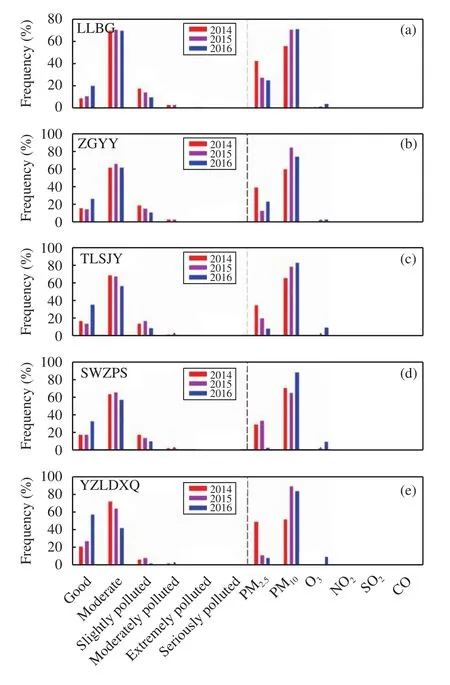
Figure 11 Mean interannual variations of frequencies of each air-quality level (AQL, the left column) and each pollutant acting as the primary air pollutant (the right column) at the five monitoring sites of Lanzhou City in summer from 2013 to 2016. The air quality was divided into six levels according to AQI values: i.e., good (AQI of 0 to 50), moderate (51 to 100), slightly polluted (101 to 150), moderately polluted (151 to 200), extremely polluted (201 to 300), and seriously polluted (more than 300)
The production of some industries has been strictly controlled since 2013 in urban Lanzhou, but the vehicle-exhaust pollution was increasingly serious with the rapid increase in the number of motor vehicles. In recent years, particulate-matter pollution became slight in formerly highly polluted Lanzhou City,while secondary pollution such as ozone became increasingly severe, especially in rural areas. Some synergetic measures in urban and rural areas of Lanzhou should be taken by the local government in the near future to control fine particulate matter (PM2.5) and ozone pollution simultaneously. Throughout China,ground-level ozone pollution and its precursors (NOxand VOCs) should be strictly controlled in the future to protect crops and human health.
The study is supported by Natural Science Foundation of China (41605103), Youth Innovation Promotion Association, CAS (2017462), CAS "Light of West China" Program, Opening Project of Shanghai Key Laboratory of Atmospheric Particle Pollution and Prevention (LAP3) (FDLAP16005), and the Excellent Post-Doctoral Program (2016LH0020). The authors also would like to thank the Qingyue Opening Environmental Data Center (QOEDC) for providing air-quality data used in this study.
Batterman S, Xu LZ, Chen F,et al., 2016. Characteristics of PM2.5concentrations across Beijing during 2013-2015. Atmospheric Environment, 145: 104-114. DOI: 10.1016/j.atmosenv.2016.08.060.
Chan CK, Yao XH, 2008. Air pollution in mega cities in China. Atmospheric Environment, 42(1): 1-42. DOI: 10.1016/j.atmosenv.2007.09.003.
Chen C, Sun YL, Xu WQ,et al., 2015. Characteristics and sources of submicron aerosols above the urban canopy (260 m) in Beijing,China, during the 2014 APEC summit. Atmospheric Chemistry and Physics, 15(22): 12879-12895.
Chen CH, Wang HX, Huang JG,et al., 1994. Radiative effects of urban aerosols and their influence on mixed layer development.Chinese Science Bulletin, 39(1): 56-61. DOI: 10.1360/sb 1994-39-1-56.
Chen J, Qiu SS, Shang J,et al., 2014. Impact of relative humidity and water soluble constituents of PM2.5on visibility impairment in Beijing, China. Aerosol and Air Quality Research, 14(1): 260-268.DOI: 10.4209/aaqr.2012.12.0360.
Chen LH, Yu Y, Chen JB,et al., 2010. Characteristics of main air pollution in Lanzhou during 2001-2007. Plateau Meteorology, 29(6):1627-1633.
Chen ZY, Liu C, Liu WQ,et al., 2017. A synchronous observation of enhanced aerosol and NO2over Beijing, China, in winter 2015.Science of the Total Environment, 575: 429-436. DOI:10.1016/j.scitotenv.2016.09.189.
Chu PC, Chen YC, Lu SH, 2007. Afforestation for reduction of NOXconcentration in Lanzhou China. Environment International, 34(5):688-697. DOI: 10.1016/j.envint.2007.12.014.
Chu PC, Chen YC, Lu SH,et al., 2008. Particulate air pollution in Lanzhou China. Environment International, 34(5): 698-713. DOI:10.1016/j.envint.2007.12.013.
Deng SH, Zhang J, Shen F,et al., 2014. The relationship between industry structure, household-number and energy consumption in China. Energy Sources, Part B: Economics, Planning, and Policy,9(4): 325-333. DOI: 10.1080/15567249.2010.533330.
Fu X, Wang SX, Chang X,et al., 2016. Modeling analysis of secondary inorganic aerosols over China: pollution characteristics, and meteorological and dust impacts. Scientific Reports, 6: 35992.DOI: 10.1038/srep35992.
Gao H, Zhou L, Ma MQ,et al., 2004. Composition and source of unknown organic pollutants in atmospheric particulates of the Xigu District, Lanzhou, People′s Republic of China. Bulletin of Environmental Contamination and Toxicology, 72(5): 923-930. DOI:10.1007/s00128-004-0332-1.
Guo S, Hu M, Zamora ML,et al., 2014. Elucidating severe urban haze formation in China. Proceedings of the National Academy of Sci-ences of the United States of America, 111(49): 17373-17378.DOI: 10.1073/pnas.1419604111.
Hu YQ, Zhang Q, 1999. Atmosphere pollution mechanism along with prevention and cure countermeasure of the Lanzhou hollow basin.China Environmental Science, 19(2): 119-122. DOI: 10.3321/j.issn:1000-6923.1999.02.006.
Huang K, Zhang XY, Lin YF, 2015. The "APEC Blue" phenomenon:Regional emission control effects observed from space. Atmospheric Research, 164-165: 65-75. DOI: 10.1016/j.atmosres.2015.04.018.
Li SS, Ma ZW, Xiong XZ,et al., 2016. Satellite and ground observations of severe air pollution episodes in the winter of 2013 in Beijing, China. Aerosol and Air Quality Research, 16(4): 977-989.DOI: 10.4209/aaqr.2015.01.0057.
Liu HR, Liu C, Xie ZQ,et al., 2016. A paradox for air pollution controlling in China revealed by "APEC Blue" and "Parade Blue". Scientific Reports, 6: 34408. DOI: 10.1038/srep34408.
Long X, Tie XX, Cao JJ,et al., 2016. Impact of crop field burning and mountains on heavy haze in the North China Plain: a case study.Atmospheric Chemistry and Physics, 16(15): 9675-9691. DOI:10.5194/acp-16-9675-2016.
NRC, 1991. Rethinking the Ozone Problem in Urban and Regional Air Pollution. Washington, DC: The National Academies Press.
Savij?rvi H, Jin LY, 2001. Local winds in a valley city. Boundary-Layer Meteorology, 100(2): 301-319. DOI: 10.1023/A:1019215031007.
Sun YL, Wang ZF, Wild O,et al., 2016. "APEC Blue": secondary aerosol reductions from emission controls in Beijing. Scientific Reports, 6: 20668. DOI: 10.1038/srep20668.
Tie XX, Huang RJ, Cao JJ,et al., 2017. Severe pollution in China amplified by atmospheric moisture. Scientific Reports, 7: 15760.DOI: 10.1038/s41598-017-15909-1..
Van der Zee SC, Fischer PH, Hoek G, 2016. Air pollution in perspective: health risks of air pollution expressed in equivalent numbers of passively smoked cigarettes. Environmental Research, 148:475-483. DOI: 10.1016/j.envres.2016.04.001.
Wang GH, Zhang RY, Gomez ME,et al., 2016. Persistent sulfate formation from London Fog to Chinese haze. Proceedings of the National Academy of Sciences of the United States of America,113(48): 13630-13635. DOI: 10.1073/pnas.1616540113.
Wang P, Dai XG, 2016. "APEC Blue" association with emission control and meteorological conditions detected by multi-scale statistics. Atmospheric Research, 178-179: 497-505. DOI: 10.1016/j.atmosres.2016.05.001.
Wang SG, Zhang L, Chen CH,et al., 1999. Retrospect and prospect for the studies of atmospheric environment in the Lanzhou area. Journal of Lanzhou University (Natural Sciences), 35(3): 189-201. DOI:10.13885/j.issn.0455-2059.1999.03.022.
Wang T, Xue LK, Brimblecombe P,et al., 2017. Ozone pollution in China: A review of concentrations, meteorological influences,chemical precursors, and effects. Science of the Total Environment,575: 1582-1596. DOI: 10.1016/j.scitotenv.2016.10.081.
Wang YX, Shen LL, Wu SL,et al., 2013. Sensitivity of surface ozone over China to 2000-2050 global changes of climate and emissions.Atmospheric Environment, 75: 374-382. DOI: 10.1016/j.atmosenv.2013.04.045.
Yan SJ, Cao H, Chen Y,et al., 2016. Spatial and temporal characteristics of air quality and air pollutants in 2013 in Beijing. Environmental Science and Pollution Research, 23(14): 13996-14007.DOI: 10.1007/s11356-016-6518-3.
Yang Y, Liao H, Lou SJ, 2016. Increase in winter haze over eastern China in recent decades: Roles of variations in meteorological parameters and anthropogenic emissions. Journal of Geophysical Research: Atmospheres, 121(21): 13050-13065. DOI:10.1002/2016JD025136.
Yin DY, Zhao SP, Qu JJ, 2017. Spatial and seasonal variations of gaseous and particulate matter pollutants in 31 provincial capital cities, China. Air Quality, Atmospheric & Health, 10(3): 359-370.DOI: 10.1007/s11869-016-0432-1..
Yin ZC, Wang HJ, 2016. Seasonal prediction of winter haze days in the north central North China Plain. Atmospheric Chemistry and Physics, 16(23): 14843-14852. DOI: 10.5194/acp-16-14843-2016.
Yu Y, He JJ, Zhao SP,et al., 2016. Numerical simulation of the impact of reforestation on winter meteorology and environment in a semi-arid urban valley, Northwestern China. Science of the Total Environment, 569-570: 404-415. DOI: 10.1016/j.scitotenv.2016.06.143.
Zhang HF, Wang SX, Hao JM,et al., 2012. Chemical and size characterization of particles emitted from the burning of coal and wood in rural households in Guizhou, China. Atmospheric Environment,51: 94-99. DOI: 10.1016/j.atmosenv.2012.01.042.
Zhang J, Zhang LY, Du M,et al., 2016. Indentifying the major air pollutants based on factor and cluster analysis, a case study in 74 Chinese cities. Atmospheric Environment, 144: 37-46. DOI:10.1016/j.atmosenv.2016.08.066.
Zhang JK, Cheng MT, Ji DS,et al., 2016. Characterization of submicron particles during biomass burning and coal combustion periods in Beijing, China. Science of the Total Environment, 562:812-821. DOI: 10.1016/j.scitotenv.2016.04.015.
Zhang L, Chen CH, Li SX,et al., 2000. Air pollution and potential control schemes in Lanzhou. Research of Environmental Sciences,13(4): 18-21. DOI: 10.3321/j.issn:1001-6929.2000.04.005.
Zhang L, Chen CH, Murlis J, 2001. Study on winter air pollution control in Lanzhou, China. Water, Air, and Soil Pollution, 127(1-4):351-372. DOI: 10.1023/A:1005257722202.
Zhang Q, Hu YQ, 1992. A research about turbulent transport and intensity over complex terrain of Lanzhou. Plateau Meteorology,11(2): 126-132.
Zhang Q, 2001. The influence of terrain and inversion layer on pollutant transfer over Lanzhou City. China Environmental Science,21(3): 230-234. DOI: 10.3321/j.issn:1000-6923.2001.03.009.
Zhang Q, Li HY, 2011. A study of the relationship between air pollutants and inversion in the ABL over the city of Lanzhou. Advances in Atmospheric Sciences, 28(4): 879-886. DOI: 10.1007/s 00376-010-0079-z.
Zhang QH, Zhang JP, Xue HW, 2010. The challenge of improving visibility in Beijing. Atmospheric Chemistry and Physics, 10(16):7821-7827.
Zhang XW, Yang LS, Li YH,et al., 2012. Impacts of lead/zinc mining and smelting on the environment and human health in China. Environmental Monitoring and Assessment, 184(4): 2261-2273. DOI:10.1007/s10661-011-2115-6.
Zhao SP, Yu Y, Xia DS,et al., 2015. Urban particle size distributions during two contrasting dust events originating from Taklimakan and Gobi Deserts. Environmental Pollution, 207: 107-122. DOI:10.1016/j.envpol.2015.08.052.
Zhao SP, Yu Y, Yin DY,et al., 2016. Annual and diurnal variations of gaseous and particulate pollutants in 31 provincial capital cities based onin situair quality monitoring data from China National Environmental Monitoring Center. Environment International, 86:92-106. DOI: 10.1016/j.envint.2015.11.003.
Zheng F, Zhang L, Zhu J, 2006. Responses of urban atmospheric boundary layer to aerosol radiative effect over complex terrains in winter. Chinese Journal of Atmospheric Sciences, 30(1): 171-179.DOI: 10.3878/j.issn.1006-9895.2006.01.15.
 Sciences in Cold and Arid Regions2018年1期
- Sciences in Cold and Arid Regions的其它文章
- An improvement of soil temperature simulations on the Tibetan Plateau
- Effects of freeze-thaw cycles on soil N2O concentration and flux in the permafrost regions of the Qinghai-Tibetan Plateau
- Comparative study of probable maximum precipitation and isohyetal maps for mountainous regions, Pakistan
- Applicability of an ultra-long-range terrestrial laser scanner to monitor the mass balance of Muz Taw Glacier,Sawir Mountains, China
- High-resolution mass spectrometric characterization of dissolved organic matter from warm and cold periods in the NEEM ice core
- Precipitation isotopes in the Tianshan Mountains as a key to water cycle in arid central Asia