
Century-scale high-resolution black carbon records in sediment cores from the South Yellow Sea, China*
2018-04-02 03:04:04XUXiaoming徐小明HONGYuehui洪躍輝ZHOUQianzhi周芊至LIUJinzhong劉金鐘YUANLirong袁麗蓉WANGJianghai王江海
XU Xiaoming (徐小明) , HONG Yuehui (洪躍輝) , ZHOU Qianzhi (周芊至) ,LIU Jinzhong (劉金鐘) , YUAN Lirong (袁麗蓉) ,, WANG Jianghai (王江海) ,
1 Guangdong Provincial Key Laboratory of Marine Resources and Coastal Engineering / South China Sea Bioresource Exploitation and Utilization Collaborative Innovation Center, School of Marine Sciences, Sun Yat-Sen University, Guangzhou 510006, China
2 Guangzhou Institute of Geochemistry, Chinese Academy of Sciences, Guangzhou 510640, China
1 INTRODUCTION
Black carbon (BC) is a chemically heterogeneous class of carbon compounds produced during the incomplete combustion of biomass and fossil fuels(Masiello and Druff el, 1998), as well as from ancient graphitic carbon derived from weathered metamorphic rocks (Dickens et al., 2004). BC is broadly distributed in diverse environmental media such as the atmosphere, soils, sediments, water, and ice, and it might well be preserved in soils and sediments for long durations (Dickens et al., 2004; Elmquist et al.,2007; McConnell et al., 2007; Flores-Cervantes et al.,2009; Agarwal and Bucheli, 2011; Yang et al., 2015).BC in various environments has caused increasing concern within the scientific community in recent years for a number of reasons. For example, BC is the second most important greenhouse substance with the sunlight-absorbing ability in aerosols; it provides an excellent record of fire history in sediments, ice cores,loess, and soils; BC is an important marker of the biogeochemical cycle of carbon and global changes;and it is a good absorbent for diverse toxic organic pollutants in soils and sediments (Smith, 2005;Elmquist et al., 2007; Han et al., 2011; Ni et al., 2014).Additionally, BC in soils and sediments plays an important role in carbon sequestration and it might represent a significant sink in the global carbon cycle(Crombie et al., 2015; Wang et al., 2015).
There is consensus that BC, as an important constituent of total organic carbon (TOC) in soils/sediments, might generally be employed as a robust indicator of environmental change because of its chemically and biologically inert characteristics (Jia et al., 2003; Elmquist et al., 2007; Sun et al., 2008;Han et al., 2011; Liu et al., 2011). For example, BC has already been used to study the history of regional terrestrial biomass burning, photosynthetic pathway evolution in terrestrial ecosystems, terrestrial environmental changes, shifts in the historical energy structure, global carbon cycling, and human activities(Jia et al., 2003; Elmquist et al., 2007; Wang and Li,2007; Marlon et al., 2008; Sun et al., 2008; Lin et al.,2012; Wang et al., 2013). However, previous studies have focused primarily on BC records in terrestrial environments (Elmquist et al., 2007; Agarwal and Bucheli, 2011; Han et al., 2011; Wang et al., 2013;Crombie et al., 2015). In the most recent 20 years,records of marine-deposited BC have attracted increasing interest because of their excellent continuity and stability relative to terrestrial BC records (Verardo and Ruddiman, 1996; Masiello and Druff el, 1998; Middelburg et al., 1999; Jia et al.,2003; Dickens et al., 2004; Sun et al., 2008; Flores-Cervantes et al., 2009; Liu et al., 2011; Masiello and Louchouarn, 2013; Coppola et al., 2014). For example, Jia et al. (2003) provided a 30-Ma sedimentary record of BC from the northern South China Sea, revealing the photosynthetic pathway evolution of terrestrial ecosystems in the late Cenozoic. Sun et al. (2008) presented a sedimentary record of BC in the Pearl River estuary and adjacent northern South China Sea. Lohmann et al. (2009)suggested that attempts to construct a global BC mass balance should include estimates of atmospheric deposition based on BC data from deep-sea sediments.
The Yellow Sea (YS) is of specific interest with regard to anthropogenic eff ects on the carbon cycle because it is located downwind of large population centers in China. The rapidly increasing emissions of BC and other air pollutants present a serious environmental problem for the regions of the YS and Bohai Sea. The YS is an epicontinental shelf surrounded by mainland China and the Korean Peninsula. The circumambient land of the YS and large rivers in China, including the Yellow and Yangtze rivers, supply large amounts of terrestrial material to the YS (Fig.1) (Xin et al., 2015).Consequently, several areas of fine-grained sediments have formed on the YS shelf under the combined eff ects of tides, waves/storms, and currents (Li et al.,2014). Furthermore, the important hydrological phenomenon of the Yellow Sea Cold Water Mass(YSCWM) has received considerable attention from oceanographers (Hu, 1984; Qu and Hu, 1993; Pang and Hu, 2002). Recent studies have demonstrated that the fine-grained depositional areas in the YS constitute important sinks of TOC and anthropogenic organic pollutants, and that they might play important roles in the transport, burial, and fate of TOC (Hu et al., 2013).BC represents an important constituent of TOC in the sediments of the Bohai Sea, East China Sea (ECS)shelf, and YS, and its distribution, concentration,14C age, and relation to persistent organic pollutants(mainly in surface sediments) have been studied widely (Wang and Li, 2007; Kang et al., 2009; Jiang et al., 2010; Hung et al., 2011; Wang et al., 2011;Huang et al., 2012; Lin et al., 2012; Zhang et al.,2013; Fang et al., 2014; Cui et al., 2015). Although some researches on the sedimentary records of BC and/or polycyclic aromatic hydrocarbons in the Bohai Sea and northern YS has been reported, to the best of our knowledge, no century-scale high-resolution records of BC have been compiled for the fine-grained sediment cores in the YSCWM. In this paper, the continuous century-scale high-resolution BC records in sediment cores H43 and H44 from the YSCWM area are presented to constrain the temporal changes and cycling of BC. Then, the origins of exceptional BC sequences with three distinct BC peaks are discussed. The results are considered to deepen the understanding of the source-sink BC history in the YS.
2 MATERIAL AND METHOD
2.1 Study area and sample collection
The YS is located within the region 31°40′–39°50′ N, 119°10′–126°50′ E between mainland China and the Korean Peninsula. It forms a semi-enclosed flat basin to the north and a wide continental shelf to the south, covering an area of 380 000 km2with a central water depth of 50- 80 m (Fig.1). The YS is connected to the Bohai Sea via the Bohai Strait to the north and to the ECS to the south. It can be considered as divided into the North Yellow Sea and South Yellow Sea (SYS) by the Shandong Peninsula (Li et al., 2015).
The typical circulation pattern of the SYS in winter is characterized by the northward-flowing Yellow Sea Warm Current (YSWC) along the western side of the Yellow Sea Trough and southward-flowing currents along the coasts of China and Korea, including the Yellow Sea Coastal Current (YSCC), Korean Coastal Current (KCC), and Liaodong Coastal Current(LDCC) (Fig.1). The YSWC transports the warm and salty water of the open ocean into the YS in winter(Fig.1). The prominent oceanographic YSCWM is a winter water mass that appears in the northern and southern regions of the YS (Tang et al., 2006), where the central bottom water might include remnant winter water with low temperature and high salinity(Hu, 1984; Yao et al., 2012; Xin et al., 2015). The YSWC almost disappears in summer, partially because of the presence of the YSCWM in the central SYS (Zhang et al., 2008; Moon et al., 2009; Oh et al.,2013). Under these combined hydrodynamic systems,several areas of fine-grained sediments have formed on the YS shelf (Li et al., 2014). Of these sedimentary areas, the Central Yellow Sea Mud (CYSM) has attracted greatest attention because of its sediment provenance and deposition processes (Xin et al.,2015).

Fig.1 Map illustrating the location of the Yellow Sea-East China Sea area, modified according to Yuan et al. (2008) and Li et al. (2014)
In this study, two sediment cores (50-cm length× 10-cm diameter) were collected from the southwestern CYSM in May 2012 using a box corer. The sampling locations of cores H43 and H44 are 35° 29.382′ N,122° 58.371′ E and 35° 30.017′ N, 22° 39.739′ E,respectively (Fig.1). The sediment cores were sealed in clean PVC pipes and frozen immediately in situ.Then, the cores were delivered to a laboratory and stored at -20° C until further analysis.
2.2 Dating of sediment core H44
In light of the published210Pb dating and sedimentation rate data from the study area (Li et al.,2002), 12 sediment samples from core H44 were sectioned in a cold room (4° C) at average depths of 0.5, 2.0, 4.0, 6.0, 10.0, 14.0, 18.0, 22.0, 26.0, 30.0,34.0, and 37.8 cm with the nearly identical error of 0.3 cm (Table S1). All samples were freeze-dried for 48 h and then ground into powders with the grain size of <200 mesh. The210Pb activity in each sample was detected at the Guangzhou Institute of Geochemistry,Chinese Academy of Sciences, via analysis of the α radioactivity of its decay product210Po, with the presumption that the two are in equilibrium. Polonium isotopes were extracted, purified, and self-plated onto silver disks containing 0.5 mol/L analytical grade HCl (the same as below) at 75- 80° C for 2 h, using209Po as the yield monitor and tracer in the quantification. Counting was performed using computerized multichannel α spectrometry with Au-Si surface barrier detectors and an average error of<3%. Supported210Po was gained by indirect measurement of the α activity of the supporting parent226Ra, which was carried by coprecipitated BaSO4.The average sedimentation rate of core H44 was determined using a constant initial210Pb concentration model (McCall et al., 1984).
2.3 Grain size analysis
Grain sizes of the sediments were analyzed using a Mastersizer 2000 laser particle analyzer (Malvern,Worcestershire, UK) with a measurement range of 0.02–2 000.00 μm, size resolution of 0.01 μm, and measurement error of <2%. Before measuring the grain sizes, the samples were homogenized by ultrasonic vibration, oxidized using 10% H2O2to remove organic matters, and dispersed in a 0.05%solution of sodium hexametaphosphate to separate discrete particles. The sorting coeffi cient ( σ),skewness ( Sk), and kurtosis ( Kg) were calculated as follows (Folk and Ward, 1957):

where μ5, μ16, μ25, μ50, μ75, μ84, and μ95are the particle sizes (in μ) at diff erent frequencies. Grain sizes were classified into three fractions: sand (>63 μ m), silt (4–63 μ m), and mud (<4 μ m).
2.4 Detection of TOC
Approximately 100 mg of each dry and thoroughly ground sediment sample was transferred into a disposable ceramic crucible with the microporecontrolled ability (LECO, Michigan, USA). Then, the crucibles were labeled and placed accordingly into a self-made Teflon?holder, which was held in a whiteenameled salver. Three mol/L HCl was added into the salver and each crucible, and the HCl level inside the crucible was kept the same as that outside. After 12 h,the crucibles, holder, and salver were heated in a thermostatic water bath at 80° C for 1 h. After complete exclusion of the HCl from the crucibles, ultrapure water was added to the crucibles in sextuplicate to remove the resultants of inorganic carbon and residual HCl. Then, the crucibles were freeze-dried for 48 h.The TOC contents were measured quantitatively with a CS230 C/S analyzer (LECO, Michigan, USA). The limit of quantification (defined as the mean blank value plus 10 times the standard deviation) in this study was (2.3± 0.3) μ g/g.
2.5 Quantification of BC
BC in the sediments was analyzed using an improved chemothermal oxidation (WXY) method(Gustafsson et al., 2001; Xu et al., 2018). Briefly,approximately 150 mg of each dry and fully ground sediment sample was transferred to a disposable ceramic crucible with the micropore-controlled ability for removal of carbonates. The acidification procedure used was the same as for TOC detection. After acidification, the crucibles were blow dried at 60° C and held in an SG-GL1100 tube furnace (made by Shanghai Institute of Optics and Fine Mechanics,Chinese Academy of Sciences, Shanghai, China) at 375° C for 24 h under an active airflow. Quantification of BC was performed using a CS230 C/S analyzer.The limit of quantification in this study was(2.3± 0.3) μ g/g.
2.6 Analysis of stable carbon isotope ratio of BC( δ 13 C BC)
The carbon isotope ratios of BC ( δ13CBC) in sediment core H44 were measured using an elemental analyzer-isotope ratio mass spectrometer (EA-IRMS)at the Laboratory of Bioorganic Geochemistry, School of Marine Sciences, Sun Yat-Sen University. Briefly,approximately 15 mg of each sample treated sequentially by the acidification and WXY methods was weighed and loaded into a clean tin capsule. The capsules containing the samples were placed on an automatic feeder of solid samples for the vario ISOTOPE cube elemental analyzer (Elementar,Hanau, Germany) and burned in an ultrapure O2atmosphere in a combustion CuO tube at 950°C.Combustion gases were eluted through a reduction column by a stream of He gas and passed into the gas chromatograph where the CO2in the He stream was separated from the other gases. The gas stream then entered an IsoPrime 100 isotope ratio mass spectrometer (Elementar, Manchester, UK), in which the CO2gas was analyzed by comparison with a reference CO2gas with a known δ13C value (-33.21‰,calibrated against the IAEA-NBS-22 reference material with a δ13C value of -30.03‰± 0.04‰).During every batch of analyses, an empty tin capsule was analyzed as the blank to check the background,and a reference material (sulfanilamide) with a known δ13C value (-28.13‰± 0.02‰) was used to assess the reproducibility and accuracy. Low background, i.e., a peak height <0.01 V, which was much lower than the peak height of the sample (1.50 V), and excellent reproducibility and accuracy were achieved. The corresponding standard deviation of the analysis and the deviation between the measured and predetermined data were within ± 0.2‰. Stable carbon isotope ratios of BC were expressed using the conventional delta ( δ)notation:

where Rsampleand Rstdare the13C/12C isotope ratios corresponding to the sample and international internal standard (V-PDB), respectively (Craig, 1957; Coplen et al., 2006).
2.7 Analysis of precipitation data
The mean monthly precipitation data in the reaches of the Huanghe (Yellow) River during 1900- 2010 AD were downloaded from the China Meteorological Data Sharing Service System. To analyze the relationship between the precipitation and BC variation, the data were processed using a three-year moving average and they were reset to zero in cases where precipitation was <150 mm/month.
3 RESULT
3.1 210 Pb chronology and average sedimentation rate
The210Pb dating results of core H44 are presented in Table S1 and Fig.2. It can be seen from Fig.2 that the relationship between excess210Pb activity and ln(depth) for 10 samples can be described using the following equation:

where X, Y, and r represent the average depth (cm),excess210Pb activity (dpm/g), and correlation coeffi cient, respectively. The linear trend demonstrates that the excess210Pb activity decreased exponentially downcore, suggesting a continuous deposition and yielding an average sedimentation rate of (3.1 ±0.2) mm/a over the period of approximately 1891- 2010 AD for core H44.
3.2 Sedimentary sequences of cores H43 and H44
The data of grain size analysis for cores H43 and H44 are listed in Tables S2 and S3. Figure 3 illustrates their top-to-bottom grain size compositions, as well as the related parameters of mean grain size ( Mz),median grain size ( Md), sorting coeffi cients ( σ),skewness ( Sk), and kurtosis ( Kg).
It appears that the contents of sand and mud for core H43 vary significantly with depth, whereas there is no evident change in the contents of silt (Fig.3a).The sand and mud contents range from 2.03% to 22.09% with a mean value of 8.69% and from 8.42%to 17.42% with a mean value of 12.23%, respectively.The values ofMdandMzrange from 4.90 (inμ, the same below) to 6.27 with an average value of 5.49 and from 5.28 to 6.44 with an average value of 5.78,respectively. The parametersσ,Sk, andKgfor core H43 fluctuate markedly within the intervals of 1.51–1.82 (mean: 1.67), 0.20–0.36 (mean: 0.30), and 0.94–1.27 (mean: 1.07), respectively (Fig.3a).
The contents of sand and mud for core H44 also change notably with depth, while the change in the silt contents remains within a relatively narrow range(Fig.3b). The sand and mud contents vary within the intervals of 0.43%- 22.76% with a mean value of 5.50% and 9.24%- 44.79% with a mean value of 24.56%, respectively. The values ofMdandMzvary within the ranges of 4.93- 7.80 with a mean value of 6.57 and 5.25- 7.84 with a mean value of 6.68,respectively. The parametersσ,Sk, andKgfor core H44 fluctuate significantly within the intervals of 1.52- 2.20 (mean: 1.74), 0.00- 0.34 (mean: 0.11), and 0.92- 1.32 (mean: 0.99), respectively.
To match the vertical variation of BC for further analysis of its cycling, the sediment sequences of cores H43 and H44 were divided artificially into five stages to evaluate their diff erences in grain composition, grain size distribution, and other related parameters. The curves of grain size distribution for cores H43 and H44 at diff erent stages are illustrated in Fig.4a and 4b, respectively. Details of the comparison of the two sequences are given below.

Fig.3 Grain size parameters for (a) core H43 and (b) core H44 in the South Yellow Sea
Stage 1 (37.8- 36.3 cm, corresponding to the period 1891- 1895) in core H43 is characterized by relatively high sand content (9.41%), low mud content (11.34%),and smallMd(5.39) andMz(5.69) values, together with a relatively lowerσvalue (1.65) and higherKgvalue (1.09). Stage 1 in core H44 is characterized by relatively low contents of sand (5.84%) and mud(22.95%), and smallMd(6.55) andMz(6.61) values,together with a relatively higherσvalue (1.80) and lowerSkvalue (0.98).
Stage 2 (36.0- 29.7 cm, corresponding to the period 1896–1916) in core H43 is characterized by sediments with reduced silt (77.32%) and increased mud(12.70%) contents, with an increasedσvalue of 1.72 and a reducedKgvalue of 1.05. As a result, the values ofMdandMzat this stage are relatively higher at 5.45 and 5.77, respectively. Stage 2 in core H44 is characterized by reduced silt (70.51%) and increased sand (6.61%) contents, with a decreasedσvalue of 1.74 and an increasedSkvalue of 0.13.
Stage 3 (29.4–25.8 cm, corresponding to the period 1917–1929) in core H43 is characterized by sediments with an evident reduction in sand content to 7.36%and increased silt content (79.86%), with σ reduced to a mean value of 1.67. Stage 3 in core H44 is characterized by an evident reduction in silt content to 68.14% and increased mud content (25.31%), with an increasedσvalue of 1.81 and a reduced mean value ofSkof 0.09.
Stage 4 (25.5–2.1 cm, corresponding to the period 1930–2004) in core H43 is characterized by increased sand content (8.50%) and slightly decreased mud content (12.13%). All grain size parameters are similar to Stage 3. Stage 4 in core H44 is characterized by an evident reduction in sand content to 5.05% and increased silt content (70.29%), with a decreasedσvalue of 1.73 and an increased mean value ofSkof 0.12.
Stage 5 (1.8- 0.0 cm, corresponding to the period 2005–2010) in H43 is characterized by fractions of sand, silt, and mud, as well as grain size parameters,similar to Stage 4. Stage 5 in core H44 is characterized by increased mud content (29.53%) and reduced silt content (65.82%), with a reducedSkvalue of 0.09.Hence, the values ofMdandMzat this stage are increased to 6.86 and 6.95, respectively.
The grain sizes in core H43 clearly vary smoothly from Stages 1–5, whereas those in core H44 change sharply, especially in Stage 5 with the diff erentMd,Mz, andSkvalues. Additionally, the sediments at the diff erent stages of core H43 always maintain a unimodal distribution with the maximum volume content at the grain size of 32 μ m (Fig.4a), while the grain size distribution curves of core H44 change with each stage (Fig.4b). The grain size distribution curves for Stages 1- 4 in core H44 exhibit the same flattopped unimodal pattern with the maximum volume content at the grain size of 4- 16 μ m, whereas the curve at Stage 5 appears as a sharp unimodal pattern with the maximum volume content at the grain size of 4 μ m (Fig.4b).
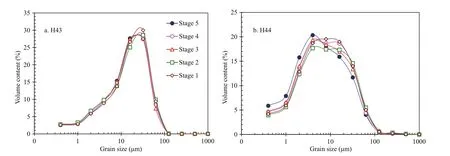
Fig.4 Mean grain size distribution curves of the samples from (a) core H43 and (b) core H44
3.3 Vertical distributions of TOC
The contents of TOC in core H44 are presented in Table S4, and the content-versus-depth sequence is illustrated in Fig.5. It can be seen from Table S4 and Fig.5 that the TOC contents in core H44 ranges from 0.643- 1.283 wt.% with a mean value of 0.786 wt.%(n=126). At depths of 25.8- 37.8 cm, corresponding to sedimentation Stages 1- 3, the TOC contents fluctuate within a narrow interval of 0.694- 0.847 wt.% with nearly identical averages of 0.753- 0.782 wt.%. From 2.1 to 25.5 cm, equivalent to Stage 4, the TOC contents vary dramatically and they exhibit a U-shaped valley with basal values of 0.643- 0.685 wt.%in 1975- 1978 (Fig.5). From the top to a depth of 1.8 cm (Stage 5), i.e., since 1979, the TOC content exhibits a rapidly increasing trend with the highest mean of 1.090 wt.% (Fig.5).
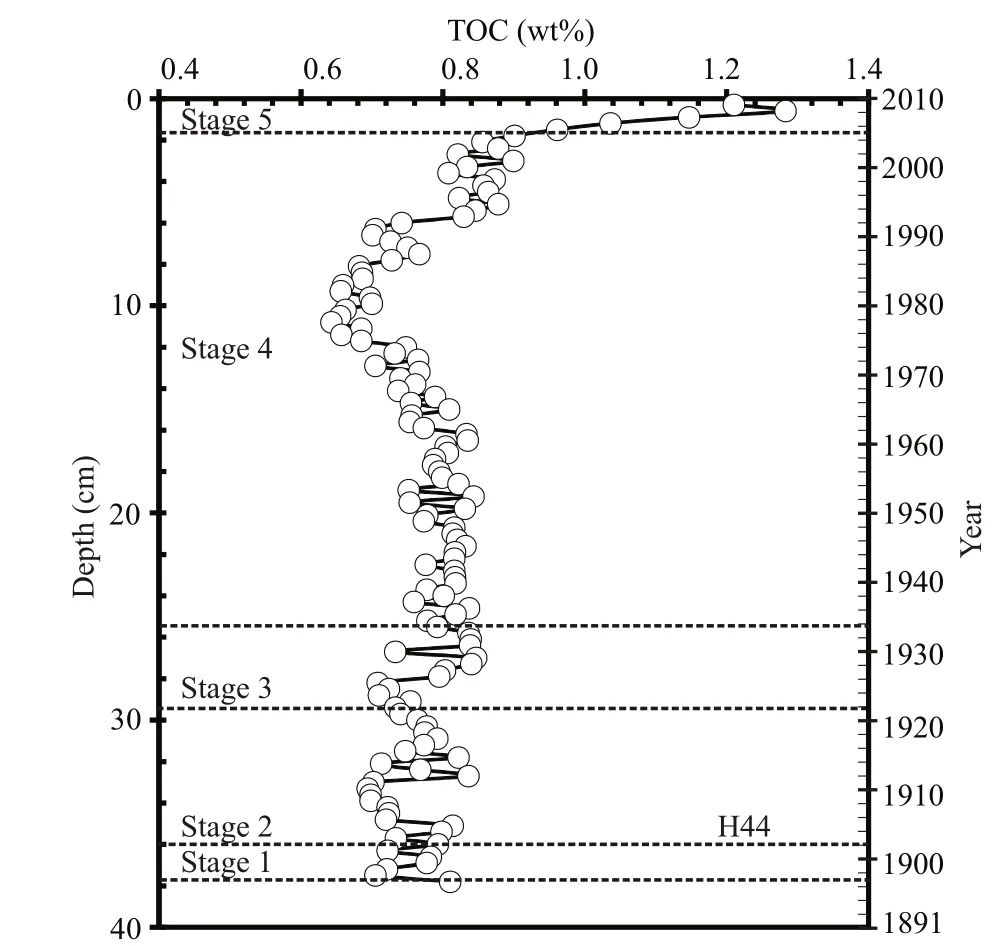
Fig.5 Sequence of the total organic carbon (TOC) contents for core H44 in the South Yellow Sea

Fig.6 Sequences of BC contents in (a) core H43 and (b) core H44 in the South Yellow Sea
3.4 Vertical variations of BC in cores H43 and H44
The data of BC contents in sediment cores H43 and H44 are presented in Tables S2 and S4, respectively,and the content-versus-depth sequences are plotted in Fig.6a and 6b, respectively. The BC content in core H43 ranges from 0.086 8 to 0.228 0 wt.% with a mean value of 0.108 0 wt.% (n=126, Table S2), while the BC contents in core H44 vary within the interval 0.037 6 -0.213 0 wt.%, with an average of 0.063 6 wt.% (n=126,Table S4). Except for the segments with three peaks,the BC contents fluctuate within narrow intervals throughout the sequences of cores H43 and H44. As indicated in Fig.6a and 6b, three BC peaks occur simultaneously within the two sequences. These peaks are characterized by a rapid increase in BC from the background level, followed by a slower gentle attenuation down to the background level.
3.5 Vertical change in stable carbon isotope ratio of BC ( δ 13 C BC)
The stable carbon isotope ratios of BC ( δ13CBC) in core H44 are presented in Table S4, and its vertical distribution is presented in Fig.7. Table S4 and Fig.7 show that the δ13CBCvalues vary from -22.66‰ to-20.07‰ with a mean value of -21.67‰ (n=126). At depths of 36.3- 37.8 cm, corresponding to Stage 1, the δ13CBCvalues fluctuate smoothly within a narrow interval of -21.79‰ to -21.42‰ with a mean value of-21.63‰. From 29.7 to 36.0 cm, equivalent to Stage 2, the δ13CBCvalues change markedly within a relatively wide gap of -22.37‰ to -21.28‰. At depths of 25.8- 29.4 cm, corresponding to Stage 3, the δ13CBCvalues fluctuate dramatically within an even wider interval (-22.66‰ to -21.57‰). From Stages 1 through 3, the δ13CBCvalues show a slightly decreasing trend. Stage 2 could be divided into two periods: an early period (10.8- 25.5 cm) when the δ13CBCvalues seesaw within a very narrow gap of -22.17‰ to-21.50‰, and a late period (2.1- 10.5 cm) when the δ13CBCvalues range from -21.95‰ to -20.17‰,exhibiting a gradual increasing trend. The BC in the sediments from the top to a depth of 1.8 cm, i.e., in Stage 5, possesses higher δ13CBCvalues of -20.07‰ to-20.88‰, with no evident variation.
3.6 Century-scale storm records for the reaches of the Huanghe River
The mean monthly precipitation data after data processing in the reaches of the Huanghe River in the period 1900- 2010 AD are presented in Table S5 and Fig.8. It can be seen from Fig.8 that the mean monthly rainfall was <40 mm/month in two periods:1919- 1921 and 2000- 2001. These periods reflect times of lowest precipitation and the occurrence of severe droughts. In particular, no heavy storms aff ected the reaches of the Huanghe River during 1917- 1921 and 1998- 2004 AD.
4 DISCUSSION
4.1 Improvements in the BC quantification method and occurrence of exceptional BC sequences in the sediment cores from the YSCWM area
In this study, based on the210Pb dating (Fig.2) and systematic measurement of BC in core H44 from the YSCWM area, an exceptional BC sequence with annual resolution has been determined (Fig.6b). This sequence is characterized by three peaks of BC contents of 0.115 0 wt.%, 0.136 0 wt.%, and 0.213 0 wt.%, enhanced considerably from the unusually low background mean BC level of 0.051 6 wt.%, which correspond approximately to 1891, 1921, and 2007 AD, respectively (Table S4;Fig.6b). Core H43 is not dated, but because it was obtained from a location close to core H44 (Fig.1),their sequences might be correlated based on their sediment properties. Grain size analysis suggests that they possess similar silt-mud-dominated compositions and grain size parameters (Tables S2 and S3; Fig.3),also implying a continuous sedimentation for core H43 similar to Core H44. Therefore, the210Pb-based sedimentation rate for core H44 was extrapolated to core H43. It can be seen from Fig.6a and 6b that the BC sequences for cores H43 and H44 are similar,suggesting their sequences were regionally controlled by the same BC deposition. Thus, the three peaks might be indicative of important natural and/or anthropogenic events.
A few earlier studies have investigated centuryscale BC records in the Sishili Bay (Wang et al., 2011)and the northern YS (Cui et al., 2015); however, BC sequences similar to those revealed in this study have not been reported previously in or near the current study area. It is considered that the most important factor regarding exceptional BC sequences is relatively low BC recovery. This is particularly relevant in areas containing low background levels of BC, where tiny BC particles might be lost during sample treatment,either because they are suffi ciently fine to remain in suspension or because of sorption onto the surfaces of centrifuge tubes. Dickens et al. (2004) demonstrated that the BC recovery rate was only 46% for Washington Lake sediments. To augment the level of BC recovery in this study, an improved CTO-375 method, i.e.Wang-Xu-Yuan method (Xu et al., 2018) was employed to treat the samples, i.e., the adoption of disposable ceramic crucibles with the microporecontrolled ability to remove carbonates in the sediments for avoiding BC loss. The revelation of exceptional BC sequences in this work might be attributable to the enhancement of BC recovery.
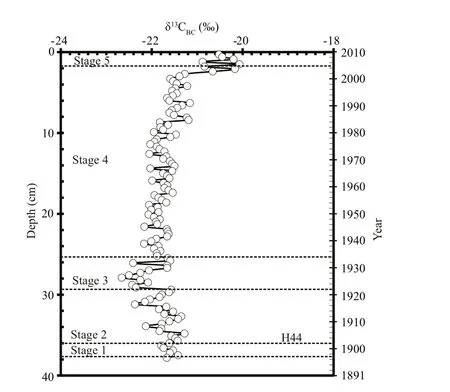
Fig.7 Sequence of carbon isotope ratio of δ 13 C BC in core H44 in the South Yellow Sea
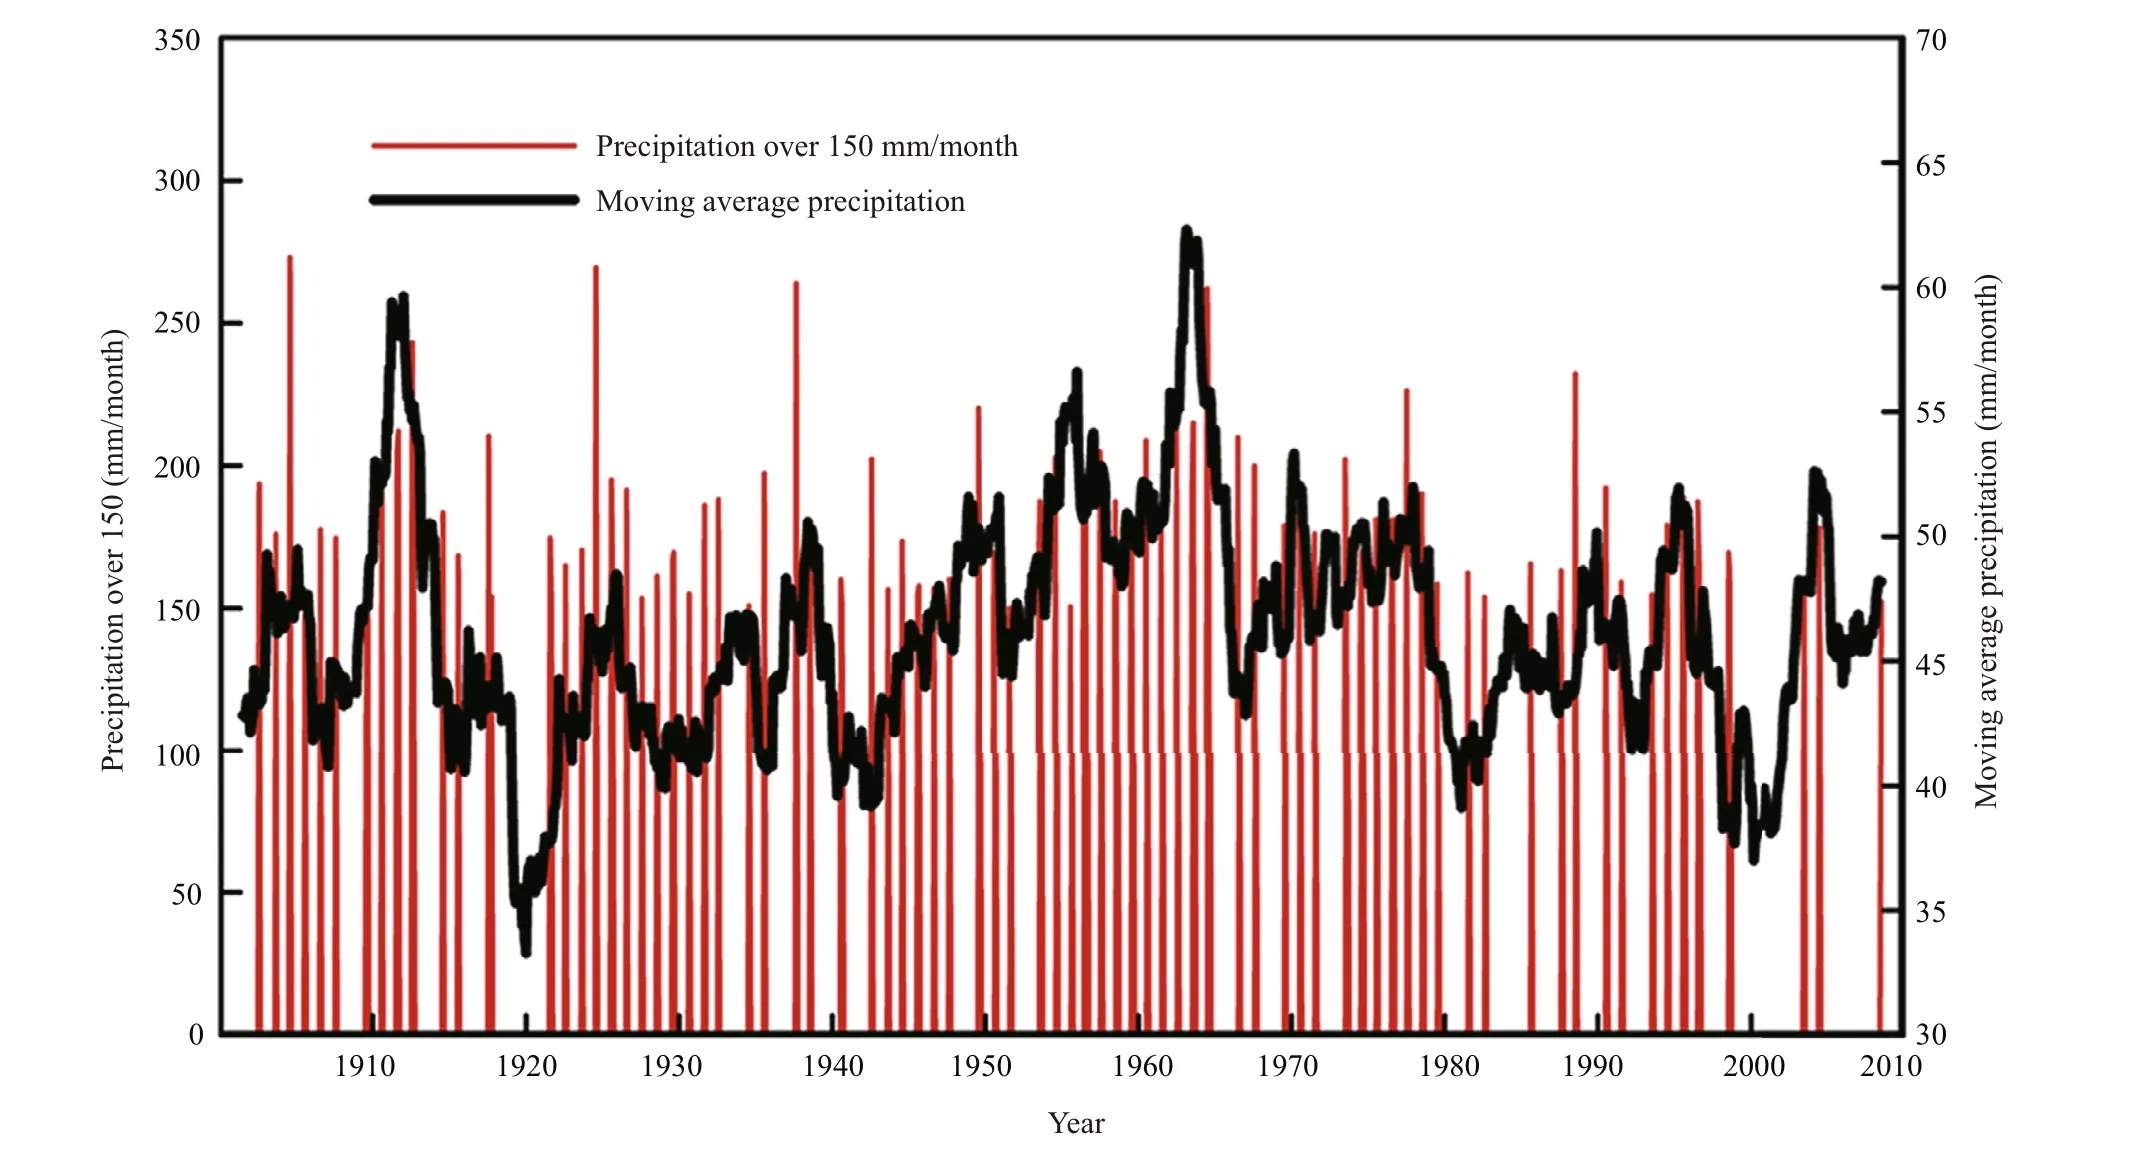
Fig.8 Century-scale storm records in the reaches of the Huanghe River
4.2 BC deposition for sediment cores in the YSCWM area
It is well known that BC is originated from the incomplete combustion of biomass and fossil fuels as well as graphitic carbon from weathered rocks(Dickens et al., 2004; Elmquist et al., 2004). BC derived from burning might be transported into marine sediments via aerosols and/or surface runoff ,whereas surface runoff is the sole input pathway of BC derived from graphitic carbon into the sea. Thus,the BC sequence of one marine sediment core could reflect the combination of various factors, principally including the sediment sources, transportation,composition, and depositional environments.
The Huanghe River is the second largest river in terms of sediment load in the world. Previous studies have indicated that the fine-grained sediments in the SYS are originated from various material sources(Lim et al., 2007; Milliman and Farnsworth, 2011).However, there is consensus that sediments from the modern Huanghe River (i.e., since 1855 AD) could be transferred southeastward through the southern Bohai Strait (Shi et al., 2003; Bi et al., 2011). This is especially possible given the conditions of strong resuspension and enhanced coastal currents due to winter monsoon activities (Yuan et al., 2008; Bi et al.,2011), and the relict Older Huanghe River subaqueous delta (1128–1855 AD) (Li et al., 2014). Additionally,after the course of the Huanghe River shifted northward into the Bohai Sea in 1855, the Older Huanghe River Delta (1128–1855 AD) underwent strong erosion, which provided a plentiful supply of sediments to the SYS (Li et al., 2014).
In principle, small amounts of BC from surface runoff , together with other particles, especially finegrained silt and mud, might be transferred into the YSCWM area. However, because of the existence of cyclonic eddies that form in the complicated hydrodynamic system of the YS (Hu, 1984; Shi et al.,2003), it remains open to debate whether BC from surface runoff could be deposited in the YSCWM region. The BC/TOC ratio is a robust and widely accepted marker for identifying BC sources, i.e., the incomplete burning of biomass will generate an average BC/TOC value of <0.11, while the mean ratio produced by fossil fuels is approximately 0.50 (He and Zhang, 2009). It was established in this study that the mean BC/TOC ratios in core H44 were lower than 0.11 for Stages 2 and 4 (Table S4; Fig.6b), suggesting that the BC in these two stages could largely be attributed to the incomplete combustion of biomass.Meanwhile, the mean BC/TOC ratios were 0.116,0.129, and 0.155 (i.e., >0.11) for Stages 1, 3, and 5(Table S4; Fig.6b), respectively, implying that BC derived from the burning of fossil fuels and/or graphitic carbon from weathered rocks was probably transferred into the sediments during these three stages (Dickens et al., 2004; He and Zhang, 2009). In fact, the BC contents in core H44, except for the segments with the three peaks, were within the interval of 0.037 6- 0.089 9 wt.% with a mean value of 0.051 6 wt.%, evidently lower than those of the Bohai Bay (0.218 0 wt.%) (Kang et al., 2009), Sishili Bay (0.118 0 wt.%) (Wang et al., 2011), Bohai Sea(0.084 wt.%) (Jiang et al., 2010), and northern YS(0.056 0- 0.132 0 wt.%) (Cui et al., 2015).
4.3 Origin of BC peaks in the sequences of sediment cores in the YSCWM area
Three peaks with high BC contents corresponding to 1891, 1921, and 2007 AD were found in cores H43 and H44 from the YSCWM area (Fig.6). Two of the peaks are coeval with the two time points of 1921 and 2007 AD, when the first heavy storms occurred just after the termination of long-term (4- 5-year) droughts(Fig.8). Because of the lack of longer time series of precipitation data for the reaches of the Huanghe River, it cannot be confirmed whether a corresponding relationship exists between the BC peak in 1891 AD and the occurrence of a heavy storm. It might be reasonable to interpret the occurrence of the BC peaks in the sediment cores from the YSCWM area as follows.
The tiny light BC particles in the YSCWM area primarily are originated from surface runoff in the reaches of the Huanghe River and atmospheric deposition. When the reaches of the Huanghe River were aff ected by long-term drought, BC from incomplete combustion could have accumulated in terrestrial surface soils/sediments, where longer periods of drought would result in greater deposition of BC. The subsequent occurrence of a heavy storm could have eroded the previously accumulated BC from the terrestrial surface soils/sediments, which was then transported into the YS via surface runoff ,particularly from the Huanghe River. Thus, flood events evidently could have introduced greater quantities of previously accumulated BC into the YS,enhancing BC deposition in the YSCWM area. Thus,it is suggested that the peaks in the two sequences might have been originated from BC sedimentation strengthened markedly by surface runoff , particularly from the Huanghe River, which augmented the atmospheric deposition. The facts that the periods 1919- 1921 and 2000- 2001 AD reflect times of reduced precipitation and there were no heavy storms during the last 110 years (Fig.8), together with the occurrence of severe droughts, support the above inference. It must be noted that considerable hydrodynamic changes have occurred in the Huanghe River because of impoundment by large reservoirs,e.g., the Sanmenxia, Liujiaxia, Longyangxia,Wanjiazhai, and Xiaolangdi reservoirs in 1958, 1968,1986, 1995, and 1997, respectively. These hydrodynamic changes could have restricted the occurrence of BC peaks in the sequences of cores H43 and H44 in other periods (Yu et al., 2013).
Evident diff erences were noted between the BC peaks in Stages 1, 3, and 5 (Fig.6). Grain size analysis indicated that the grain size parameters of Md, Mz,and Sk in Stage 5 in core H44 diff ered from those in Stages 1 and 3 (Table S3). The curve of grain size distribution in Stage 5 exhibits a sharp unimodal pattern with the maximum volume content at the grain size of 4 μ m, which is diff erent from Stages 1 and 3 (Fig.4b). Stable carbon isotope analysis indicated that the δ13CBCvalues in Stages 1 and 3 range from -21.79‰ to- 21.42‰ with a mean value of-21.63‰ and from -22.66‰ to -21.57‰ with a mean value of -22.11‰, respectively. These are notably diff erent from Stage 5 (from -20.07‰ to -20.88‰with a mean value of -20.49‰) (Table S4). Therefore,it is considered that the increase in δ13CBCvalues in Stage 5 might result from the input of weathered rock-derived graphitic carbon caused by artificial annual water-sediment modulation in the Huanghe River since 2005 (Bi et al., 2014).
4.4 Fractions of rock-derived graphitic carbon in BC peaks in core H44 in the YSCWM area
To determine the proportions of weathered rockderived graphitic carbon in the stages with BC peaks in core H44 in the YSCWM area, proper δ13C endmember values of BC from the incomplete burning of oil ( δ13Coil) and coal ( δ13Ccoal) were chosen.Chen et al. (2012) reported mean δ13Coiland δ13Ccoalvalues of -25.17‰ ( δ13Coil) and -23.46‰ ( δ13Ccoal),respectively. Ni et al. (2014) provided the recent fractions of total energy consumption in China, i.e.,46% coal ( Fcoal), 37% biomass ( Fbiom), and 17% oil( Foil). If the above energy fractions ( Fcoal, Foil, and Fbiom) are used as the BC contributions in atmospheric deposition, then the mean δ13C values of BC from fossil fuels ( δ13Cff) can be calculated as follows:
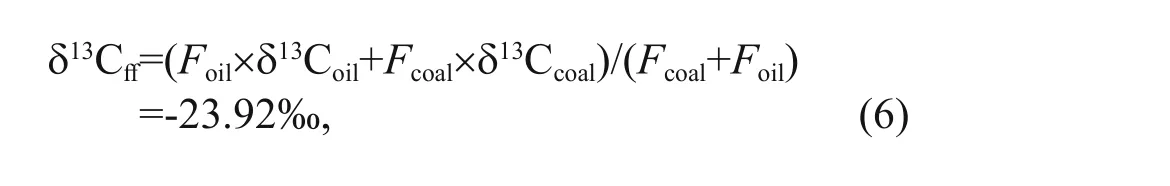
where Foil, Fcoal, δ13Coil, and δ13Ccoalare 17%, 46%,-25.17‰, and -23.46‰, respectively.
Assuming a mean δ13CBCvalue of -21.68‰ (Table S4) for the sediment segments with no BC peaks is the normal background level ( δ13Cnbl), the mean δ13CBCvalue for biomass ( δ13Cbiom) can be calculated as follows:
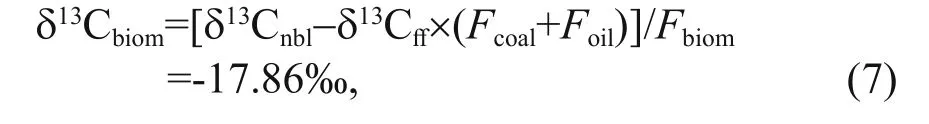
where Foil, Fcoal, Fbiom, δ13Cnbl, and δ13Cffare 17%, 46%,37%, -21.68‰, and -23.92‰, respectively.
Adopting the normal background level of BC/TOC(0.067, Table S4) as that of the biomass, the variations in BC/TOC for Stages 1, 3, and 5 can be calculated as 0.049, 0.062, and 0.088, respectively. Furthermore,supposing that the residue, other than the BC derived from biomass, comes from fossil fuels, the mean fractions of fossil fuels ( Fff) for Stages 1, 3, and 5 can be determined as 42.24%, 48.06%, and 56.77%,respectively. Based on the above mean fractions of fossil fuels, the mean δ13C values in the sediments with peaks (for stages 1, 3, and 5) can be estimated.
Because no δ13C data of ancient graphite ( δ13Cgc) in the reaches of the Yellow River are available, the average δ13C value of ancient graphite (-20.0‰,δ13Cgc) in metamorphic rocks in the Qinling orogenic belt can be used as the δ13C endmember value (Chen et al., 2000). Thus, the fraction of graphitic carbon( Fgc) can be calculated as follows:
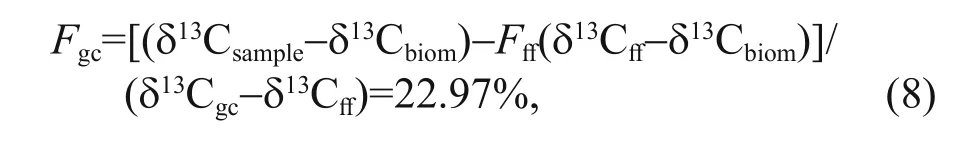
where δ13Csample, δ13Cbiom, δ13Cff, and Fffare -20.49‰,-17.86‰, -23.92‰, and 56.77%, respectively.
The above result shows that the proportion of weathered rock-derived graphitic carbon in core H44 is 22.97% in Stage 5. Similarly, estimates of the proportions of graphitic carbon in Stages 1 and 3 indicate that no weathered rock-derived graphitic carbon is present in Stages 1 or 3. Despite the lack of direct evidence, the low fraction of graphitic carbon in core H44 might be attributable to diffi culties associated with resuspension, because a similar phenomenon was observed along the Washington Coast (Dickens et al., 2004).
5 CONCLUSION
In summary, the remarkable sequences with three BC peaks were revealed in two sediment cores in the YSCWM area using an new WXY method. The three BC peaks corresponded approximately with 1891,1921, and 2007 AD, coeval with the occurrence of the first heavy storms following long-term droughts.Stable carbon isotope analysis of BC and numerical simulations indicated that the input of weathered rock-derived graphitic carbon only occurred in Stage 5, which was induced by the annual artificial watersediment modulation in the Huanghe River since 2005 AD.
6 ACKNOWLEDGEMENT
We would like to thank the National Meteorological Information Center of the People’s Republic of China for providing the precipitation data for the reaches of the Huanghe River. We are also grateful to Mr. LI Kechang at the Guangzhou Institute of Geochemistry,Chinese Academy of Sciences, for kindly assisting with the210Pb dating experiment.
Agarwal T, Bucheli T D. 2011. Adaptation, validation and application of the chemo-thermal oxidation method to quantify black carbon in soils. Environmental Pollution,159(2): 532-538.
Bi N S, Yang Z S, Wang H J, Fan D J, Sun X X, Lei K. 2011.Seasonal variation of suspended-sediment transport through the southern Bohai Strait. Estuarine, Coastal and Shelf Science, 93(3): 239-247.
Bi N S, Yang Z S, Wang H J, Xu C L, Guo Z G. 2014. Impact of artificial water and sediment discharge regulation in the Huanghe (Yellow River) on the transport of particulate heavy metals to the sea. Catena, 121: 232-240.
Chen Y J, Cai W W, Huang G P, Li J, Zhang G. 2012. Stable carbon isotope of black carbon from typical emission sources in China. Environmental Science, 33(3): 673-678.(in Chinese with English abstract)
Chen Y J, Liu C Q, Chen H Y, Zhang Z J, Li C. 2000. Carbon isotope geochemistry of graphite deposits and ore-bearing khondalite series in North China: implications for several geoscientific problems. Acta Petrologica Sinica, 16(2):233-244. (in Chinese with English abstract)
Coplen T B, Brand W A, Gehre M, Gr?ning M, Meijer H A J,Toman B, Verkouteren R M. 2006. New guidelines for δ13C measurements. Analytical Chemistry, 78(7): 2 439-2 441.
Coppola A I, Ziolkowski L A, Masiello C A, Druff el E R M.2014. Aged black carbon in marine sediments and sinking particles. Geophysical Research Letters, 41(7): 2 427-2 433.
Craig H. 1957. Isotopic standards for carbon and oxygen and correction factors for mass-spectrometric analysis of carbon dioxide. Geochimica et Cosmochimica Acta, 12(1-2): 133-149.
Crombie K, Ma?ek O, Cross A, Sohi S. 2015. Biochar -synergies and trade-off s between soil enhancing properties and C sequestration potential. GCB Bioenergy, 7(5):1 161-1 175.
Cui M, Chen Y J, Fang Y, Lin T, Tian C G, Pan X H, Tang J H.2015. Sedimentary records of PAHs and BC from mud area of the central northern Yellow Sea, China. Acta Oceanologica Sinica, 37(8): 39-46. (in Chinese with English abstract)
Dickens A F, Gélinas Y, Masiello C A, Wakeham S, Hedges J I.2004. Reburial of fossil organic carbon in marine sediments. Nature, 427(6972): 336-339.
Elmquist M, Gustafsson ?, Andersson P. 2004. Quantification of sedimentary black carbon using the chemothermal oxidation method: an evaluation of ex situ pretreatments and standard additions approaches. Limnology and Oceanography: Methods, 2(12): 417-427.
Elmquist M, Zencak Z, Gustafsson ?. 2007. A 700 year sediment record of black carbon and polycyclic aromatic hydrocarbons near the EMEP air monitoring station in Aspvreten, Sweden. Environmental Science &Technology, 41(20): 6 926-6 932.
Fang Y, Chen Y J, Lin T, Tian C G, Pan X H, Tang J H. 2014.One hundred year sedimentary record of black carbon from mud area in Bohai Sea, China. Acta Oceanologica Sinica, 36(5): 98-106. (in Chinese with English abstract)
Flores-Cervantes D X, Plata D L, MacFarlane J K, Reddy C M,Gschwend P M. 2009. Black carbon in marine particulate organic carbon: inputs and cycling of highly recalcitrant organic carbon in the Gulf of Maine. Marine Chemistry,113(3-4): 172-181.
Folk R L, Ward W C. 1957. Brazos River bar: a study in the significance of grain size parameters. Journal of Sedimentary Research, 27(1): 3-26.
Gustafsson ?, Bucheli T D, Kukulska Z, Andersson M,Largeau C, Rouzaud J N, Reddy C M, Eglinton T I. 2001.Evaluation of a protocol for the quantification of black carbon in sediments. Global Biogeochemical Cycles,15(4): 881-890.
Han Y M, Cao J J, Yan B Z, Kenna T C, Jin Z D, Cheng Y,Chow J C, An Z S. 2011. Comparison of elemental carbon in lake sediments measured by three diff erent methods and 150-year pollution history in Eastern China. Environmental Science & Technology, 45(12): 5 287-5 293.
He Y, Zhang G L. 2009. Historical record of black carbon in urban soils and its environmental implications.Environmental Pollution, 157(10): 2 684-2 688.
Hu D X. 1984. Upwelling and sedimentation dynamics.Chinese Journal of Oceanology and Limnology, 2(1): 12-19.
Hu L M, Shi X F, Guo Z G, Wang H J, Yang Z S. 2013. Sources,dispersal and preservation of sedimentary organic matter in the Yellow Sea: the importance of depositional hydrodynamic forcing. Marine Geology, 335: 52-63.
Huang L, Zhang G S, Wu Y, Zhang J. 2012. Distribution and source of black carbon in the surface sediments of the inner continental shelf of the East China Sea. Earth and Environment, 40(1): 63-69. (in Chinese with English abstract)
Hung C C, Gong G C, Ko F C, Lee H J, Chen H Y, Wu J M,Hsu M L, Peng S C, Nan F H, Santschi P H. 2011.Polycyclic aromatic hydrocarbons in surface sediments of the East China Sea and their relationship with carbonaceous materials. Marine Pollution Bulletin, 63(5-12): 464-470.
Jia G D, Peng P A, Zhao Q H, Jian Z M. 2003. Changes in terrestrial ecosystem since 30 Ma in East Asia: stable isotope evidence from black carbon in the South China Sea. Geology, 31(12): 1 093-1 096.
Jiang X H, Chen Y J, Tang J H, Huang G P, Liu D Y, Li J,Zhang G. 2010. The distribution of black carbon in the surface sediments of coastal zone, Bohai Bay. Ecology and Environmental Sciences, 19(7): 1 617-1 621. (in Chinese with English abstract)
Kang Y J, Wang X C, Dai M H, Feng H, Li A C, Song Q. 2009.Black carbon and polycyclic aromatic hydrocarbons(PAHs) in surface sediments of China’s marginal seas.Chinese Journal of Oceanology and Limnology, 27(2):297-308.
Li A, Yu F, Diao X Y. 2015. Interannual salinity variability of the Northern Yellow Sea Cold Water Mass. Chinese Journal of Oceanology and Limnology, 33(3): 779-789.
Li F Y, Gao S, Jia J J, Zhao Y Y. 2002. Contemporary deposition rates of fine-grained sediment in the Bohai and Yellow Seas. Oceanologia et Limnologia Sinica, 33(4): 364-369.(in Chinese with English abstract)
Li J, Hu B Q, Wei H L, Zhao J T, Zou L, Bai F L, Dou Y G,Wang L B, Fang X S. 2014. Provenance variations in the Holocene deposits from the southern Yellow Sea: clay mineralogy evidence. Continental Shelf Research, 90: 41-51.
Lim D I, Choi J Y, Jung H S, Rho K C, Ahn K S. 2007. Recent sediment accumulation and origin of shelf mud deposits in the Yellow and East China Seas. Progress in Oceanography, 73(2): 145-159.
Lin T, Fang Y, Chen Y J, Hu L M, Guo Z G, Zhang G. 2012.Distribution of black carbon in the surface sediments of the East China Sea and their correlations with persistent organic pollutants. Environmental Science, 33(7): 2 335-2 340. (in Chinese with English abstract)
Liu X D, Xu L Q, Sun L G, Liu F, Wang Y H, Yan H, Liu Y,Luo Y H, Huang J. 2011. A 400-year record of black carbon flux in the Xisha archipelago, South China Sea and its implication. Marine Pollution Bulletin, 62(10): 2 205-2 212.
Lohmann R, Bollinger K, Cantwell M, Feichter J, Fischer-Bruns I, Zabel M. 2009. Fluxes of soot black carbon to South Atlantic sediments. Global Biogeochemical Cycles,23(1): GB1015.
Marlon J R, Bartlein P J, Carcaillet C, Gavin D G, Harrison S P, Higuera P E, Joos F, Power M J, Prentice I C. 2008.Climate and human influences on global biomass burning over the past two millennia. Nature Geoscience, 1(10):697-702.
Masiello C A, Druff el E R M. 1998. Black carbon in deep-sea sediments. Science, 280(5371): 1 911-1 913.
Masiello C A, Louchouarn P. 2013. Fire in the ocean. Science,340(6130): 287-288.
McCall P L, Robbins J A, Matisoff G. 1984.137Cs and210Pb transport and geochronologies in urbanized reservoirs with rapidly increasing sedimentation rates. Chemical Geology, 44(1-3): 33-65.
McConnell J R, Edwards R, Kok G L, Flanner M G, Zender C S, Saltzman E S, Banta J R, Pasteris D R, Carter M M,Kahl J D W. 2007. 20th-century industrial black carbon emissions altered Arctic climate forcing. Science,317(5843): 1 381-1 384.
Middelburg J J, Nieuwenhuize J, van Breugel P. 1999. Black carbon in marine sediments. Marine Chemistry, 65(3-4):245-252.
Milliman J D, Farnsworth K L. 2011. River Discharge to the Coastal Ocean: A Global Synthesis. Cambridge University Press, Cambridge, UK.
Moon J H, Hirose N, Yoon J H. 2009. Comparison of wind and tidal contributions to seasonal circulation of the Yellow Sea. Journal of Geophysical Research: Oceans, 114(C8):C08016.
Ni M J, Huang J X, Lu S Y, Li X D, Yan J H, Cen K F. 2014. A review on black carbon emissions, worldwide and in China. Chemosphere, 107: 83-93.
Oh K H, Lee S, Song K M, Lie H J, Kim Y T. 2013. The temporal and spatial variability of the Yellow Sea Cold Water Mass in the southeastern Yellow Sea, 2009-2011.Acta Oceanologica Sinica, 32(9): 1-10.
Pang C G, Hu D X. 2002. Upwelling and sedimentation dynamics III: coincidence of upwelling areas with mud patches in north hemisphere shelf seas. Chinese Journal of Oceanology and Limnology, 20(2): 101-106.
Qu T D, Hu D X. 1993. Upwelling and sedimentation dynamics. Chinese Journal of Oceanology and Limnology,11(4): 289-295.
Shi X F, Shen S X, Yi H I, Chen Z H, Meng Y. 2003. Modern sedimentary environments and dynamic depositional systems in the southern Yellow Sea. Chinese Science Bulletin, 48: 1.
Smith H J. 2005. Black carbon. Science, 309(5736): 852.
Sun X S, Peng P A, Song J Z, Zhang G, Hu J F. 2008.Sedimentary record of black carbon in the Pearl River estuary and adjacent northern South China Sea. Applied Geochemistry, 23(12): 3 464-3 472.
Tang D L, Di B P, Wei G F, Ni I H, Oh I S, Wang S F. 2006.Spatial, seasonal and species variations of harmful algal blooms in the South Yellow Sea and East China Sea.Hydrobiologia, 568(1): 245-253.
Verardo D J, Ruddiman W F. 1996. Late Pleistocene charcoal in tropical Atlantic deep-sea sediments: climatic and geochemical significance. Geology, 24(9): 855-857.
Wang J H, Sun X X, Xu X M, Wu C F, Peng J, Yuan J P. 2015.Marine carbon sequestration: current situation, problems and future. Advances in Earth Science, 30(1): 17-25. (in Chinese with English abstract)
Wang X, Cui L L, Xiao J L, Ding Z L. 2013. Stable carbon isotope of black carbon in lake sediments as an indicator of terrestrial environmental changes: an evaluation on paleorecord from Daihai Lake, Inner Mongolia, China.Chemical Geology, 347: 123-134.
Wang X C, Li A C. 2007. Preservation of black carbon in the shelf sediments of the East China Sea. Chinese Science Bulletin, 52(22): 3 155-3 161.
Wang Y Z, Gao X L, Yang Y W. 2011. Black carbon in core sediments near Sishili Bay. Marine Environmental Science, 30(4): 536-540. (in Chinese with English abstract)
Xin M, Ma D Y, Wang B D. 2015. Chemicohydrographic characteristics of the Yellow Sea Cold Water Mass. Acta Oceanologica Sinica, 34(6): 5-11.
Xu X M, Zhu Q, Zhou Q Z, Liu J Z, Yuan J P, Wang J H. 2018.An improved method for quantitatively measuring the sequences of total organic carbon and black carbon in marine sediment cores. Journal of Oceanology and Limnology, 36(1): 105-114, https://doi.org/10.1007/s00343-017-6229-8.
Yang S, Xu B Q, Cao J J, Zender C S, Wang M. 2015. Climate eff ect of black carbon aerosol in a Tibetan Plateau glacier.Atmospheric Environment, 111: 71-78.
Yao Z G, Bao X W, Li N, Li X B, Wan K, Song J. 2012.Seasonal evolution of the Northern Yellow Sea Cold Water Mass. Periodical of Ocean University of China,42(6): 9-15. (in Chinese with English abstract)
Yu Y G, Shi X F, Wang H J, Yue C K, Chen S L, Liu Y G, Hu L M, Qiao S Q. 2013. Eff ects of dams on water and sediment delivery to the sea by the Huanghe (Yellow River): the special role of Water-Sediment Modulation.Anthropocene, 3: 72-82.
Yuan D L, Zhu J R, Li C Y, Hu D X. 2008. Cross-shelf circulation in the Yellow and East China Seas indicated by MODIS satellite observations. Journal of Marine Systems,70(1-2): 134-149.
Zhang J, Séquaris J M, Klumpp E. 2013. Eff ects of natural organic matter on the microporous sorption sites of black carbon in a Yangtze River sediment. Environmental Science and Pollution Research, 20(10): 6 992-6 998.
Zhang S W, Wang Q Y, Lü Y, Cui H, Yuan Y L. 2008.Observation of the seasonal evolution of the Yellow Sea Cold Water Mass in 1996-1998. Continental Shelf Research, 28(3): 442-457.
猜你喜歡
青年文學(xué)家(2023年1期)2023-05-30 13:15:21
瘋狂英語(yǔ)·新讀寫(xiě)(2021年10期)2021-12-07 02:41:30
新世紀(jì)智能(高一語(yǔ)文)(2020年11期)2021-01-04 00:45:06
音樂(lè)教育與創(chuàng)作(2019年5期)2019-11-14 01:13:36
音樂(lè)教育與創(chuàng)作(2019年5期)2019-11-14 01:13:36
Chinese Physics B(2019年4期)2019-04-13 01:14:42
讀友·少年文學(xué)(清雅版)(2018年2期)2018-09-10 06:00:18
黃河之聲(2018年4期)2018-04-24 02:43:58
Journal of Oceanology and Limnology(2018年1期)2018-04-02 03:04:02
Communications in Theoretical Physics(2017年4期)2018-01-22 09:27:18
 Journal of Oceanology and Limnology2018年1期
- Journal of Oceanology and Limnology的其它文章
- Editorial Statement
- Sedimentary architecture of the Holocene mud deposit offthe southern Shandong Peninsula in the Yellow Sea*
- Ferroan dolomites in Miocene sediments of the Xisha Islands and their genetic model*
- Synchronous response of sedimentary organic carbon accumulation on the inner shelf of the East China Sea to the water impoundment of Three Gorges and Gezhouba Dams*
- Rates and fluxes of centennial-scale carbon storage in the fine-grained sediments from the central South Yellow Sea and Min-Zhe belt, East China Sea*
- Centennial-scale records of total organic carbon in sediment cores from the South Yellow Sea, China*