
Simulating the responses of a low-trophic ecosystem in the East China Sea to decadal changes in nutrient load from the Changjiang (Yangtze) River*
2018-04-02 03:03:52WANGYucheng王玉成GUOXinyu郭新宇ZHAOLiang趙亮
WANG Yucheng (王玉成) , GUO Xinyu (郭新宇) ,, ZHAO Liang (趙亮)
1 Center for Marine Environmental Studies, Ehime University, Matsuyama 7908577, Japan
2 Key Laboratory of Marine Environment and Ecology, Ministry of Education, Ocean University of China, Qingdao 266100,China
3 College of Environmental Science and Engineering, Ocean University of China, Qingdao 266100, China
4 College of Marine and Environmental Sciences, Tianjin University of Science and Technology, Tianjin 300457, China
1 INTRODUCTION
The East China Sea (ECS), with a board shelf area of about 0.6×10⁶km2, is one of the largest marginal seas in the northwestern Pacific Ocean. The ECS receives a large amount of nutrients from atmospheric deposition (e.g., Kim et al., 2011; Zhang et al., 2011),nearby rivers (Zhang, 1996; Liu et al., 2009), the Taiwan Strait (Chung et al., 2001), and upwelling Kuroshio waters (Chen, 1996; Zhao and Guo, 2011)and thus exhibits annual mean primary production as high as 155 g C/(m2·yr), with a maximal rate of 939 g C/(m2·yr) in summer (Gong et al., 2003). Both nutrient conditions and primary production in the ECS vary seasonally. For example, nutrient fronts are generally strong in winter and weak in summer (Chen, 2009);primary production in summer is about 3 times higher than in other seasons (Gong et al., 2003). Besides seasonal variations, long-term variations in nutrient levels and primary production in the ECS are also important. Based on satellite data from 1998 to 2007,Yamaguchi et al. (2013) reported that there was a significant increase in surface chlorophyll a in coastal areas of the ECS during this period.
Rivers serve as an important source of nutrients for the ECS. Among the rivers emptying into the ECS, the Changjiang (Yangtze) River is the largest in terms of discharge and sediment and nutrient loads (Beardsley et al., 1985; Zhang, 1996; Liu et al., 2009). The annual mean discharge of the Changjiang is 9×10¹¹m3, which accounts for 90% of the total freshwater input for the ECS and Yellow Sea (Beardsley et al., 1985). Similar to the variations in nutrient distribution and primary production in the ECS, discharge from the Changjiang also varies seasonally. Changjiang diluted water covers most of the northern area of the ECS (Bai et al.,2014) and even influences the water mass of the Tsushima Strait in summer (Morimoto et al., 2012).Similar to the seasonal variations in the Changjiang discharge, the Changjiang nutrient load is 3–4 times higher in the summer than in the winter (Liu et al.,2009). Bulge-shaped nutrient fronts form in the off shore area of the Changjiang estuary in summer,and a high-concentration band of nutrients forms along the coast of China in winter (Chen, 2009).
The Changjiang nutrient load also exhibits decadal variations. Wang (2006) reported that between the 1960s and 1990s, the concentrations of dissolved inorganic nitrogen (DIN) and phosphate (DIP) in Changjiang river water increased by a factor of five,whereas the concentration of silicate (SIL) decreased by two-thirds. These significant changes in nutrient concentrations were attributed to fertilizer application,effluent from cites, and the construction of large dams along the river (Duan and Zhang, 2001).
The impacts of changes in Changjiang characteristics on nutrient conditions and the ecosystems of the ECS have been confirmed by many previous studies (e.g., Wang, 2006), but these studies were primarily based on discrete field observations that focused on coastal areas around the Changjiang estuary. How do changes in Changjiang characteristics impact nutrient conditions and primary production in other areas of the ECS? Changes in the nutrient load of the Changjiang are aff ected by yearly changes in river discharge (although long-term discharge trends can be ignored) (Zhang et al., 2014) and by decadal changes in the concentrations of nutrients in Changjiang water (Wang, 2006; Li et al., 2007).
In this study, we simulated the changes in nutrient conditions and primary production in the ECS in response to changes in Changjiang discharge and nutrient concentrations using a three-dimensional low- trophic biophysical model. This model has been used to simulate climatologic conditions of nutrient levels and primary production in the ECS (Zhao and Guo, 2011). By varying Changjiang discharge and nutrient concentrations, we were able to model the corresponding responses of low-trophic ecosystems in the ECS.
2 MODEL DESCRIPTION
The numerical model used in this study is based on a three-dimensional low-tropic biophysical model that has been used to calculate onshore oceanic nutrient fluxes from the Kuroshio across the shelf break of the ECS (Zhao and Guo, 2011). The model domain covers the Bohai Sea, Yellow Sea, and ECS(as shown in Fig.1). The model includes a hydrodynamic module and a biogeochemical module.The hydrodynamic module is based on that described by Guo et al. (2003) and Wang et al. (2008), which provides physical parameters such as water temperature, diff usion coefficients, and currents to the biogeochemical module. The biogeochemical module is based on NORWECOM (e.g., Aksnes et al., 1995;Skogen et al., 1995; Skogen and S?iland, 1998) and includes three different nutrients (DIN, DIP, and SIL),two types of phytoplankton (diatoms [DIA] and flagellates [FLA]), and two types of biogenic organic material (detritus [DET] and biogenic silica [SIS]).Information regarding equations and parameter values can be found in the report of Zhao and Guo (2011).Climatological forcing was used to reproduce seasonal variations in nutrient concentrations and primary production in the ECS, including monthly river discharge, heat flux, evaporation and precipitation rates, and ocean currents at open boundaries in the hydrodynamic module; river nutrient concentrations, atmospheric deposition, and nutrient concentrations at open boundaries in the biogeochemical module (Zhao and Guo, 2011).

Fig.1 Model domain and bathymetry
Changjiang discharge was monitored at the Datong Hydrological Station, which is located along the lower reaches of the Changjiang. The annual mean discharge of the Changjiang from 1960 to 2005 changed year to year, although there were no significant diff erences in the long-term trend (Fig.2a).For example, the lowest annual mean Changjiang discharge (~23 400 m3/s) occurred in 1978, and the highest annual mean discharge (~38 700 m3/s)occurred in 1998. The multi-year mean Changjiang annual discharge was ~28 500 m3/s from 1960 to 2005. The highest monthly mean discharge from 1960 to 2005 was in July, and the lowest was in January(Fig.2b). Similarly, the standard deviation of the monthly discharge was highest in summer and lowest in winter (Fig.2b). Most of the Changjiang discharge data (~95%) fell within ±2 standard deviations of the monthly mean (Fig.2b).
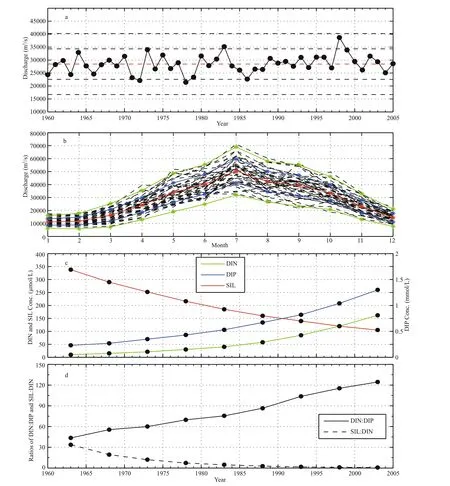
Fig.2 Time series of annual mean discharge of the Changjiang from 1960 to 2005 (a); monthly discharge of Changjiang from 1960 to 2005 (b); nutrient concentrations from 1963 to 2003 derived from Fig.2a of Wang (2006) (c); ratios of DIN to DIP and SIL to DIN from 1963 to 2003 (d)
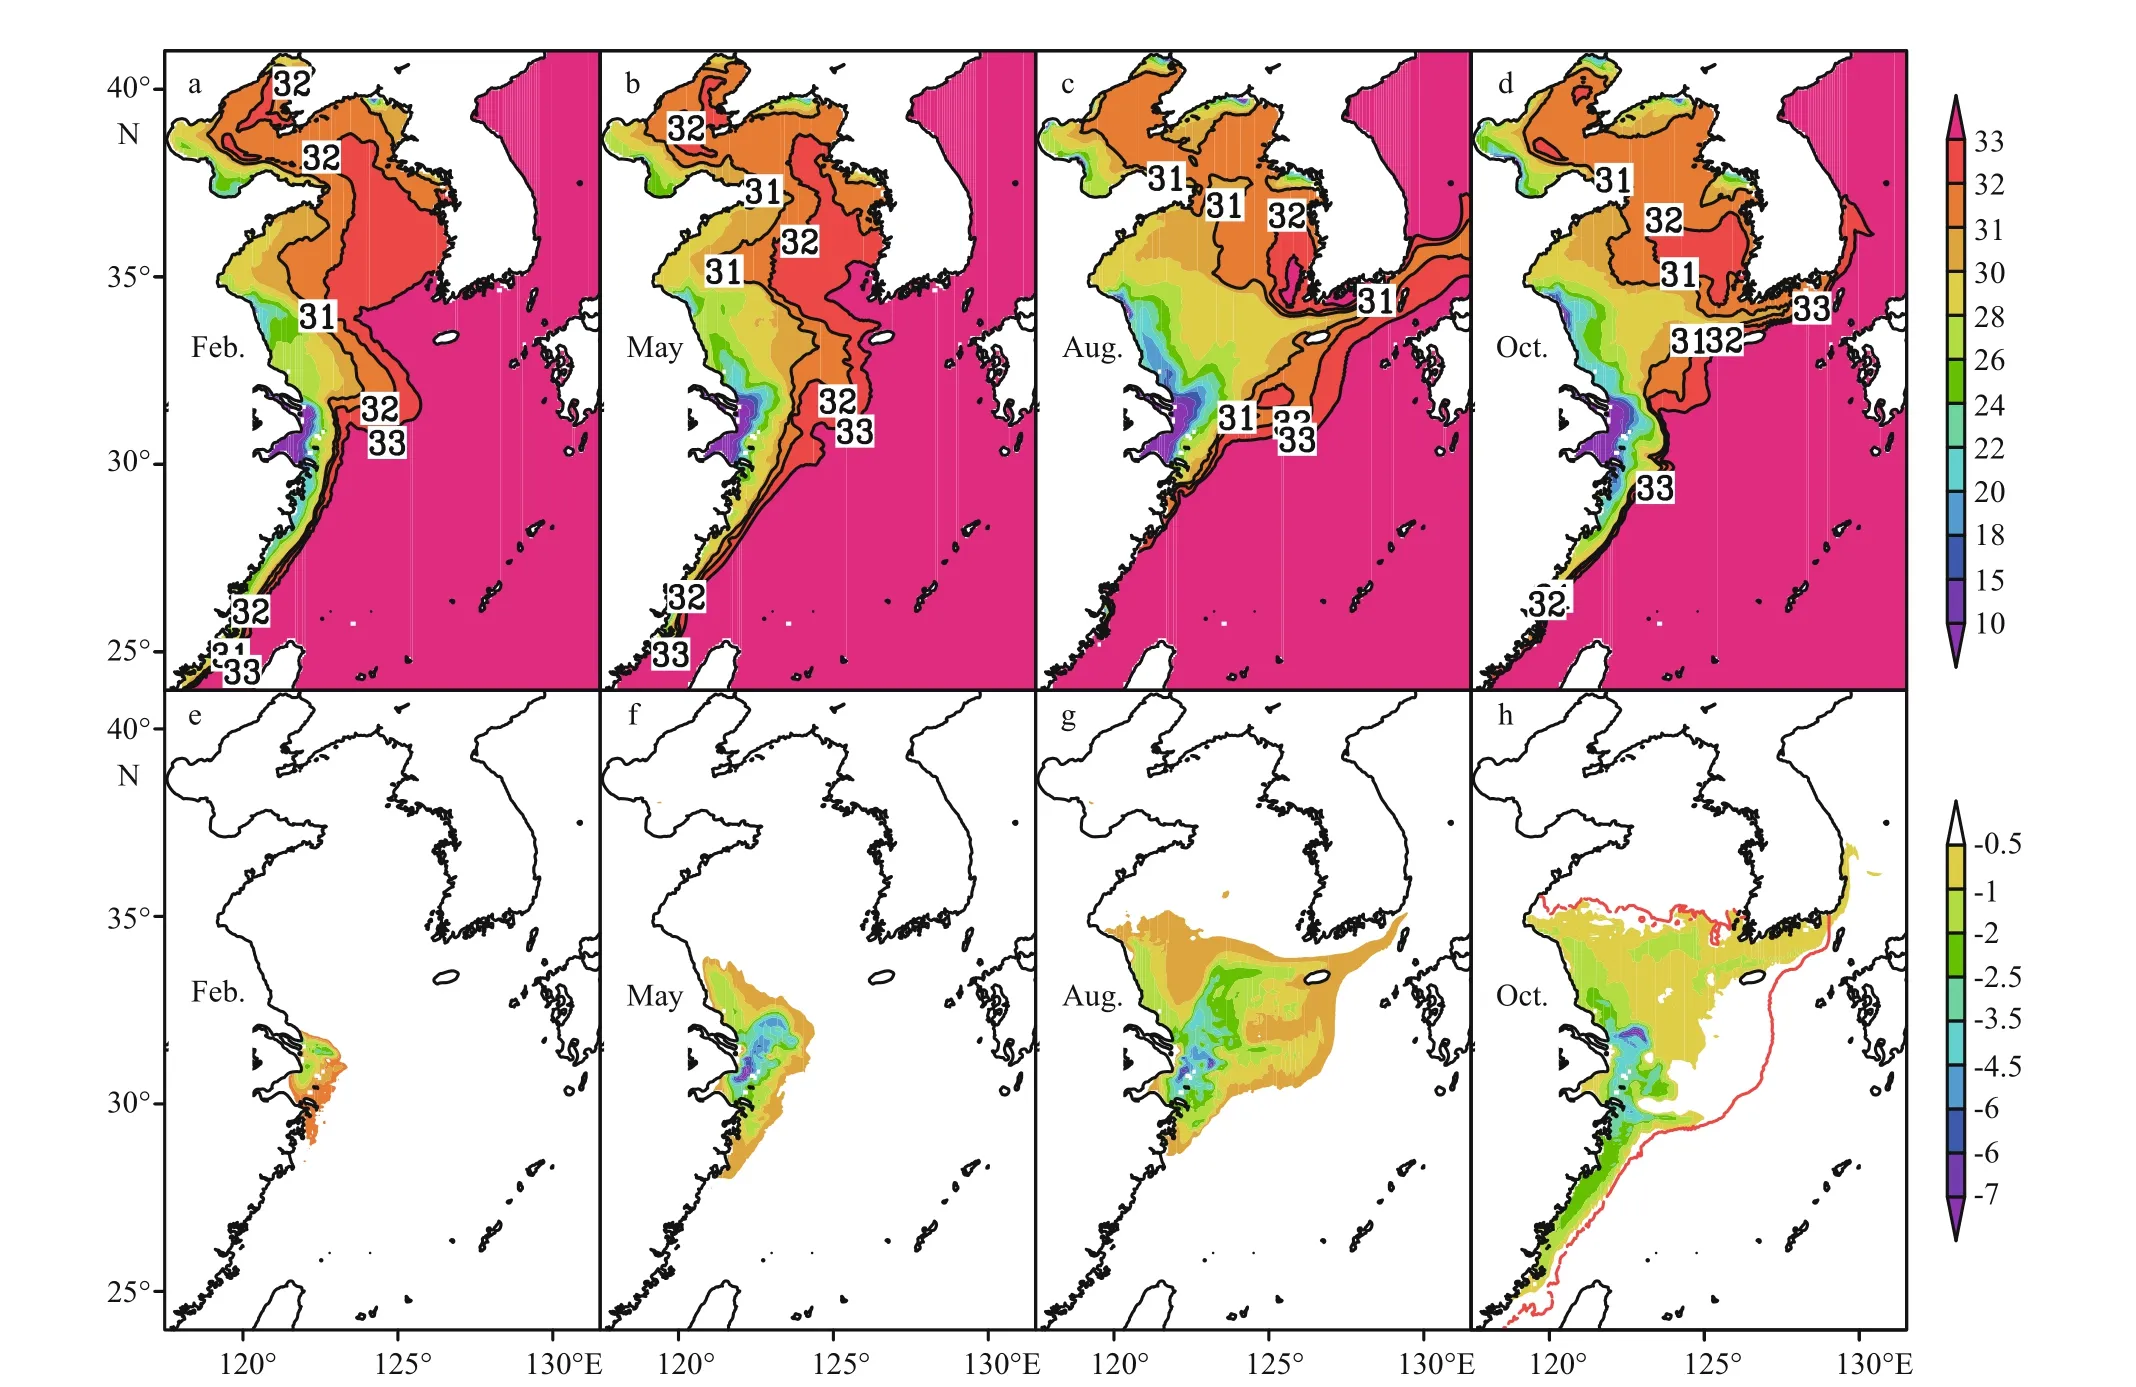
Fig.3 Horizontal distribution of sea surface salinity for case 10 (upper panel), and diff erence between cases 18 and 10 (lower panel) over four seasons
Concentrations of nutrients (DIN, DIP, SIL) from 1963 to 2003 were deduced from the report of Wang(2006). As shown in Fig.2c and as reported by Wang(2006), the concentrations of DIN and DIP increased from the 1960s to 2000s, whereas that of SIL decreased. Increasing of DIN to DIP ratio and decreasing of SIL to DIN ratio were apparent in this period (Fig.2d).
In this study, we used the monthly average Changjiang discharge (red line in Fig.2b) and intermediate nutrient concentrations (i.e., the nutrient concentrations in 1983 representing the period of 1981–1985) as the control case (case 10, Table 1).After 2 years of spin-up, when the nutrient concentrations and phytoplankton density in the ECS became seasonally stationary, we changed the Changjiang discharge and nutrient concentrations in the river water case by case (Table 1) and continued the simulations with the new conditions for one more year. These results were used to examine how nutrient conditions and primary production in the ECS respond to changes in Changjiang discharge and nutrient concentrations. The results of these modeling experiments in the third year are presented in section 3 below. It should be noted that only conditions pertaining to the Changjiang were changed in these experiments, and other forcing conditions remained the same in all of the cases.
3 MODELING RESULT AND DISCUSSIONS
As shown in Fig.3a–d in the control case, the surface salinity was much lower in the ECS shelf regions than in the outer shelf regions. Here, we used 31 isohaline as the salinity front for Changjiang diluted water. In the control case, Changjiang diluted water exhibited obvious seasonal variations: it is confined to the coastal area in winter (Fig.3a),gradually expands off shore to cover most areas of the northern ECS in summer (Fig.3b–c); and retreats toward the coast of China in autumn (Fig.3d). If the Changjiang discharge is increased by only two standard deviations (case 18), the change in salinity in the ECS in response to changes in river discharge can be examined based on the diff erence between cases 18 and 10 (Fig.3e–h). The salinity response also shows seasonal variations. Changes in salinity occur primarily near the river mouth in winter (Fig.3e). In spring, the area influenced by changes in river discharge becomes a little larger (Fig.3f), and by summer, the aff ected area covers most of the northern ECS, including the Tsushima Strait (Fig.3g). In autumn, increased Changjiang discharge not only decreases the salinity of the northern ECS, but also aff ects the southeast coast of China (Fig.3h). The eff ect observed in the northern ECS may be the result of cumulative changes occurring over the previous months, whereas that along the southeast coast of China is related to northerly winds during autumn.Therefore, the seasonal variations in Changjiang diluted water in our model are closely related to Changjiang discharge and wind direction, as suggested by Bai et al. (2014) in their explanation of interannual variations in ECS salinity as recorded by satellite observations.
Seasonal variations in DIN and total phytoplankton(PHY, sum of DIA+FLA) in the control case were examined by Zhao and Guo (2011). Here, we provide only a brief description of these variables in the surface layer, as the eff ects of Changjiang diluted water are primarily concentrated in the surface layer.In winter, concentrations of DIN, DIP, and SIL were high in the coastal areas of the Changjiang estuary(Fig.4a, e, and i). Phytoplankton concentrations were low (below 0.2 mg Chl-a/m3) in most of these areas,except for nearshore regions (Fig.4m). DET levels were high in the northern area of the Changjiang estuary due to intensified vertical mixing, whereas the SIS distribution was similar to that of DIN (Fig.4q and u). In May, wedge-shaped fronts of DIN and SIL formed off the Changjiang estuary (Fig.4b and j) due to consumption of DIN and SIL by phytoplankton in the central Yellow Sea and middle shelf of the ECS in early spring (Zhao and Guo, 2011), whereas DIP was depleted in most areas of the ECS (Fig.4f). High phytoplankton concentrations could be also found offthe Changjiang estuary (Fig.4n), where DET and SIS levels began to increase due to phytoplankton mortality (Fig.4r and v). In summer, high DIN and SIL levels could be found in the Tsushima Strait(Fig.4c and k) that corresponded to the low salinity distribution (Fig.3c). Phytoplankton levels in the Changjiang estuary were high at this time compared with the spring (Fig.4o). In autumn, high concentrations of DIN could be found north of Jeju Island, whereas the phytoplankton level began to decline. Levels of DET and SIS off the Changjiang estuary were highest in autumn.
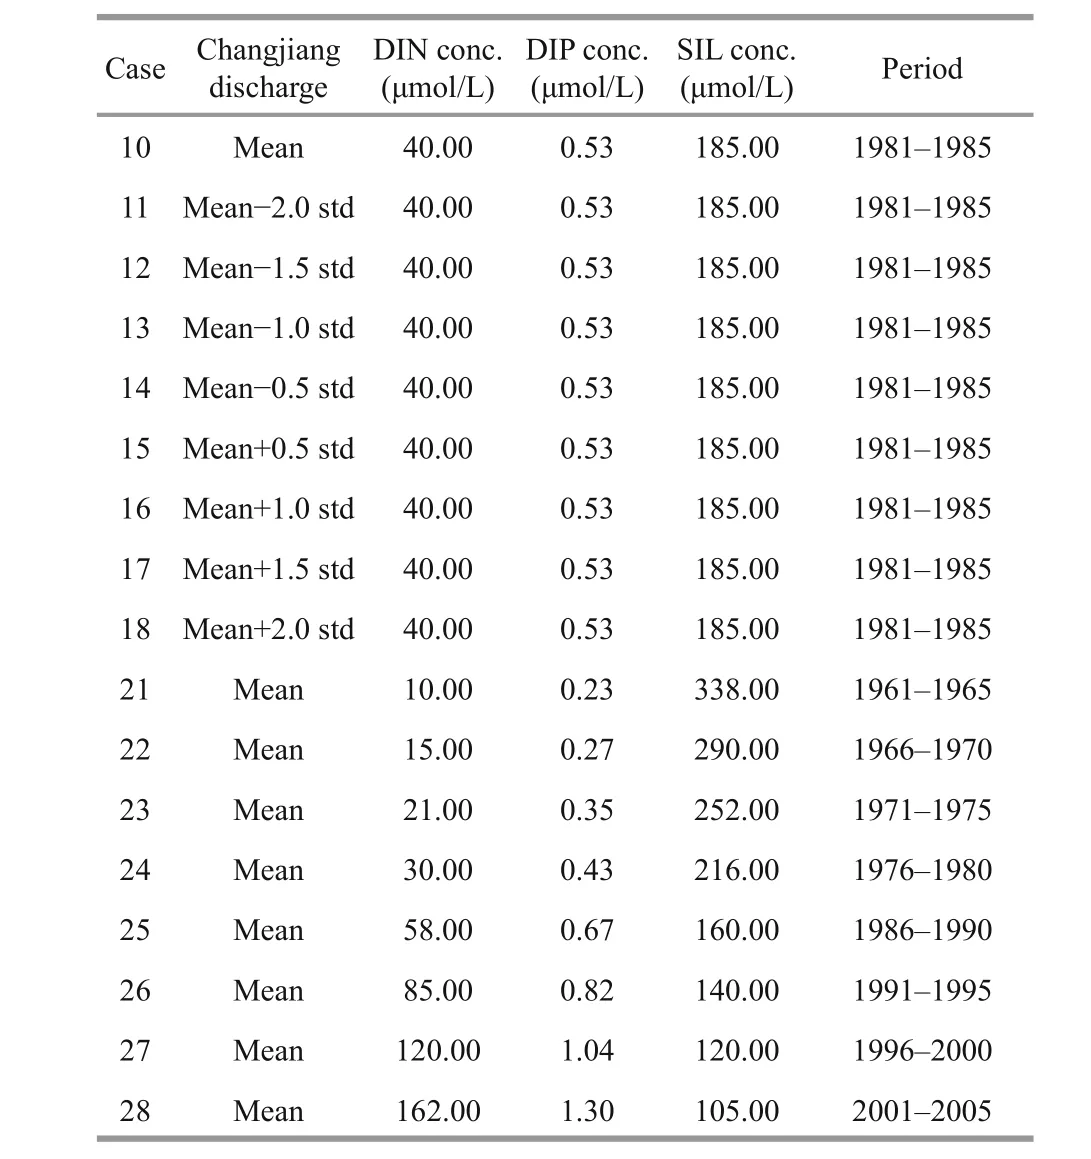
Table 1 Numerical experiments designed for this study
3.1 Changes in nutrient concentrations and ecosystem conditions in the ECS in response to changes in Changjiang discharge
By comparing cases 11–18 with case 10 (Table 1),we could examine the influence of Changjiang discharge on nutrient concentrations and ecosystem conditions. As an example, we discuss the diff erences between cases 18 and 10 (Fig.5).
When the Changjiang discharge was increased by two standard deviations, three elements of nutrients(i.e., DIN, DIP, and SIL), PHY, DET, and SIS in the surface layer of the ECS responded diff erently (Fig.5).Horizontal distributions similar to that for salinity(Fig.3e–h) were observed with respect to increased DIN (Fig.5a–d) and SIL (Fig.5i–l) in all four seasons,whereas only minimal changes in DIP were observed(Fig.5e–h). This indicates that DIN and SIL are relatively passive and can be transported off shore like freshwater. However, the increase in DIP was confined to an area near the Changjiang estuary (Fig.5e–h).Moreover, the horizontal distributions of PHY, DET,and SIL diff ered (Fig.5m–x).

Fig.4 Horizontal distribution of (a)–(d) surface DIN (units: μmol/L N), (e)–(h) DIP (units: μmol/L P), (i)–(l) SIL (units:μmol/L Si), (m)–(p) PHY (units: mg Chl- a/m 3), (q)–(t) DET (units: μmol/L N), and (u)–(x) SIS (units: μmol/L Si) for case 10 over four seasons
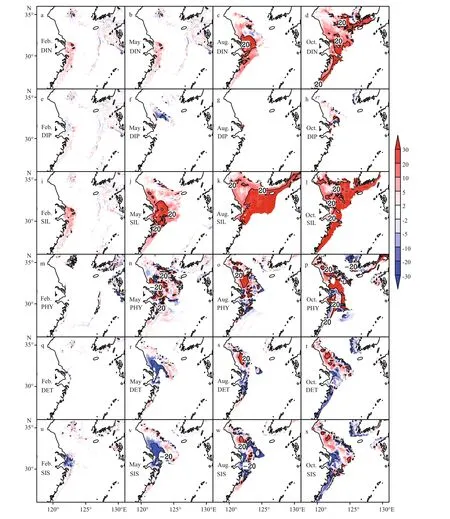
Fig.5 Horizontal distribution of the change in the percentage of (a)–(d) DIN, (e)–(h) DIP, (i)–(l) SIL, (m)–(p) PHY, (q)–(t)DET, and (u)–(x) SIS in the surface layer for case 18 compared with the control case (case 10) over four seasons
The diff erences in the response of each variable can be attributed to high DIN to DIP and SIL to DIN ratios in Changjiang freshwater, leading to high DIN to DIP and SIL to DIN ratios around the Changjiang estuary. Therefore, DIP is the limiting nutrient for photosynthesis, whereas DIN and SIL are in excess.DIP from the Changjiang is quickly consumed by phytoplankton, such that there is no excess to be transported far off shore.
Interestingly, phytoplankton levels did not always increase around the Changjiang estuary with increasing Changjiang discharge. Reductions in phytoplankton levels could be found in some areas close to the river mouth. Changes in temperature and current fields, which both directly and indirectly influence biological processes, could be responsible for lower phytoplankton levels. However, the hydrodynamic conditions of the river plume around the Changjiang estuary are very complex and cannot be addressed in detail by our model.
3.2 Changes in nutrient concentrations and ecosystem conditions in the ECS in response to changes in nutrient concentrations in Changjiang freshwater
By varying the nutrient concentrations from the 1960s to 2000s with an interval of 5 years while keeping the Changjiang discharge the same, we examined the responses of low-trophic ecosystems of the ECS to decadal changes in nutrient concentrations in Changjiang freshwater (cases 21–28). Figure 6 shows the diff erences between case 28 (nutrient concentrations in the 2000s) and case 10 (nutrient concentrations in the 1980s). Similar to the diff erences between cases 18 and 10, a similar pattern of increased DIN and similar seasonal variation (Fig.6a–d) were observed, but the range was large. This is because the DIN from the Changjiang in case 28 was ~4 times higher than that in case 10. Positive responses in PHY,DET, and SIS were observed around the Changjiang estuary (Fig.6m–x).
Without changes of Changjiang discharge,increases in DIP in river water were confined to near the river mouth (Fig.6e–h). The area of increased DIP was even smaller than the diff erence between cases 18 and 10. SIL was generally lower, and the distribution of percent change was similar but a little larger than the distribution of percent change in DIN.
As mentioned in the last subsection, higher DIP concentrations were only observed in a limited area near the Changjiang mouth, and no excess DIP was available to be transported far off shore due to rapid consumption by phytoplankton for photosynthesis.Furthermore, transformation of PHY into detritus due to mortality occurs on a time scale of days. As a result,we found similar monthly distributions of PHY, DET,and SIS off the Changjiang estuary.
3.3 Changes in the standing stock of each biogeochemical variable in the ECS in response to changes in the Changjiang
The area enclosed by the red line shown in Fig.3h was considered to be aff ected by the Changjiang diluted water and was thus used to calculate standing stocks of biogeochemical variables in our model. With changes in Changjiang discharge, the responses of DIN and SIL were almost linear, indicating that these two nutrients were in excess for photosynthesis (Fig.7). For example,for cases 11–18, which represent variations in Changjiang discharge from -2 standard deviations to+2 standard deviations, changes in the percentage of standing stock varied from approximately -4 to +4%for DIN, -7 to +7% for SIL, and -0.4 to +0.4% for DIP(Fig.7). Other variables showed non-linear responses,especially DET and SIS (Fig.7e and f). It is interesting to note that phytoplankton levels did not increase with increasing Changjiang discharge. As mentioned in Section 3.1 above, although an increase in Changjiang discharge results in higher load of dissolved nutrients,it also leads to a redistribution of the dissolved nutrients and changes the pre-existing relative ratios of nutrients,thus changing the composition of phytoplankton(results not shown). Changes in dissolved nutrient concentrations and phytoplankton levels could have contributed to the non-linear responses of DET and SIS. In addition, changes in hydrodynamic conditions that directly redistribute DET and SIS might also have contributed to this non-linear response, as shown in Fig.5. Moreover, increases in the DIN to DIP and SIL to DIN ratios (Fig.7g and h) from cases 11 to 18 also suggest that increases in Changjiang discharge aff ect the biogeochemical environment in the ECS, especially near the river mouth.
For cases 21–28, which were characterized by higher DIN and DIP loads and lower SIL load, the standing stocks of all variables except SIL increased substantially from the 1960s to 2000s (Fig.8). The decrease in SIL standing stock was caused by a decrease in SIL load from the Changjiang. Compared with the nutrient conditions in the 1980s, the DIN standing stock in the ECS increased by ~30%,although the DIN load from the Changjiang increased
more than 4 fold. Phytoplankton levels increased by~7%, with diff ering ratios of DIA and FLA. The levels of DET and SIS increased by only approximately 5 and 6%, respectively. This means that except for the increased DIN concentration in the ECS, a portion of the increased DIN load from the Changjiang was converted to phytoplankton via photosynthesis, while the other portion was converted to detritus due to phytoplankton mortality.
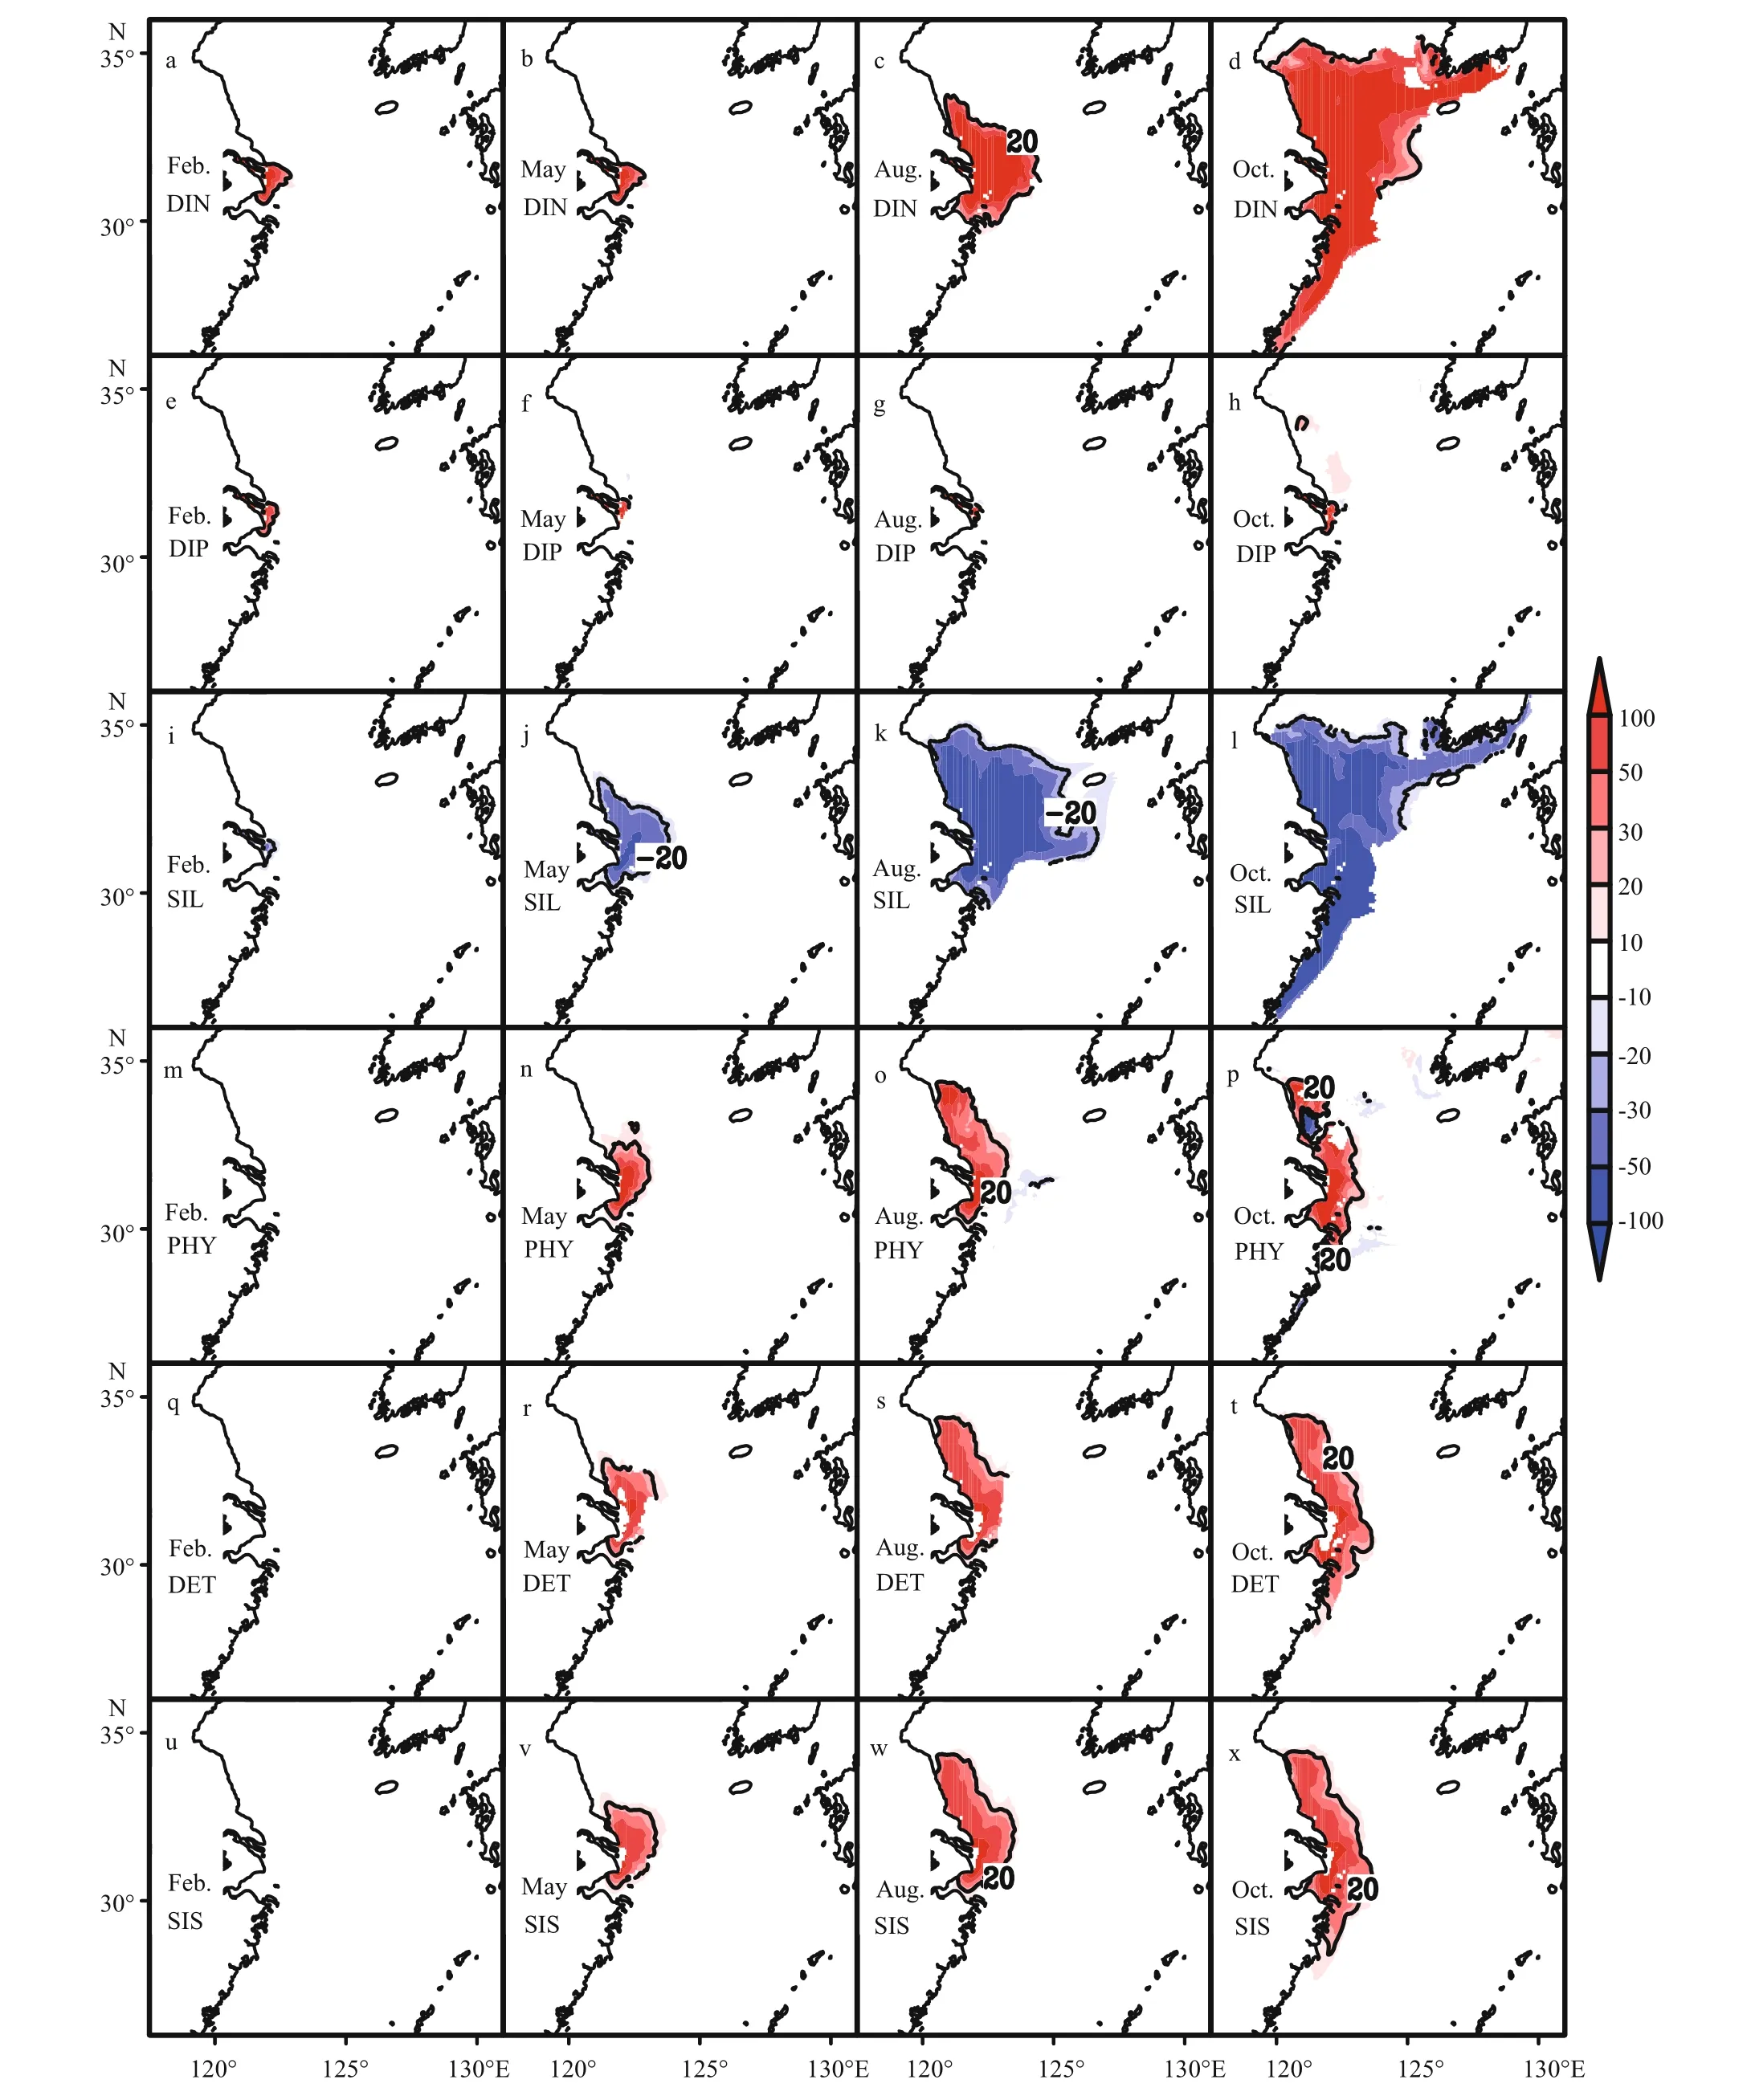
Fig.6 Horizontal distribution of the change in the percentage of (a)–(d) DIN, (e)–(h) DIP, (i)–(l) SIL, (m)–(p) PHY, (q)–(t)DET, and (u)–(x) SIS in the surface layer for case 28 compared with the control case (case 10) over four seasons
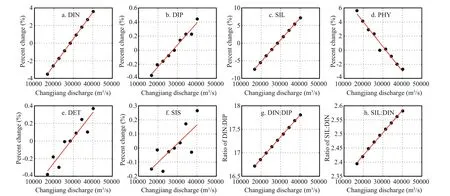
Fig.7 Response of the annual mean standing stock of each variable in the ECS to changes in Changjiang discharge
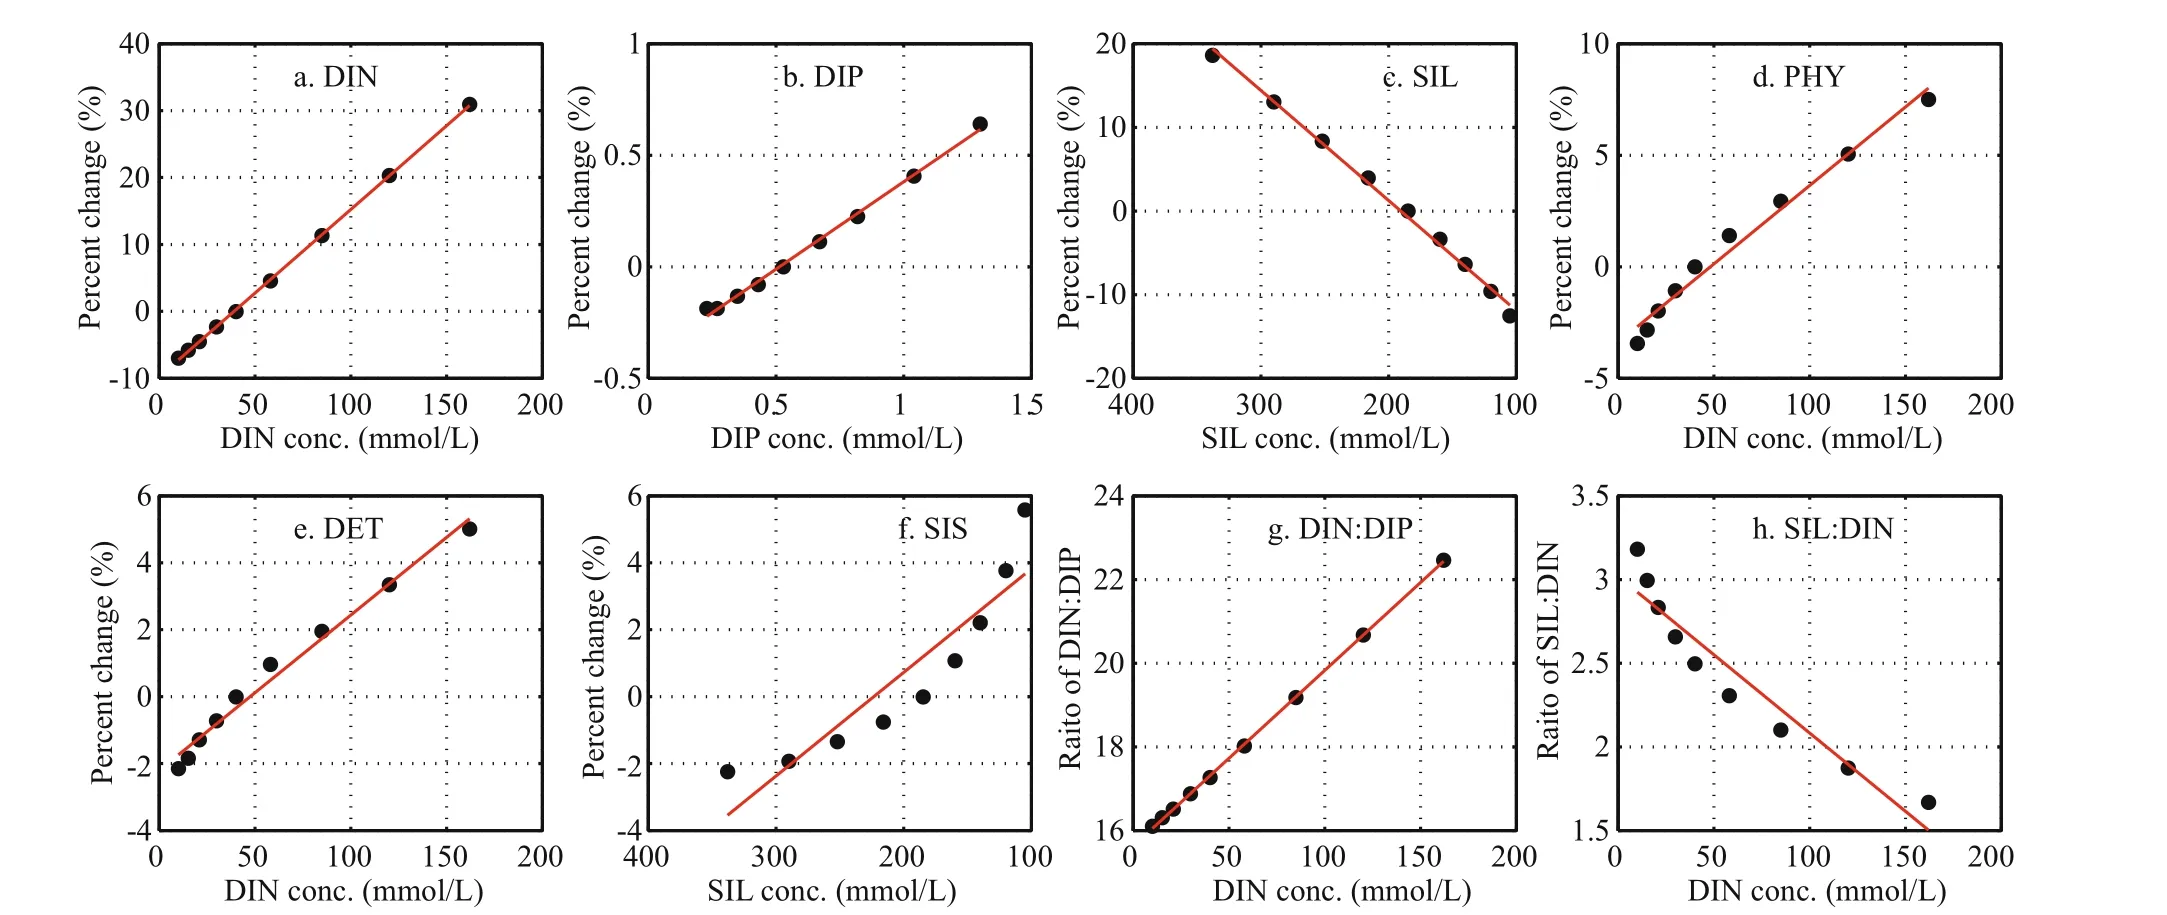
Fig.8 Response of the annual mean standing stock of each variable in the ECS to changes in nutrient concentrations in Changjiang freshwater
In our model, increased DIN and DIP loads and decreased SIL load enhanced photosynthesis in the Changjiang estuary, consistent with other reports (Li et al., 2007). As mentioned above, long-term changes in nutrient concentrations in Changjiang freshwater may be suffi cient in and of themselves to explain degradation of the ECS ecosystem, although the responses of the ecosystem to changes in Changjiang discharge are more complex.
Fig.9 Response of annual mean sediment accumulation in (a) cases 10–18 and (b) case 10 and cases 21–28
4 INTEGRATION OF DATA FROM CORE SAMPLES COLLECTED AROUND THE CHANGJIANG ESTUARY
In our model, terrestrial sediment (include organic materials and other suspended materials) was not considered. Nevertheless, changes in oceanic sediment in the ECS, especially around the Changjiang estuary, were sensitive to changes in Changjiang discharge and nutrient concentrations. Although the annual mean sediment accumulation rate only changed ±4% (Fig.9a) with changes in Changjiang discharge, most areas of the ECS and Yellow Sea were aff ected (Fig.10e–h). Responses as a result of changes in only nutrient concentrations of Changjiang freshwater were relatively simple and were distributed primarily near the Changjiang estuary (Fig.10i–l).That is to say, the horizontal distribution of the sediment accumulation rate was more complex when realistic year to year conditions of the Changjiang were examined.
Most previous studies used a mean sediment accumulation rate in the ECS for the interpretations of core sample data. For example, Chen and Wang(1999) used a value of 0.2±0.06 g cm2/yr to calculate the nutrient and carbon budgets for the ECS. There are two problems with this methodology, however.First, the sediment accumulation rate in the ECS has large spatial variations, as suggested by Deng et al.(2006) and also by our modeling results. Sediment accumulation in the Changjiang estuary and inner shelf regions accounted for 59% of the total sediment accumulation in the ECS, whereas that in the outer shelf regions accounted for only 7% (Deng et al.,2006). Second, the sediment accumulation rate also has large seasonal and interannual variations,especially near the Changjiang estuary and inner shelf regions, as suggested by our results. For example, the sediment accumulation rate was low in winter due to low primary production and high in spring and summer as a result of intensified primary production.Moreover, sediment accumulation rate was sensitive to change in the Changjiang river discharge and nutrient concentration therein. Therefore, estimates of sediment accumulation rates over such large area of the ECS must take into careful consideration spatialtemporal variations in the ECS.
Bai Y, He X Q, Pan D L, Chen C T A, Kang Y, Chen X Y, Cai W J. 2014. Summertime Changjiang River plume variation during 1998-2010.J.Geophys.Res.,119(9):6 238-6 257.
Beardsley R C, Limeburner R, Yu H, Cannon G A. 1985.Discharge of the Changjiang (Yangtze River) into the East China Sea.Cont.ShelfRes.,4(1-2): 57-76.
Chen C T A, Wang S L. 1999. Carbon, alkalinity and nutrient budgets on the East China Sea continental shelf.J.Geophys.Res.,104(C9): 20 675-20 686.
Chen C T A. 1996. The Kuroshio intermediate water is the major source of nutrients on the East China Sea continental shelf.Oceanol.Acta,19(5): 523-527.
Chen C T A. 2009. Chemical and physical fronts in the Bohai,Yellow and East China seas.J.Mar.Syst.,78(3): 394-410.
Chung S W, Jan S, Liu K K. 2001. Nutrient fluxes through the Taiwan Strait in spring and summer 1999.J.Oceanogr.,57(1): 47-53.
Deng B, Zhang J, Wu Y. 2006. Recent sediment accumulation and carbon burial in the East China Sea.Global Biogeochem.Cycles,20(3): GB3014.
Duan S W, Zhang S. 2001. Material fluxes and their variations from the Changjiang River into the sea.In: Zhang S, Shen H T eds. Land-Sea Interaction in Estuaries of the Changjiang River, Zhujiang River and their Adjacent Sea Areas. China Ocean Press, Beijing, China. p.10-26. (in Chinese)
Gong G Q, Wen Y H, Wang B W, Liu G J. 2003. Seasonal variation of chlorophyllaconcentration, primary production and environmental conditions in the subtropical East China Sea.DeepSeaRes.IITop.Stud.Oceanogr.,50(6-7): 1 219-1 236.
Guo X Y, Hukuda H, Miyazawa Y, Yamagata T. 2003. A triply nested ocean model for simulating the Kuroshio—roles of horizontal resolution on JEBAR.J.Phys.Oceanogr.,33(1): 146-169.
Kim T W, Lee K, Najjar R G, Jeong H D, Jeong H J. 2011.Increasing N abundance in the northwestern Pacific Ocean due to atmospheric nitrogen deposition.Science,334(6055): 505-509.
Li M T, Xu K Q, Watanabe M, Chen Z Y. 2007. Long-termvariations in dissolved silicate, nitrogen, and phosphorus flux from the Yangtze River into the East China Sea and impacts on estuarine ecosystem. Estuar. Coast. Shelf Sci.,71(1-2): 3-12.

Fig.10 Horizontal distribution of sediment accumulation rate of (a)–(d) case 10, (e)–(h) diff erence between cases 18 and 10,and (i)–(l) diff erence between cases 28 and 10
Liu S M, Hong G H, Zhang J, Ye X W, Jiang X L. 2009.Nutrient budgets for large Chinese estuaries.Biogeosciences, 6(10): 2 245-2 263.
Morimoto A, Watanabe A, Onitsuka G, Takikawa T, Moku M,Yanagi T. 2012. Interannual variations in material transport through the eastern channel of the Tsushima/Korea Straits. Prog. Oceanogr., 105: 38-46.
Skogen M D, S?iland H. 1998. A user’s guide to NORWECOM v2.0. A coupled 3 dimensional physical chemical biological ocean-model. The NORWegian Ecological Model system. Bergen, Institute of Marine Research, 42,Technical Report Fisken og Havet 18/98.
Skogen M D, Svendsen E, Berntsen J, Aksnes D, Ulvestad K B. 1995. Modelling the primary production in the North Sea using a coupled three-dimensional physical-chemicalbiological ocean model. Estuar. Coast. Shelf Sci., 41(5):545-565.
Wang B D. 2006. Cultural eutrophication in the Changjiang(Yangtze River) plume: history and perspective. Estuar.Coast. Shelf Sci., 69(3-4): 471-477.
Wang Q, Guo X Y, Takeoka H. 2008. Seasonal variations of the Yellow River plume in the Bohai Sea: a model study. J.Geophys. Res., 113(C8): C08046.
Yamaguchi H, Ishizaka J, Siswanto E, Baek Son Y, Yoo S,Kiyomoto Y. 2013. Seasonal and spring interannual variations in satellite-observed chlorophyll- a in the Yellow and East China Seas: new datasets with reduced interference from high concentration of resuspended sediment. Cont. Shelf Res., 59: 1-9.
Zhang J. 1996. Nutrient elements in large Chinese estuaries.Cont. Shelf Res., 16(8): 1 023-1 045.
Zhang X L, Fan D J, Wang H J, Yang Z S. 2014. Water discharge variability of Changjiang (Yangtze) and Huanghe (Yellow) Rivers and its response to climatic changes. Chin. J. Oceanogr. Limnol., 32(6): 1 392-1 405.
Zhao L, Guo X Y. 2011. Influence of cross-shelf water transport on nutrients and phytoplankton in the East China Sea: a model study. Ocean Sci., 7(1): 27-43.
猜你喜歡
十幾歲(2021年5期)2021-11-22 23:37:22
湘潮(2021年12期)2021-04-15 22:38:41
河北畫(huà)報(bào)(2020年10期)2020-11-26 07:20:58
民間故事選刊·上(2020年10期)2020-10-20 05:48:14
趣味(語(yǔ)文)(2020年3期)2020-07-27 01:42:44
水動(dòng)力學(xué)研究與進(jìn)展 B輯(2018年4期)2018-09-28 05:34:08
Journal of Oceanology and Limnology(2018年1期)2018-04-02 03:03:54
科學(xué)之友(2018年12期)2018-02-24 08:22:14
遼河(2017年6期)2017-08-16 16:38:16
鴨綠江(2016年5期)2016-04-29 13:06:31
 Journal of Oceanology and Limnology2018年1期
- Journal of Oceanology and Limnology的其它文章
- Editorial Statement
- Sedimentary architecture of the Holocene mud deposit offthe southern Shandong Peninsula in the Yellow Sea*
- Ferroan dolomites in Miocene sediments of the Xisha Islands and their genetic model*
- Synchronous response of sedimentary organic carbon accumulation on the inner shelf of the East China Sea to the water impoundment of Three Gorges and Gezhouba Dams*
- Rates and fluxes of centennial-scale carbon storage in the fine-grained sediments from the central South Yellow Sea and Min-Zhe belt, East China Sea*
- Centennial-scale records of total organic carbon in sediment cores from the South Yellow Sea, China*