
The IOD-ENSO precursory teleconnection over the tropical Indo-Pacific Ocean: dynamics and long-term trends under global warming*
2018-04-02 03:03:44YUANDongliang袁東亮HUXiaoyue胡曉悅XUPeng徐鵬ZHAOXia趙霞YukioMASUMOTOHANWeiqing韓衛(wèi)清
關鍵詞:徐鵬
YUAN Dongliang (袁東亮) , HU Xiaoyue (胡曉悅) XU Peng (徐鵬) ZHAO Xia (趙霞) Yukio MASUMOTO , HAN Weiqing (韓衛(wèi)清)
1 Key Laboratory of Ocean Circulation and Waves (KLOCW), and Institute of Oceanology, Chinese Academy of Sciences, and Qingdao National Laboratory for Marine Science and Technology, Qingdao 266071, China
2 University of Chinese Academy of Sciences, Beijing 100049, China
3 Qingdao Collaborative Innovation Center of Marine Science and Technology, Qingdao 266071, China
4 University of Tokyo, Tokyo, Japan
5 Department of Atmospheric and Oceanic Sciences, University of Colorado, Boulder, Colorado, USA
1 INTRODUCTION
Due to its large longitudinal span, the tropical Pacific and Indian Oceans play an important role in the variability and predictability of the global climate. The El Ni?o-Southern Oscillation (ENSO) and the Indian Ocean Dipole (IOD) are two dominant modes of interannual variations over the tropical Pacific and Indian Oceans, respectively, the interactions of which have received intensive attention. Early studies suggest that the interactions are through the Walker Circulation(Wu and Meng, 1998; Klein et al., 1999; Alexander et al., 2002; Behera and Yamagata, 2003; Clarke and Gorder, 2003; Lau and Nath, 2003; Wu and Kirtman,2004; Annamalai et al., 2005; Lau et al., 2005; Behera et al., 2006; Kug et al., 2006; Izumo et al., 2010; Luo et al., 2010), which is called the atmospheric bridge.Recent studies suggest that the precursory relation between IOD and ENSO at the one-year lead time is dominated by the Indonesian Throughflow (ITF)variability, which is called the oceanic channel (Yuan et al., 2011, 2013; Xu et al., 2013; Zhou et al., 2015).
The IOD-ENSO precursory relationship provides an opportunity for enhanced predictability of ENSO at the lead time of one year across the spring persistence barrier (Clarke and Gorder, 2003; Izumo et al., 2010; Luo et al., 2010; Yuan et al., 2011, 2013;Zhou et al., 2015). Statistically, about a half of the standard deviation of the cold tongue sea surface temperature anomalies (SSTA) can be predicted at the one-year lead if IOD is used as a precursor. Lag correlation analyses have suggested that sea level anomalies propagate from the eastern equatorial Indian Ocean to the western equatorial Pacific Ocean through the Indonesian seas, suggesting the oceanic channel dynamics leading to the enhanced predictability at the one-year lead time (Yuan et al.,2013, 2016; Xu et al., 2013; Xu and Yuan, 2015). In contrast, lag correlation analyses on the atmospheric bridge suggest no significant teleconnection at time lags longer than a season. So far, the oceanic channel dynamics have only been investigated in observations with scarce data in the Indonesian seas and in coarseresolution climate model simulations. No estimate of the penetration rate of the equatorial Kelvin waves from the equatorial Indian Ocean to the equatorial western Pacific Ocean has been provided. In this study, we use forced simulations of eddy-permitting global general ocean circulation models (OGCM) to diagnose the oceanic channel dynamics between IOD and ENSO. In addition, we use a continuously stratified ocean model to investigate the dynamics of the Kelvin wave propagation through the Indonesian seas and to estimate the penetration rate for the Kelvin wave propagation.
Previous studies have suggested that the intraseasonal, semiannual, and annual Indian Ocean baroclinic Kelvin waves can propagate into the Indonesian Seas along the Sumatra-Java island chain(Molcard et al., 2001; Pujiana et al., 2009; Susanto et al., 2012). Drushka et al. (2010) suggest that the intraseasonal waves propagate downward along the ray path and will be blocked by the Lombok Strait sill depth if they travel across a long distance. It is not clear whether the interannual waves can reach and modulate the Pacific Ocean circulation. In this paper,we use the high-resolution OGCM simulations to investigate the IOD-ENSO teleconnection in the period of 1990 to 2008 to complement the observational analysis of Yuan et al. (2013).
The IOD-ENSO teleconnection is found to have decadal and multi-decadal variations (Xu et al., 2013;Izumo et al., 2014; Xu and Yuan, 2015; Xu and Yuan,2016; Yuan et al., 2017). No investigation of the centennial trend of the teleconnection has been conducted so far. Analyses by Yuan et al. (2013, 2017)and Xu and Yuan (2015, 2016) have shown that the period since the 1990’s is in the positive phase (strong precursory relation) of the decadal variability of the teleconnection. We will use the observed SSTA and the Coupled Model Intercomparison Project phase 5(CMIP5) simulations to investigate the centennial trend of the IOD-ENSO teleconnection under global warming.
The paper is organized as the following. Section 2 introduces the observational data and the model simulations used in the study. Section 3 presents the results of the lag correlation analyses of the Ocean General Circulation Model for the Earth Simulator(OFES) and Hybrid-Coordinate Ocean Model(HYCOM) simulations during 1990–2008, which are compared with the analyses based on observational data. Results from a simple linear continuously stratified ocean model experiments are presented in Section 4. The centennial trends of the IOD-ENSO teleconnections are investigated in Section 5.Conclusions are summarized in Section 6 of this paper.
2 DATA AND MODEL
2.1 Observation
The Hadley Centre Global Sea Ice and Sea Surface Temperature (HadISST) data used in this study cover the global ocean with a 1° longitude by 1° latitude resolution from 1870 to near present (Rayner et al.,2003). The extended reconstruction of global SST(ERSST V3b) data covers the global ocean on a 2°×2°horizontal grid from 1854 to present (Smith et al.,2008). The Kaplan SST (Version 2.0) data cover the global ocean on a 5°×5° grid from 1856 to present(Kaplan et al., 1998). The merged altimeter sea level data from the Aviso project cover the global oceans on a grid of 1/3° longitude by 1/3° latitude from 1993 to present. The subsurface temperature data from the Joint Environmental Data Analysis Center of the Scripps Institution of Oceanography (White, 1995)are on a grid of 5° longitude by 2° latitude at 11 levels in the equatorial Pacific Ocean from 1990 to 2003.The National Center for Environmental Prediction/National Center for Atmospheric Research (NCEP/NCAR) reanalysis surface zonal wind data are on a 2.5°×2.5° global grid from 1948 to present (Kalnay et al., 1996).
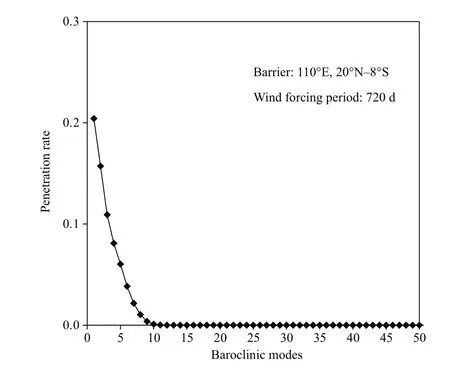
Fig.1 Amplitude penetration rates of the Kelvin wave in the idealized LCSM experiments (with the barrier extending to 8°S) depending on the baroclinic modes
2.2 The OFES and HYCOM model simulations
The monthly output from the OFES model simulations during 1990–2008 is used to calculate the lag correlations. The OFES model grid covers the global ocean from 75°S to 75°N with a horizontal resolution of 0.1° longitude by 0.1° latitude and stretched vertical coordinate of 54 levels from the sea surface to the depth of 6 065 m. The model was spun up with the climatological NCEP/NCAR reanalysis data for 50 years and was integrated with realistic wind and surface flux data since 1990 (Masumoto et al., 2004).
The Hybrid Coordinate Ocean Model (HYCOM,Halliwell et al., 1998; Bleck, 2002) with a horizontal resolution of 0.33° longitude by 0.33° latitude over the tropical Indo-Pacific oceans and 33 vertical layers from sea surface to 5 500 m is configured to the Indo-Pacific ocean basins from 30°E to 70°W, 55°S to 54.89°N. The model was spun up for 30 years using monthly climatology data from the Comprehensive Ocean-Atmosphere Dataset (Slutz et al., 1985). The European Center for Medium Range Weather Forecasts (ECMWF) 40 years reanalysis (ERA-40)wind data were used as the forcing for 1958–2001.From 2002 through 2008, the wind stress based on the QuikSCAT satellite scatterometer measurements is used as the forcing. More detailed descriptions of the model configuration can be found in Trenary and Han(2012, 2013). The model output for the period of 1990–2008 is used for this analysis, to be consistent with the OFES time series.
2.3 The linear continuously stratified model
Besides the OGCMs, which contain complete dynamics of the ocean circulation, a simple linear continuously stratified model (LCSM) is used to study the Kelvin wave propagation through the Indonesian Seas. This model is based on an averaged density profile of the tropical Indo-Pacific Ocean between 5°S and 5°N and is similar to the one described by Yuan and Han (2006). The model basin covers the domain between 20°S and 20°N and from 60°E to 160°E, with a barrier wall of the grid-size thickness extending from the northern boundary to the equatorial area at 110°E that separates the model domain into western and eastern basins. The two basins are connected only through the ocean south of the barrier wall. Sponge layers of 3° wide with a relaxation coeffi cients of 10-4/s are specified near the western boundary of the western basin and the eastern boundary of the eastern basin so that there are no reflections at these boundaries. The model horizontal resolution is 0.25° latitude by 0.25° longitude. The coeffi cients of the horizontal Laplacian and vertical mixing are 400 m2/s, and 1.3×10⁻⁸m2/s, respectively,which are very small and can be neglected for wave propagation study. The bottom of the LCSM is assumed to be flat at a depth of 4 000 m. The nonormal-flow and nonslip conditions are used at all boundaries. The Arakawa-C grid is adopted. Total 10 vertical modes are calculated for the LCSM, the solution of which is compared with the first baroclinic mode solution in the following text. Experiments suggest that the Kelvin wave penetration rate is essentially unchanged when the number of baroclinic modes is larger than 10 (Fig.1).
The model is also deployed over the tropical eastern Indian and western Pacific Oceans (60°E to 160°E, 20°S to 20°N) with a high horizontal resolution of 0.1° longitude by 0.1° latitude suffi cient to resolve the main passages within the Indonesian Seas. The sea-land mask of the Indonesian seas follows the 200 m isobath derived from the ETOPO1 bathymetry data. Sponge layers are specified at the western and eastern boundaries to suppress the reflections.
2.4 The CMIP5 simulations
The centennial model outputs used in this study are the historical simulations of CMIP5 (Meehl and Bony,2011), with both anthropogenic and natural forcing in the experiments. A set of HistoricalNat experiments have considered only the natural forcing. Both the Historical and HistoricalNat experiments have covered the period from the mid-19th century to the present. Depending on the available data, we chose to analyze 20 Historical and 7 HistoricalNat simulations in this study. Most of the models have a few ensemble experiments in the Historical and HistoricalNat simulations. For simplicity, only one of the ensemble experiments is analyzed for each model.
2.5 Statistical analysis
Indices in this study are as follows. The Ni?o3.4 index is the area-averaged SSTA in the equatorial central-eastern Pacific Ocean (5°S–5°N,170°W–120°W). The Dipole Mode Index (DMI) is the diff erence of area-averaged SSTA between the western (10°S–10°N, 50°–70°E) and the southeastern(10°S–Equator, 90°–110°E) tropical Indian Oceans(Saji et al., 1999).
Throughout the paper, the lag correlation is calculated between the anomalies over the Indo-Pacific Oceans in the following winter-fall seasons and the area-averaged oceanic anomalies in the southeastern tropical Indian Ocean (STIO in abbreviation, 10°S–Equator, 90°–110°E) in fall or the surface zonal wind anomalies (SZWA) over the far western equatorial Pacific (5°S–5°N, 130°–150°E) in fall. Boreal seasons are defined as winter (December to the next February), spring (March to May), summer(June to August), and fall (September to November)throughout this paper. We will call the IOD year Year 0 and the year following it Year+1. The confidence levels of the correlations are computed based on the Student’s- t test.
3 RESULT OF THE OGCM SIMULATIONS
In this section, the lag correlations of the IODENSO are calculated based on the OFES and HYCOM model simulations, which are compared with those based on observational analyses. The lag correlations of the atmospheric bridge in the wind forcing are also calculated and compared with the oceanic channel dynamics of the lag correlations.
3.1 Lag correlations of sea level anomalies
The lag correlations between the STIO sea level anomalies (SLA) in fall and the Indo-Pacific SLA in the following winter through fall seasons in the OFES and HYCOM simulations are compared with those of the satellite altimeter SLA during 1993–2008 (Fig.2).The lag correlations of both model simulations show east-west dipole patterns in the equatorial Indian and Pacific Oceans in winter, in good agreement with those based on satellite altimeter data. The dipole patterns are believed to be associated with the ENSO and IOD in the Pacific and Indian Oceans, which peaked in winter and fall, respectively. The lag correlations in the following spring through summer suggest propagation of SLA from STIO through the Indonesian seas into the western equatorial Pacific both in the models and in the observations. The movement and the narrow meridional width of the significant positive correlations suggest changes of the thermocline depth and subsurface temperature anomalies in the western and central-eastern equatorial Pacific Ocean by the arrival of the Kelvin waves in the summer and fall of Year +1. The above comparisons suggest that the oceanic channel dynamics are reproduced by the OGCM experiments.
The SLA lag correlations in the cold tongue in the fall of Year +1 are stronger and over a larger longitudinal domain in the OFES model, but weaker in the HYCOM model, than those in the observations.The diff erences may be due to errors of model parameterizations of the diff usion and sub-grid processes, which aff ect the amplitudes of the Kelvin wave propagation.
The Kelvin wave propagation appears independent of the ENSO events, because the lag correlations in the equatorial band of the Pacific Ocean remain significant even if the ENSO signals associated with the Ni?o3.4 index are removed. Partial correlation analyses show essentially the same propagation of the Kelvin waves associated with the IOD events (not shown). These analyses suggest that the oceanic channel dynamics are independent of the oceanatmosphere coupling within the tropical Pacific basin.
3.2 Subsurface lag correlations
The subsurface temperature anomalies are dominated by the thermocline movement and can be used to examine the Kelvin wave propagation. The simulated lag correlations between the surface temperature anomalies in STIO in fall and the subsurface temperature anomalies in the equatorial Pacific vertical section in the following winter through fall show an area of significant positive correlations propagating from the subsurface equatorial western Pacific to the central-eastern equatorial Pacific,consistent with the observational analyses (Fig.3).The oceanic channel dynamics are suggested by the propagation of the lag correlations in the subsurface equatorial Pacific Ocean both in the OGCM simulations and in the observations. The correlations also suggest that the subsurface anomalies reach the surface in the eastern Pacific cold tongue in the summer through fall of Year +1 to induce further ocean-atmosphere coupled evolution. The potential predictability of ENSO beyond the spring barrier apparently lies in the subsurface connections across the equatorial Pacific basin.
The propagation of the subsurface lag correlations remains unchanged even if the ENSO signals are removed from the anomalies (figure omitted),suggesting the independence of the oceanic channel dynamics from the tropical ocean-atmosphere coupling both in the model and in the observations.
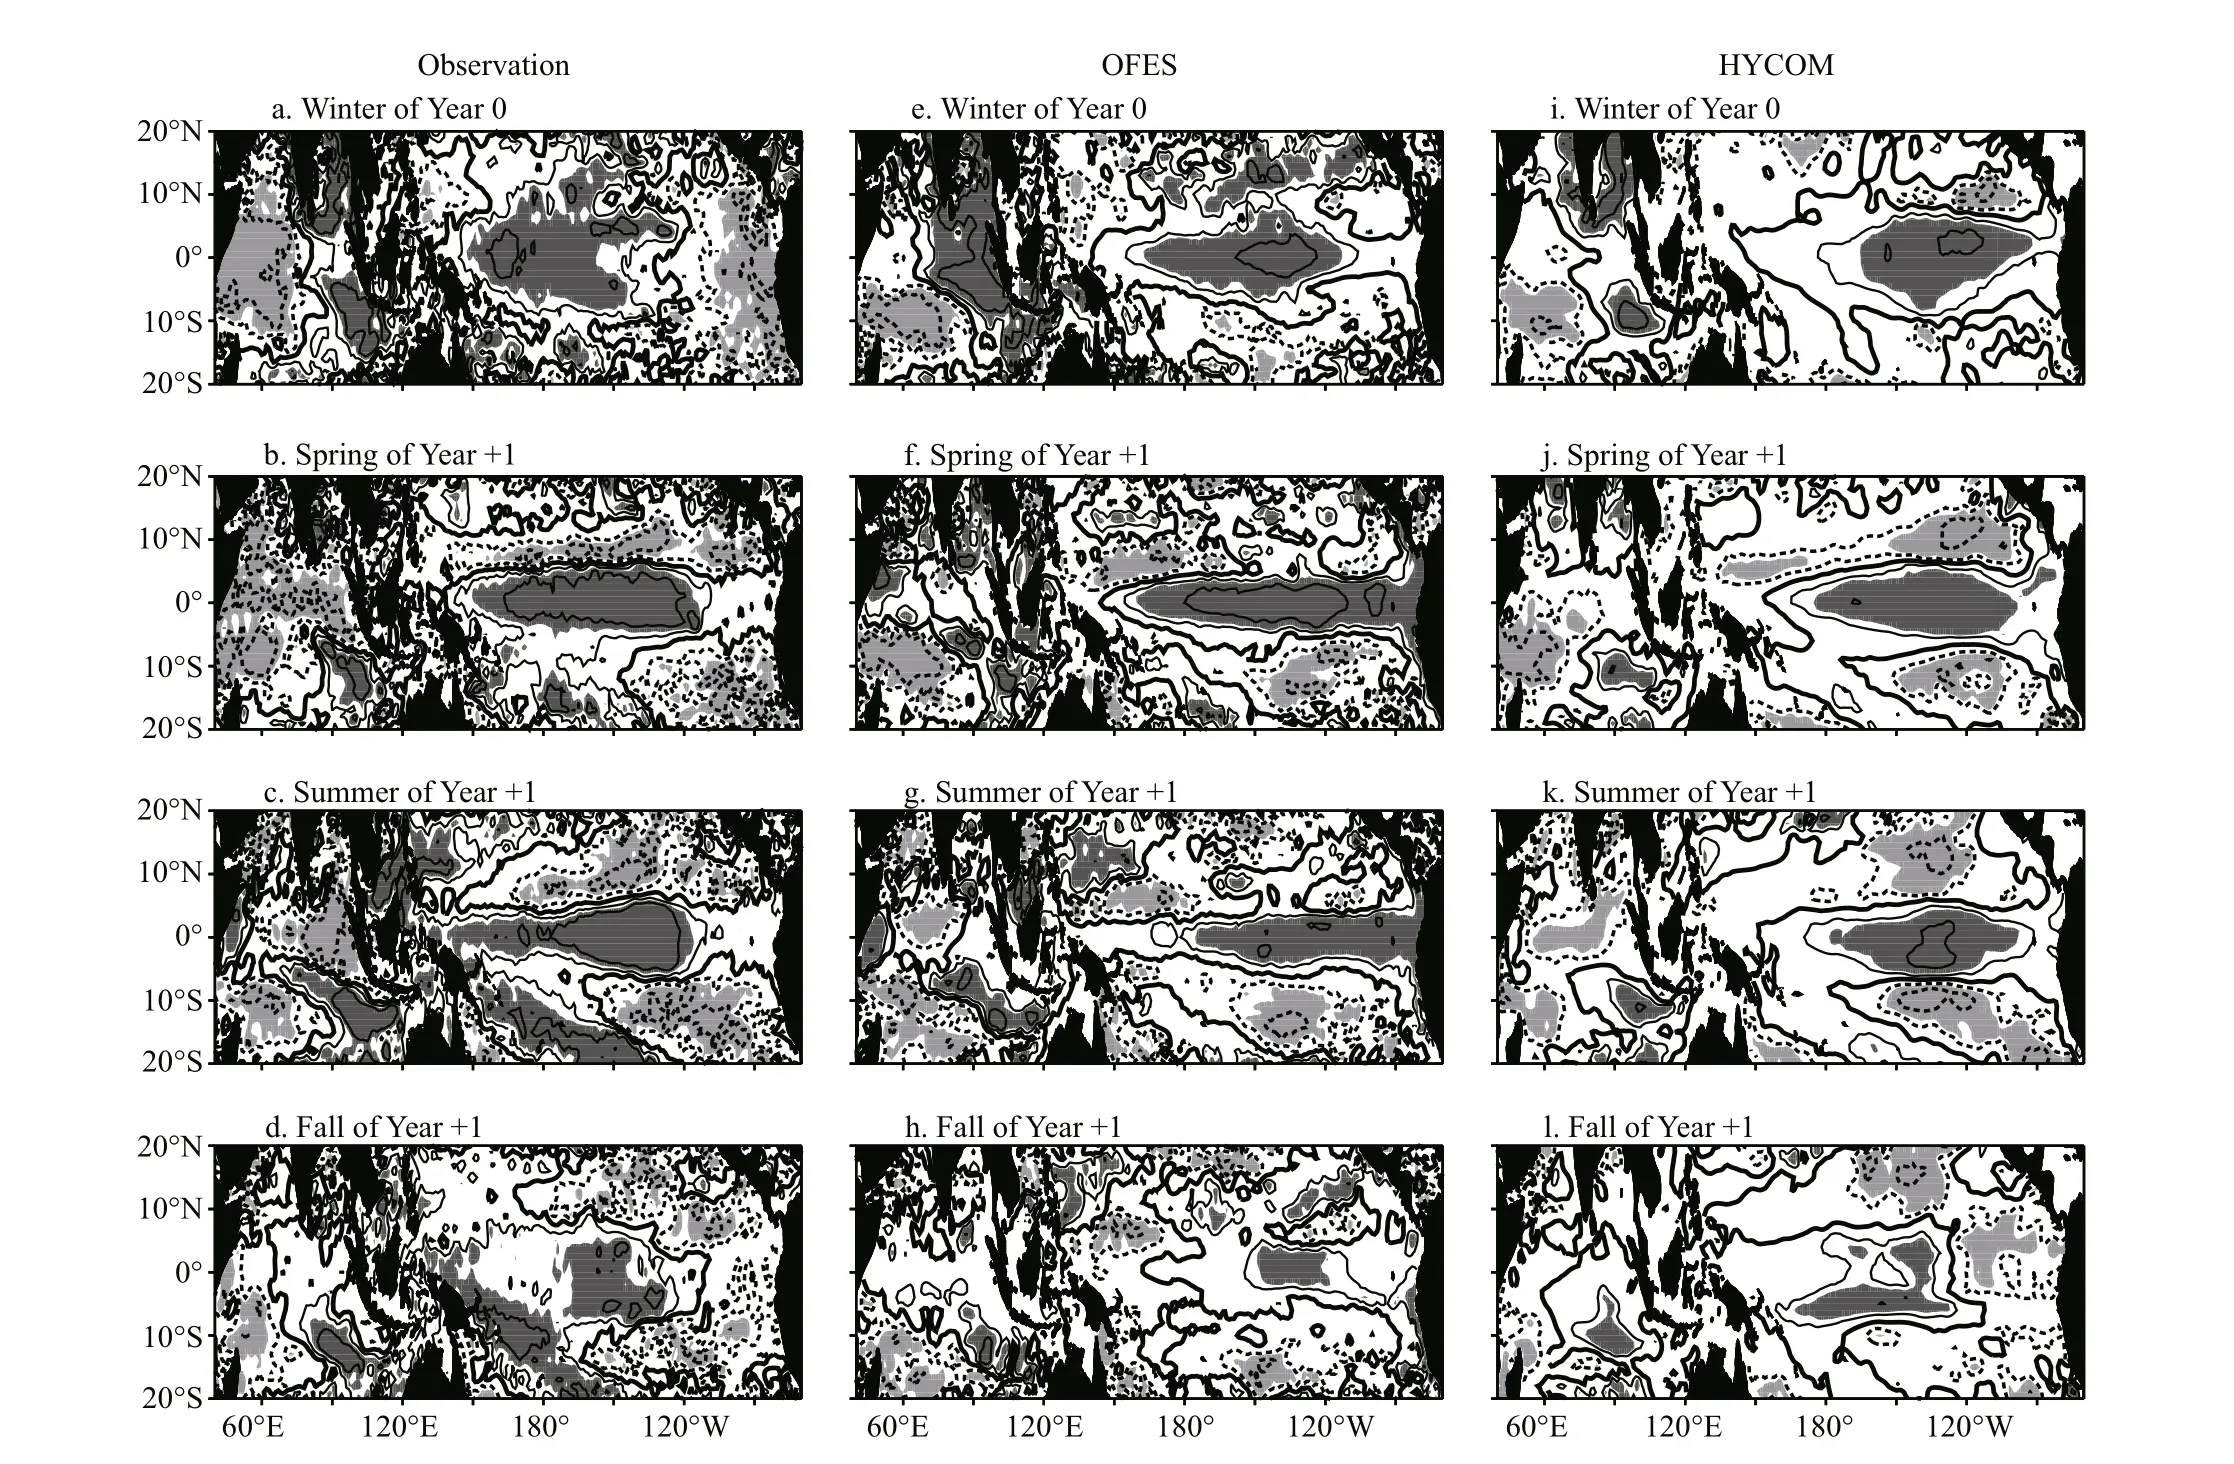
Fig.2 Comparisons of the observed and simulated lag partial correlations with the ENSO signals removed by OFES and HYCOM between the STIO SLA in fall and the tropical Indo-Pacific Ocean SLA in the following winter, spring,summer and fall
3.3 Eff ects of the atmospheric bridge
Lag correlations between the surface zonal wind anomalies (SZWA) over the western equatorial Pacific(130°–150°E, 5°S–5°N) in fall and the SLA over the Indian and Pacific Oceans in the following winter through fall are calculated to study the atmospheric bridge. The calculations in the observations and in the OFES and HYCOM model simulations are compared in Fig.4. The use of the SZWA instead of the DMI in the lag correlation analyses is to avoid incorporating the STIO upwelling anomalies associated with the IOD in the analysis. The results suggest that the NCEP/NCAR wind anomalies and the altimeter SLA in the cold tongue in the eastern equatorial Pacific are not significantly correlated at the time lag of one year,suggesting that the IOD precursory signal is not carried to the Pacific Ocean by the atmospheric bridge. The same insignificant lag correlations are reproduced in the OFES and HYCOM models, except that the simulated lag correlations are larger than in the observations. The diff erences suggest model defects.
The above results of the lag correlation analyses are consistent with the extensive investigations of the oceanic channel dynamics in the observational data and in the numerical experiments in the published literature (Yuan et al., 2013, 2016; Xu et al., 2013,2015). Those analyses are not repeated in this paper.
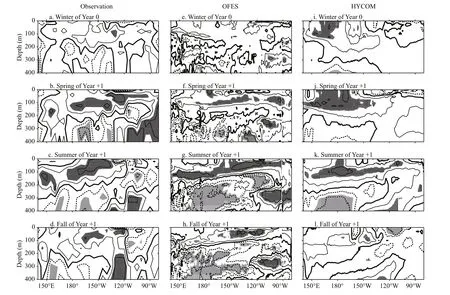
Fig.3 Comparisons of the lag partial correlation with the ENSO signals removed between STIO surface temperature anomalies in fall and the subsurface temperature anomalies in the Pacific equatorial vertical section in the following winter, spring, summer, and fall in the observations (left), OFES (middle), and HYCOM (right)
4 LCSM EXPERIMENT
4.1 Experiments with an idealized barrier
A patch of wind stress is specified in the western basin of the LCSM over the domain of (5°S–5°N,65°–95°E) with cosine and Gaussian profiles in the zonal and meridional directions, respectively, which oscillates at various periods from 60 to 720 days with an amplitude of 0.15 N/m2. Each experiment is integrated for 4 years to reach the periodic steady state (owing to no reflections at the western and eastern boundaries). The penetration rate of the Kelvin wave is defined as the ratio of the sea level in the eastern basin (150°E, 0°) in comparison to the sea level in the western basin (95°E, 0°) in the experiment without the barrier, which represents the Kelvin wave sea level in the western basin without the barrier reflections.
Experiments are conducted with the barrier extending from the northern boundary to the equator,4°S, 8°S, and 12°S, separately. The sea level amplitudes of the first baroclinic mode and of the total multimode simulations are compared in Fig.5. When the barrier extends to the equator, half of the wave energy propagates into the eastern basin due to symmetry with respect to the equator (Fig.5a, b). As the barrier extends further to the south, the sea level amplitudes in the eastern basin decrease (Fig.5c–h).This is because part of the Kelvin waves in the southern hemisphere is reflected into equatorial Rossby waves at the barrier, decreasing the sea level amplitudes reaching the eastern basin. The multimode reflection at the barrier is slightly higher than that of the first baroclinic mode waves.
The dependence of the penetration rate on the barrier length and on the periods of the forcing is investigated (Fig.6). When the barrier southern tip is at the equator, about 73% (equivalent to 50% of the wave energy) of the first baroclinic mode sea level reaches the eastern basin. The penetration rate for the multimode sea level is slightly smaller due to the larger diff usion on the higher modes. If the barrier extends to 8°S, about 22% of the first baroclinic mode sea level and 12%–15% of the multimode sea level amplitudes depending on the periods propagate to the eastern basin. If the barrier extends beyond 12°S, less than 15% (20% for periods shorter than 60 days) of the first baroclinic mode sea level and less than 10%of the multimode sea level amplitudes will be able to penetrate into the eastern basin. The penetration rates of the first baroclinic mode are nearly independent of the periods of the waves, whereas those of the multimode are more dispersive with the periods,especially when the barrier extension is in the vicinity of the equator (Fig.6). This is due to the downward propagation of Kelvin waves that is dependent on the frequency of the waves. The higher the frequency, the steeper downward propagation of the waves is.
The penetration rate of the interannual Kelvin wave sea level is found only sensitive to the latitude of the barrier southern tip, notwithstanding the shape of the barrier. In another set of the experiments, in which the barrier south of the equator is set to be at an angle of 45° from the equator, the penetration rate of the sea level amplitude is nearly the same as those in the experiments with a straight barrier, except for the intraseasonal waves, which are not sensitive to the barrier southern latitude beyond about 6°S due to the critical latitude at about 7°S. (Fig.7). The sole dependence of the penetration rate on the latitude ofthe barrier southern tip is further evidenced by the experiments with an L-shape barrier extending to diff erent southern latitudes (Fig.8). The penetration rate of the Kelvin sea level is nearly independent of the zonal barrier length for the interannual waves. In comparison, the multimode intraseasonal penetration rate is sensitive to the length of the barrier because of vertical propagation of these waves in the course of the propagation.
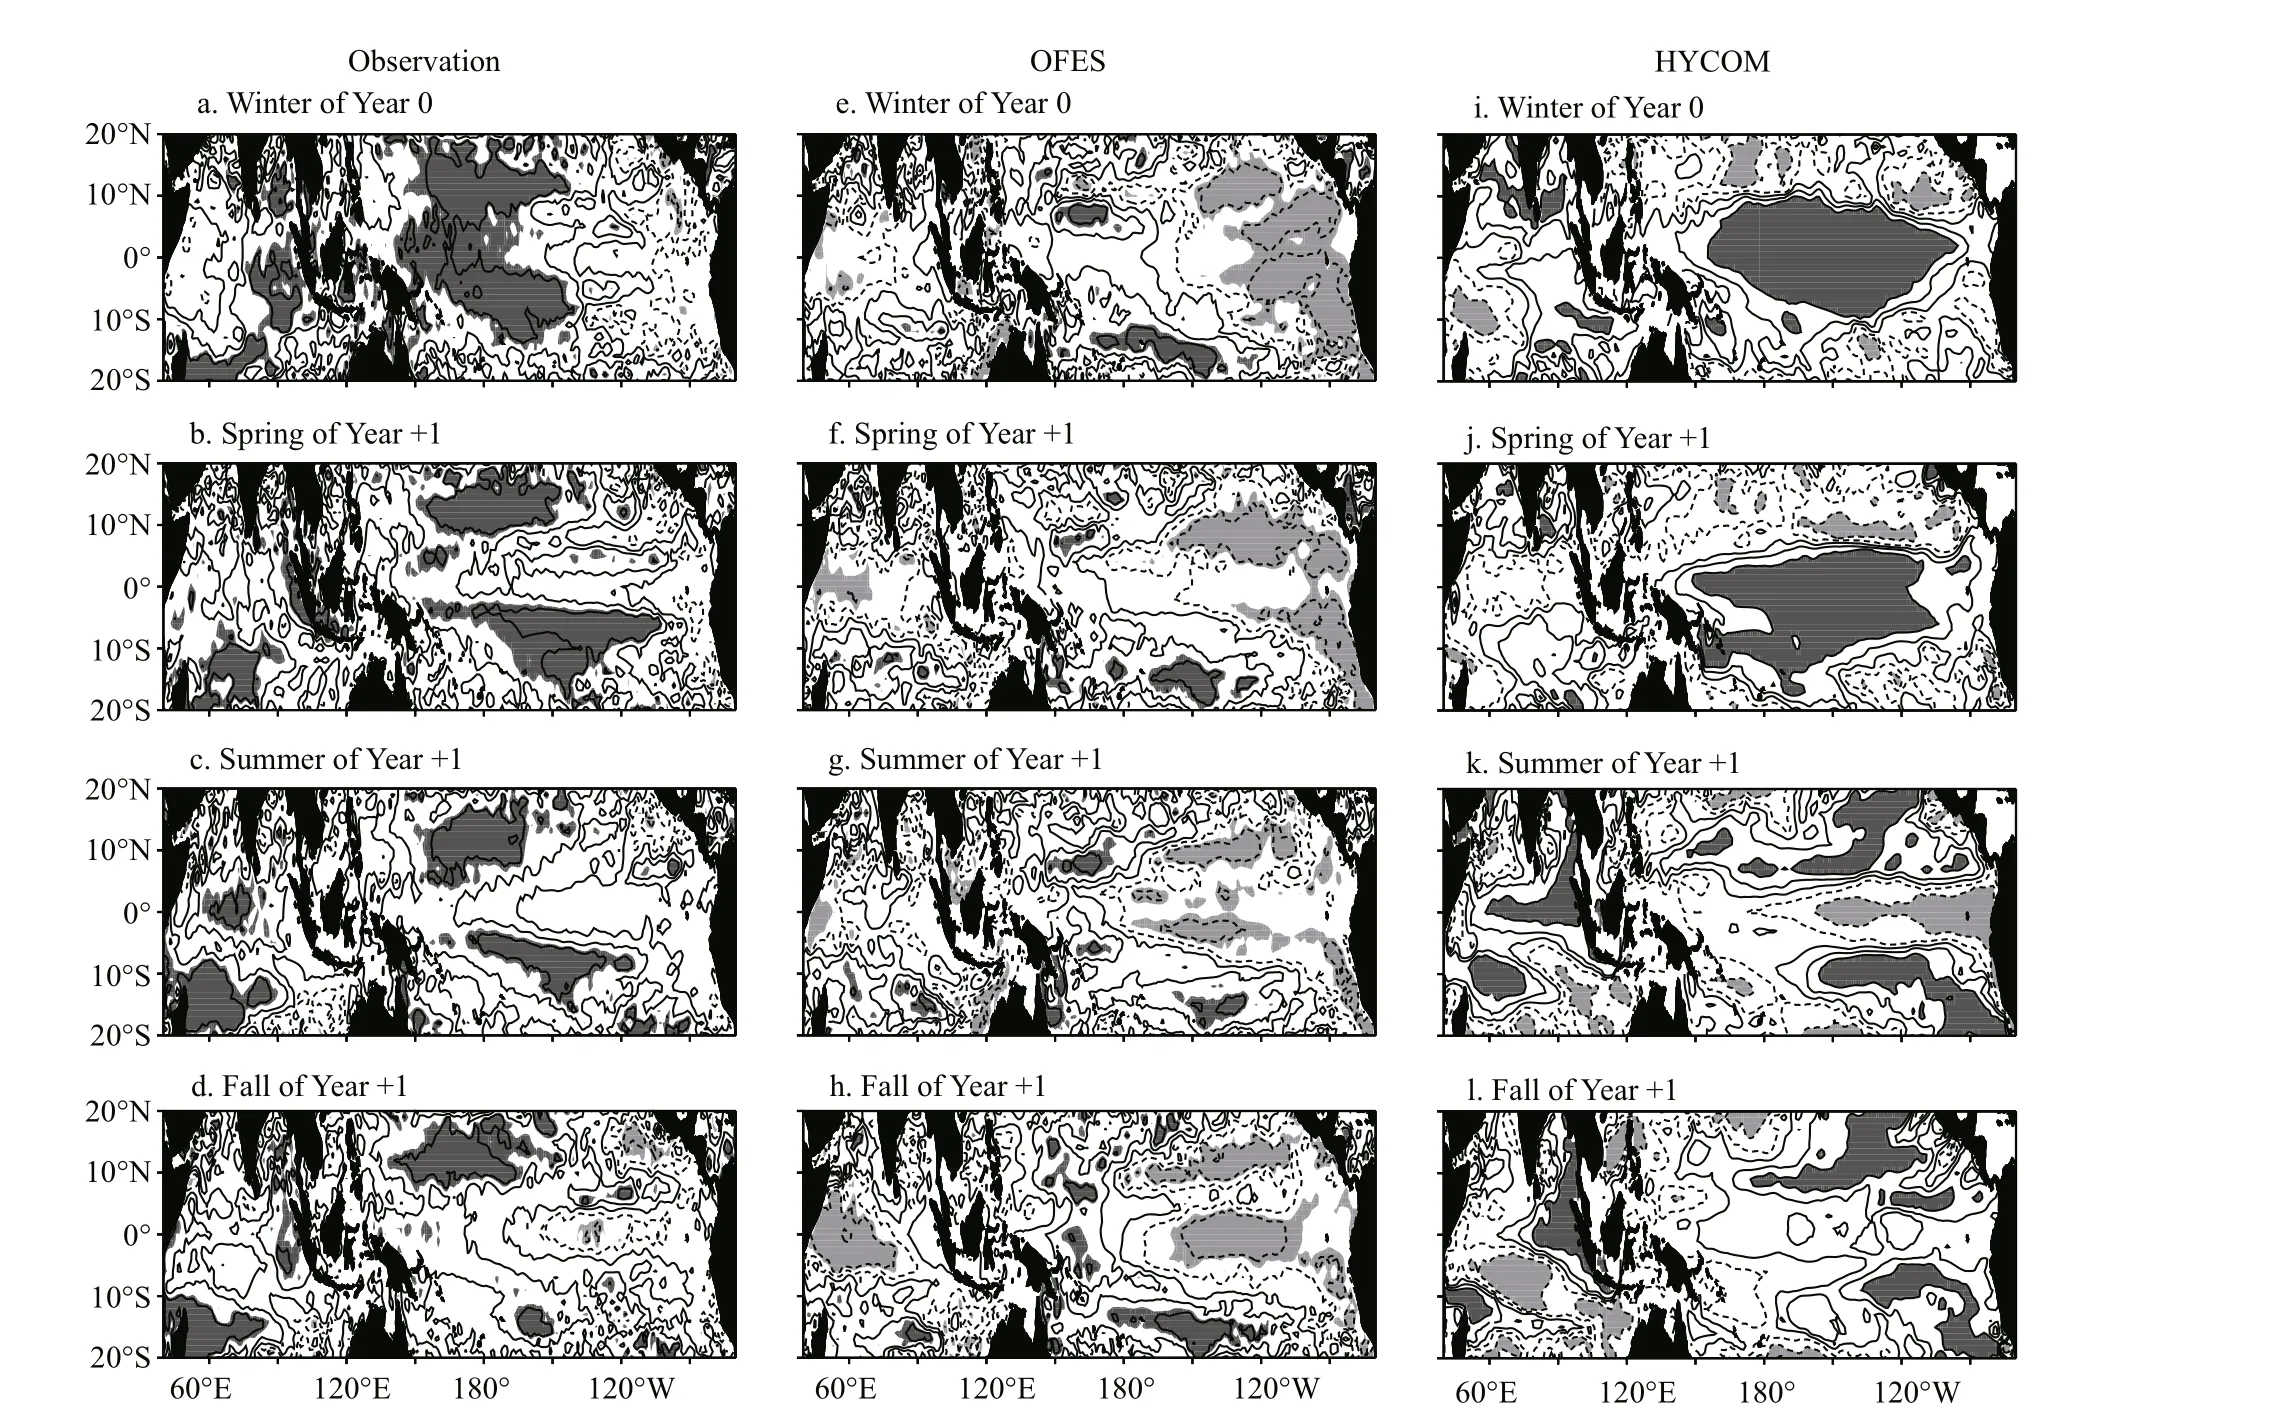
Fig.4 Comparison of lag partial correlation with the ENSO signals removed between SZWA over the far western equatorial Pacific Ocean in fall and the tropical Indo-Pacific Ocean SLA in the following winter, spring, summer, and fall in the observations (left), OFES (middle), and HYCOM (right)
When the L-shape barrier has a gap in the zonal part, part of the Kelvin wave energy will penetrate into the eastern basin through the gap. However, for the interannual and lower-frequency Kelvin waves,the penetration rate of the Kelvin wave sea level is not sensitive to the width of the gap (Fig.9), because the Kelvin wave speed is very fast so that the waves through the gap and those going around the end of the barrier interfere with each other constructively. For intraseasonal waves, these waves may interfere with each other destructively due to the phase diff erence of the diff erent routes of the propagation, hence the sensitivity to the partition of the wave energy through the gap. To examine the eff ects of the barrier length,yet another set of the experiments is conducted with diff erent lengths of the barrier east of the gap of 0.3°wide (Fig.10). The penetration rates of the intraseasonal Kelvin waves decrease significant with the eastern barrier length, suggesting destructive interference.

Fig.5 The sea level amplitude in the experiments using the first baroclinic mode (a, c, e, g) and LCSM (b, d, f, h) with a barrier extending from the northern boundary to the equator (a, b), 4°S (c, d), 8°S (e, f), and 12°S (g, h)
4.2 Experiments with realistic geometry of the Indonesian seas

Fig.6 The penetration rates depending on the barrier extensions ( x-coordinate) and on the periods of the forcing (line type) for the first baroclinic mode and the multimode sea level amplitude
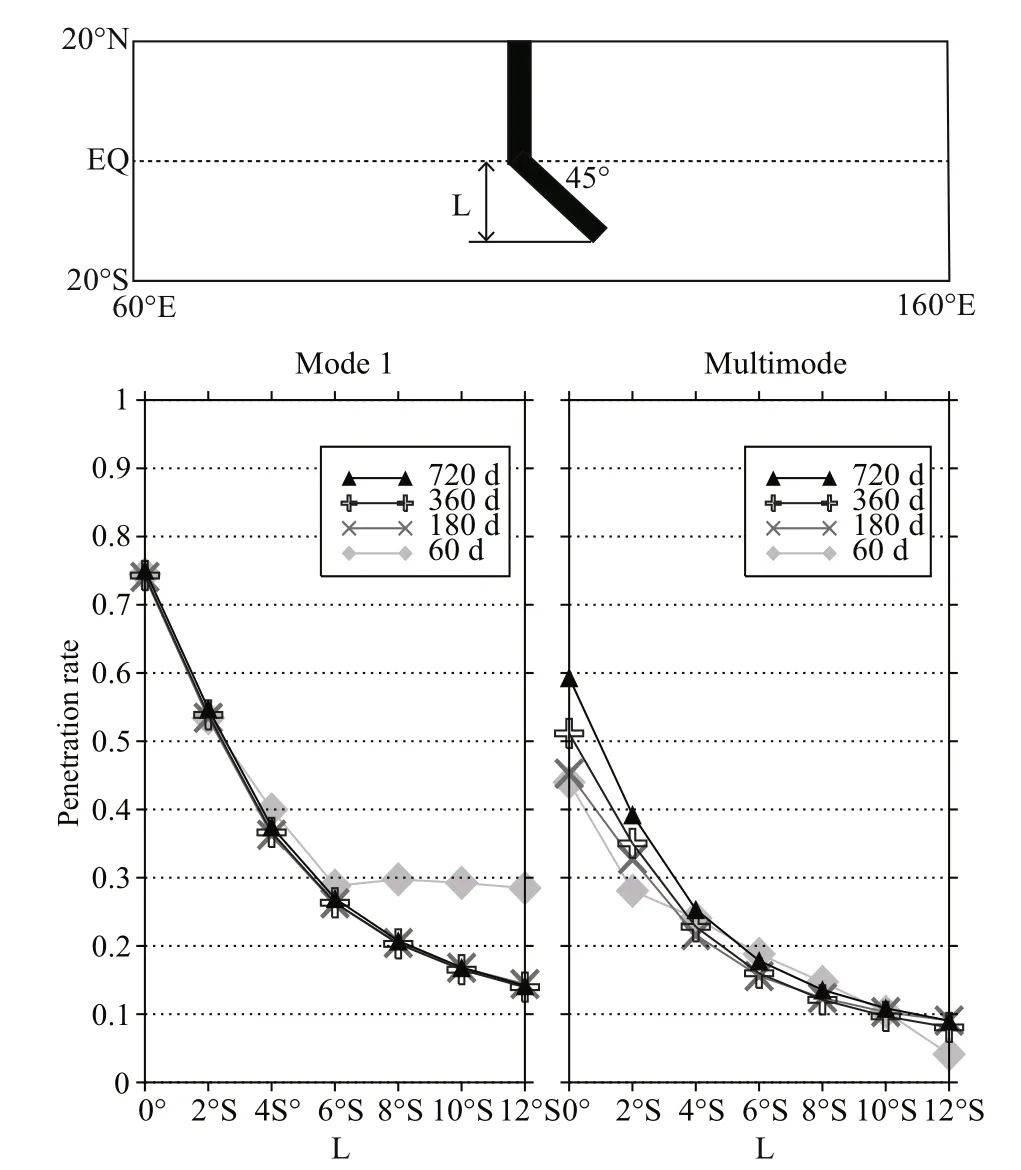
Fig.7 The penetration rates depending on the barrier extensions with an angle of 45° ( x-coordinate) and on the periods of the forcing for the first baroclinic mode and the multimode sea level amplitude
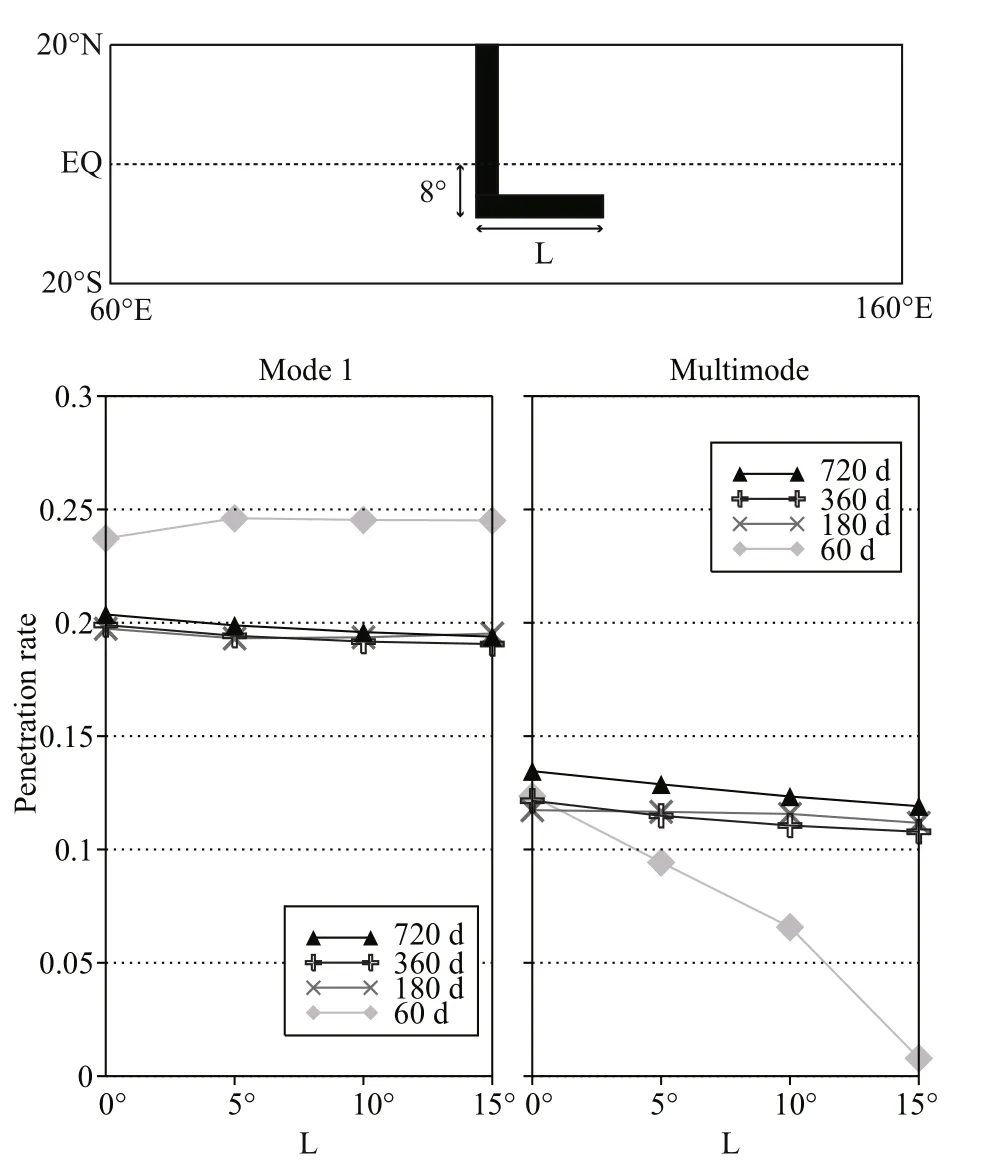
Fig.8 The penetration rates depending on the L-shape barrier extensions in degrees ( x-coordinate) and on the periods of the forcing for the first baroclinic mode and the multimode sea level amplitude
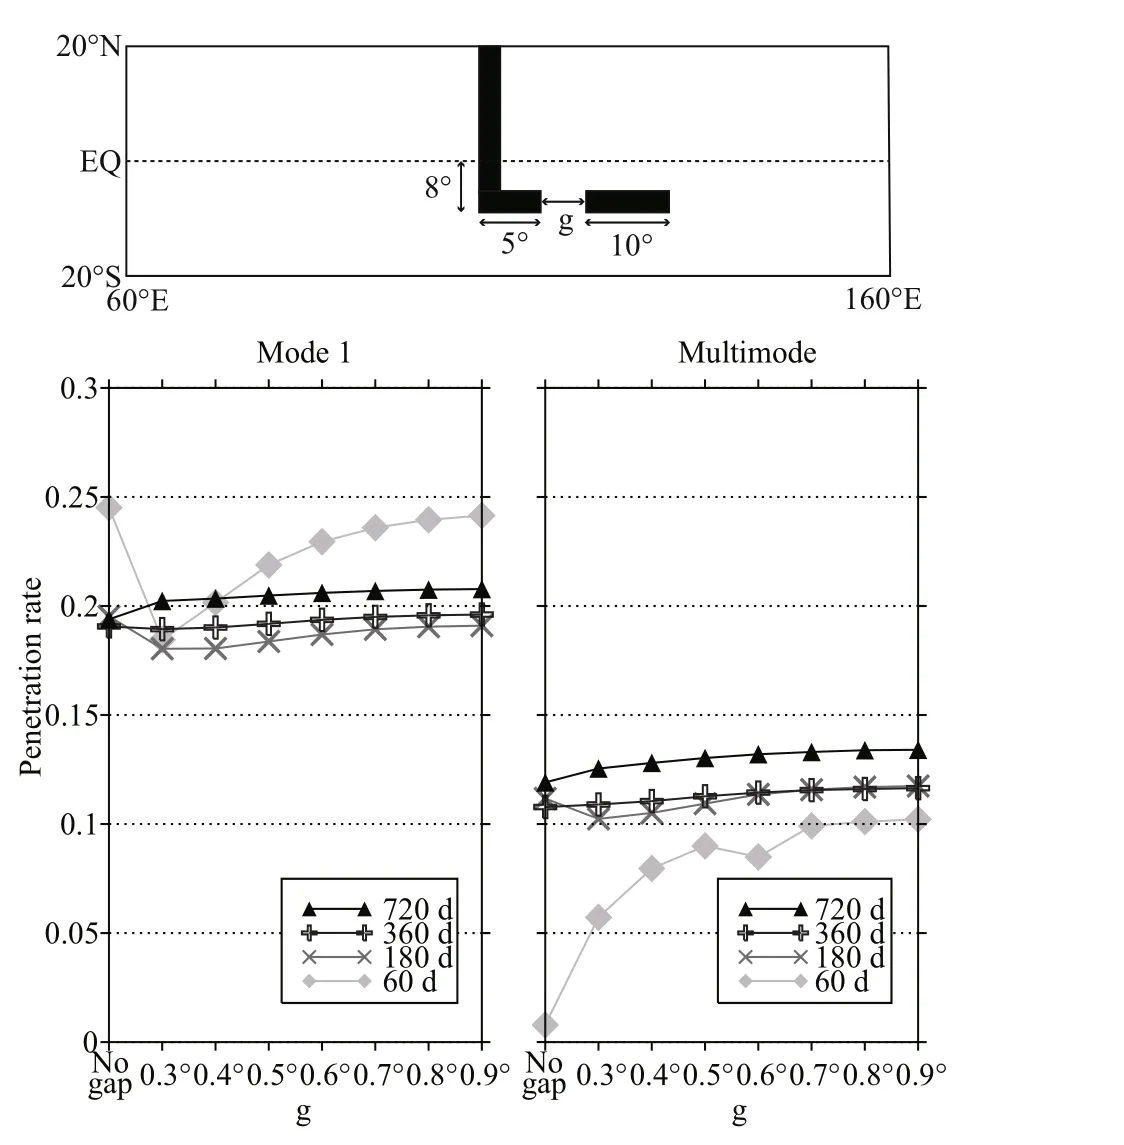
Fig.9 The penetration rates depending on the width of the gap in the L-shape barrier ( x-coordinate) and on the periods of the forcing for the first baroclinic mode and the multimode sea level amplitude
The LCSM has also been deployed over the tropical eastern Indian and western Pacific Oceans between 60°E and 160°E and between 20°S and 20°N with a high horizontal resolution of 0.1° longitude by 0.1°latitude to resolve the main passages of the Indonesian seas. The open and closed boundary conditions and the wind forcing of the experiments are the same as in the experiments with the idealized barrier. The results of the experiments have shown that the Indian Ocean Kelvin waves propagate to the western equatorial Pacific Ocean through both the Makassar Strait and the eastern Indonesian seas (Fig.11). The magnitudes of the Kelvin waves in the Makassar Strait are much larger than those in the eastern seas. These Kelvin waves must propagate across the Maluku Channel to reach the western Pacific Ocean. The numerical experiment in Fig.11a suggests clearly that the Makassar Strait Kelvin waves lose substantial amplitudes after they propagate across the Maluku Strait.
The total penetration rate of sea level amplitudes in these experiments are estimated relative to the area averaged SLA over the STIO. The total penetration rate of the Kelvin wave sea level amplitudes at the interannual time scales is about 9%–15%, depending on the vertical modes (Fig.12). The penetration rate is nearly unchanged if the Lombok Strait or both the Flores Sea and the Lombok Strait are closed. The closing of the Flores Sea helps the Kelvin waves propagate into the Makassar Strait, hence the slight increase of the penetration rate. The closing of the Halmahera Sea appears to have little eff ects on the penetration rate. Some of the incoming Kelvin wave energy propagates back into the Indian Ocean along the West Australia coasts. When the Australia continent is removed, the penetration rate is increased by 3%–4%. These experiments using realistic coastal lines agree with those using the idealized barrier in the penetrating rate that around 9%–15% of the Kelvin wave sea level reaching the western equatorial Pacific Ocean. The Kelvin wave sea level amplitude is expected to be amplified by the shoaling thermocline in the eastern equatorial Pacific, which will induce ocean-atmosphere coupling to further amplify the oceanic channel signals in the year to follow.
Figure 12 also shows the sea level penetration rates in the above experiments for diff erent forcing periods.For the first baroclinic mode waves, the Australia continent results in ~3% interannual sea level amplitudes propagating back to the Indian Ocean. For intraseasonal waves, this percentage is as high as 10%. The penetration rates for the intraseasonal waves are much higher due to the cancellation of the sea level in the STIO of the incoming and the reflected waves near the eastern boundary of the Indian Ocean.The closing of the Lombok Strait, the Flores Sea, and the Halmahera Straits has little eff ects on the penetration rate of the interannual waves (about 1%).For multimode sea level amplitudes, the penetration rate reduced by the Australia continent is about 3%for the interannual waves. The closing of the internal straits of the Indonesian seas results in little change of the penetration rate. The penetration rate of the multimode sea level through the realistic Indonesian sea channels is about 10% for the interannual Kelvin waves.
It is worth mentioning that the depth of the LCSM is set at a constant of 4 000 m, which is not realistic.The interannual waves are expected to propagate through the major channels of the Indonesian seas,unblocked by the sill depth due to the flat ray paths of their vertical propagation, which suggests that the estimated penetration rates are robust. For intraseasonal and higher frequency waves, some of the waves may not be able to penetrate through all of the channels due to the depth limitation of the shallow straits. In addition, the Kelvin waves can be reflected at the surface and bottom (McCreary, 1984), but for the interannual waves, the energy will be trapped primarily above the pycnocline (Moore and McCreary,1990).
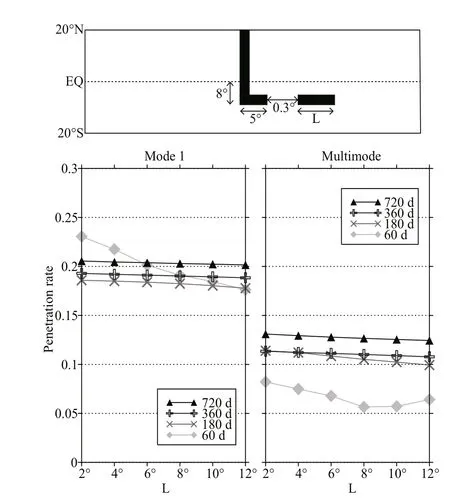
Fig.10 The penetration rates depending on the length of the L-shape barrier east of a 0.3°gap ( x-coordinate) and on the periods of the forcing for the first baroclinic mode and the multimode sea level amplitude
5 THE CENTENNIAL TRENDS OF THE IOD-ENSO TELECONNECTION
Using the HadISST, ERSST, and Kaplan SST data,the lag correlations of the STIO SSTA in fall and the eastern equatorial Pacific Ni?o3.4 SSTA in the next fall are calculated in the running windows of 5, 11,and 21 years. The centennial trends of the teleconnection based on the 5-year running window are calculated to be 0.004/a, 0.004/a, and 0.005/a,respectively, for the three datasets (Fig.13). The centennial trends of the correlations after the filtering of the 11- and 21-year running windows are similar(Table 1). All calculations present positive trends,suggesting that the IOD-ENSO precursory teleconnection is getting stronger over the past 100 years or so. This kind of lag correlation calculations is repeated for the CMIP5 Historical simulated SSTA and SLA. Most of the CMIP5 simulations have generated positive trends of the lag correlations between the STIO SSTA in fall and the cold tongue SSTA in the next fall over the past 100 years or so,consistent with the analysis of the observed SSTA(Fig.14). So are the SLA lag correlations, suggesting the oceanic channel dynamics behind the trends. A few CMIP5 models have presented negative trends,which may be due to model deficiency. All except the CanESM2 model show the same trends for the SSTA and SLA lag correlations, suggesting that the IODENSO precursory teleconnection is controlled by the Kelvin wave propagation dynamics in these CMIP5 simulations.
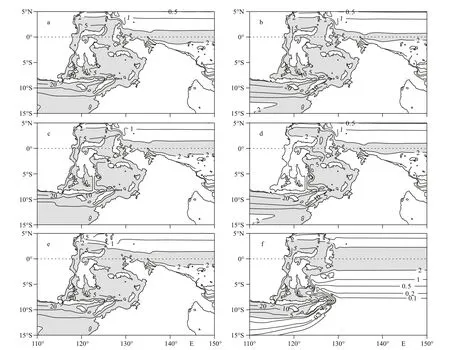
Fig.11 The sea level amplitude in the experiments using the LCSM with realistic coastal lines of the Indonesian seas
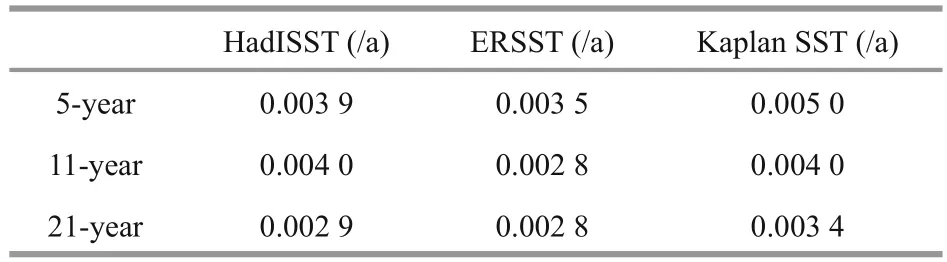
Table 1 Trends of the lag correlations between the STIO SSTA and the Ni?o3.4 index after the filtering of the 5-, 11-, and 21-year running windows
The dynamics behind the increased IOD-ENSO teleconnection are associated with the ITF changes.Negative trends of ITF transports, suggesting decreased ITF transports from the Pacific to the Indian Ocean over the past 100 years or so, have been produced in the majority of the CMIP5 simulations(Fig.15). The decreased ITF transports are conducive for Kelvin wave propagation from the Indian Ocean to the western equatorial Pacific Ocean, considering the Doppler eff ects and the nonlinear diff usion. In comparison, the SZWA in the far western equatorial Pacific have shown negative trends in most of the CMIP5 simulations in the past 100 year or so,suggesting weaker connection through the atmospheric bridge (Fig.16). The change in the atmospheric bridge is inconsistent with the SSTA lag correlation trends.
Comparisons of the trends of the SZWA and the ITF transport anomalies in the Historical and HistoricalNat simulations of the CMIP5 models suggest that the anthropogenic forcing on global warming has significant impact on the oceanic channel and the atmospheric bridge, hence on the IOD-ENSO teleconnection (Figs.16 and 17). The detailed dynamics of this impact is beyond the scope of this study.
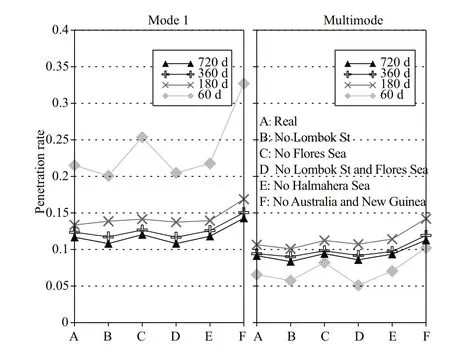
Fig.12 The penetration rates depending on the periods of the forcing in the control experiments of the LCSM with some of the Indonesian straits closed( x-coordinate) for the first baroclinic mode and the multimode sea level amplitude
6 CONCLUSION
Lag correlations between the SLA in STIO in fall and the Indo-Pacific SLA in the following winter through fall seasons are calculated in the satellite altimeter sea level data of 1993–2008 and in the highresolution simulations of the OFES and HYCOM models for the period of 1990–2008. The propagation of significant positive lag correlations from STIO to the equatorial Pacific Ocean through the Indonesian seas in the observations is simulated successfully by the OGCMs. The dynamics are due to the propagation of the Kelvin waves, which induces ITF transport anomalies and subsurface temperature anomalies in the western equatorial Pacific Ocean. The propagation of subsurface temperature anomalies from the western equatorial Pacific Ocean to the eastern equatorial Pacific cold tongue is evidenced by the significant lag correlations between the SSTA in STIO in fall and the Indo-Pacific subsurface temperature in the equatorial vertical section of the Pacific Ocean in the following winter through fall, the observational analyses of which are also simulated successfully by the OGCMs.The elevation of the subsurface temperature anomalies to the cold tongue surface suggests that oceanatmosphere coupling amplifies the oceanic channel signals from the tropical Indian Ocean. All these dynamics are also simulated well by the OGCMS,providing evidence of the dynamical link between the tropical Indian Ocean and the tropical Pacific Ocean through the ITF. In contrast, the lag correlations between the SZWA over the western equatorial Pacific in fall and the Indo-Pacific SLA in the following spring through fall are all insignificant in the equatorial Pacific Ocean, suggesting that the atmospheric bridge is unlikely the link between the IOD and ENSO at the one year time lag. Evidently, the precursory relation between IOD and ENSO at the one-year time lag is due to the oceanic channel dynamics through the Indonesian seas, namely the ITF variability.
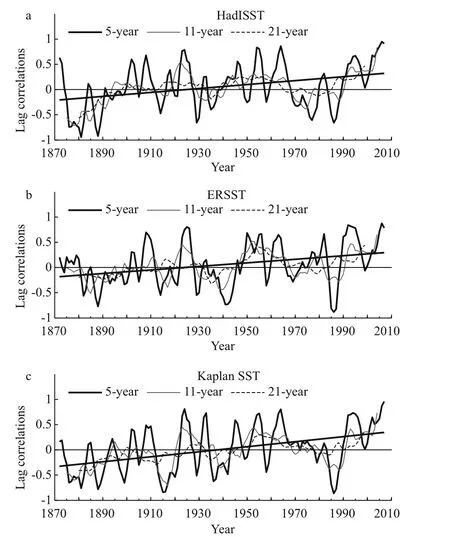
Fig.13 Lag correlations between the southeastern tropical Indian Ocean SSTA in fall and the cold tongue SSTA at the one-year time lag in the past 140 years based on the HadISST (a), ERSST (b), and Kaplan (c) SST data

Fig.14 Comparison of the long-term trends of the SSTA and SLA lag correlations between the STIO and the cold tongue at a one-year time lag in the CMIP5 Historical experiments
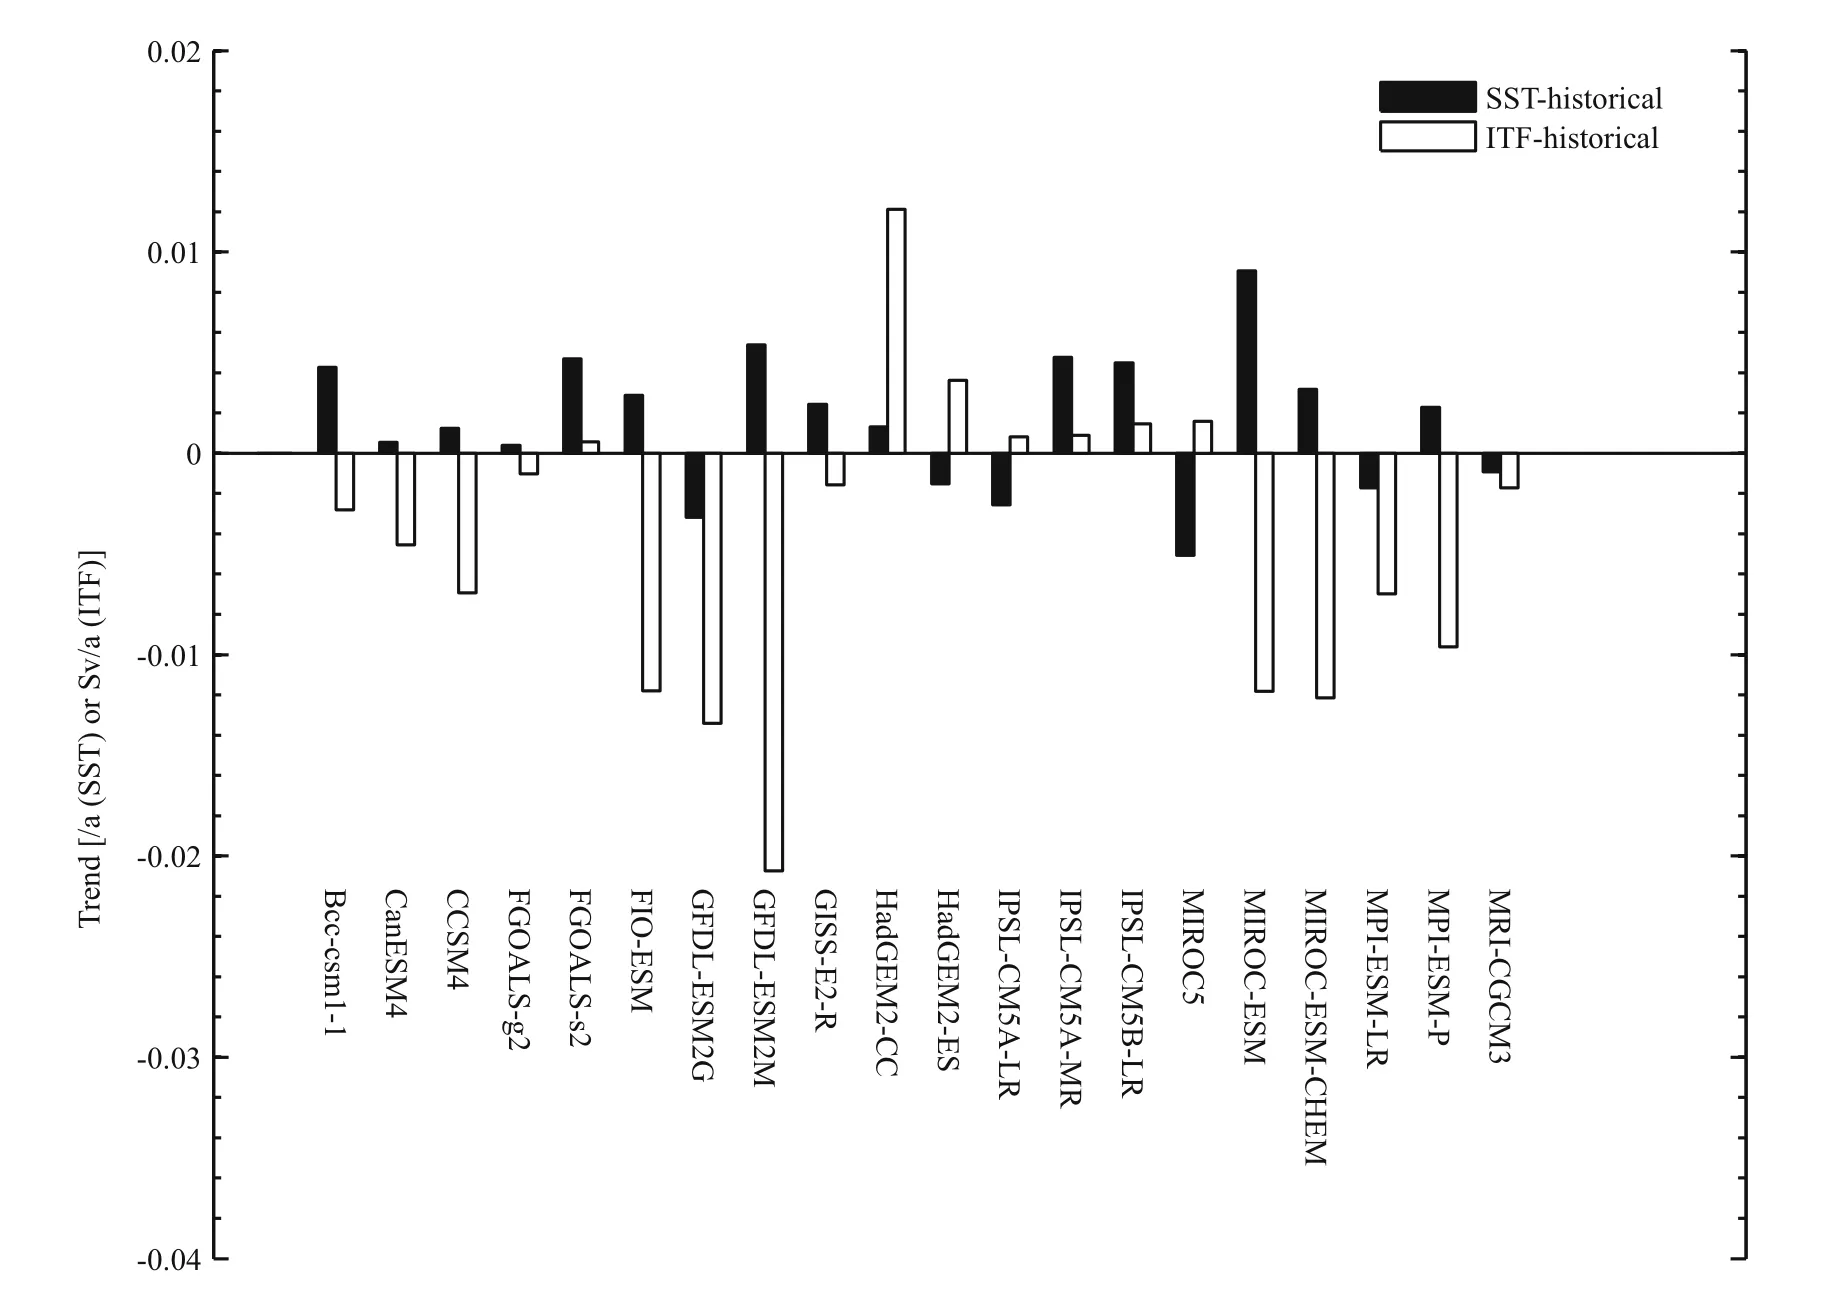
Fig.15 Comparison of the long-term trends of the ITF transport anomalies and of the SSTA lag correlations between the STIO and the cold tongue at a one-year time lag in the CMIP5 Historical experiments
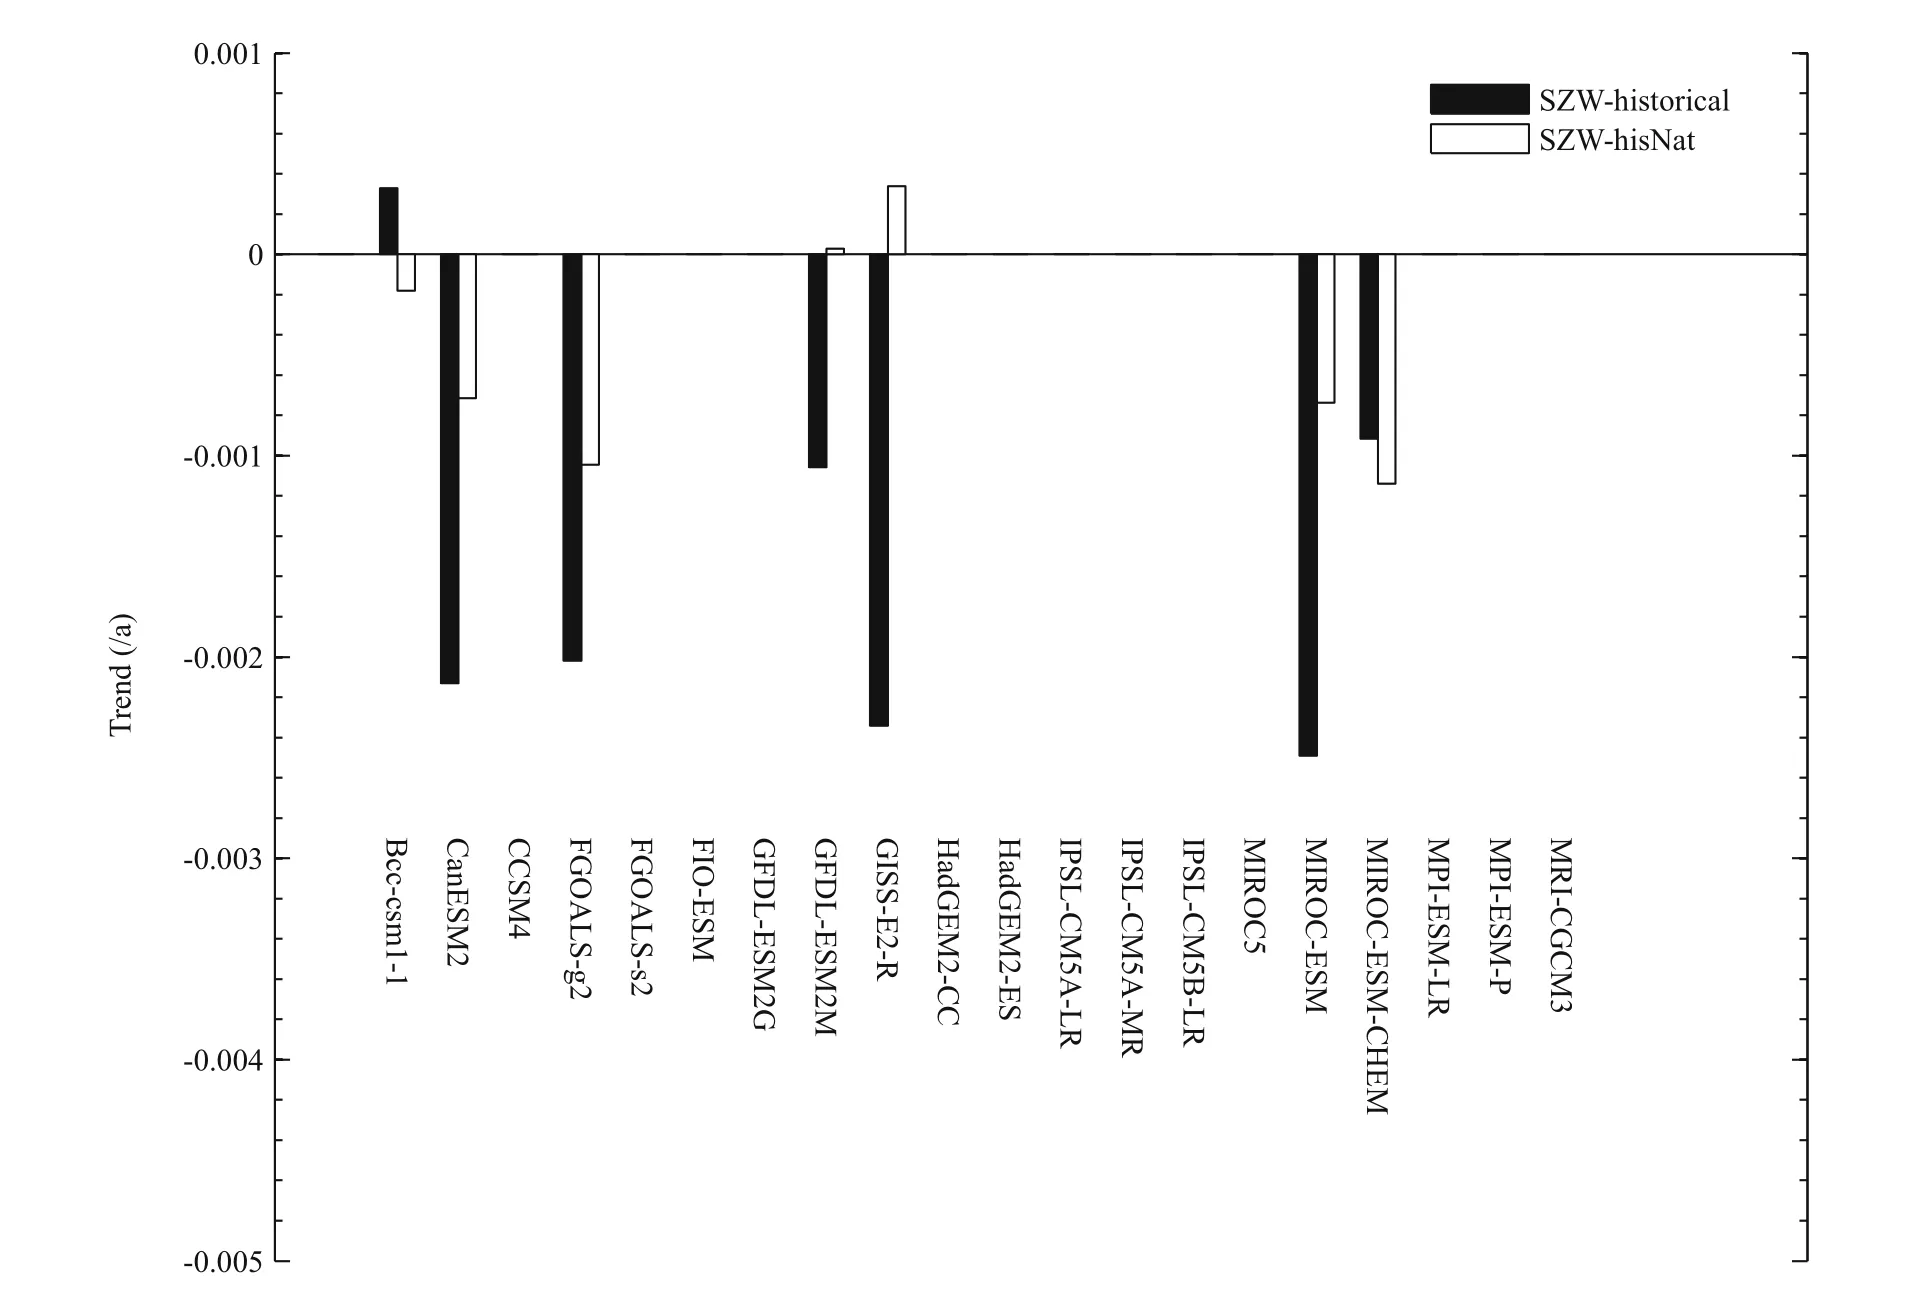
Fig.16 Comparison of the western Pacific SZWA trends in the Historical and the HistoricalNat experiments
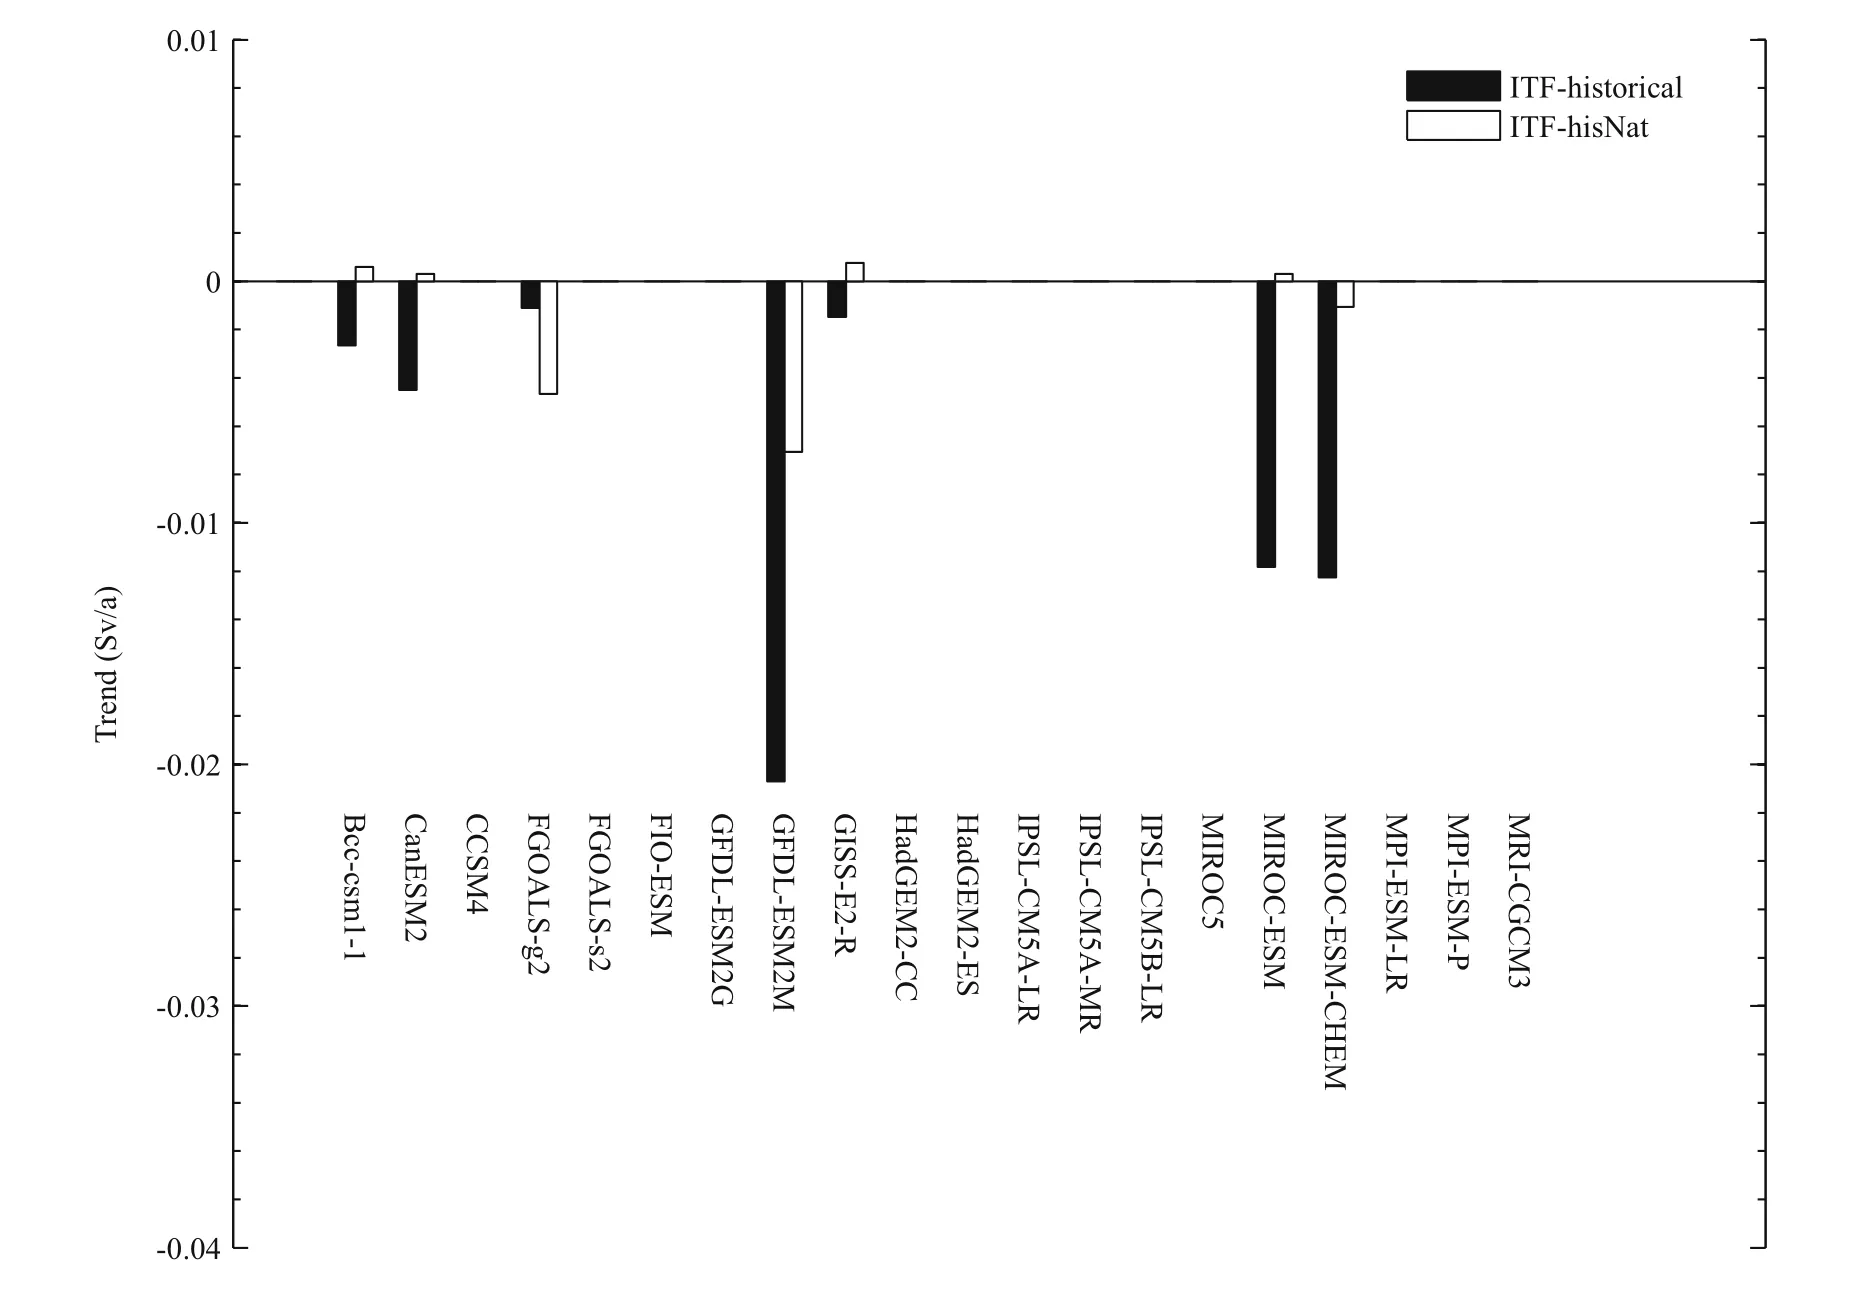
Fig.17 Comparison of the ITF transport anomaly trends in the Historical and HistoricalNat experiments
The penetration rates for the Kelvin waves from the equatorial Indian Ocean to the equatorial Pacific Ocean are estimated based on experiments using a LCSM. The penetration rate of the interannual Kelvin waves is found to be dependent only on the southern tip latitude of the barrier between the two equatorial basins, and independent of the lengths and gaps of the barrier. The experiments with realistic coastal lines of the Indonesian seas suggest that the Kelvin waves propagate into the equatorial western Pacific Ocean through both the Makassar Strait and the eastern Indonesian seas. The total penetration rates for the sea level amplitudes are about 10%–15%, depending on the baroclinic modes and not sensitive to the closing of the Lombok Strait, the Flores Sea, or the Halmahera Sea. The experiments of the LCSM and the diagnosis of the OGCM simulations are consistent in that the Kelvin waves from the equatorial Indian Ocean can propagate through the Indonesian seas to the equatorial western Pacific Ocean to influence the ENSO evolution in the year to follow, which is the essence of the oceanic dynamics of the IOD-ENSO precursory relation.
The IOD-ENSO precursory teleconnection is found to have an increasing trend over the past 100 years or so. The diagnoses of the CMIP5 simulations have shown positive trends of the lag correlations between the STIO SSTA (SLA) and the cold tongue SSTA (SLA) at the one year time lag over the latest 100 years or so, suggesting positive trends of the IOD-ENSO teleconnection associated with the global warming. The centennial trends are consistent with the negative trends of the ITF transport, but are in contrast to the negative trends of the SZWA over the far western equatorial Pacific. The weaker ITF transports from the Pacific to the Indian Ocean facilitate the propagation of the Kelvin waves through the Indonesian seas. In comparison, the negative trends of the SZWA cannot explain the positive IODENSO teleconnection trends and suggest insignificant roles played by the atmospheric bridge. The IODENSO teleconnection is found to be sensitive to global warming forcing, as suggested by the comparisons of the ITF transport trends and the SZWA trends in the Historical and HistoricalNat experiments.
Alexander M A, Bladé I, Newman M, Lanzante J R, Lau N C,Scot J D. 2002. The atmospheric bridge: the influence of ENSO teleconnections on air-sea interaction over the global oceans. J. Climate, 15(16): 2 205-2 231.
Annamalai H, Xie S P, McCreary J P, Murtugudde R. 2005.Impact of Indian Ocean sea surface temperature on developing El Ni?o. J. Climate, 18(2): 302-319.
Behera S K, Luo J J, Masson S, Rao S A, Sakuma H, Yamagata T. 2006. A CGCM study on the interaction between IOD and ENSO. J. Climate, 19(9): 1 688-1 705.
Behera S K, Yamagata T. 2003. Influence of the Indian Ocean dipole on the southern oscillation. J. Meteor. Soc. Jpn.,81(1): 169-177.
Bleck R. 2002. An oceanic general circulation model framed in hybrid isopycnic-Cartesian coordinates. Ocean Modell.,4(1): 55-88.
Clarke A J, Gorder S V. 2003. Improving El Ni?o prediction using a space-time integration of Indo-Pacific winds and equatorial Pacific upper ocean heat content. Geophys. Res.Lett., 30(7): 1 399, https://doi.org/10.1029/2002GL016673.
Drushka K, Sprintall J, Gille S T, Brodjonegoro I. 2010.Vertical structure of kelvin waves in the Indonesian throughflow exit passages. J. Phys. Oceanogr., 40(9):1 965-1 987.
Halliwell G, Bleck R, Chassignet E. 1998. Atlantic Ocean simulations performed using a new hybrid-coordinate ocean model. In EOS Transactions, American Geophysical Union ( AGU), Fall 1998 Meeting, San Francisco, CA.
Izumo T, Lengaigne M, Vialard J, Luo J J, Yamagata T, Madec G. 2014. Influence of Indian Ocean dipole and pacific recharge on following year’s El Ni?o: interdecadal robustness. Climate Dyn., 42(1-2): 291-310.
Izumo T, Vialard J, Lengaigne M, de Boyer Montegut C,Behera S K, Luo J J, Cravatte S, Masson S, Yamagata T.2010. Influence of the state of the Indian Ocean Dipole on the following year’s El Ni?o. Nat. Geosci., 3(3): 168-172.
Kalnay E, Kanamitsu M, Kistler R, Collins W, Deaven D,Gandin L, Iredell M, Saha S, White G, Woollen J, Zhu Y,Leetmaa A, Reynolds R, Chelliah M, Ebisuzaki W,Higgins W, Janowiak J, Mo K C, Ropelewski C, Wang J.1996. The NCEP/NCAR 40-year reanalysis project. Bull.Am. Meteor. Soc., 77(3): 437-471.
Kaplan A, Cane M A, Kushnir Y, Clement A C, Blumenthal M B, Rajagopalan B. 1998. Analyses of global sea surface temperature 1856-1991. J. Geophy. Res., 103(C9):18 567-18 589.
Klein S A, Soden B J, Lau N C. 1999. Remote sea surface temperature variations during ENSO: evidence for a tropical atmospheric bridge. J. Climate, 12(4): 917-932.
Kug J S, Li T, An S I, Kang I S, Luo J J, Masson S, Yamagata T. 2006. Role of the ENSO-Indian Ocean coupling on ENSO variability in a coupled GCM. Geophys. Res. Lett.,33(9): L09710, https://doi.org/10.1029/2005GL024916.
Lau N C, Leetmaa A, Nath M J, Wang H L. 2005. Influences of ENSO-induced Indo-western Pacific SST anomalies on extratropical atmospheric variability during the boreal summer. J. Climate, 18(15): 2 922-2 942.
Lau N C, Nath M J. 2003. Atmosphere-ocean variations in the Indo-Pacific sector during ENSO episodes. J. Climate,16(1): 3-20.
Luo J J, Zhang R C, Behera S K, Masumoto Y, Jin F F, Lukas R, Yamagata T. 2010. Interaction between El Ni?o and Extreme Indian Ocean Dipole. J. Climate, 23(3): 726-742.
Masumoto Y, Sasaki H, Kagimoto T, Komori N, Ishida A,Sasai Y, Miyama T, Motoi T, Mitsudera H, Takahashi K,Sakuma H, Yamagata T. 2004. A fifty-year eddy-resolving simulation of the world ocean—preliminary outcomes of OFES (OGCM for the Earth Simulator). J. Earth Simulator, 1: 35-56.
McCreary Jr J P. 1984. Equatorial beams. J. Mar. Res., 42(2):395-430.
Meehl G A, Bony S. 2011. Introduction to CMIP5. Clivar Exchanges, 16(2): 4-5.
Molcard R, Fieux M, Syamsudin F. 2001. The throughflow within Ombai Strait. Deep Sea Res. Part I Oceanogr. Res.Papers, 48(5): 1 237-1 253.
Moore D W, McCreary J P. 1990. Excitation of intermediatefrequency equatorial waves at a western ocean boundary:with application to observations from the Indian Ocean. J.Geophys. Res., 95(C4): 5 219-5 231.
Pujiana K, Gordon A L, Sprintall J, Susanto R D. 2009.Intraseasonal variability in the Makassar strait thermocline. J. Mar. Res., 67(6): 757-777.
Rayner N A, Parker D E, Horton E B, Folland C K, Alexander L V, Rowell D P, Kent E C, Kaplan A. 2003. Global analyses of sea surface temperature, sea ice, and night marine air temperature since the late nineteenth century. J.Geophys. Res., 108(D14): 4 407, https://doi.org/10.1029/2002JD002670.
Saji N H, Goswami B N, Vinayachandran P N, Yamagata T.1999. A dipole mode in the tropical Indian Ocean. Nature,401(6751): 360-363.
Slutz R J, Lubker S J, Hiscox J D, Woodruff S D, Jenne R L,Joseph D H, Steurer P M, Elms J D. 1985. Comprehensive Ocean-Atmosphere Data Set: Release 1. NOAA Environmental Research Laboratories, Climate Research Program, Boulder, Colorado. 268p.
Smith T M, Reynolds R W, Peterson T C, Lawrimore J. 2008.Improvements to NOAA’s historical merged Land-Ocean surface temperature analysis (1880-2006). J. Climate,21(10): 2 283-2 296.
Susanto R D, Ffield A, Gordon A L, Adi T R. 2012. Variability of Indonesian throughflow within Makassar Strait, 2004-2009. J. Geophys. Res., 117(C9): C09013, https://doi.org/10.1029/2012JC008096.
Trenary L L, Han W Q. 2012. Intraseasonal-to-interannual variability of South Indian Ocean sea level and thermocline: remote versus local forcing. J. Phys.Oceanogr., 42(4): 602-627.
Trenary L L, Han W Q. 2013. Local and remote forcing of decadal sea level and thermocline depth variability in the south Indian Ocean. J. Geophys. Res., 118(1): 381-398,https://doi.org/10.1029/2012JC008317.
White W B. 1995. Design of a global observing system for gyre-scale upper ocean temperature variability. Prog.Oceanogr., 36(3): 169-217.
Wu G X, Meng W. 1998. Gearing between the Indo-monsoon Circulation and the Pacific-Walker Circulation and the ENSO Part I: data analyses. Sci. Atmos. Sinica, 22(4):470-480. (in Chinese with English abstract)
Wu R G, Kirtman B P. 2004. Understanding the impacts of the Indian Ocean on ENSO variability in a coupled GCM. J.Climate, 17(20): 4 019-4 031.
Xu T F, Yuan D L, Yu Y Q, Zhao X. 2013. An assessment of Indo-Pacific oceanic channel dynamics in the FGOALS-g2 coupled climate system model. Adv. Atmos. Sci., 30(4):997-1 016, https://doi.org/10.1007/s00376-013-2131-2.
Xu T F, Yuan D L. 2015. Why does the IOD-ENSO teleconnection disappear in some decades? Chin. J.Oceanol. Limnol., 33(2): 534-544, https://doi.org/10.1007/s00343-015-4044-7.
Yuan D L, Han W Q. 2006. Roles of equatorial waves and western boundary reflection in the seasonal circulation of the equatorial Indian Ocean. J. Phys. Oceanogr., 36(5):930-944.
Yuan D L, Wang J, Xu T F, Xu P, Hui Z, Zhao X, Luan Y H,Zheng W P, Yu Y Q. 2011. Forcing of the Indian Ocean dipole on the interannual variations of the tropical Pacific Ocean: roles of the Indonesian throughflow. J. Climate,24(14): 3 593-3 608.
Yuan D L, Xu P, Xu T F. 2017. Climate variability and predictability associated with the Indo-Pacific Oceanic channel dynamics in the CCSM4 coupled system model.Chin. J. Oceanol. Limnol., 35(1): 23-28, https://doi.org/10.1007/s00343-016-5178-y.
Yuan D L, Zhou H, Zhao X. 2013. Interannual climate variability over the tropical Pacific Ocean induced by the Indian Ocean dipole through the Indonesian throughflow.J. Climate, 26(9): 2 845-2 861.
Zhou Q, Duan W S, Mu M, Feng R. 2015. Influence of positive and negative Indian Ocean Dipoles on ENSO via the Indonesian Throughflow: results from sensitivity experiment. Adv. Atmos. Sci., 32(6): 783-793.
猜你喜歡
Chinese Physics B(2024年3期)2024-03-25 09:30:48
中國藥學藥品知識倉庫(2022年7期)2022-05-10 11:03:13
東方劍·消防救援(2022年1期)2022-01-17 07:07:28
閱讀與作文(初中版)(2021年9期)2021-09-12 12:30:10
科教創(chuàng)新與實踐(2021年9期)2021-09-10 08:13:29
文物鑒定與鑒賞(2021年10期)2021-06-24 05:41:47
知音·下半月(2020年12期)2020-12-31 07:25:51
伊犁河(2020年2期)2020-10-09 10:50:58
四川黨的建設(2020年14期)2020-07-29 12:28:35
伴侶(2018年11期)2018-11-22 03:18:50
 Journal of Oceanology and Limnology2018年1期
- Journal of Oceanology and Limnology的其它文章
- Editorial Statement
- Sedimentary architecture of the Holocene mud deposit offthe southern Shandong Peninsula in the Yellow Sea*
- Ferroan dolomites in Miocene sediments of the Xisha Islands and their genetic model*
- Synchronous response of sedimentary organic carbon accumulation on the inner shelf of the East China Sea to the water impoundment of Three Gorges and Gezhouba Dams*
- Rates and fluxes of centennial-scale carbon storage in the fine-grained sediments from the central South Yellow Sea and Min-Zhe belt, East China Sea*
- Centennial-scale records of total organic carbon in sediment cores from the South Yellow Sea, China*