
Contamination and risk assessment of heavy metals in farmland soils of Baghrash County, Xinjiang,Northwest China
2017-11-17 08:43:41AjigulMamutMamattursunEzizAnwarMohammadMattohtiAnayitAtiyagulRixit
Ajigul Mamut , Mamattursun Eziz ,2*, Anwar Mohammad ,Mattohti Anayit , Atiyagul Rixit
1. College of Geographical Science and Tourism, Xinjiang Normal University, Urumqi, Xinjiang 830054, China
2. Research Center for Urban Development in Silk Road Economic Zone, Xinjiang Normal University, Urumqi, Xinjiang 830054, China
3. College of Chemistry and Chemical Engineering, Xinjiang University, Urumqi, Xinjiang 830046, China
Contamination and risk assessment of heavy metals in farmland soils of Baghrash County, Xinjiang,Northwest China
Ajigul Mamut1, Mamattursun Eziz1,2*, Anwar Mohammad3,Mattohti Anayit1, Atiyagul Rixit1
1. College of Geographical Science and Tourism, Xinjiang Normal University, Urumqi, Xinjiang 830054, China
2. Research Center for Urban Development in Silk Road Economic Zone, Xinjiang Normal University, Urumqi, Xinjiang 830054, China
3. College of Chemistry and Chemical Engineering, Xinjiang University, Urumqi, Xinjiang 830046, China
Soil pollution significantly reduces environmental quality. In this study, farmland soil samples were collected from 25 sites in Baghrash County, Northwest China; and the concentrations of eight heavy-metal elements (arsenic, As; cadmium, Cd;chromium, Cr; copper, Cu; manganese, Mn; nickel, Ni; lead, Pb; zinc, Zn) were determined by standard methods. The spatial distribution, contamination level, and ecological risk stature of heavy metals were analyzed based on GIS technology,the Geo-accumulation Index (Igeo), the Pollution Load Index (PLI), and the Potential Ecological Risk Index (RI). Results indicated that (1) The average concentrations of Cd exceeded 12.12 times the allowed national standard for soil environmental quality of China. The average concentrations of Cd, Cr, Ni, Pb, and Zn exceeded the background values of irrigation soils in Xinjiang by 60.58, 1.25, 1.50, 4.95, and 5.10 times, respectively. (2) The pollution order of the average value of Igeofor heavy metals was ranked as Cd > Zn > Pb > Ni > Cr > Cu > As > Mn. The individual potential ecological risk index for heavy metals was ranked in the order of Cd > As > Ni > Cu > Pb > Cr > Zn. The average PLI for the study area showed a heavy pollution level, while the average RI showed a considerable ecological risk stature, as compared to the classification standard. (3) The spatial distribution patterns of eight heavy metal elements were substantially heterogeneous. The moderately polluted areas with moderate potential ecological risks were distributed in the southern parts of the study area, whereas the heavily polluted areas with considerable potential ecological risks were distributed in the northern parts. Overall, it was observed that Cd contributed most to the PLI and RI of the farmland soils in Baghrash County. The pollution risk of Cd should be a major concern, and human activities in the region should be cautious.
farmland soils; heavy metal; pollution; ecological risk; spatial distribution
1 Introduction
Soil contamination by heavy metals is an increasing eco-environmental concern due to its potential ecological risks and detrimental effects on soil environments, plants, and human health (Heberer, 2002;Karim et al., 2014). The heavy-metal pollution of soil can cause risks to the soil environment and influence the product quality and healthfulness (Leake et al.,2009; Oseni et al., 2016). The analysis of spatial dis-tribution, contamination, and ecological risks of heavy metals in farmland soils is very important for identifying pollution hot spots and assessing the potential sources of pollutants in agricultural lands(Giller et al., 1998; Imperato et al., 2003; Cicchella et al., 2005; Acosta et al., 2011). Therefore, research on heavy-metal pollution of farmland soils has become a hot spot in environmental research (Madrid et al.,2002; Chen et al., 2015).
In recent years, China has faced serious soil contamination that threatens the soil environment, food safety, and people's health (Wang et al., 2001; Liu et al., 2015; Duan et al., 2016). The "National Survey of Soil Pollution of China" (MEP, 2014) indicated that about 20X106ha of farmland in China have been contaminated by heavy metals, and about 12 million tons of grains are contaminated every year by heavy metals in farmland soils (Teng et al., 2010). However,heavy-metal pollution of farmland soils in the developed eastern areas of China has attracted great attention (Wang et al., 2007; Hu et al., 2012; Qiu et al.,2015; Wang et al., 2016). Comparatively, heavy-metal pollution of farmland soils in the Northwest arid zones has received less attention (Mamat et al., 2016).In recent decades, the quick economic development in the Northwest arid zones of China, such as Baghrash County, has affected the environmental quality of farmland soils of this region (Mamattursun, 2016).Therefore, it is neccesary to understand the spatial distribution, pollution, and ecological risks of heavy metals in farmland soils of this area.
The present research aimed to identify the spatial distribution, pollution level, and potential ecological risks of farmland soils in Baghrash County-based on GIS technology, the Geo-accumulation Index (Igeo),the Pollution Load Index (PLI), and the Potential Ecological Risk Index (RI). Results of the research could illustrate the general accumulation and ecological risk features of heavy-metal contamination in farmland soils and be helpful for protecting human health in the study area.
2 Materials and methods
2.1 Study area
The study area, Baghrash County, is a typical desert oasis in the arid zones of Northwest China,situated in the central parts of the Ksrashahar Basin and western parts of Bosten Lake. It lies within the geographical coordinates of 86°33′E~86°48′E and 41°51′N~42°08′N, with an altitude ranging from 1,050 m to 1,080 m, with a total area of 25,000 ha(Figure 1). The study area is in a continental desert climate, temperate zone with an average annual temperature of about 7.9 °C, an average annual rainfall of about 65 mm, an average annual evaporation capacity of about 2,600 mm, and an accumulated active temperature ≥10 °C of about 3,700 °C. The soil types are mainly irrigated meadow soil, irrigated swamp soil,irrigated brown desert soil, aeolian sandy soil,gypsum desert soil, and saline soil (Mamattursun,2016).
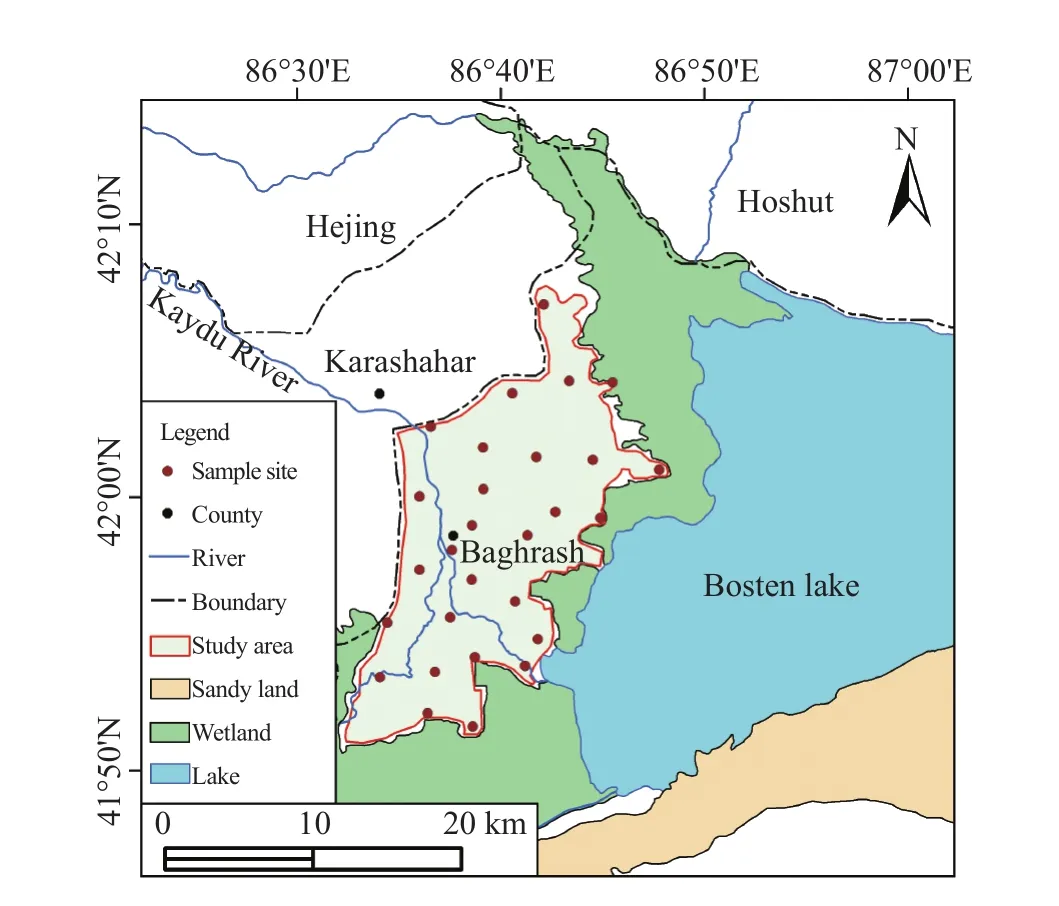
Figure 1 Location of the study area and sampling sites
2.2 Sample collection and analysis
A total of 25 farmland soil samples from 0~20 cm soil layer were collected in May 2016 using a gridded sampling-site design with a grid spacing of about 4 km. The geographical coordinates of the sampling sites were recorded using a global positioning system.The sample-collection method used was that described in "NY/T 395-2000" (MAPRC, 2000). Five subsamples of farmland soils were taken from the same area of about 100 m2and then mixed to form one composite soil sample. The soil samples were placed in clean polyethylene bags and transferred to the laboratory.
All the samples were air dried and passed through a 0.15-mm nylon sieve. The soil samples were digested with HCl–HNO3–HF–HClO4solution methods described in "HJ/T 166-2004" (SEPAC, 2004). The concentrations of Cd, Cr, Cu, Mn, Ni, Pb, and Zn of the soil samples were tested using a Flame Atomic Absorption Spectrophotometer–Flameless (Agilent 200AA, USA), and the concentration of As was tested using an Atomic Fluorescence Spectrometer(PERSEE, PF–7, China). A standard solution of heavy-metal elements was used to compare samples to national standards (GSS-5, China). About 50% of the soil samples were tested repeatedly, and the determined consistency of the repeated heavy metal measurements was about 96%. The pH values of the soil samples were tested using a Mettler Toledo pH Meter (Delta–320, Switzerland).
2.3 Pollution assessment
2.3.1 Geo-accumulation Index
The Geo-accumulation Index (Igeo) is used to estimate the pollution level of heavy metals in soils(Mamat et al., 2016). Igeois defined in the following equation:

where Ciis the measured concentrations of heavy-metal elements, Biis the geochemical background value of heavy metals in irrigation soil of Xinjiang (Zheng,2007), and 1.5 is the CV that resulted from rock formation (Zhong et al., 2010). The pollution level of Igeocan be classified as clean (Igeo= 0), slight pollution (0 < Igeo< 1), partially moderate pollution (1< Igeo< 2), moderate pollution (2 < Igeo< 3), partially serious pollution (3 < Igeo<4), serious pollution (4
2.3.2 Pollution Load Index
The Pollution Load Index (PLI) introduced by Tomlinson et al. (1980) was used to clarify the integrated pollution level of heavy metals. The PLI can be calculated as the following equations:

where CF is the contamination factor of a single heavy-metal element; n indicates the total number of elements. The pollution level of PLI can be classified as no pollution (PLI ≤ 1), moderate pollution (1 < PLI≤ 2), heavy pollution (2 < PLI ≤ 3), or extremely heavy pollution (3 < PLI).
2.3.3 Ecological Risk Index
The ecological risk stature of heavy metals was analyzed using the Ecological Risk Index (RI) introduced by H?kanson (1980). The RI can be calculated as the following equations:

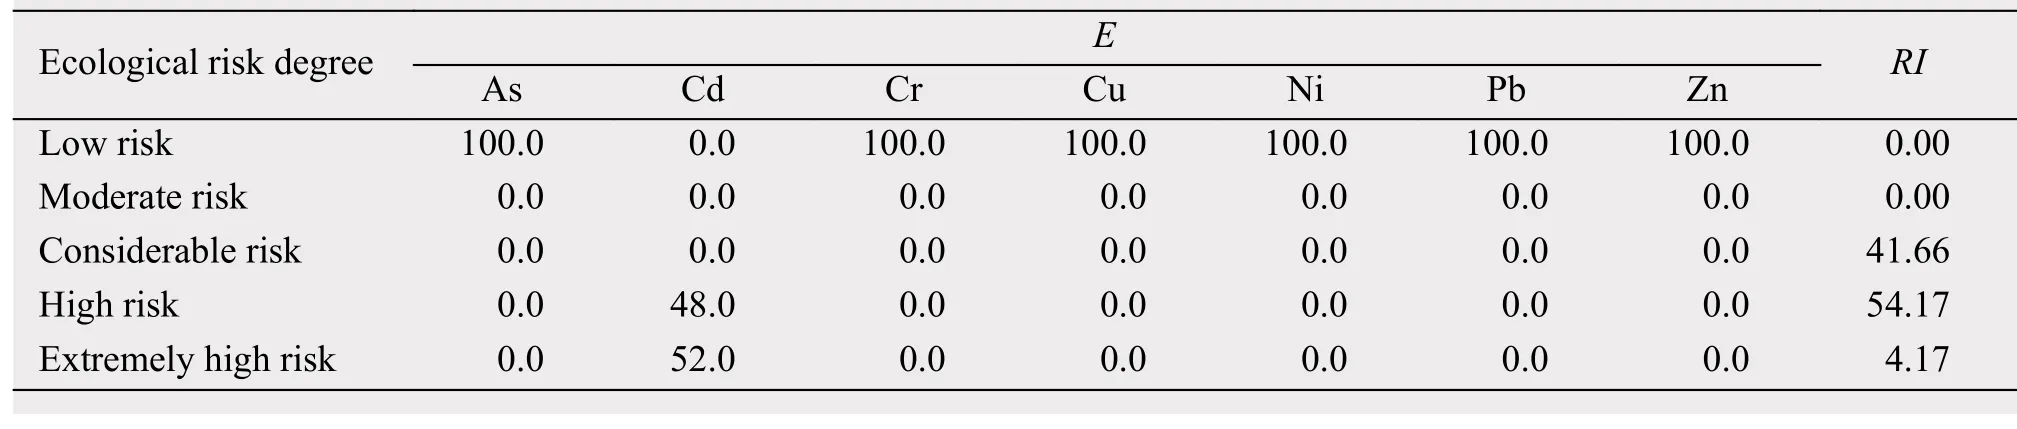
where Tiis the toxic response factor of element i. The Tifor As, Cd, Cr, Cu, Ni, Pb, and Zn are 10, 30, 2, 5,5, 5 and 1, respectively (Mn has no toxic response).Ejirepresents the potential ecological risk coefficient of element i at sampling site j. Cjiis the contamination factor of element i at sampling site j. Ciis the measured concentrations of heavy-metal elements at sampling site j, Cbis the Soil Environmental Quality Standard of China (GB15618-1995) (pH >7.5)(CEPA, 1995). The risk degree of E can be classified as low risk (E < 30), moderate risk (30 ≤ E < 60),considerable risk (60 ≤ E < 120), high risk (120 ≤ E <240), or extremely high risk (E ≥ 240). The risk degree RI can be classified as low risk (RI < 150),moderate risk (150 ≤ RI < 300), considerable risk(300 ≤ RI < 600), high risk (600 ≤ RI < 1,200), or very high risk (RI ≥ 1,200).
2.4 Geostatistical analysis
Geostatistical analysis is an effective method to analyze the spatial heterogeneity and spatial patterns of the concentration and pollution of heavy metals in soil (Zhang, 2006; Carr et al., 2008; Acosta et al.,2011; Mamattursun, 2016). The main tool in geostatistical analysis is the semivariogram model function,γ(h), which shows the spatial dependence between neighboring observations. The semivariogram can be defined as the following equation:

where γ(h) is the semivariogram, h is the distance between sampling sites, Z(x) is the magnitude of variable, and N(h) is the total number of pairs of attributes that are separated by h (Pucci and Murashige, 1987; Goovaerts, 1997). The most appropriate semivariogram model for heavy-metal elements of farmland soils was selected using GS+9.0 software. Ordinary kriging methods were adopted for spatial interpolations. ArcGIS 10.3 software was used for mapping the spatial distribution patterns of heavymetal concentration, the Geo-accumulation Index, and the Pollution Load Index.
3 Results and discussion
3.1 Heavy-metal concentration of farmland soils
A statistical summary of the concentrations of eight heavy-metal elements in farmland soils of Baghrash County was given in Table 1. The minimum, maximum, and average values of heavy-metal concentrations were calculated. The background value of irrigation soils in Xinjiang and the Soil Environmental Quality Standard of China (National Environ-mental Protection Agency, State Bureau of Technical Supervision, 2006) (pH >7.5) are also shown in Table 1. It can be seen that the average values of As,Cd, Cr, Cu, Mn, Ni, Pb, and Zn were 4.15, 7.27,49.68, 31.38, 492.24, 39.72, 66.83, and 82.46 mg/kg,respectively. The average concentrations of As, Cu,and Mn were lower than the background values of irrigation soils in Xinjiang, whereas the average concentrations of Cd, Cr, Ni, Pb, and Zn exceeded the background values of irrigation soils: 60.58, 1.25,1.50, 4.95, and 5.10 times, respectively. The average concentration of Cd exceeded the national standard by 12.12 times, while the average concentrations of other heavy-metal elements were lower than the allowed national standard for soil environmental quality of China. In can be seen that Cd was the relatively high heavy-metal element contamination in farmland soils of Baghrash County.
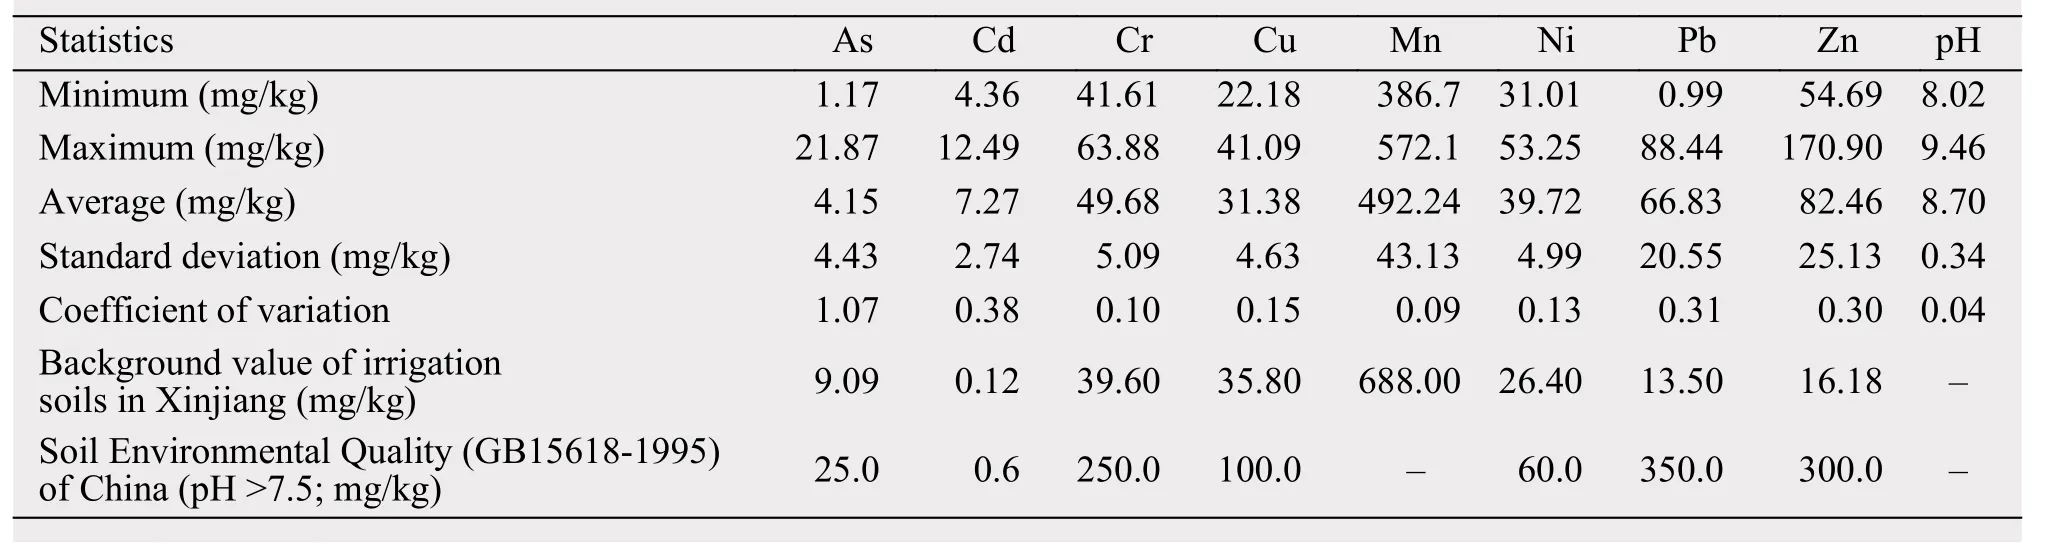
Table 1 Descriptive statistics of heavy-metal concentrations in Baghrash County
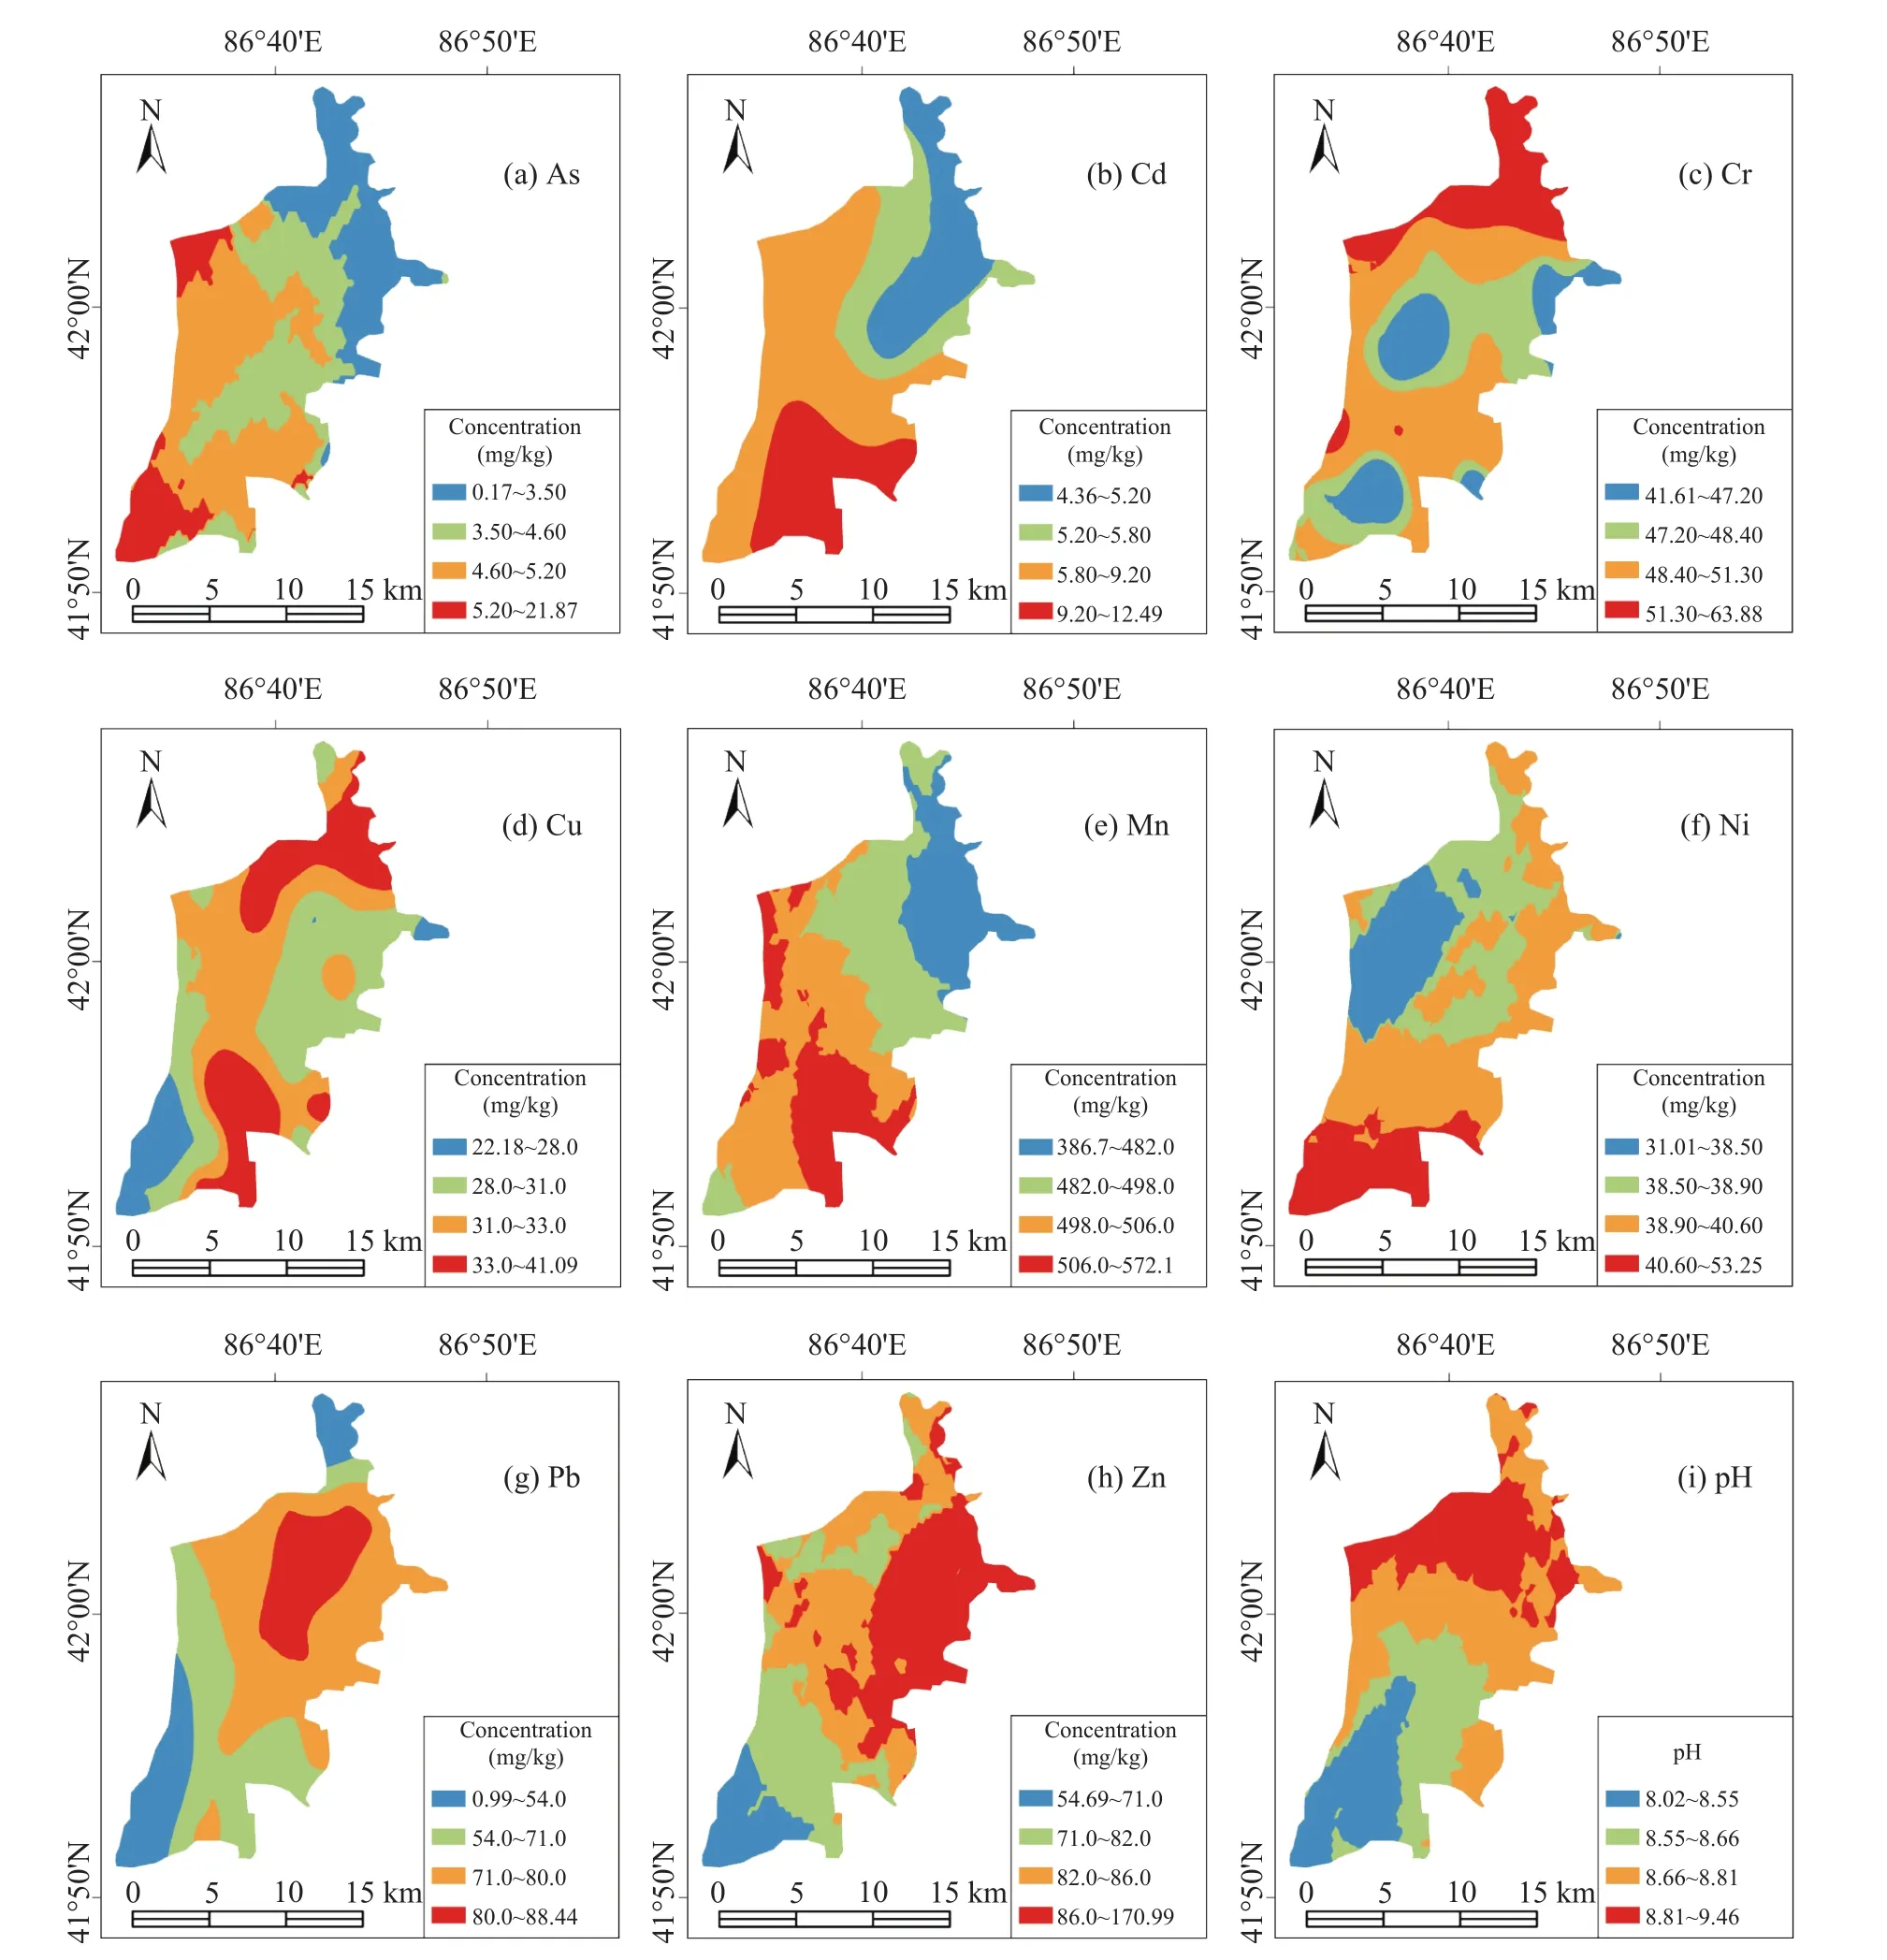
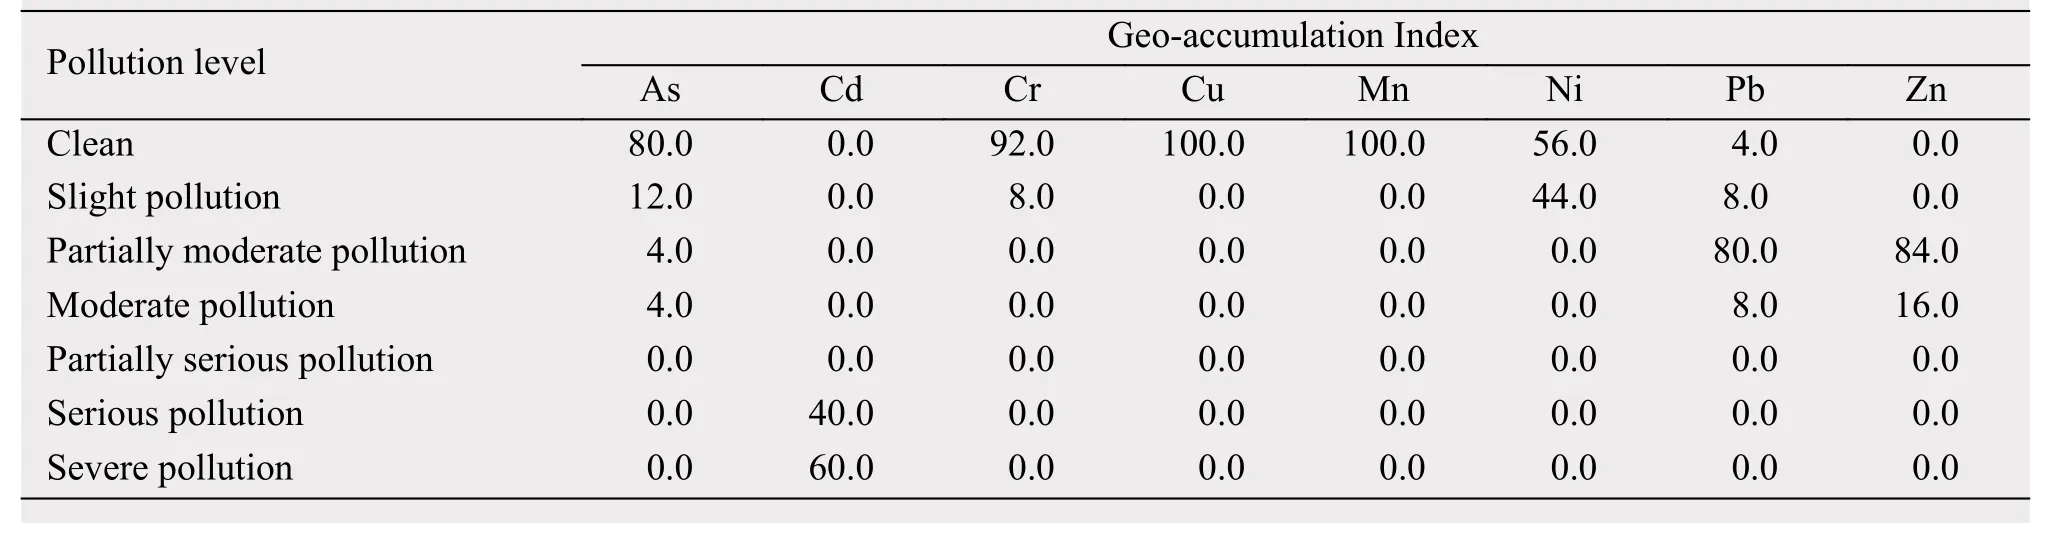
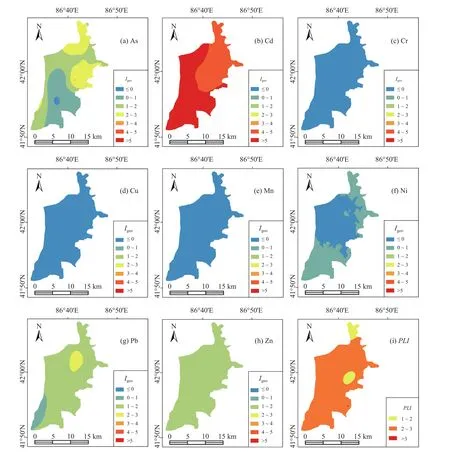
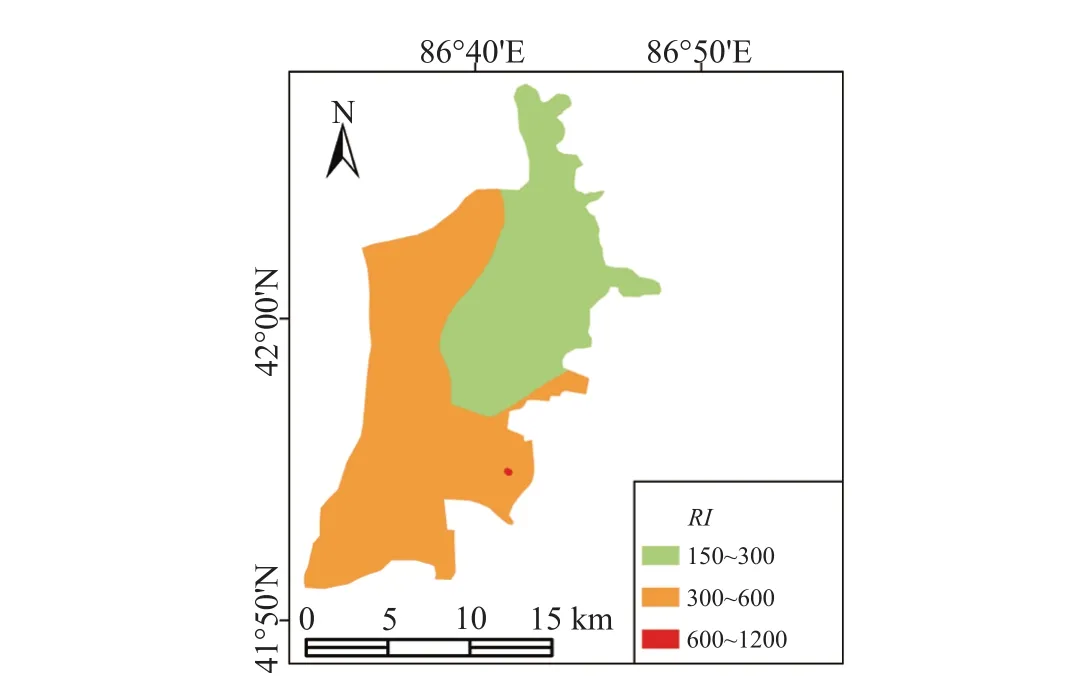
Coefficient of variation (CV) indicates the different dimensions of indicators. A heavy-metal concentration exhibiting a low CV is associated with natural sources, and a high CV is mainly sourced from human activities (Lei et al., 2013). Table 1 showed that the CV of As was 1.07, with high variation (CV>0.5); and the CV of Cd, Pb, and Zn was 0.38, 0.31,and 0.30, respectively, with medium variation (0.25 Ordinary kriging, based on GIS technology, was applied for mapping the spatial distribution patterns of heavy-metal concentrations and pH values of farmland soils in the study area (Figure 2). It can be seen that the spatial distributions of eight heavy-metal elements in the farmland soils were substantially heterogeneous and may be caused by different sources. The spatial distribution patterns of As, Cd, Mn, and Ni were similar. Higher concentrations of these elements were observed mainly around the southern parts of the study area, whereas lower concentrations were observed mainly around the northern parts. The spatial distribution patterns of the concentrations of Cr and Cu were similar. Higher concentrations of these two elements were observed mainly around the northern parts of the study area, whereas lower contents were observed mainly around the central parts. The spatial distribution of the concentrations of Pb and Zn was similar. Higher concentrations of Pb and Zn were observed mainly around the southwestern parts,whereas lower concentrations were observed mainly around the eastern and central parts of the study area.The pH value of farmland soils gradually decreased from the northern parts of the study area to the southern parts. The Geo-accumulation Index (Igeo) and the Pollution Load Index (PLI) of farmland soils in Baghrash County were calculated according to Equations (1) to(3). Results indicated that the average values of the Geo-accumulation Index for heavy metals in the study area were ranked in the order of Cd (5.26) > Zn (1.73)> Pb (1.46) > Ni (0.01) > Cr (?0.26) > Cu (?0.77) >As (?0.94) > Mn (?1.06). The average value of Igeofor Cd fell into the severe pollution range, whereas the average values of Igeofor Pb and Zn indicated partially moderate pollution; Ni, slight pollution; and Cr,Cu, As, and Mn, no pollution. According to the classification standard, the average Igeoof all soil samples of Cu and Mn fell into the no-pollution range, as did 80.0% and 92.0% of the soil samples of As and Cr,respectively. For Pb and Zn, respectively, 80.0% and 84.0% of the soil samples indicated partially moderate pollution. For Ni, 56.0% of the soil samples fell into the no-pollution range and 44.0% fell into slight pollution. However, 40.0% of the soil samples of Cd indicated serious pollution, with 60.0% of the soil samples of Cd falling into the severe pollution range(Table 3). Figure 2 The spatial distribution of heavy-metal concentrations and different pH in the study area The Pollution Load Index (PLI) of heavy metals of farmland soils varied from 1.22 to 3.05, with an average value of 2.44, at the heavy pollution level.Among the 25 soil samples, 12.0% indicated a moderate pollution level; 84.0%, heavy pollution; and 4.0%,extremely heavy pollution level. As can be seen, Cd contributed most to the contamination of farmland soils in the study area. The spatial distribution patterns of the Geo-accumulation Index (Figures 3a to 3h) and the Pollution Load Index (Figure 3i) of farmland soils in the study area were mapped using the kriging interpolation method, based on the measured data from sampling sites (Figure 3). Table 2 Percentages of soil samples at different Igeo in the total soil samples (%) Table 3 Percentages of soil samples at different E and RI in the total soil samples (%) As can be seen from Figure 3, the spatial distribution of the Geo-accumulation Index for eight heavymetal elements in the farmland soils was also substantially heterogeneous. The spatial distribution patterns of Cr, Cu, and Mn were the same, with no pollution observed in the whole study area. Partially moderate pollution of Zn was also observed in whole study area. Moderate pollution of As was observed mainly around the northern parts of the study area, whereas slight pollution was observed mainly around the southern parts. The spatial distribution of the Geo-accumulation Index for Cd showed a zonal distribution pattern. Seriously polluted areas were distributed in the northern parts of the study area, whereas severely polluted areas were distributed in the southern parts.No pollution by Ni was observed mainly in the central parts, whereas slight pollution was observed mainly around the northern and southern parts of the study area. Moderate pollution of Pb was observed mainly around the northern parts of the study area.The spatial distribution of PLI showed that moderately polluted areas were distributed around the northern and central parts, while heavily polluted areas covered most parts of the study area. The individual potential ecological risk index (E)and the integrated potential ecological risk index (RI)can represent the sensitivity of various ecosystems to toxic substances and can identify the potential ecological risks caused by heavy metals (Liu et al., 2015).E and RI of farmland soils in Baghrash County were calculated according to Equation (4). Results indicated that the average values of E for heavy metals in the study area was ranked in the order of Cd (367.81)> As (4.82) > Ni (3.33) > Cu (1.59) > Pb (0.95) > Cr(0.40) > Zn (0.28). The average value of E for Cd in study area indicated extremely high ecological risk,whereas the average values of E for As, Cr, Cu, Ni,Pb, and Zn indicated a low ecological risk stature. According to the classification standard, the average E of all soil samples of As, Cr, Cu, Ni, Pb, and Zn fell into the low ecological risk range. For Cd, however,48.0% and 52.0% of the soil samples fell into high ecological risk and extremely high ecological risk statures, respectively. The RI varied from 224.81 to 635.49, with an average value of 379.17, indicating a considerable ecological risk stature. Among the 25 soil samples, 41.66% of them fell into the range of considerable ecological risk; 54.17%, high ecological risk; and 4.17%, extremely high ecological risk(Table 3). It can be seen that Cd contributed the most to the degree of RI. The spatial distribution patterns of RI were very similiar to those of the Geo-accumulation Index of Cd, which also showed a zonal distribution pattern(Figure 4). Areas with moderate ecological risks were distributed mainly in the northern parts of the study area, whereas areas with considerable ecological risks were distributed in the southern parts. These meas-uresindicated that Cd contributed most to the RI in the study area. This research aimed at a quantitative assessment of the spatial distribution, pollution, and ecological risk stature of heavy metals in farmland soils of Baghrash County, China, based on GIS, the Geo-accumulation Index, the Pollution Load Index, and the Potential Ecological Risk Index. It can be concluded as follows. Figure 3 The spatial distribution of the Geo-accumulation Index and the Pollution Load Index The average concentrations of Cd exceeded 12.12 times the allowed national standard for soil environmental quality of China. The average contents of Cd,Cr, Ni, Pb, and Zn exceeded the background values of irrigation soils in Xinjiang by 60.58, 1.25, 1.50, 4.95,and 5.10 times, respectively. The average value of the Geo-accumulation Index for Cd fell into the severe pollution range; Pb and Zn, partially moderate pollution; Ni, slight pollution; and Cr, Cu, As, and Mn, no pollution. The Pollution Load Index of heavy metals of farmland soils varied from 1.22 to 3.05 with an average value of 2.44, indicating the heavy pollution level. The individual potential ecological risk index for heavy metal in the study area was ranked in the order of Cd > As > Ni > Cu > Pb > Cr > Zn. The integrated potential ecological risk index varied from 224.81 to 635.49 with an average value of 379.17, indicating considerable ecological risk. However, high contamination and ecological risks exist in farmland soils of the study area. Figure 4 Spatial distribution of RI for farmland soils The geostatistical analysis and kriging interpolation method are very useful for identifying contaminated regions where soil resources are at ecological risk, and for obtaining better understanding of the pollution and potential ecological risks of soils. Results of geostatistical analysis indicated that the spatial distribution patterns of eight heavy-metal elements were substantially heterogeneous. Moderately polluted areas of PLI were distributed around the northern and central parts of the study area, while heavily polluted areas covered most parts of the study area. Moderate risk areas were distributed mainly in the northern parts, whereas considerable risk areas were distributed in the southern parts. Cd contributed the most to the PLI and RI in the study area, with farmland soils of the study area polluted at a high level due to the high contamination of Cd. Therefore, the pollution risk of Cd should be a major concern, and human activities should be cautious. This work can considered as an early warning of heavy-metal pollution of farmland soils in the study area. It can provide a scientific basis for environmental protection policies and for protecting environmental safety of farmland soils in the study area. Acknowledgments: This research was supported by the Fund for Training Program of Distinguished Young Scientists of Xinjiang (No. qn2015jq003) and the National Natural Science Foundation of China (No. 41561073 and No.41361002). Acosta JA, Faz A, Martínez-Martínez S, et al., 2011. Multivariate statistical and GIS-based approach to evaluate heavy metals behavior in mine sites for future reclamation. Journal of Geochemical Exploration, 109(1–3): 8–17. DOI: 10.1016/j.gexplo.2011.01.004. Carr R, Zhang CS, Moles N, et al., 2008. Identification and mapping of heavy metal pollution in soils of a sports ground in Galway City,Ireland, using a portable XRF analyser and GIS. Environmental Geochemistry and Health, 30(1): 45–52. DOI: 10.1007/s10653-007-9106-0. Chen HY, Teng YG, Lu SJ, et al., 2015. Contamination features and health risk of soil heavy metals in China. Science of the Total Environment, 512–513: 143–153. DOI: 10.1016/j.scitotenv.2015.01.025. Cicchella D, De Vivo B, Lima A, 2005. Background and baseline concentration values of elements harmful to human health in the volcanic soils of the metropolitan and provincial areas of Napoli(Italy). Geochemistry: Exploration, Environment, Analysis, 5(1):29–40. DOI: 10.1144/1467-7873/03-042. Duan QN, Lee JC, Liu YS, et al., 2016. Distribution of heavy metal pollution in surface soil samples in China: a graphical review. Bulletin of Environmental Contamination and Toxicology, 97(3):303–309. DOI: 10.1007/s00128-016-1857-9. Giller KE, Witter E, Mcgrath SP, 1998. Toxicity of heavy metals to microorganisms and microbial processes in agricultural soils: a review. Soil Biology and Biochemistry, 30(10–11): 1389–1414. DOI:10.1016/S0038-0717(97)00270-8. Goovaerts P, 1997. Geostatistics for Natural Resources Evaluation.New York: Oxford University Press. H?kanson L, 1980. An ecological risk index for aquatic pollution control-A sedimentological approach. Water Research, 14(8):975–1001. DOI: 10.1016/0043-1354(80)90143-8. Heberer T, 2002. Occurrence, fate, and removal of pharmaceutical residues in the aquatic environment: a review of recent research data. Toxicology Letters, 131(1–2): 5–17. DOI: 10.1016/S0378-4274(02)00041-3. Hu CH, Jiang JH, Zhou WB, 2012. Risk evaluation and sources analysis of heavy metals in vegetable field soil of rural area around Poyang Lake. Scientia Geographica Sinica, 32(6): 771–776. DOI:10.13249/j.cnki.sgs.2012.06.771. Imperato M, Adamo P, Naimo D, et al., 2003. Spatial distribution of heavy metals in urban soils of Naples city (Italy). Environmental Pollution, 124(2): 247–256. DOI: 10.1016/S0269-7491(02)00478-5. Karim Z, Qureshi BA, Mumtaz M, et al., 2014. Heavy metal content in urban soils as an indicator of anthropogenic and natural influences on landscape of Karachi-a multivariate spatio-temporal analysis.Ecological Indicators, 42: 20–31. DOI: 10.1016/j.ecolind.2013.07.020. Leake JR, Adam-Bradford A, Rigby JE, 2009. Health benefits of 'grow your own' food in urban areas: implications for contaminated land risk assessment and risk management? Environmental Health,8(S1): 56. DOI: 10.1186/1476-069X-8-S1-S6. Lei GJ, Chen ZL, Liu QJ, et al., 2013. The assessments of polluted degree and potential ecological hazards of heavy metals in suburban soil of Guangzhou City. China Environmental Science, 33(S1):49–53. Liu MX, Yang YY, Yun XY, et al., 2015. Concentrations, distribution,sources, and ecological risk assessment of heavy metals in agricultural topsoil of the Three Gorges Dam region, China. Environmental Monitoring and Assessment, 187(3): 147. DOI: 10.1007/s10661-015-4360-6. Madrid L, Díaz-Barrientos E, Madrid F, 2002. Distribution of heavy metal contents of urban soils in parks of Seville. Chemosphere,49(10): 1301–1308. DOI: 10.1016/S0045-6535(02)00530-1. Mamat Z, Haximu S, Zhang ZY, et al., 2016. Erratum to: an ecological risk assessment of heavy metal contamination in the surface sediments of Bosten Lake, Northwest China. Environmental Science and Pollution Research, 23(8): 7266. DOI: 10.1007/ s11356-015-6020-3. Mamattursun E, 2016. Environmental Evolution and Ecological Security in Inner River Basin. Beijing: Beijing Institute of Technology Press. Ministry of Environmental Protection (MEP), 2014. National soil pollution survey of China. Beijing: Ministry of Environmental Protection (MEP). National Environmental Protection Agency, State Bureau of Technical Supervision, 2006. GB 15618-1995 Environmental Quality STANDARD for Soils. Beijing: Standards Press of China. Oseni OM, Adelusi AA, Dada EO, et al., 2016. Effects of heavy metal(Pb) concentration on some growth parameters of plants grown in lead polluted soil under organic fertilizer amendment. Sciences in Cold and Arid Regions, 8(1): 36–45. DOI: 10.3724/SP.J.1226.2016.00036. Pucci AA Jr, Murashige JAE, 1987. Applications of universal kriging to an aquifer study in New Jersey. Groundwater, 25(6): 672–678.DOI: 10.1111/j.1745-6584.1987.tb02207.x. Qiu ML, Li FB, Wang Q, et al., 2015. Spatio-temporal variation and source changes of heavy metals in cultivated soils in industrial developed urban areas. Transactions of the Chinese Society of Agricultural Engineering, 31(2): 298–305. DOI: 10.3969/j.issn.1002-6819.2015.02.041.10.1016/j.gexplo.2010.01.006. State Environmental Protection Administration of China (SEPAC),2004. HJ/T 166-2004 Technical specification for soil environmental monitoring. Teng YG, Ni SJ, Wang JS, et al., 2010. A geochemical survey of trace elements in agricultural and non-agricultural topsoil in Dexing area, China. Journal of Geochemical Exploration, 104(3): 118–127.DOI: 10.1016/j.gexplo.2010.01.006. The Ministry of Agriculture of the People's Republic of China(MAPRC), 2000. NY/T 395-2000 Procedural Regulations Regarding the Enviroment Quality Monitoring of Soil. Beijing: Standards Press of China. Tomlinson DL, Wilson JG, Harris CR, et al., 1980. Problems in the assessment of heavy-metal levels in estuaries and the formation of a pollution index. Helgol?nder Meeresuntersuchungen, 33(1–4):566–575. DOI: 10.1007/BF02414780. Wang J, Chen ZL, Wang C, et al., 2007. Heavy metal content and ecological risk warning assessment of vegetable soils in Chongming island, Shanghai City. Environmental Science, 28(3): 647–653.DOI: 10.3321/j.issn:0250-3301.2007.03.036. Wang ME, Peng C, Chen WP, 2016. Impacts of industrial zone in arid area in Ningxia province on the accumulation of heavy metals in agricultural soils. Environmental Science, 37(9): 3532–3539. DOI:10.13227/j.hjkx.2016.09.035. Wang QR, Dong Y, Cui Y, et al., 2001. Instances of soil and crop heavy metal contamination in China. Soil and Sediment Contamination, 10(5): 497–510. DOI: 10.1080/20015891109392. Zhang CS, 2006. Using multivariate analyses and GIS to identify pollutants and their spatial patterns in urban soils in Galway, Ireland.Environmental Pollution, 142(3): 501–511. DOI: 10.1016/j.envpol.2005.10.028. Zheng GZ, 2007. Theory and Practice of Research on Heavy Metal Pollution in Agricultural Soil. Beijing: China Environmental Science Press. Zhong XL, Zhou SL, Li JT, et al., 2010. Evaluation of soil heavy metals accumulation in the fast economy development region. Environmental Science, 31(6): 1608–1616. : Mamut A, Eziz M, Mohammad A, et al., 2017. Contamination and risk assessment of heavy metals in farmland soils of Baghrash County, Xinjiang, Northwest China. Sciences in Cold and Arid Regions, 9(5): 0467–0475. 10.3724/SP.J.1226.2017.00467. *Correspondence to: Mamattursun Eziz, Vice Professor of College of Geographical Science and Tourism, Xinjiang Normal University. No. 102, Xinyi Road, Urumqi, Xinjiang 830054, China. E-mail: oasiseco@126.com December 29, 2016 Accepted: March 16, 20173.2 The spatial distribution of heavy-metal concentrations and pH value of farmland soils
3.3 Pollution assessment of farmland soils
3.4 Potential ecological risk assessment of farmland soils
4 Conclusions
 Sciences in Cold and Arid Regions2017年5期
- Sciences in Cold and Arid Regions的其它文章
- High-quality draft genome sequence of Streptomyces agglomeratus 5-1-8 with strong anti-MRSA ability, isolated from the frozen soil of Tibet in China
- Intrastorm stemflow variability of a xerophytic shrub within a water-limited arid desert ecosystem of northern China
- Palynological assemblage in the late Early Cretaceous from Sikouzi Section, Liupanshan Group, Central China and its implication to paleoenvironment change
- Complex network analysis of climate change in the Tarim River Basin, Northwest China
- Chemistry and environmental significance of aerosols collected in the eastern Tianshan
- Characteristics of thawed interlayer and its effect on settlement beneath embankment in permafrost regions-A case study for the Qinghai-Tibet Highway