
Regional Features and Seasonality of Land–Atmosphere Coup ling over Eastern China
2018-04-08 10:59:11ChujieGAOHaishanCHENShanleiSUNBeiXUVictorONGOMASiguangZHUHediMAandXingLI
Advances in Atmospheric Sciences 2018年6期
Chujie GAO,Haishan CHEN?,Shanlei SUN,Bei XU,Victor ONGOMA,Siguang ZHU,Hedi MA,and Xing LI
1Key Laboratory of Meteorological Disaster,Ministry of Education(KLME)/International Joint Research Laboratory of Climate and Environment Change(ILCEC)/Collaborative Innovation Center on Forecast and Evaluation of Meteorological Disasters(CIC-FEMD),Nanjing University of Information Science and Technology,Nanjing 210044,China
2College of Atmospheric Science,Nanjing University of Information Science and Technology,Nanjing 210044,China
3Department of Meteorology,South Eastern Kenya University,P.O.Box 170,Kitui 90200,Kenya
1. Introduction
In the early 21st century,the Global Land–Atmosphere Coupling Experiment presented a basic concept for studying the effects of land surface factors on atmospheric predictability based on model intercomparison(Koster et al.,2004,2006).The strength of land–atmosphere coupling is used to denote the potential contribution of land surface states to the variabilities of atmospheric circulation and climate variables such as precipitation and temperature.Soil moisture(SM)acts as a reserve of water and energy because soil retains wet and dry conditions longer than the atmosphere.Therefore,the soil has the potential to affect the atmospheric conditions through different coupling mechanisms(Koster and Suarez,2001;Wu and Dickinson,2004;Seneviratne et al.,2006b;Wei et al.,2008;Spennemann and Saulo,2015).Land–atmosphere coupling,in terms of the degree of SM that affects precipitation and surface temperature(ST),has been extensively studied(Seneviratne et al.,2006a;Zhang et al.,2008a,2008b,2009,2011;Wei and Dirmeyer,2012;Ruscica et al.,2014;Guillod et al.,2015;Tuttle and Salvucci,2016).In fact,we need to consider the impact of SM on evapotranspiration(ET)and further ST,rather than the atmospheric control of ET and ST,to better understand the land–atmosphere coupling.
The impact of SM on ET is considered to be the first segment of the connection from land surface states to the atmosphere(Dirmeyer,2011).First of all,SM is an important source of the atmospheric water.Through ET,a major component of the continental water cycle,SM returns approximately 60%of the total precipitation that falls on land back to the atmosphere(Oki and Kanae,2006).Secondly,SM also plays an important role in the land surface energy balance,since ET consumes more than half of the total solar energy absorbed by the land surface(Trenberth et al.,2009).Thus,SM can evidently influenc the thermal condition of the land surface through ET,consequently affecting the atmosphere(Zhang and Zuo,2011;Gao et al.,2014).So,the relationship between SM and ET is a key process in the land–atmosphere interface and is also the focus of our study.
In addition,the key regions or“hot spots”of land–atmosphere coupling are unevenly distributed.By analyzing the mean states of multi-model simulations in summer(Koster et al.,2004),those“hot spots”mainly appear in transitional climates between dry and wet zones,such as the central Great Plains of North America,the Sahel,and India.For each of the individual models,the land–atmosphere coupling intensity and spatial pattern are distinctly different,indicating that there are also numerous uncertainties in the SM feedback.More studies have further con fi rmed that the SM effects on climate change are mainly detected in the dry–wet transition zones(Wei et al.,2008;Dirmeyer,2011;Hua et al.,2013).The reason is that SM and ET are not simply linearly related.For example,SM does not constrain ET if soil water content fully meets the land surface evaporation and demand of plants(i.e.,an“extreme wet condition”).On the other hand,if the soil is too dry(i.e.,an“extreme dry condition”),then ET stops completely(Seneviratne et al.,2010;Bellucci et al.,2015).SM does not control ET under either extreme wet or dry conditions.For this reason,most of the inferred effects of SM on climate systems(strong land–atmosphere coupling)are induced by its constraints on ET under the transitional conditions between dry and wet zones.
Compared toSM–precipitation coupling,SM–temperature coupling is more distinct(Zhang et al.,2011;Zhang and Zuo,2011;Wu and Zhang,2013).For instance,lower SM usually results in less ET and weaker evaporative cooling,which leads to higher ST(Mei and Wang,2012;Zittis et al.,2013).Meanwhile,another interpretation of this negative correlation exists:high ST acts as a primary forcing factor,thereby increasing ET and drying the soil(Nicholls,2004;Cai and Cowan,2008).This hypothesis suggests that high(low)ST causes dry(wet)soil.In summary,SM–ST relationships can be used to classify the conditions for ET processes as water-lim ited(SM constrains ET)or energy-lim ited(ET is controlled by atmospheric backgrounds,and no land–atmosphere coupling exists under such a condition)(Koster et al.,2009;Seneviratne et al.,2010;Yin et al.,2014a),which is also closely related to dry–wet climate conditions.
Previous studies have emphasized the spatial pattern of land–atmosphere coupling and identi fi ed“hot spots”with strong SM–climate feedback.However,less attention has been paid to seasonal changes of land–atmosphere coupling(Wei and Dirmeyer,2012;Wei et al.,2012),especially in China,where complex spatial and seasonal climate variations exist.In this study,we attempt to identify hot spots of land–atmosphere coupling and explore the seasonal changes of such coupling over China.
The remaining parts of this work are organized as follows:Section 2 introduces the datasets and methods;section 3 presents the relationships among SM,ST and ET over the study area;sections 4 and 5 discuss and summarize the fi ndings,respectively.
2. Data and methods
2.1. Study area
China has a vast territory and is a typical monsoon region,exhibiting varying climatic conditions(Guo et al.,2003;He et al.,2007).Figure 1 shows eastern China(east of 95°E)and its major geographical regions.In general,the elevation decreases from west to east,and a typical East Asian monsoon climate system prevails across this area(Jiang et al.,2015).Additionally,previous studies(e.g.,Ge and Feng,2009;Hu et al.,2015)have pointed out that more than 96%of China’s population lives in this area.Therefore,the local land–atmosphere coupling influences human life and needs to be explored extensively.
2.2. Reanalysis dataset
Because of a lack of observations,studies related to SM on larger spatial and longer time scales are still very limited.However,the recent development and availability of various satellite-derived and reanalysis SM datasets make it possible to understand relevant scientific questions more comprehensively.The uncertainties in satellite-derived SM data and the weaknesses of current quality controls(Yin et al.,2014b)are likely to introduce some uncertainties into our results.According to Zuo and Zhang(2007,2009),the spring SM of the European Centre for Medium-Range Weather Forecasts(ECMWF)ERA-40 dataset(1948–2002)can reproduce the temporal and spatial features of observed SM in eastern China reasonably well.Moreover,Zhang et al.(2008c)compared the ERA product with other multi-source datasets(e.g.,observations,NCEP/NCAR,GSWP2 and CLM)and found that ERA-40 can better capture the interannual and interdecadal variabilities of observed SM.
Recently,the ECMWF released a new product:ERAInterim(Balsamo et al.,2015).In this dataset,the Tiled ECMWF Scheme used for the surface exchanges within the Land Surface Model(van den Hurk et al.,2000)is the same as that employed by ERA-40.The assimilation method,however,was upgraded from the 3D variational method of ERA-40 to a 4D variational approach in ERA-Interim(Dee et al.,2011).To further reduce the biases between the ERA-simulated variables and observations,the observed relative humidity and temperature are continuously used to adjust the SM(Douville et al.,2000;Mahfouf et al.,2000).By comparing several sets of reanalysis data(e.g.,ERA-Interim,MERRA,JRA,CFSR,and NCEP),Liu et al.(2014)noted that ERA-Interim performs best in reproducing the spatial and temporal features of the SM over eastern China.This dataset also captures the major characteristics of precipitation and evaporation,which are the two main factors affecting SM.Overall,ERA-Interim is preferable to other datasets in representing the spatial and temporal character-istics of the actual SM.Thus,this SM dataset is selected for this study,which is available at http://www.ecmw f.int/en/research/climate-reanalysis/era-interim/land.The soil consists of four layers of thickness,i.e.,7,21,72 and 189 cm from top to bottom,with a horizontal resolution of 1°×1°.Considering the greater accuracy of the near-surface ERA SM and its stronger interaction with ET(Zhang et al.,2008c;Zuo and Zhang,2009),we select the first layer of ERA SM for further analyses.Besides,the surface latent heat flux and top layer soil temperature are chosen to represent ET and ST in our study.The study period is from March 1979 to February 2014.
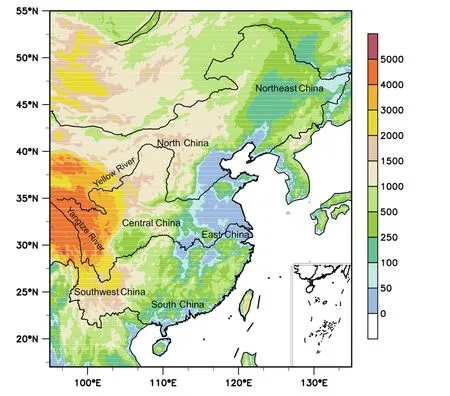
Fig.1. Topography(units:m)and major geographical regions in eastern China.The geographical regions are based on Zhao(1995).The elevation data are from the Global 30 Arc-Second Elevation(GTOPO30-10min)dataset:https://lta.cr.usgs.gov/GTOPO30.
2.3. Model simulation
To enhance confidence in our results,a group of numerical experiments simulated by version 4.0 of NCAR’s Community Land Model(CLM 4.0,http://www.cesm.ucar.edu/models/cesm1.1/clm/)are used.This model is a welldeveloped land surface model and has been widely used for studies related to land surface processes(Chen et al.,2010;Xiong et al.,2011;Zhu et al.,2013).Recent studies(e.g.,Li et al.,2011;Lai et al.,2014)have stated that CLM 4.0 is capable of capturing the spatiotemporal characteristics of SM from in situ observations over China.The land cover type,soil color,texture,sand ratio and other information come from the land characteristic parameter data of the model,and the soil column is vertically represented by 15 layers(0.007,0.028,0.062,0.119,0.212,0.366,0.620,1.038,1.728,2.865,4.739,7.830,12.925,21.327,and 35.178 m).The global land surface conditions(e.g.,SM,ST,ET and heat fluxes)in the last five decades are produced by offline simulations,which are based on the global 1°×1°and 3-h atmospheric forcing dataset including near surface meteorological elements(i.e.,2-m temperature,wind speed,specific hum idity,precipitation,surface pressure,downward longwave and shortwave radiation)from 1948 to 2010 developed at Princeton University(Sheffield et al.,2006).The forcing dataset is available at http://hydrology.princeton.edu/data.pgf.php.The third layer SM(6.2 cm—close to the selected layer of ERA SM), first layer soil temperature and ET from March 1979 to February 2010 are selected for our study.
2.4. Methods
Our analyses are mainly based on Pearson correlation analysis.The monthly correlation coefficient between SM and ET(SM–ET relationship—hereafter referred to asRSM?ET)can be used to describe the extent to which SM affects ET(Dirmeyer et al.,2009;Dirmeyer,2011).A positiveRSM?ETsuggests that ET changes are primarily controlled by SM,e.g.,higher(lower)SM causes more(less)ET.This usually happens in arid regions under water-lim ited conditions.On the contrary,a negativeRSM?ETimplies that ET is mainly affected by the atmospheric environmental variables(e.g.,temperature,humidity and wind speed)and controls the changes of SM.In other words,increased(decreased)ET tends to decrease(increase)SM.Such a negativeRSM?ETtypically occurs in hum id regions under energy-limited conditions.For this reason,RSM?ETis often employed to determine the direction of land–atmosphere interactions,i.e.,how the land affects the atmosphere,and vice versa.Another widely used approach to diagnose land–atmosphere coupling is the correlation coefficient between ST and ET(RST?ET)(Zittis et al.,2013).This is also a measure of the interaction between soil and temperature through ET(Ruscica et al.,2014).RST?ETis generally positive and negative underenergy-limited and water-limited conditions,respectively.For example,whenRST?ETis positive,higher(lower)temperature(rather than SM)leads to more(less)ET.In contrast,a negativeRST?ETindicates that increased(decreased)ET results in lower(higher)temperature,which is very likely induced by an SM anomaly.To sum up,when both of the positiveRSM?ETand negativeRST?ETare significant,it is likely that SM regulates the ET process,thereby affecting ST.This situation suggests that there is a strong land–atmosphere coupling.
In this study,all data are linearly detrended before perform ing statistical analyses.
3. Results
3.1.Seasonal mean SM and ST
Figure 2 shows the seasonal mean states of SM in the two datasets.In general,both the ERA and CLM datasets are in agreement that the soil dries from southeast to northwest,and some differences(e.g.,the magnitude,location and tim ing of the maximum SM)exist among the four seasons,i.e.,spring(March–May,MAM),summer(June–August,JJA),autumn(September–November,SON)and winter(December–February,DJF).For ERA,the SM over North China is generally lower than 22%,with a dry center located west of Hetao(bend of the Yellow River),and partially reaches 25%during summer in the east.Northeast China maintains a relatively wet condition(over 25%)throughout the year.Meanwhile,the seasonal variability is larger in the southern part of the country.For the upstream region of the Yangtze River and central China,the SM in spring–autumn and winter are above and below 31%,respectively.The SM over East China and South China ranges from 28%and 25%during winter to 31%during summer,respectively.In particular,Southwest China is a dry center(<22%)during spring but a wet center(>31%)during summer and autumn.CLM basically reproduces the spatial patterns of seasonal SM.However,there are some systematic biases:wetter conditions in wet regions and drier conditions in dry regions,which is consistent with the fi ndings of Lai et al.(2014).Besides,the seasonal variability of SM for CLM is relatively low.Most obviously,there is a dry center near Hetao(<10%)and two wet centers in East China and Northeast China(>37%)that maintain their magnitudes and positions during the four seasons.Moreover,other regions demonstratecorresponding seasonalvariations,butmuch less so than in the ERA dataset.A ll in all,the dry–wet patterns from the two datasets match the dry and wet climate divisions in China over recent decades,insofar as humid/semi-hum id and arid/sem i-arid regions are located in southern and northern parts of China,and the Northeast China is an exceptional sem i-hum id region(Ma and Fu,2005;Wu et al.,2005;Zhang et al.,2016).
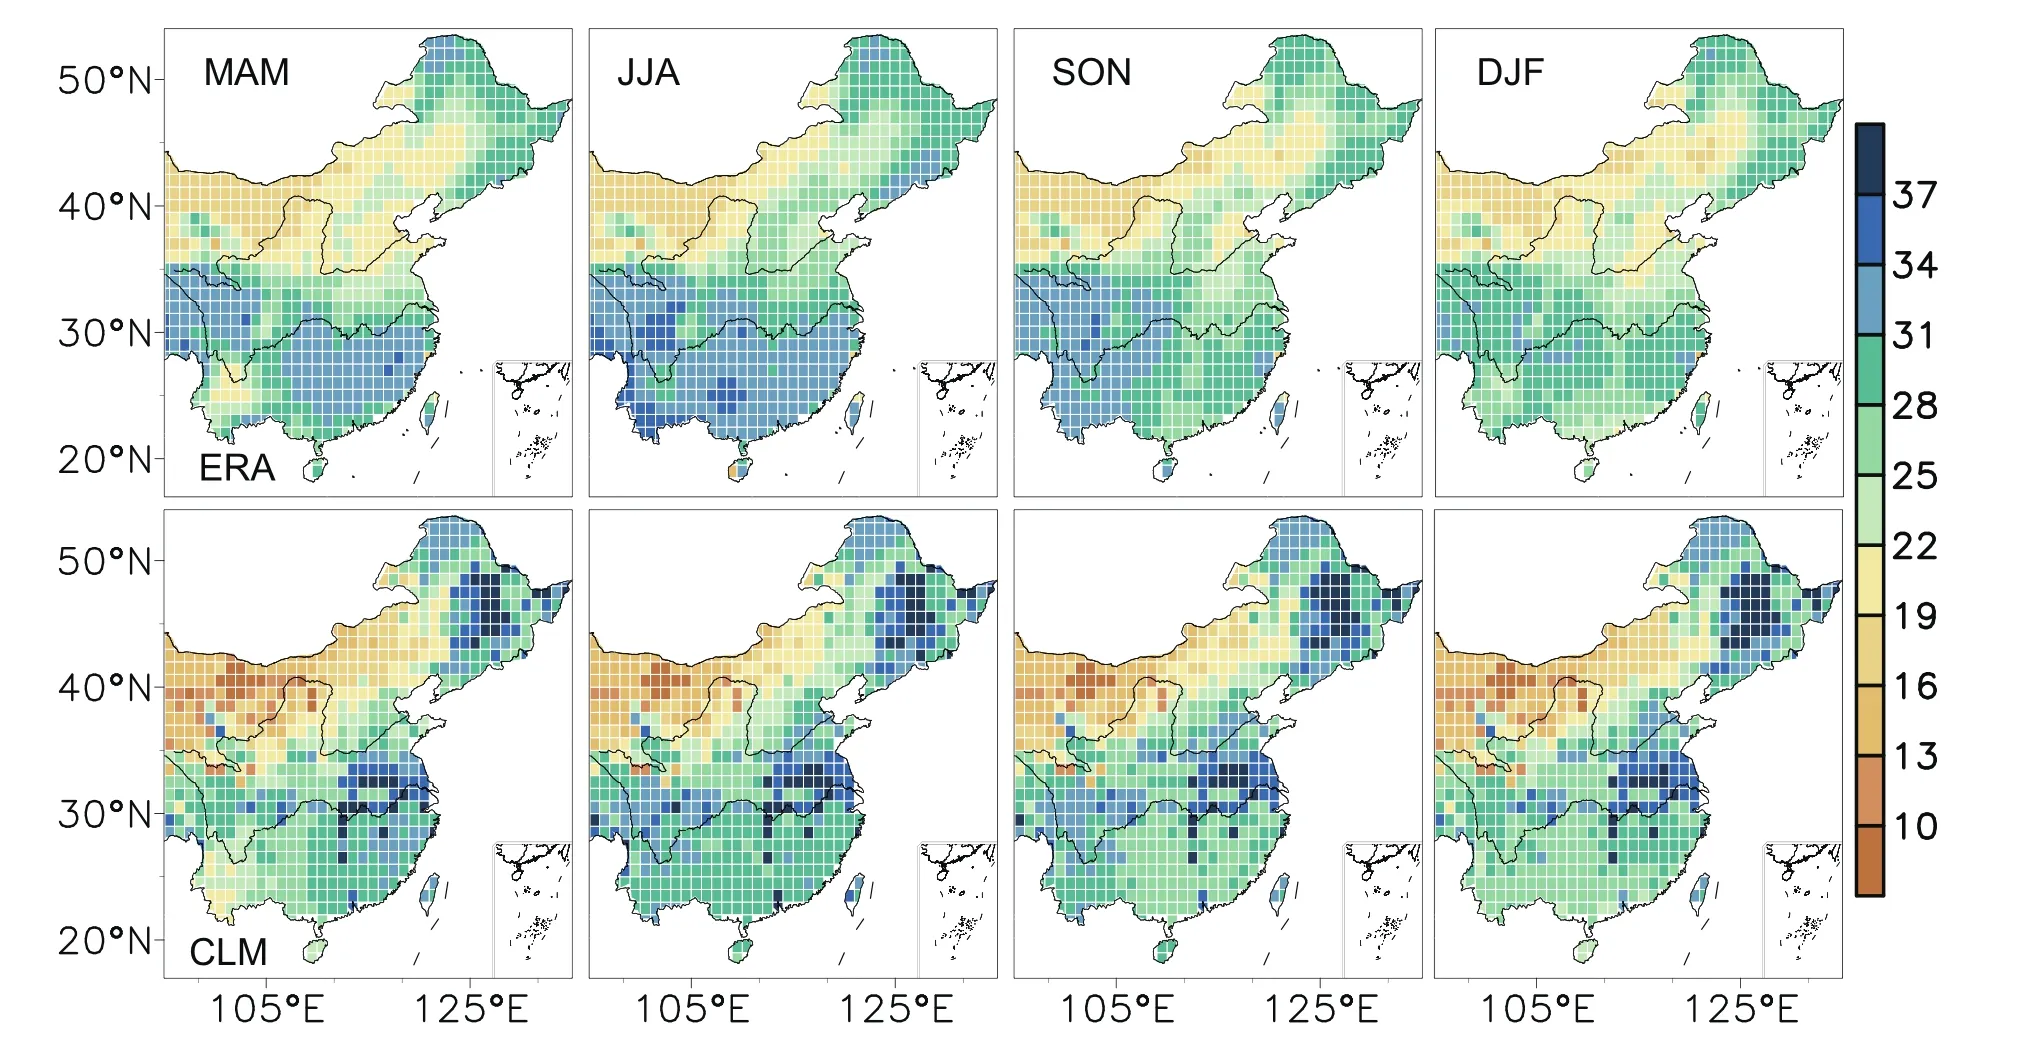
Fig.2. Seasonal mean SM for the period 1979–2013 in the ERA(7 cm,top row)and CLM(6.2 cm,bottom row)datasets(units:volume%).
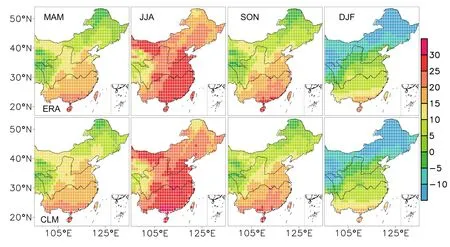
Fig.3. As in Fig.2 but for ST(units:°C).
Figure 3 presents the climatological ST of each season.The spatial distributions and seasonal changes of the ST in the two datasets are in close agreement.Generally,ST decreases from south to north.It is warmer in summer(ranging from 10°C to30°C)butcolderin winter(ranging from?15°C to 20°C).Comparing Figs.2 and 3,the ability of CLM to reproduce the ST climatology is apparently better than that of SM.
The above results show that complex spatial and seasonal changes exist in both SM and ST.In the follow ing sections,the connections between SM and ST(through ET)are further investigated.These investigations are expected to reveal the possible pathway of land–atmosphere interactions and the“hot spots”of land–atmosphere coupling over eastern China.
3.2. Spatial distributions and seasonal changes of RSM?ETand R ST?ET
As shown in Fig.4,the extent to which SM affects ET,i.e.,theRSM?ET,is mainly opposite to the SM distribution in each season(Fig.2).Generally,positive and negativeRSM?ETare roughly distributed in the dry north and wet south,respectively.significant positive values are found over North China during the four seasons for both datasets,indicating that SM evidently affects ET because of the relatively dry soil condition.For other regions,differences exist not only in different seasons,but also in the different datasets.Firstly,for ERA,Northeast China exhibits lowerRSM?ETvalues,especially during summer and winter.In contrast,the seasonal changes in negative values over hum id/sem i-hum id regions are much more complex.For example,the Yangtze River basin shows significant negativeRSM?ETduring spring and summer,whereas its downstream region(East China)shows positive values during autumn and winter.Such a reversal in the changes also appears in South and Southwest China:theRSM?ETover South China is negative in summer but positive in winter,and theRSM?ETover Southwest China changes from positive to negative between winter/spring and summer/autumn.For the CLM dataset,Northeast China shows significant negativeRSM?ETthroughout the year,except for the winter season.Besides,the seasonal variations ofRSM?ETfor hum id/sem i-hum id regions in CLM are much weaker:East China and South China maintain negative values during autumn/winter.In particular,the significant positive values over Southwest China are only shown in spring.The negativeRSM?ETindicates ET is not constrained by SM under wet soil conditions,and these differences between the two datasets may be due to the systematic biases and weaker seasonal changes in the SM simulation,as discussed in section 3.1.Overall,the positiveRSM?ET,a necessary(but not suffi-cient)condition for land–atmosphere coupling(Dirmeyer et al.,2009),is found over North China throughout the year and over Southwest China during spring in both datasets.
Figure 5 demonstrates the spatial distribution ofRST?ET,which is basically opposite to that ofRSM?ET(Fig.4).For ERA,positive values are mostly found in the humid/sem ihum id regions over the south and northea st,implying that the energy supply is the primary factor causing the ET anomaly.If the ST is higher than normal,the ET increases and dries the soil.Most of this positiveRST?ETcan be sustained for a whole year.On the contrary,theRST?ETover North China exhibits relatively larger seasonality.The values are mainly negative during the four seasons,but the most significant and robustly negative ones only appear in summer.Moreover,a reverse change inRST?ETis also shown over Southwest China:it is negative in spring and changes to positive during summer and autumn.CLM basically reproduces theRST?ETpattern of ERA.
3.3. Seasonal evolution of land–atmosphere coupling
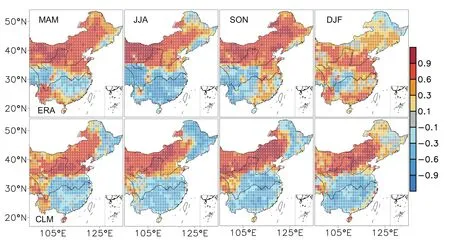
Fig.4. Spatial distributions of correlation coefficients between SM and ET(RSM?ET)in the ERA(top row)and CLM(bottom row)datasets.The dotted grid points are significant at the 95%confidence level.All data are detrended.
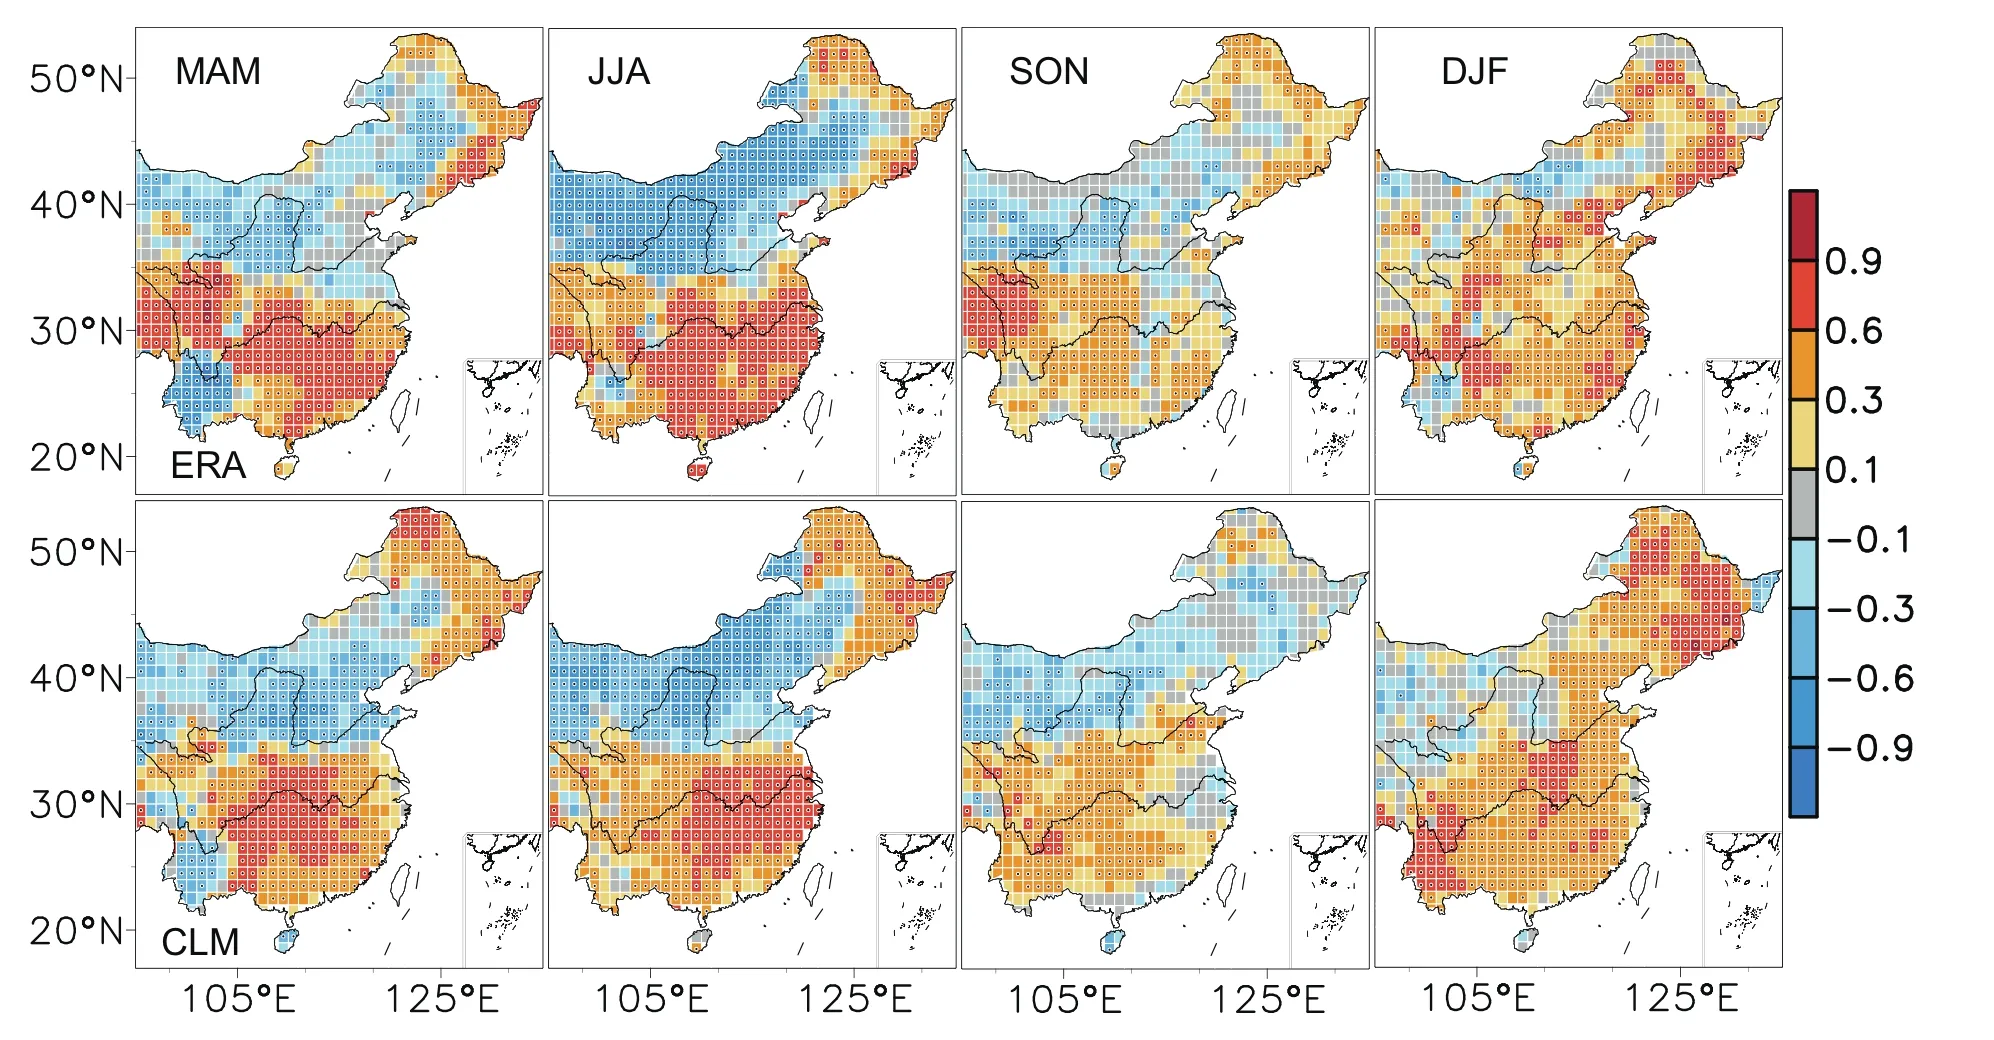
Fig.5. As in Fig.4 but for the correlation coefficients between ST and ET(RST?ET).
To further investigate the relationships betweenRSM?ET/RST?ETand SM,we produce scatterplots of the two correlation coefficients at each grid point over eastern China for the ERA and CLM datasets(Fig.6).To reduce the influenc of cold conditions(e.g.,ice,snow and frozen soil)in high latitude areas(Fig.2),only the summer pattern is chosen for analysis.It is found that bothRSM?ETandRST?ETare linearly related to SM.Under dry soil conditions,the grid points with positiveRSM?ETare primarily accompanied by negativeRST?ET,which implies that SM affects ET and ST,and a strong land–atmosphere coupling exists.With increased SM,the positiveRSM?ETis reduced and even becomes negative.Meanwhile,the negativeRST?ETis turning positive.These fi ndings indicate that the influenc of SM on ET and ST is reduced,and the land–atmosphere coupling intensity is weakened,with the transition from arid to hum id regions.It is worth mentioning that when SM is relatively lower,a close linear relationship exists betweenRSM?ETandRST?ET,implying that the coupling changes with SM can be re fl ected by each of them.However,with higher SM,this relationship becomes weak,and suggests that ST may have different infl uences onRSM?ETandRST?ET,which can be found in their seasonal cycles and is further discussed in the follow ing text.
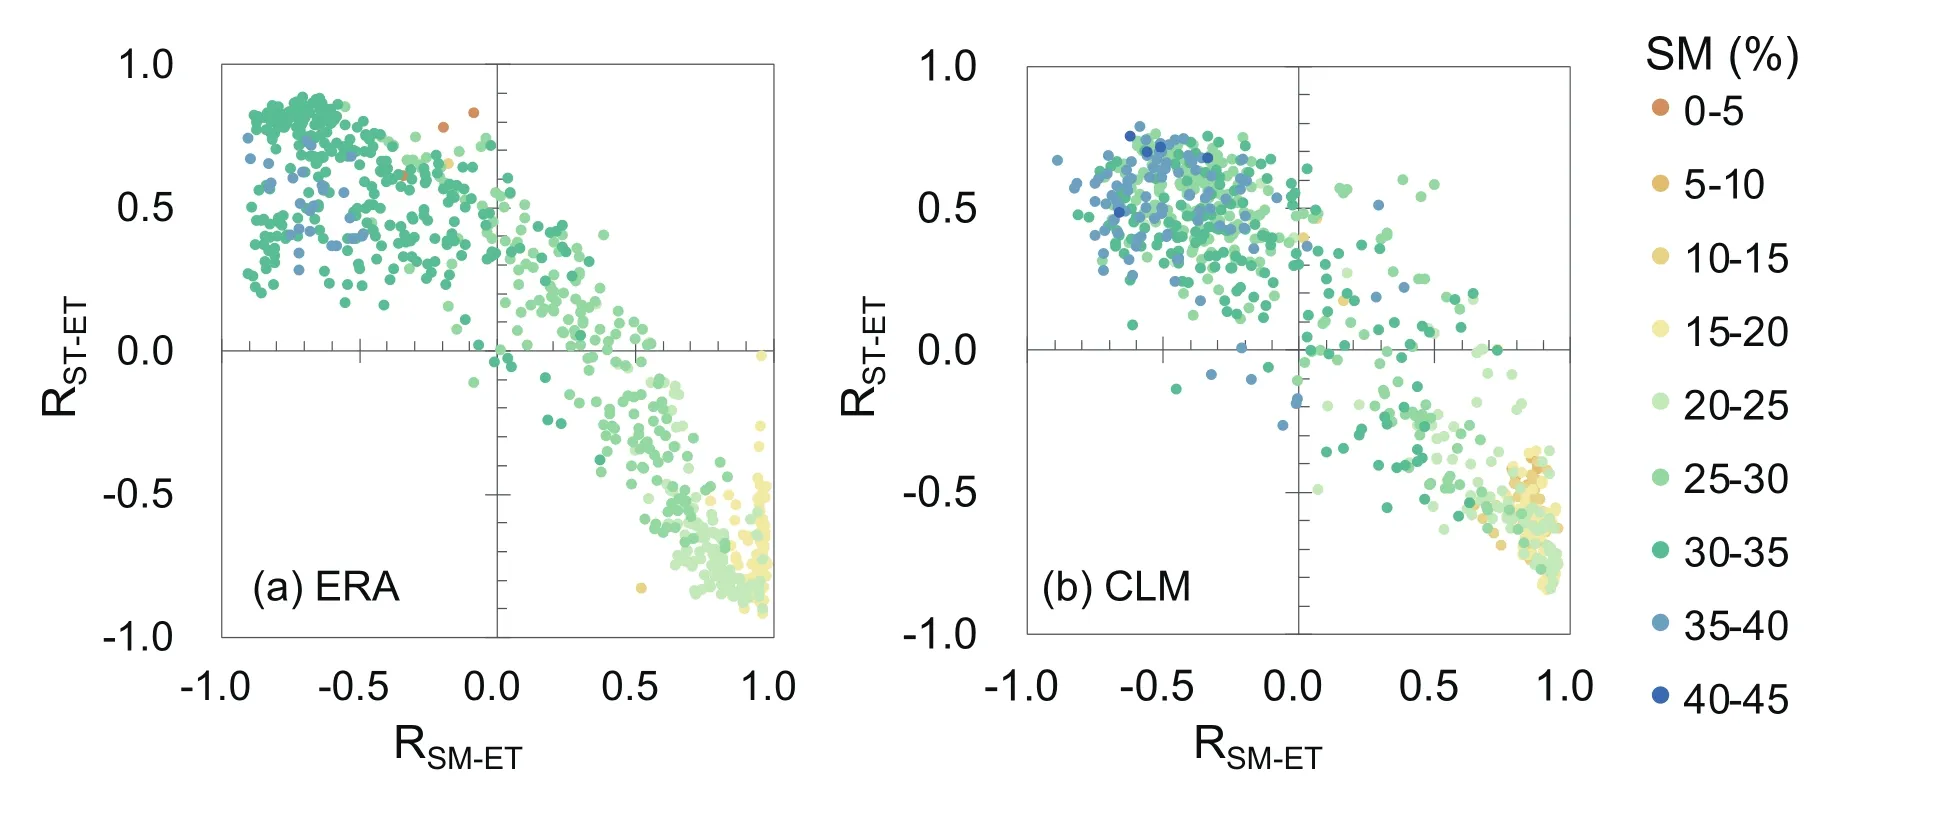
Fig.6. Relationship between RSM?ET and RST?ET in summer at each grid point over eastern China for the(a)ERA and(b)CLM dataset.The different colors denote different SM ranges(units:volume%).A ll data are detrended before the correlation coefficient is calculated.
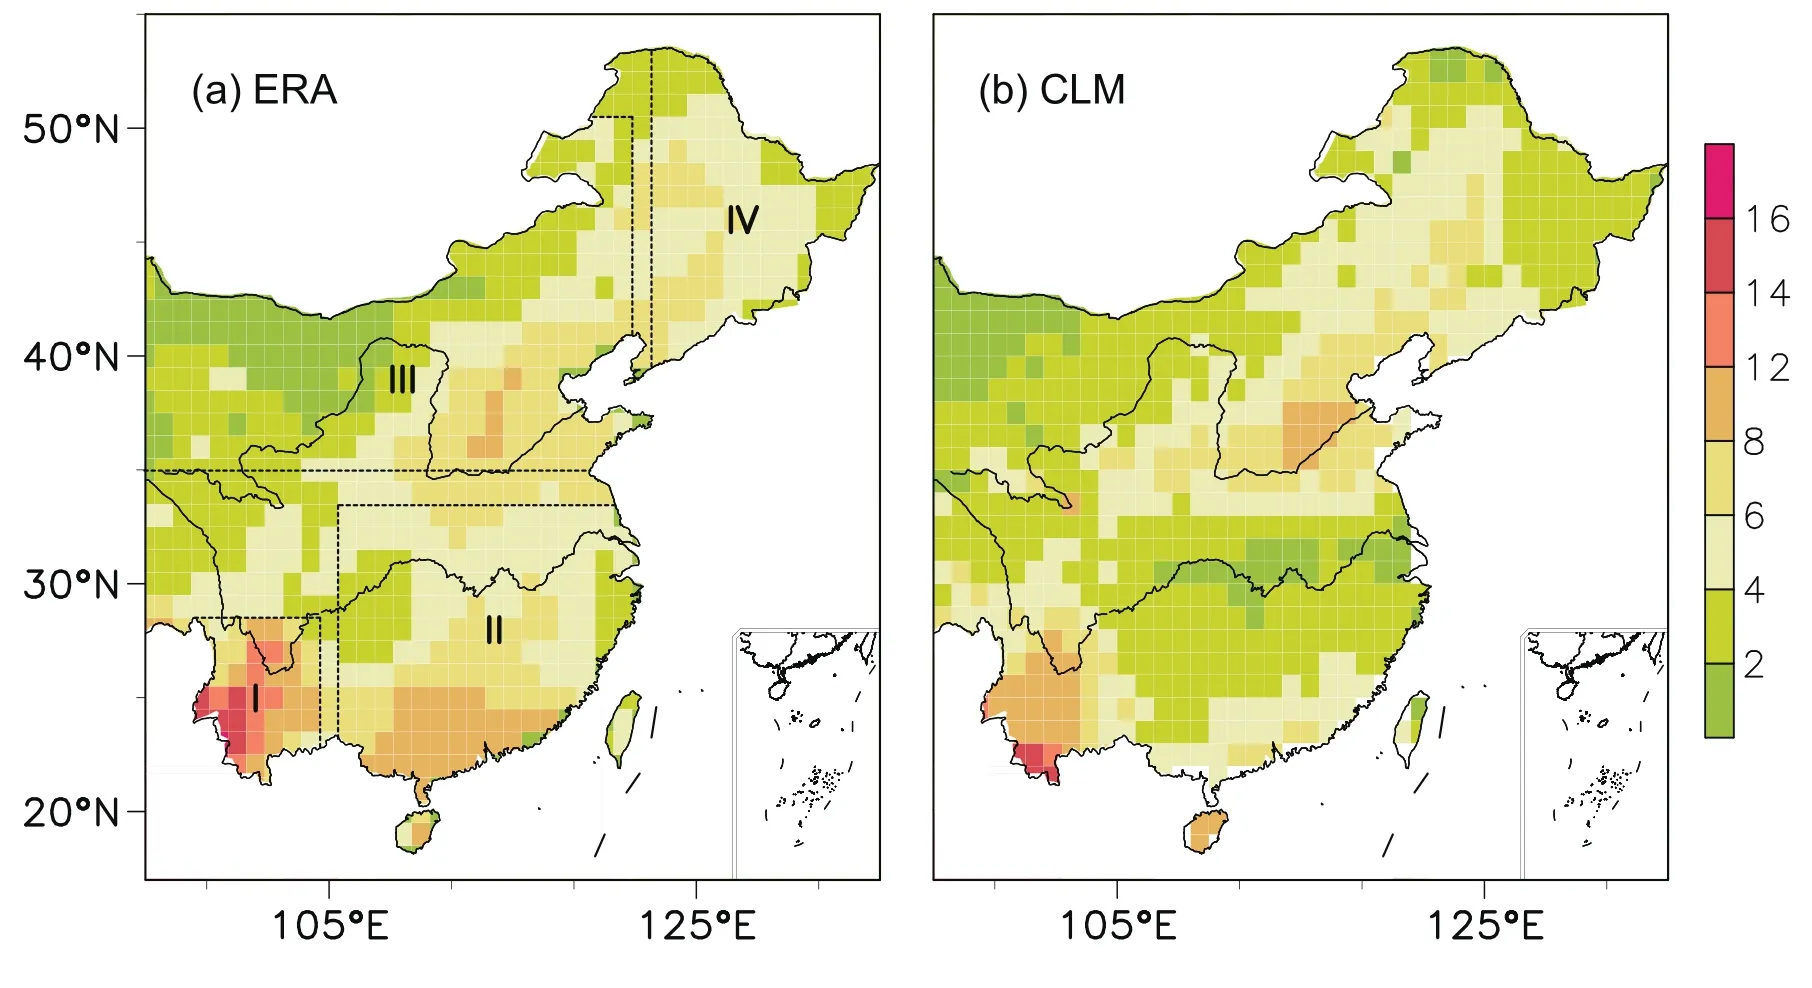
Fig.7. SM intra-annual variability(multi-year average of maximum SM minus minimum SM within a year)in the(a)ERA and(b)CLM dataset(units:volume%).The four selected sub-areas are shown in(a):area I(21°–28°N,97°–104°E);area II(21°–33°N,106°–122°E);area III(35°–50°N,96°–121°E);and area IV(40°–53°N,123°–135°E).
Additionally,SM differs not only by region but also by season(Fig.2),as does the pathway of land–atmosphere interactions(i.e.,SM affects ST and vice versa;Figs.4 and 5).To further exam ine the intra-annual variability of SM,the mean difference between maximum and m inimum SM within a year is shown in Fig.7.Large variations(>4%)are demonstrated in the southern half,southeastern North China and Northeast China for the ERA dataset.This is possibly due to the influenc of the transformation of the monsoon system(Jiang et al.,2015).Notably,Southwest China is a large SM-variation center.For the CLM dataset,as discussed in section 3.1,the seasonal variability is relatively lower,especially in the Yangtze River basin and Northeast China.Still,the largest intra-annual change is exhibited in Southwest China.Therefore,considering the evident seasonal variations inRSM?ET,RST?ETand SM,we first take area I(Southwest China:21°–28°N,97°–104°E)as an example to explore the monthly change at the regional scale.We also select the humid/semi-humid area II(including South China,East China and Central China:21°–33°N,106°–122°E),arid/sem i-arid area III(North China:35°–50°N,96°–121°E)and sem i-hum id area IV(Northeast China:40°–53°N,123°–135°E)for the comparative analyses.These four sub-areas are shown in the boxed areas in Fig.7a,and the dry–wet definitions are based on Ma and Fu(2005).
In Southwest China,precipitation during the wet season(May–October)accounts for about 70%to 80%of the annual total(Zhang et al.,2014).Accordingly,as shown in Figs.8a and b,the SM in area I rapidly increases beginning in May and remains at a high level(>30%)from June to November.During the months with higher SM,negativeRSM?ETand positiveRST?ETare significant(p<0.05),indicating that energy primarily controls ET.During the dry season(November–April),the soil does not receive enough water;thus,SM decreases to slightly below 25%in March.Meanwhile,theRSM?ETandRST?ETbecome positive and negative,respectively.The alternating relationship signs imply that the feedback from SM to the atmosphere is enhanced(shifts from an energy-lim ited condition during the wet season to a water-lim ited condition during the dry season),particularly in early spring(March and April),characterized by themaximumRSM?ET.Sim ilarly,in area II,RSM?ETincreases andRST?ETdecreases as the soil turns from wet to dry in the ERA dataset(Fig.8c).For the CLM dataset,however,the weaker intra-annual SM variability in area II leads to a smaller corresponding change inRSM?ET(Fig.8d).
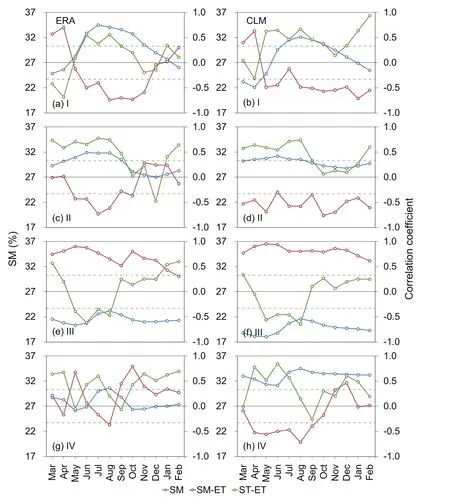
Fig.8. Monthly variations of SM(blue lines;units:volume%),RSM?ET(red lines)and RST?ET(green lines)in areas(a,b)I,(c,d)II,(e,f)III and(g,h)IV from March to February for the ERA(left)and CLM(right)datasets.The dashed lines are significant at the 95%confidence level.A ll data are detrended before the correlation coefficient is calculated.
In area III,the significant(p<0.05)positiveRSM?ETand lowerSM throughouttheyear indicate thatthisareaisundera water-lim ited condition in all seasons for both datasets(Figs.8eand f).However,thesigni fi cant(p<0.05)negativeRST?ET(strong land–atmosphere coupling)occurs only from May to August and becomes positive from September to April.The conditions in area IV are more complicated(Figs.8g and h),as compared with the other three areas.RSM?ETchanges with the ERA SM,butRST?ETis basically positive throughout the year.The CLM SM,by contrast,is high,and weaker variability exists during the 12 months,with theRSM?ETandRST?ETchanging differently.
To further understand the monthly changes of the correlations in areas III and IV(Fig.8),we additionally exam ine the regional differences in ST,which also exhibit seasonal variations among the four sub-areas(Fig.3).The annual ST cycles based on the ERA and CLM datasets are shown in Fig.9.Areas I and II show low intra-annual ST variabilities,whereas areas III and IV show larger ones(bottom row of Fig.9).In areas III and IV,the ST is close to and often below 0°C from November to March,indicating that an insufficient energy supply exists for ET.In contrast,areas I and II are relatively warm throughout the year.These fi ndings provide a potential explanation for the abnormal positiveRST?ETobserved during the cold seasons in areas III and IV(Fig.8).
To sum up,the above results show that differences exist in the land–atmosphere coupling in both space and seasonality.The differences are re fl ected in the spatial patterns ofRSM?ETandRST?ETand their seasonal variations.In consideration of the strong coupling only existing under the condition with positiveRSM?ETand negativeRST?ET,we additionally specify an indicator,which is expressed as the absolute value of the positiveRSM?ETmultiplied by the negativeRST?ET,to identify the“hot spots”.The results for both the ERA and CLM datasets are shown in Fig.10.For spring,the hot spots are in North China and Southwest China;during summer and autumn,however,these hot spots are primarily in North China.In addition,land–atmosphere coupling barely exists in winter.
4. Discussion
In this study,we explore the land–atmosphere coupling by using the correlations between SM and ET and those between ST and ET.North China(area III)is characterized by arid/sem i-arid regions;here,SM is maintained at a low level,and the SM–ET relationship is positive throughout the year(Figs.2,8e and f),which indicates that water-limited conditions predominate throughout the year.However,the coupling is strong in summer,relatively weak in spring and autumn,and eventually disappears in winter(Fig.10).These features may be associated with the ST seasonality,which is high in summer and low in winter(area III,Fig.9).During the cold seasons(e.g.,winter),the land surface is primarily coveredw th ice,snow and frozen soil,due to the low temperatures(<0°C,Figs.3 and 9).This situation i sbound to hinder the direct physical process between SM and the atmosphere.As a result,it is not difficult to understand why stronger coupling is always accompanied by higher temperatures(i.e.,sufficient energy supply),especially during summer.This suggests that a water-limited condition is necessary but not sufficient for land–atmosphere coupling in the relatively dry regions of China(i.e.,those at high latitude);and seasonal coupling variations are closely related to energy supply(as reflected by ST).In Southwest China(area I),the water supply is not sustainable because of the special climatic conditions(Zhang et al.,2014).Thus,the soil is generally drier during the spring than in other seasons(Figs.2,8a and b),which leads to a strong land–atmosphere coupling(Fig.10).However,in other humid/semi-hum id regions,over the southern part of eastern China(e.g.,area II)and Northeast China,the soil is moist throughout the year and the temperature is extremely low during local dry periods(October–February;Figs.8e,g and 9),respectively.Therefore,these areas exhibit no coupling(Fig.10).The results from the CLM 4.0 simulation are generally consistent with the regional features and seasonal changes from the ERA dataset.However,differences exist over some areas.Speci fi cally,CLM is based on a different model,which means the forcing dataset and descriptions of physical processes are different from ERA.This situation makes the differences in the results between the two datasets inevitable.

Fig.9. Annual cycle(top row)of ST in areas I,II,III and IV,from March to February,in the(a)ERA and(b)CLM dataset.The solid dots and short lines(bottom row)are the annual mean,maximum and m inimum ST,respectively.Units:°C.
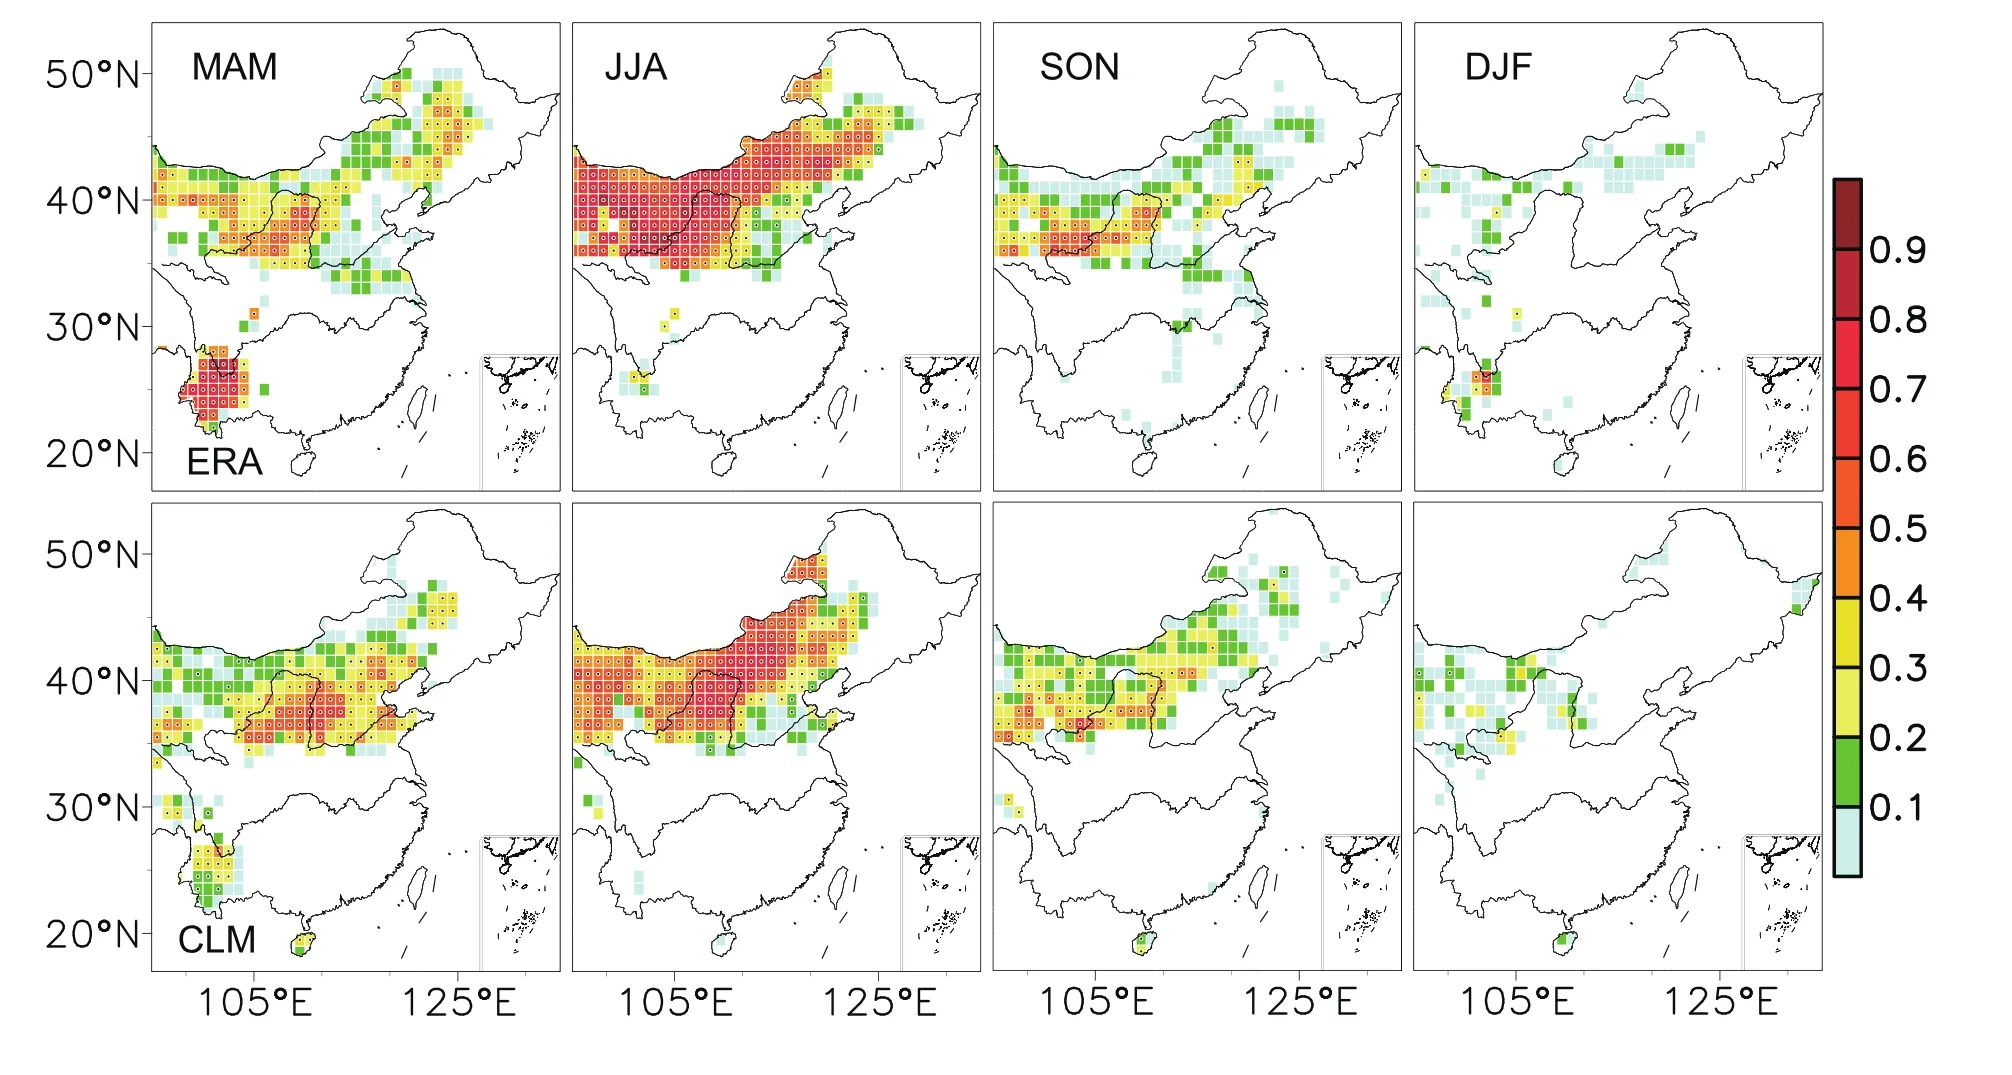
Fig.10. Absolute value of positive RSM?ET multiplied by negative RST?ET.The dotted grid points indicate that both of the two correlations are significant at the 95%confidence level.All data are detrended.
Previous studies have demonstrated that abnormal SM can affect the atmospheric general circulation mainly through altering the surface energy balance and land surface thermal forcing of the atmosphere,and further lead to precipitation anomalies in China(Zuo and Zhang,2007,2016;Zhang and Zuo,2011;Meng et al.,2014).Zhang and Zuo(2011)found that anomalous spring SM from the lower and middle reaches of the Yangtze River Valley to North China is highly correlated with the summer precipitation in China.Abnormally wet spring soil tends to increase the surface evaporation and lower the surface air temperature.As a result,the reduced temperature in late spring reduces the land–sea thermal contrast,resulting in a weakened East Asian monsoon.SM is de fi nitely an important factor re fl ecting the land–atmosphere interaction,and ET is a key component of the land–atmosphere feedback cycle.Our results further map the“hot spots”of land–atmosphere coupling over eastern China.In addition,we emphasize the seasonal variabilities of these hot spots.In the hum id/sem i-hum id regions of China,strong land–atmosphere coupling mainly happens in the relatively drier seasons,which is consistent with the conclusions of Wei et al.(2012)and Wei and Dirmeyer(2012),who showed that SM–precipitation coupling is stronger during dry periods for climatologically wet regions.However,in arid/sem i-arid regions of China,studies should focus on the relatively warmer seasons when significant negative SM feedbacks exist with relatively higher temperature(Zhang and Dong,2010;Zhang et al.,2011).
Our study has certain lim itations.For example,land cover exerts an important effect on the exchanges of energy,water,carbon dioxide and other greenhouse gases between the land surface and atmosphere(Yin et al.,2015);thus,land-use and land-cover change(LUCC)m ight affect processes between the land and atmosphere.Moreover,remarkable LUCC has occurred alongside rapid econom ic developmentover thepast 30 years.Our study does not consider LUCC,which might lead to some uncertainties in the results.Although the analytical process may be subjective,it still provides a reference to further study land–atmosphere interactions.It is difficult to directly measure the strength of land–atmosphere coupling in the real world,and the specific land feedback on atmospheric circulation(e.g.,monsoon intensity)still needs to be explored in depth.With an increasing number of tools avail-able to determ inehow the land affects theclimate,researchers will have more opportunities to improve their understanding of climate predictions.
5. Conclusions
This study attempts to identify the“hot spots”of land–atmosphere coupling over eastern China using reanalysis data and simulation output.Besides the spatial distribution,we also examine the seasonal evolution of the coupling.Based on correlation analysis,we identify two hot spots:North China and Southwest China.The strongest couplings are found in summer over North China and in spring over Southwest China.
Further analysis suggests that the coupling over North China is closely associated with temperature(partly re fl ecting the energy supply).In North China,the dry soil condition(water-limited)is maintained throughout the year;and summer is relatively warmer comparing to other seasons,which means a sufficient energy supply for ET,consequently leading to the strongest land–atmosphere coupling.On the other hand,the SM(water supply)plays a decisive role in the coupling over humid/semi-hum id regions.In Southwest China,the seasonal climate conditions are warm due to the lower latitude,meaning that the energy supply is sufficient throughout the year.However,the precipitation varies across the four seasons.By the end of the dry season(i.e.,spring),the SM is evidently lower,constraining ET.
The uncertainties of this study should be noted.We use a high-quality reanalysis dataset(ERA-Interim)and model simulation(CLM 4.0)to maxim ize the robustness of the results,and the results from both datasets generally agree with each other,albeit with some differences observed in some areas.The methods applied in this study also have some limitations.Therefore,the fi ndings of this study should be regarded as prelim inary,and additional studies are needed.The specific feedback mechanisms from the land to the atmosphere over the aforementioned“hot spots”require more thorough investigation.
Acknowledgements.This work was jointly supported by the National Natural Science Foundation of China(Grant Nos.41625019 and 41605042),the Natural Science Foundation of Jiangsu Province,China(Grant No.BK20151525),and the Priority Academ ic Program Development of Jiangsu Higher Education Institutions.
Balsamo,G.,and Coauthors,2015:ERA-Interim/Land:A global land surface reanalysis data set.Hydrology and Earth System Sciences,19,389–407,https://doi.org/10.5194/hess-19-389-2015.
Bellucci,A.,and Coauthors,2015:Advancements in decadal climate predictability:The role of nonoceanic drivers.Rev.Geophys.,53(2),165–202,https://doi.org/10.1002/2014RG 000473.
Cai,W.J.,and T.Cowan,2008:Evidence of impacts from rising temperatureon inflows to theMurray-Darling Basin.Geophys.Res.Lett.,35,L07701,https://doi.org/10.1029/2008GL 033390.
Chen,H.S.,M.M.Xiong,and W.Y.Sha,2010:Simulation of land surface processes over China and its validation Part I:Soil temperature.Scientia Meteorologica Sinica,30(5),621–630,https://doi.org/10.3969/j.issn.1009-0827.2010.05.008.(in Chinese)
Dee,D.P.,and Coauthors,2011:The ERA-Interim reanalysis:Con fi guration and performance of the data assimilation system.Quart.J.Roy.Meteor.Soc.,137,553-597,https://doi.org/10.1002/qj.828.
Dirmeyer,P.A.,2011:The terrestrial lmoistureclimatecoupling.Geophys.Res.Lett.,38,L16702,https://doi.org/10.1029/2011GL048268.
Dirmeyer,P.A.,C.A.Schlosser,and K.L.Brubaker,2009:Precipitation,recycling,and land memory:An integrated analysis.Journal of Hydrometeorology,10,278–288,https://doi.org/10.1175/2008JHM 1016.1.
Douville,H.,P.Viterbo,J.-F.Mahfouf,and A.C.M.Beljaars,2000:Evaluation of the optimum interpolation and nudging techniques for soil moisture analysis using FIFE data.Mon.Wea.Rev.,128,1733–1756,https://doi.org/10.1175/1520-0493(2000)128<1733:EOTOIA>2.0.CO;2.
Gao,C.J.,H.S.Chen,B.Xu,and G.Zeng,2014:Possible relationships among South China Sea SSTA,soil moisture anomalies in southwest China and summer precipitation in eastern China.Journal of Tropical Meteorology,20(3),228–235,https://doi.org/10.16555/j.1006-8775.2014.03.005.
Ge,M.L.,and Z.M.Feng,2009:Population distribution of China based on GIS:Classi fi cation of population densities and curve of population gravity centers.Acta Geographica Sinica,64(2),202–210,https://doi.org/10.3321/j.issn:0375-5444.2009.02.007.(in Chinese)
Guillod,B.P.,B.Orlowsky,D.G.Miralles,A.J.Teuling,and S.I.Seneviratne,2015:Reconciling spatial and temporal soil moisture effects on afternoon rainfall.Nature Communications,6,6443,https://doi.org/10.1038/ncomms7443.
Guo,Q.Y.,J.N.Cai,X.M.Shao,and W.Y.Sha,2003:Interdecadal variability of East-Asian summer monsoon and its impact on the climate of China.Acta Geographica Sinica,58(4),569–576,https://doi.org/10.3321/j.issn:0375-5444.2003.04.011.(in Chinese)
He,J.H.,J.H.Ju,Z.P.Wen,J.M.Lu,and Q.H.Jin,2007:A review of recent advances in research on Asian monsoon in China.Adv.Atmos.Sci.,24(6),972–992,https://doi.org/10.1007/s00376-007-0972-2.
Hu,L.L.,Y.L.Liu,Y.H.Ren,L.J.Yu,and C.Qu,2015:Spatial change of population density boundary in mainland China in recent 80 years.Journal of Remote Sensing,19(6),928–934,https://doi.org/10.11834/jrs.20155016.(in Chinese)
Hua,W.J.,H.S.Chen,S.G.Zhu,S.L.Sun,M.Yu,and L.M.Zhou,2013:Hotspots of the sensitivity of the land surface hydrological cycle to climate change.Chinese Science Bulletin,58(30),3682–3688,https://doi.org/10.1007/s11434-013-5846-7.
Jiang,J.,D.B.Jiang,and Y.H.Lin,2015:Monsoon area and precipitation over China for 1961–2009.Chinese Journal of Atmospheric Sciences,39(4),722–730,https://doi.org/10.3878/j.issn.1006-9895.1410.14195.(in Chinese)
Koster,R.D.,and M.J.Suarez,2001:Soil moisture mem-ory in climate models.Journal of Hydrometeorology,2,558–570,https://doi.org/10.1175/1525-7541(2001)002<0558:SMM ICM>2.0.CO;2.
Koster,R.D.,S.D.Schubert,and M.J.Suarez,2009:Analyzing the concurrence of meteorological droughts and warm periods,with implications for the determination of evaporative regime.J.Climate,22,3331–3341,https://doi.org/10.1175/2008JCLI2718.1.
Koster,R.D.,and Coauthors,2004:Regions of strong coupling between soil moisture and precipitation.Science,305,1138–1140,https://doi.org/10.1126/science.1100217.
Koster,R.D.,and Coauthors,2006:GLACE:The global land atmosphere coupling experiment.Part I:Overview.Journal of Hydrometeorology,7,590–610,https://doi.org/10.1175/JHM 510.1.
Lai,X.,J.Wen,S.X.Cen,H.Q.Song,H.Tian,X.K.Shi,Y.He,and X.Huang,2014:Numerical simulation and evaluation study of soil moisture over China by using CLM 4.0 model.Chinese J.Atmos.Sci.,38(3),499–512,https://doi.org/10.3878/j.issn.1006-9895.1401.13194.(in Chinese)
Li,M.X.,Z.G.Ma,and G.Y.Niu,2011:Modeling spatial and temporalvariationsin soilmoisture in China.ChineseScience Bulletin,56(17),1809–1820,https://doi.org/10.1007/s11434-011-4493-0.
Liu,L.,R.H.Zhang,and Z.Y.Zuo,2014:Intercomparison of spring soil moisture among multiple reanalysis data sets over eastern China.J.Geophys.Res.Atmos.,119,54–64,https://doi.org/10.1002/2013JD020940.
Ma,Z.G.,and C.B.Fu,2005:Decadal variations of arid and semi-arid boundary in China.Chinese Journal of Geophysics,48(3),519–525,https://doi.org/10.3321/j.issn:0001-5733.2005.03.008.(in Chinese)
Mahfouf,J.-F.,P.Viterbo,H.Douville,A.C.M.Beljaars,and S.Saarinen,2000:A revised land-surface analysis scheme in the integrated forecasting system.ECMWF Newsletter,88,8–13.
Mei,R.,and G.L.Wang,2012:Summer land-atmosphere coupling strength in the United States:Comparison among observations,reanalysis data,and numerical models.Journal of Hydrometeorology,13,1010–1022,https://doi.org/10.1175/JHM-D-11-075.1.
Meng,L.,D.Long,S.M.Quiring,and Y.J.Shen,2014:Statistical analysis of the relationship between spring soil moisture and summer precipitation in East China.International Journal of Climatology,34(5),1511–1523,https://doi.org/10.1002/joc.3780.
Nicholls,N.,2004:The changing nature of Australian droughts.Climatic Change,63(3),323–336,https://doi.org/10.1023/B:CLIM.0000018515.46344.6d.
Oki,T.,and S.Kanae,2006:Global hydrological cycles and world water resources.Science,313,1068–1072,https://doi.org/10.1126/science.1128845.
Ruscica,R.C.,A.A.Srensson,and C.G.Men′endez,2014:Hydrological links in Southeastern South America:Soil moisture memory and coupling within a hot spot.InternationalJournalofClimatology,34,3641–3653,https://doi.org/10.1002/joc.3930.
Seneviratne,S.I.,D.Luthi,M.Litschi,and C.Schar,2006a:Landatmosphere coupling and climate change in Europe.Nature,443,205–209,https://doi.org/10.1038/nature05095.
Seneviratne,S.I.,T.Corti,E.L.Davin,M.Hirschi,E.B.Jaeger,I.Lehner,B.Orlowsky,and A.J.Teuling,2010:Investigating soil moisture-climate interactions in a changing climate:A review.Earth-Science Reviews,99,125–161,https://doi.org/10.1016/j.earscirev.2010.02.004.
Seneviratne,S.I.,and Coauthors,2006b:Soil moisture memory in AGCM simulations:Analysis of Global Land-Atmosphere Coupling Experiment(GLACE)Data.Journal of Hydrometeorology,7,1090–1112,https://doi.org/10.1175/JHM 533.1.
Sheffield,J.,G.Goteti,and E.F.Wood,2006:Development of a 50-year-high-resolution global dataset of meteorological forcing for land surface modeling.J.Climate,19(13),3088–3111,https://doi.org/10.1175/JCLI3790.1.
Spennemann,P.C.,and A.C.Saulo,2015:An estimation of the land-atmosphere coupling strength in South America using the Global Land Data assimilation System.InternationalJournalofClimatology,35,4151–4166,https://doi.org/10.1002/joc.4274.
Trenberth,K.E.,J.T.Fasullo,and J.Kiehl,2009:Earth’s global energy budget.Bull.Amer.Meteor.Soc.,90(3),311–323,https://doi.org/10.1175/2008BAMS2634.1.
Tuttle,S.,and G.Salvucci,2016:Empirical evidence of contrasting soil moisture-precipitation feedbacks across the United States.Science,352(6287),825–828,https://doi.org/10.1126/science.aaa7185.
van den Hurk,B.J.J.M.,P.Viterbo,A.C.M.Beljaars,and A.K.Betts,2000:Offline validation of the ERA40 surface scheme.ECMWF Technical Memorandum No.295,1–42.
Wei,J.F.,and P.A.Dirmeyer,2012:Dissecting soil moistureprecipitation coupling.Geophys.Res.Lett.,39,L19711,https://doi.org/10.1029/2012GL053038.
Wei,J.F.,P.A.Dirmeyer,and Z.C.Guo,2008:Sensitivities of soil wetness simulation to uncertainties in precipitation and radiation.Geophys.Res.Lett.,35,L15703,https://doi.org/10.1029/2008GL034494.
Wei,J.F.,P.A.Dirmeyer,M.G.Bosilovich,and R.G.Wu,2012:Water vapor sources for Yangtze River Valley rainfall:Climatology,variability,and implications for rainfall forecasting.J.Geophys.Res.,117,D05126,https://doi.org/10.1029/2011JD016902.
Wu,L.Y.,and J.Y.Zhang,2013:Asymmetric effects of soil moisture on mean daily maximum and m inimum temperaturesovereastern China.Meteor.Atmos.Phys.,122,199–213,https://doi.org/10.1007/s00703-013-0284-2.
Wu,S.H.,Y.H.Yin,D.Zheng,and Q.Y.Yang,2005:Aridity/hum idity status of land surface in China during the last three decades.Science in China Series D:Earth Sciences,48(9),1510–1518,https://doi.org/10.1360/04yd0009.
Wu,W.R.,and R.E.Dickinson,2004:Time scales of layered soil moisture memory in the context of land-atmosphere interaction.J.Climate,17,2752–2764,https://doi.org/10.1175/1520-0442(2004)017<2752:TSOLSM>2.0.CO;2.
Xiong,M.M.,H.S.Chen,and M.Yu,2011:Simulation of land surface processes over China and its validation.Part II:Soil moisture.Scientia Meteorologica Sinica,31(1),1–10,https://doi.org/10.3969/j.issn.1009-0827.2011.01.001.(in Chinese)
Yin,D.Q.,M.L.Roderick,G.Leech,F.B.Sun,and Y.F.Huang,2014a:The contribution of reduction in evaporative cooling to higher surface air temperatures during drought.Geophys.Res.Lett.,41,7891–7897,https://doi.org/10.1002/2014 GL062039.
Yin,J.F.,X.W.Zhan,Y.F.Zheng,J.C.Liu,C.R.Hain,and L.Fang,2014b:Impact of quality control of satellite soil moisture data on their assimilation into land surface model.Geo-phys.Res.Lett.,41(20),7159–7166,https://doi.org/10.1002/2014gl060659.
Yin,J.F.,and Coauthors,2015:An assessment of impacts of land-cover changes on root-zone soil moisture.Int.J.Remote Sens.,36(24),6116–6134,https://doi.org/10.1080/01431161.2015.1111539.
Zhang,C.J.,Y.M.Liao,J.Q.Duan,Y.L.Song,D.P.Huang,and S.Wang,2016:The progresses of dry-wet climate divisional research in China.ClimateChangeResearch,12(4),261–267,https://doi.org/10.12006/j.issn.1673-1719.2015.191.(in Chinese)
Zhang,J.Y.,and W.J.Dong,2010:Soil moisture influenc on summertime surface air temperature over East Asia.Theor.Appl.Climatol.,100,221–226,https://doi.org/10.1007/s00704-009-0236-4.
Zhang,J.Y.,W.C.Wang,and J.F.Wei,2008a:Assessing landatmosphere coupling using soil moisture from the Global Land Data Assimilation System and observational precipitation.J.Geophys.Res.,113,D17119,https://doi.org/10.1029/2008JD009807.
Zhang,J.Y.,W.C.Wang,and L.R.Leung,2008b:Contribution of land-atmosphere coupling to summer climate variability over the contiguous United States.J.Geophys.Res.,113,D22109,https://doi.org/10.1029/2008JD010136.
Zhang,J.Y.,W.C.Wang,and L.Y.Wu,2009:Land-atmosphere coupling and diurnal temperature range over the contiguous United States.Geophys.Res.Lett.,36,L06706,https://doi.org/10.1029/2009GL037505.
Zhang,J.Y.,L.Y.Wu,and W.J.Dong,2011:Land-atmosphere coupling and summer climate variability over East Asia.J.Geophys.Res.,116,D05117,https://doi.org/10.1029/2010 JD014714.
Zhang,R.H.,and Z.Y.Zuo,2011:Impact of spring soil moisture on surface energy balance and summer monsoon circulation over East Asia and precipitation in East China.J.Climate,24,3309–3322,https://doi.org/10.1175/2011JCLI4084.1.
Zhang,W.J.,T.J.Zhou,and R.C.Yu,2008c:Spatial distribution and temporal variation of soil moisture over China Part I:Multi-data inter-comparison.Chinese Journal of Atmospheric Sciences,32,581–597,https://doi.org/10.3878/j.issn.1006-9895.2008.03.15.(in Chinese)
Zhang,W.L.,J.Y.Zhang,and G.Z.Fan,2014:Dom inant modes of dry-and wet-season precipitation in southwestern China.Chinese Journal of Atmospheric Sciences,38(3),590–602,https://doi.org/10.3878/j.issn.1006-9895.2013.13156.(in Chinese)
Zhu,S.G.,H.S.Chen,and J.Zhou,2013:Simulations of global land surface conditions in recent 50 years with three versions of NCAR Community Land Models and their comparative analysis.Transactions of Atmospheric Science,36(4),434-446,https://doi.org/10.13878/j.cnki.dqkxxb.2013.04.007.(in Chinese)
Zittis,G.,P.Hadjinicolaou,and J.Lelieveld,2013:Land-Atmosphere coupling:The feedback of soil moisture into surface temperature in Eastern Mediterranean and middle East.Advances in Meteorology,ClimatologyandAtmospheric Physics,C.G.Helm is,and P.T.Nastos,Eds.,Springer,833–839,https://doi.org/10.1007/978-3-642-29172-2 117.
Zuo,Z.Y.,and R.H.Zhang,2007:The spring soil moisture and the summer rainfall in eastern China.Chinese Science Bulletin,52,3310–3312,https://doi.org/10.1007/s11434-007-0442-3.
Zuo,Z.Y.,and R.H.Zhang,2009:Temporal and spatial features of the soil moisture in boreal spring in eastern China.Science in China Series D:Earth Sciences,52(2),269–278,https://doi.org/10.1007/s11430-009-0011-5.
Zuo,Z.Y.,and R.H.Zhang,2016:influenc of soil moisture in Eastern China on the East Asian summer monsoon.Adv.Atmos.Sci.,33(2),151–163,https://doi.org/10.1007/s00376-015-5024-8.
 Advances in Atmospheric Sciences2018年6期
- Advances in Atmospheric Sciences的其它文章
- Subseasonal Reversal of East Asian Surface Temperature Variability in winter 2014/15
- M odeling the warming Im pact of Urban Land Expansion on Hot Weather Using the Weather Research and Forecasting Model:A Case Study of Beijing,China
- Evaluating and Im proving wind Forecasts over South China:The Role of Orographic Parameterization in the GRAPES Model
- Impact of the winter North Pacific Oscillation on the Surface Air Tem perature over Eurasia and North America:Sensitivity to the Index definition
- Simulating Eastern-and Central-Pacific Type ENSO Using a Sim p le Coup led M odel
- Evaluation of the New Dynamic Global Vegetation Model in CAS-ESM