
Characterizing changes in ecosystem service values in China's eastern Loess Plateau
2015-12-19 08:40:04JinChangLiHaiXiaLiuZhiZhuSuYongLiuYongGangYang
JinChang Li ,HaiXia Liu ,ZhiZhu Su ,Yong Liu ,YongGang Yang
1.Institute of Loess Plateau,Shanxi University,Taiyuan,Shanxi 030006,China
2.Historical Culture School,Shanxi University,Taiyuan,Shanxi 030006,China
1 Introduction
Ecosystem services are the benefits that ecosystems provide to sustain the daily life of Earth's living organisms(Millennium Ecosystem Assessment,2003;Sherrouseet al.,2011).Rapid urbanization,climate change in alpine areas,and unsustainable human activities such as over-cultivation,over-grazing and over-deforestation have resulted in significant alterations in the structure and functions of ecosystems.As a result,ecosystems exhibit impaired capacity to deliver the expected services(Liet al.,2010a;Liuet al.,2012;Suet al.,2012a,b).Since the Millennium Ecosystem Assessment report was released,recent studies from economic perspectives have described the indirect influence of land use changes on ecological conditions using the concept of "ecosystem service values"(ESV)(e.g.,Zhaoet al.,2004;Liet al.,2010b).The assessment ofESVhas become a critical endeavor in ecological economics(Kozaket al.,2011)because it provides useful guidance for ecological planners who must prioritize which resources to protect(Van der Horst,2011).
Costanzaet al.(1997a,b)classified the global biosphere into 16 ecosystems and 17 service functions,and estimated theESVof each function,but their results have been severely criticized by many researchers(e.g.,El Serafy,1998;Heal,2000;Wilson and Howarth,2002)because they underestimated theESVof farmland and overestimated theESVof wetlands,among other problems.Based on a survey of 213 Chinese ecologists,Xieet al.(2003,2008)improved theESVvaluation method by merging some of the ecosystem service functions suggested by Costanzaet al.(1997a,b)and by extracting ecosystem value coefficients per hectare that were suitable for China's terrestrial ecosystems.Combined with land use data,the value coefficients have been used widely in China to evaluate theESVfor different types of terrains(e.g.,Liet al.,2010a),for cities(e.g.,Liet al.,2010b),and for watersheds(e.g.,Zhaoet al.,2010).These results have suggested that land use type can serve as a proxy for ecosystem services by matching land use types to equivalent biomes,thereby facilitating the valuation ofESVfor large areas using remote-sensing data.
Complex land use changes have occurred in China's Loess Plateau region,such as northern Shaanxi Province(Li and Ren,2011)and eastern Gansu Province(Chenet al.,2003;Zhanget al.,2007),due to the implementation of ecological protection projects by the Chinese government since 2000.These include the conversion of farmland into woodland and the protection of natural forest resources.These projects were necessary to compensate for the expansion of construction land as a result of economic growth and population increases,and land degradation resulting from unsustainable or irrational human activities and climate change(Maet al.,2002;Fuet al.,2010;Qiu and Cao,2011),but little research has been done to learn about the resultingESVchange processes in the region,especially in the eastern Loess Plateau.
Shanxi Province lies in the eastern part of the Loess Plateau,in the middle reaches of the Yellow River and the upper reaches of the Haihe River.In the present research,we used Ningwu County of Shanxi Province as a case study of changes inESVresulting from land use changes in the region.Based on these results,we provide objective and reliable information that can be used to support sustainable regional development policies.
2 Study area
Ningwu County(38°31′N–39°09′N,111°50′E–112°37′E)is located in northern Shanxi Province,and includes 14 townships(Figure 1).This county covers about 1,941 km2,with an elevation ranging from 1,260 to 2,782 m and averaging 2,000 m.The elevation increases from the middle of the study area to the southeast and northwest,and the lowest elevations extend from the southwest to the northeast through the middle of the study area.The county is bounded by the Yunzhong Mountains on the east,by the Guanchen and Luya mountains on the west,and by the Lvliang and Hongtao mountains on the southwest and north,respectively.
The study area is located in a semiarid region of northern China,and is dominated by a continental monsoon climate.Average annual temperature is about 6.2 °C,with a minimum mean monthly temperature of-9.9 °C in January and a maximum of 20.1 °C in July.Average annual precipitation is about 600 mm,about 80% of which falls during the growing season from June to September.Average annual pan evaporation rate is about 1,700 mm/a.There are two growing seasons annually,and the main crops are wheat,millet,broom corn millet,and potatoes.
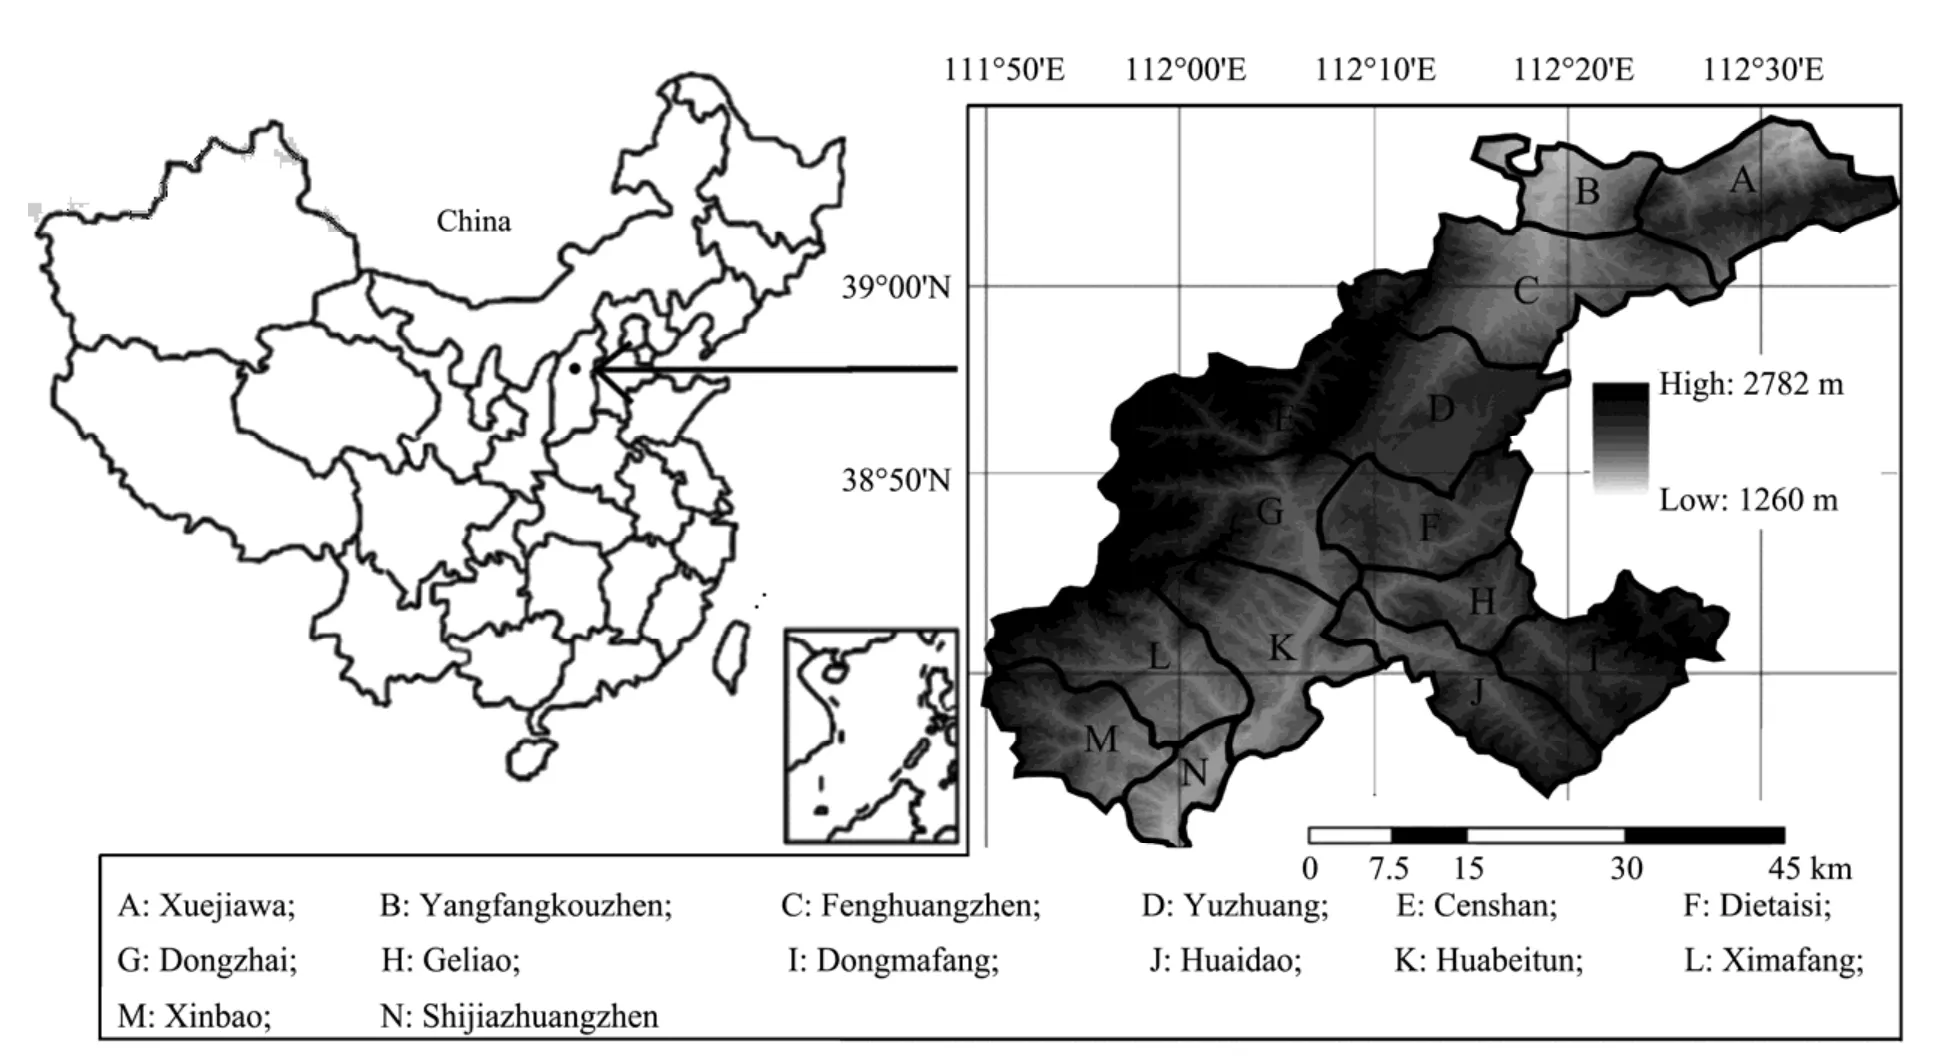
Figure 1 Locations of Ningwu County and of the 14 townships,and elevation range within each township
The Fenhe River,with a length of 716 km and a watershed area of 39,000 km2,originates in the Guanchen Mountains and runs through Ningwu County.It is the second-largest tributary of the Yellow River.The Fenhe River watershed contains the heaviest concentration of industrial development and agriculture in Shanxi Province.The water extracted from the Fenhe River by industry and agriculture in Shanxi Province accounted for about 46%(2.43×10⁹m3/a)of all water consumption in the province,so the Fenhe River is known as the "mother river" by the province's people.Because of the region's rapid socioeconomic development,the change inESVin Ningwu County has an important influence on the ecological security of the Fenhe River watershed and of the province as a whole.
3 Methods
3.1 Data collection and land use classification
We obtained land use data for Ningwu County and its 14 townships by interpreting three sets of remote-sensing images:Landsat ETM+ images acquired on July 24,2000 and Landsat TM images acquired on August 22,1990 and July 12,2010,all with a 30-m spatial resolution.In addition to these data,we used topographic maps at a scale of 1:50,000 surveyed by the Chinese Mapping Agency in the early 1980s,as well as vegetation and soil maps(both at a scale of 1:50,000 published in 2000)provided by several Chinese government agencies,as ancillary materials to assist our classification of the land use types during the visual interpretation process.
We performed geometric corrections using version 9.1 of the ERDAS Imagine software(ERDAS,Norcross,GA).The ETM+ images acquired in 2000 were georeferenced using ground control points derived from the topographic maps.The mean positional errors for georectification of the TM and ETM+ images were controlled to less than 1.5 pixels in mountainous regions and less than 1 pixel in flat regions,which are acceptable levels of precision for large-scale surveys.The TM images from 1990 and 2010 were matched with the geometrically corrected ETM+ images from 2000 by means of an image-to-image matching method provided by the ERDAS Imagine software.
In order to accurately classify the land cover,we investigated the study area at the beginning(2011)of our research by taking a series of photographs of each type of land cover and recording each photograph's geographic coordinates using a global positioning system(GPS)receiver.We then found the corresponding land cover in the remote-sensing images at those geographic coordinates to build an interpretation symbol database for use in subsequent image interpretation.In addition,we digitized the topographic maps at a scale of 1:50,000 to provide vector data,then transformed the vegetation and soil maps to the same projection mode and coordinate system so that they could be overlaid on the other images to provide assistance with image interpretation.
The polygons with different land use types in the images acquired in 2000 were labeled according to their cover class.Once the digital map of the land coverage in 2000 was complete,the polygons were copied and the segments that needed modification were changed based on the 2010 and 1990 images;that is,they were updated by adding,deleting,or modifying lines in order to reflect land use changes from 1990 to 2000 and from 2000 to 2010.The visual interpretation process was completed using version 9.1 of the ArcMap software(ESRI,Redlands,CA).
Using the resource and environment database established by the Chinese Academy of Sciences,we classified the land use types in Ningwu County into six classes:farmland,woodland,grassland,water body,construction land,and unused land.Descriptions of these land use types are presented in Table 1(Liuet al.,2012),and their distribution in each of the three years is shown in Figure 2.The interpretation results for the study area were validated in the field in August 2011.Subsequent corrections were made after field validation to ensure the classification accuracy was better than 95%.
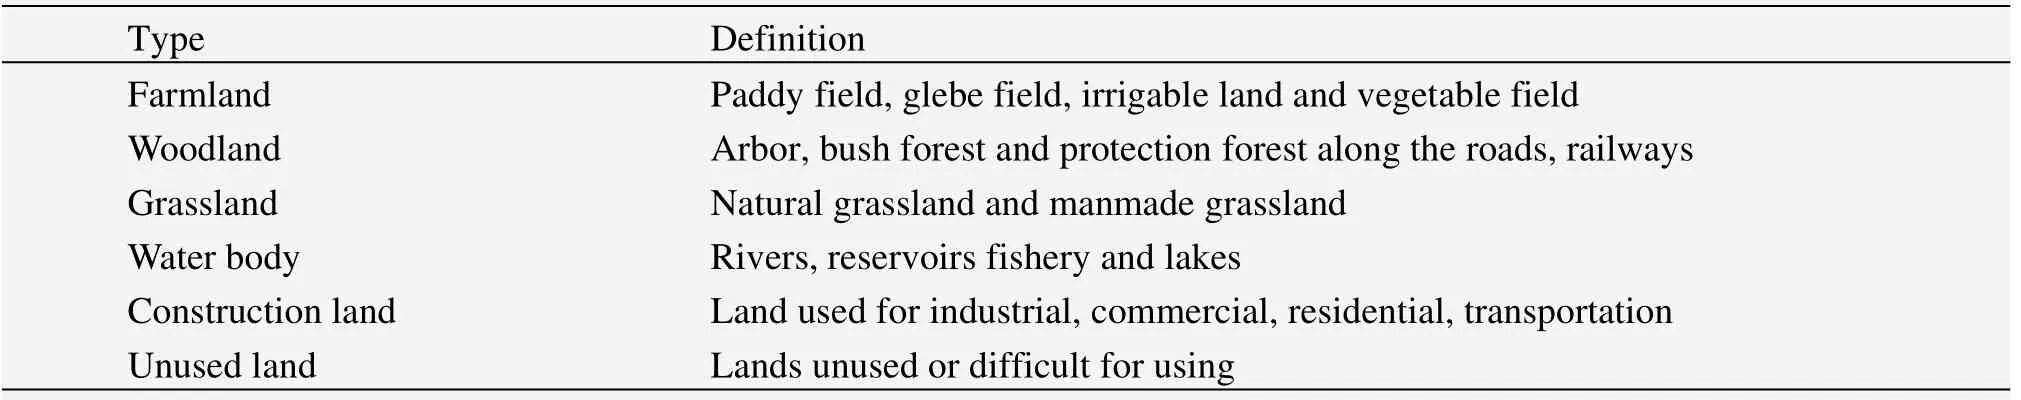
Table 1 Definition of land use type in Taiyuan City
3.2 Calculation of ESV
To calculateESVfor the study area,we used the assessment model of Costanzaet al.(1997b):
whereESVdenotes the total ecosystem service value,andAkandVCkrepresent the area and value coefficients for proxy biome type "k",respectively.
Although proxy biomes usually do not perfectly match the land use types in an area in most cases(Kreuteret al.,2001),they are nonetheless strongly related to these land uses(Liet al.,2010b).Xieet al.(2008)revised theESVassessment model of Costanzaet al.(1997b)and classified ecosystem service functions into nine categories that are more suitable for the terrestrial systems of China.Xieet al.(2008)revised theESVassessment model involving six dominant land use types in China: farmland,woodland,grassland,water body,wetland,and unused land.By giving the significant lacking areas of wetland in the study area,the adjusted value coefficients by Xieet al.(2008)for the other land use types were used in this study(Table 2).The value coefficient for construction land was set to 0 based on Liuet al.(2012).
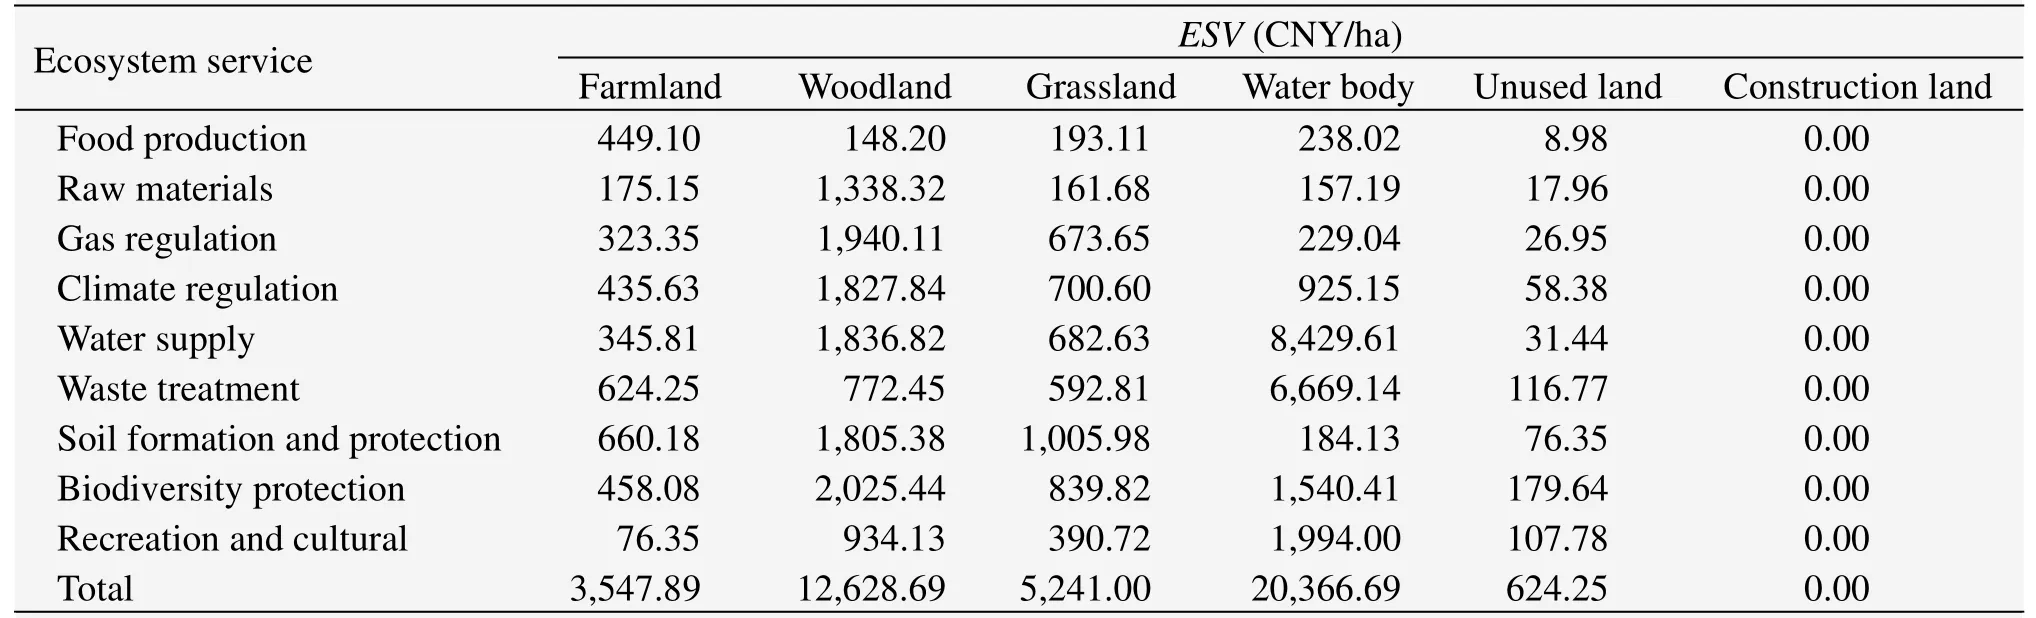
Table 2 Ecosystem value coefficients(ESV)for each land use type in China
4 Results
4.1 Characteristics of the land use changes
Figure 2 shows that grassland was distributed mainly in the middle and eastern parts of the study area,woodland were distributed mainly in the western mountainous areas with high elevation,and the other land use types were dispersed throughout the flat areas with low elevation and few mountainous areas with high elevation.Table 3 shows that grassland,woodland,and farmland(in that order)were the main land use types in the study area in all three years; together,they accounted for about 97% of the total land use in each year.During the study period,the decrease in area was greatest for farmland,followed by grassland,but the percentage decrease in cover was greatest for the water body category(-27.6%),and followed by farmland(-6.2%).The largest increase in area and percentage of cover was for construction land,followed by woodland and unused land.Among the six land use types,woodland and construction land increased continuously,whereas grassland and water body decreased continuously.
Table 4 shows the transition matrix for land use changes in Ningwu County during the study period.To a large extent,land use and land cover change(LUCC)from 1990 to 2010 was dominated by mutual conversions between grassland,woodland,and farmland,which accounted for 68.1% of the total conversions.From 1990 to 2000,slight increases in farmland and woodland were both caused mainly by a net gain resulting from grassland conversion,which is also the reason for a slight decrease in grassland area during the same period.From 2000 to 2010,the slight decrease in farmland was mainly attributed to a transition to grassland,and partly attributed to its replacement by construction and woodland,whereas the slight decreases in woodland and grassland were mainly caused by their net loss to bodies of water,and partly caused by their net replacement by unused land and construction land.From 1990 to 2010,the rapid expansion in the areas of construction land,bodies of water,and unused land mainly resulted from conversions of farmland,woodland,and grassland.However,construction land,bodies of water,and unused land remained a small overall component of the total study area.Fanet al.(2012)suggested that precipitation significantly decreased in the area,which may also be one of the reasons that caused a decrease in grassland during 1990–2010 and woodland decreased during 2000–2010.These will be clarified in a forthcoming manuscript.
4.2 Characteristics of the ESV change
Table 5 summarizes theESVfor each land use type and the total value for the three study years(1990,2000,and 2010)calculated using the value coefficients in Table 2 and the areas covered by each land use type in Table 3.Although the value coefficient per unit area(1 km2)was highest for the water body category,water bodies covered less than 1% of the study area,resulting in a low total service value.Because woodland had the second-highest value coefficient(Table 2)and covered a large area(Table 3),woodland had the highest totalESVof the six land use types.Grassland covered the largest total area,so this land use accounted for the second-highest proportion of totalESVin all three years.The combinedESVfor woodland and grassland accounted for about 89% of the totalESVin each year,indicating that these two types,and especially woodland,were the most important providers of ecosystem services in the study area.The overall change in totalESVwas small(-1.0%)during the study period,and the decline primarily resulted from a decrease in the area of farmland from 2000 to 2010(Tables 3,4).
From 1990 to 2010,theESVincreased most in the west mountainous areas,whereasESVdecreased most in the northeastern and middle parts of the study area(Figure 3).The spatial distribution ofESVper unit area(1 km2)was mostly consistent with the locations of woodlands;that is,ESVper unit area(1 km2)was high in most of the western mountainous areas and low in most other areas(Figure 3).
Table 6 summarizes theESVof individual service functions.In general,the changes in the contribution of each service function to the totalESVwere small during the study period.The contribution of each function to the totalESVwas greatest for soil formation and protection in each year,followed closely by biodiversity protection;this likely resulted from the high ability of woodland to protect both soils and biodiversity.Among the nine service functions,only the raw materials service function showed an increasedESVfrom 1990 to 2010,which can be attributed mainly to the fact that woodland provides a higher quantity of raw materials than the other land use types and the fact that the woodland area increased during the study period.
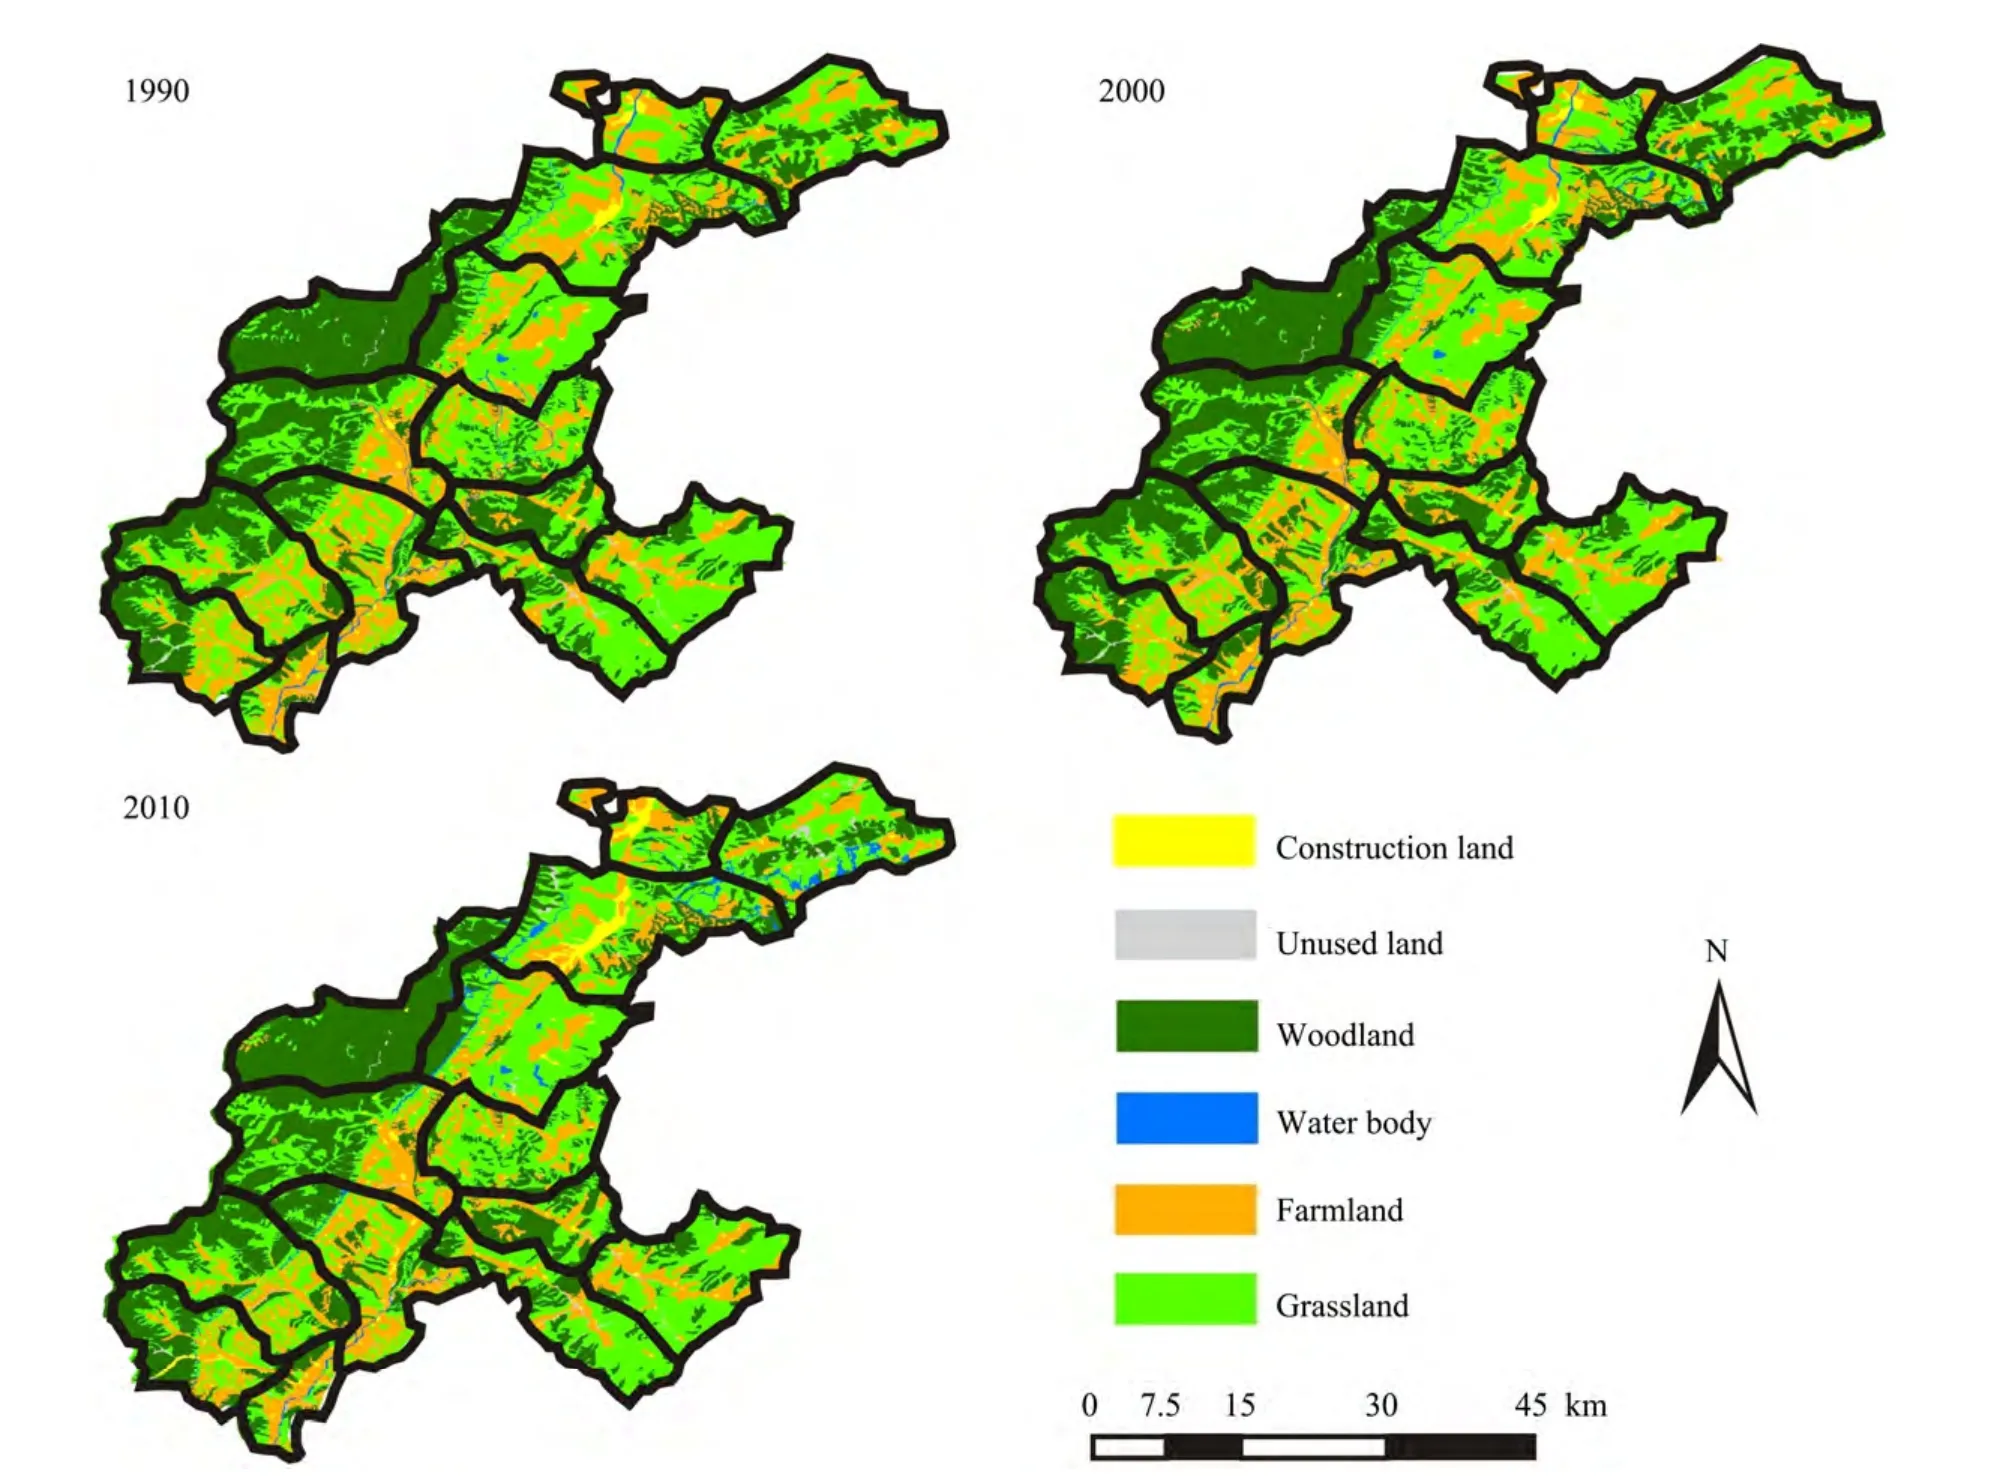
Figure 2 Map of land use in the 14 townships of Ningwu County in 1990,2000,and 2010
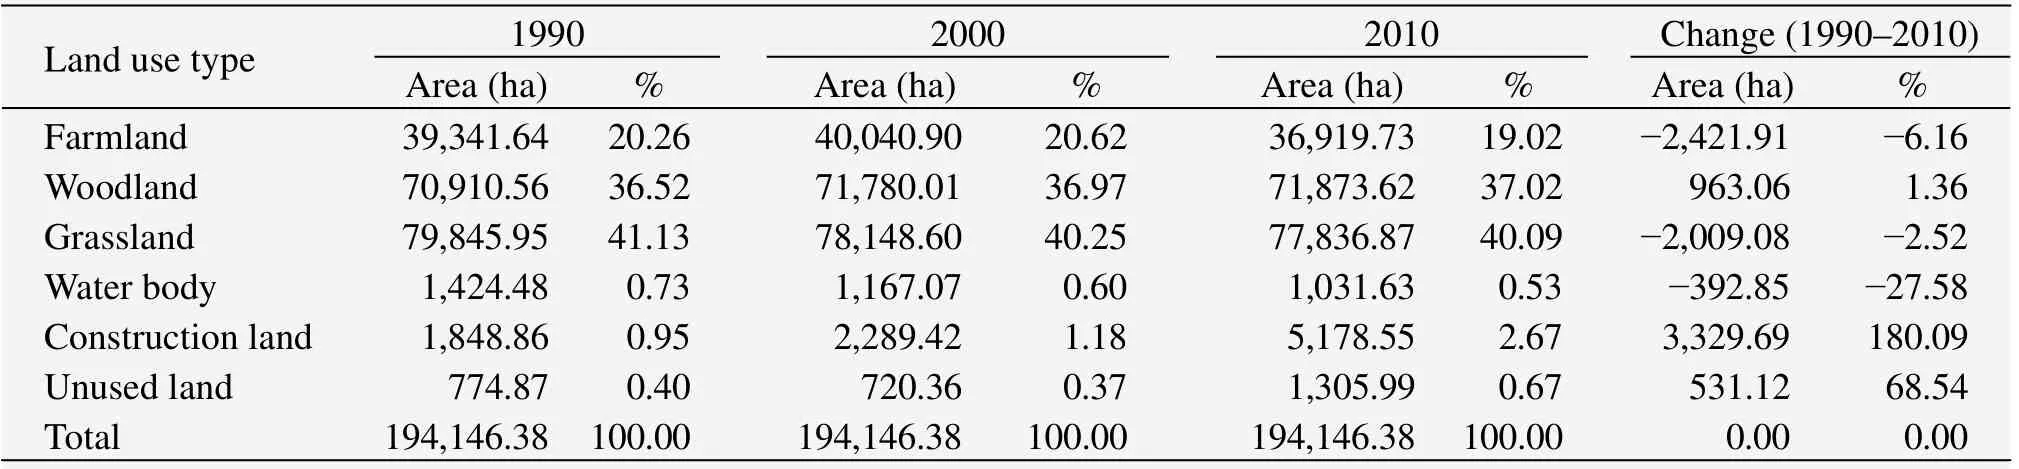
Table 3 Ningwu County land use patterns in 1990,2000,and 2010
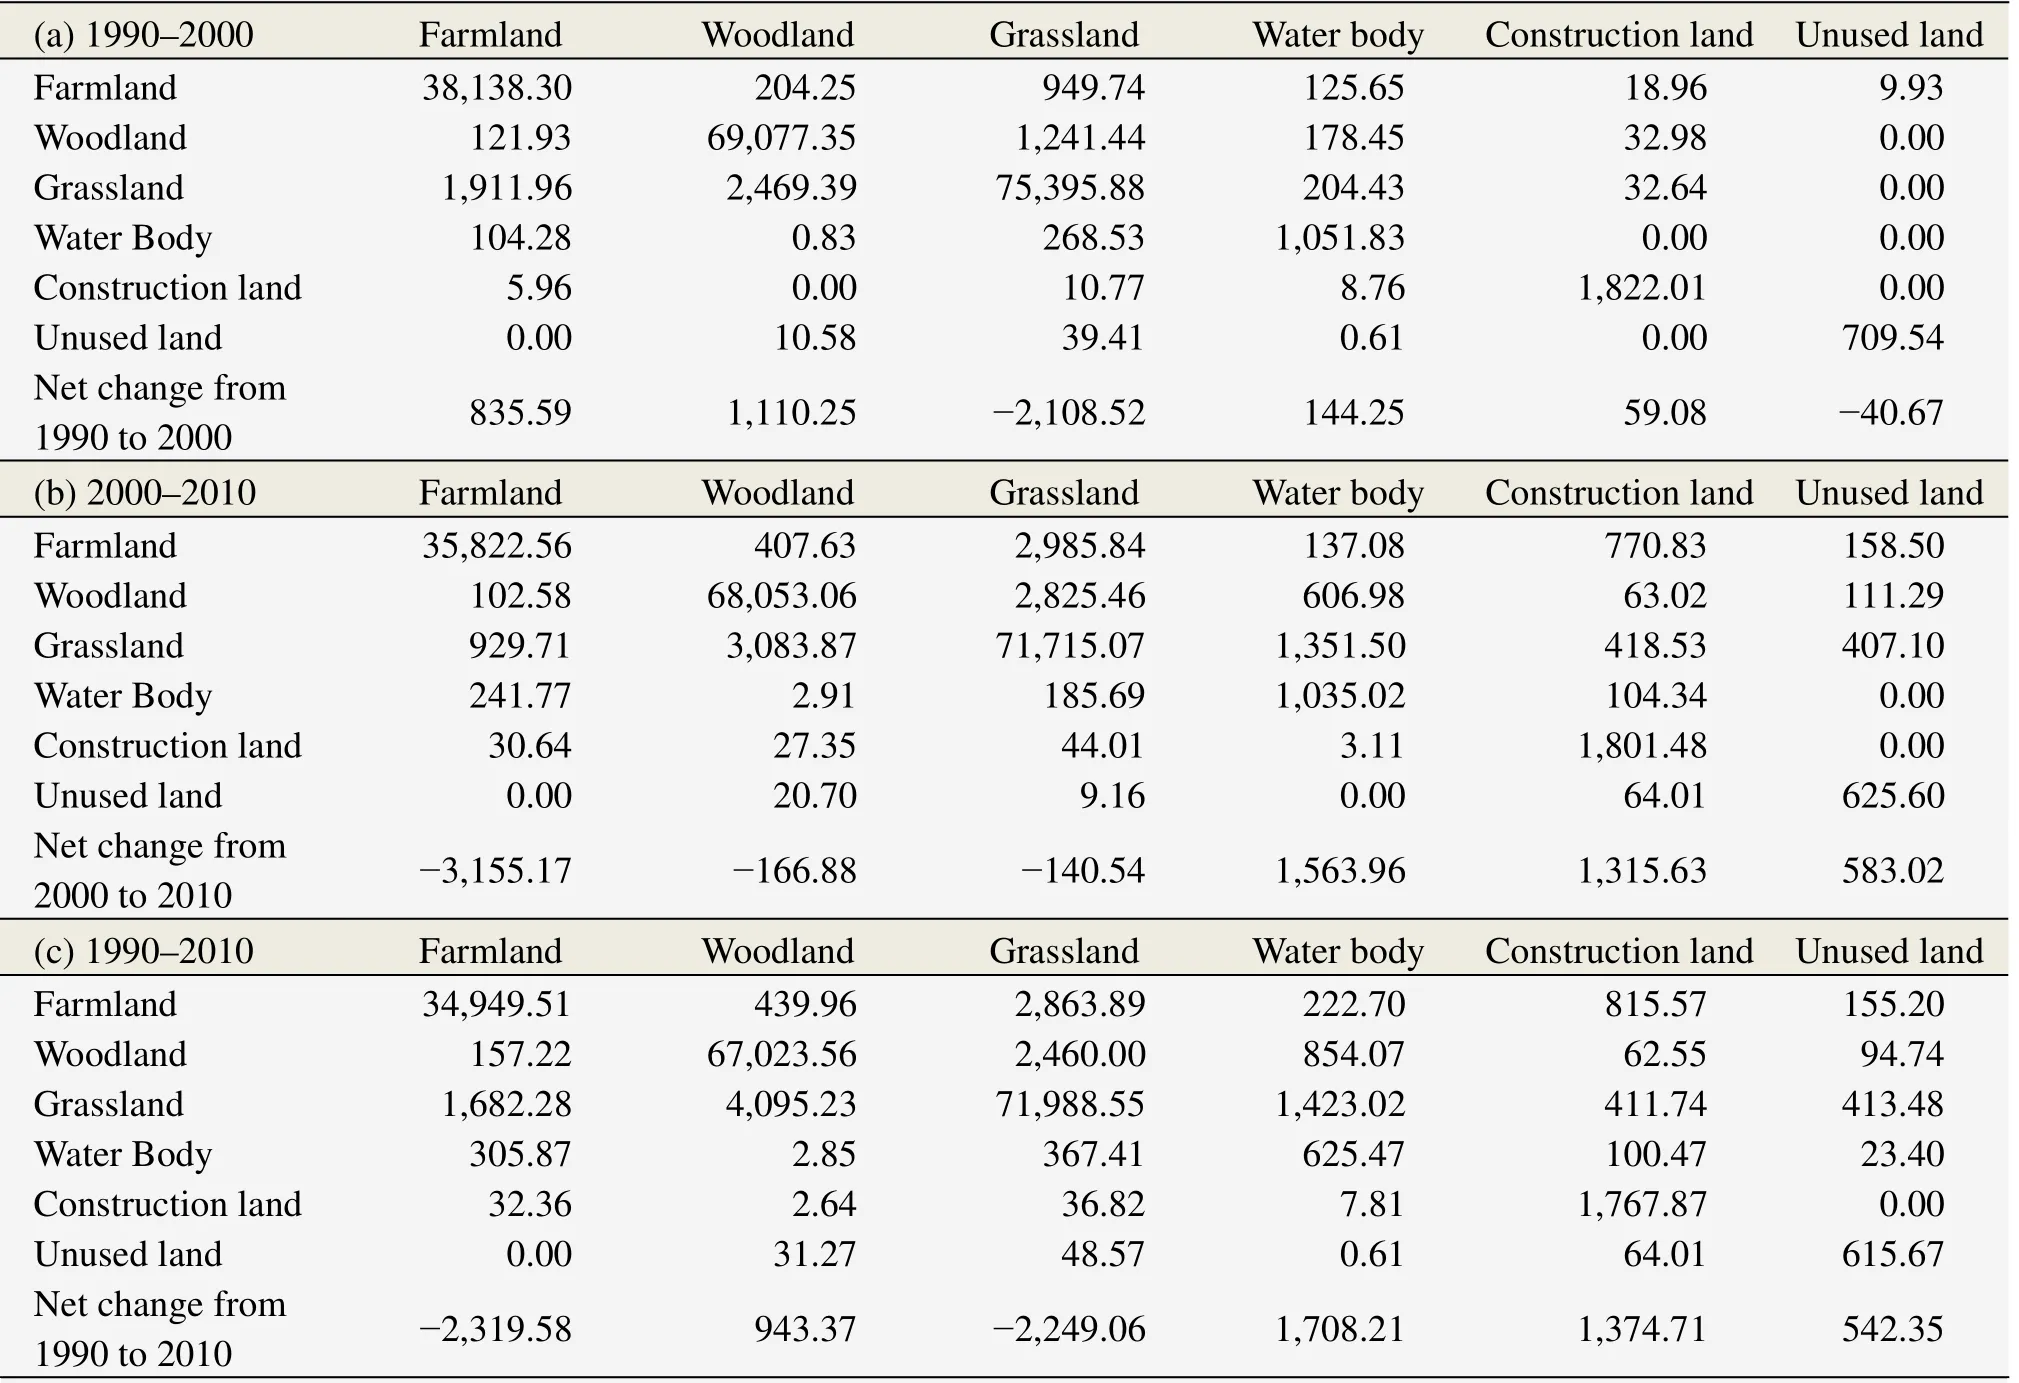
Table 4 Transition matrix for LUCC in Ningwu County from 1990 to 2000,2000 to 2010,and 1990 to 2010(Unit:ha)
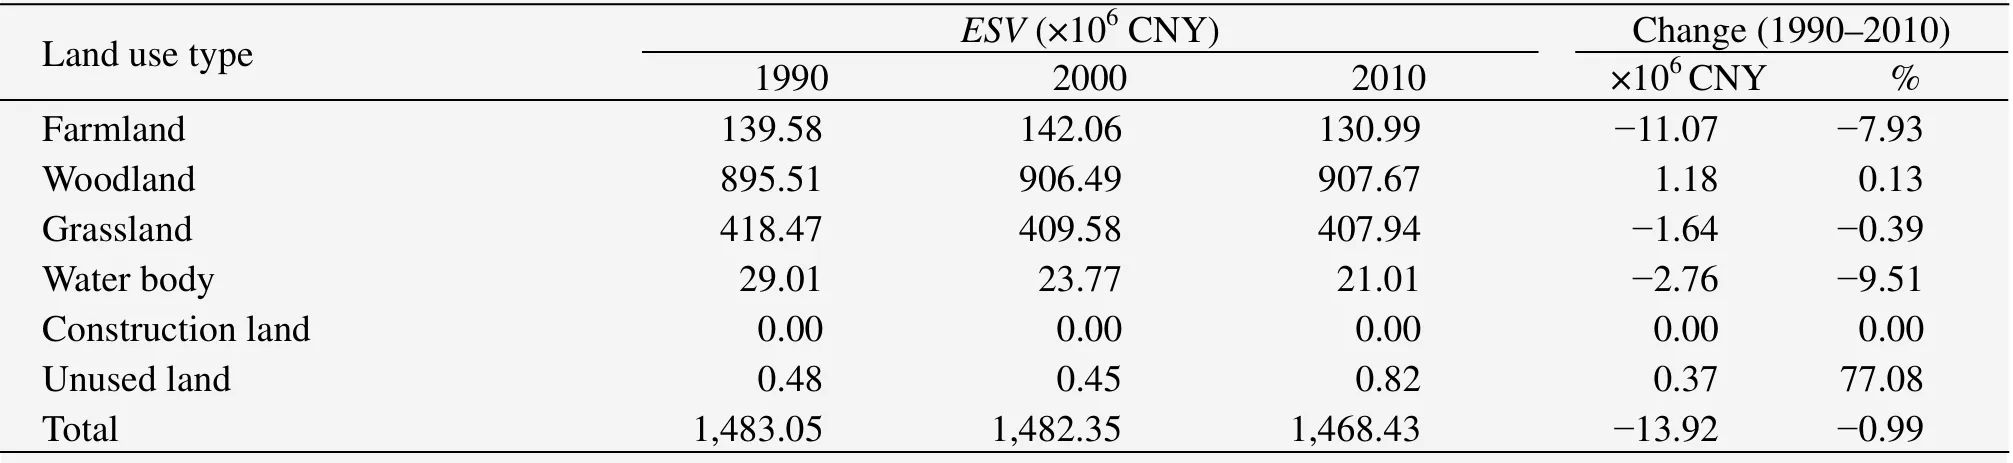
Table 5 Total ecosystem value coefficients(ESV)in Ningwu County in 1990,2000,and 2010
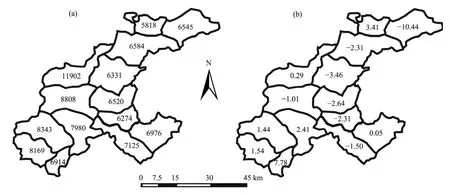
Figure 3 (a)The spatial distribution of ESV(CNY/ha)in 2010 and(b)the change(%)in ESV from 1990 to 2010
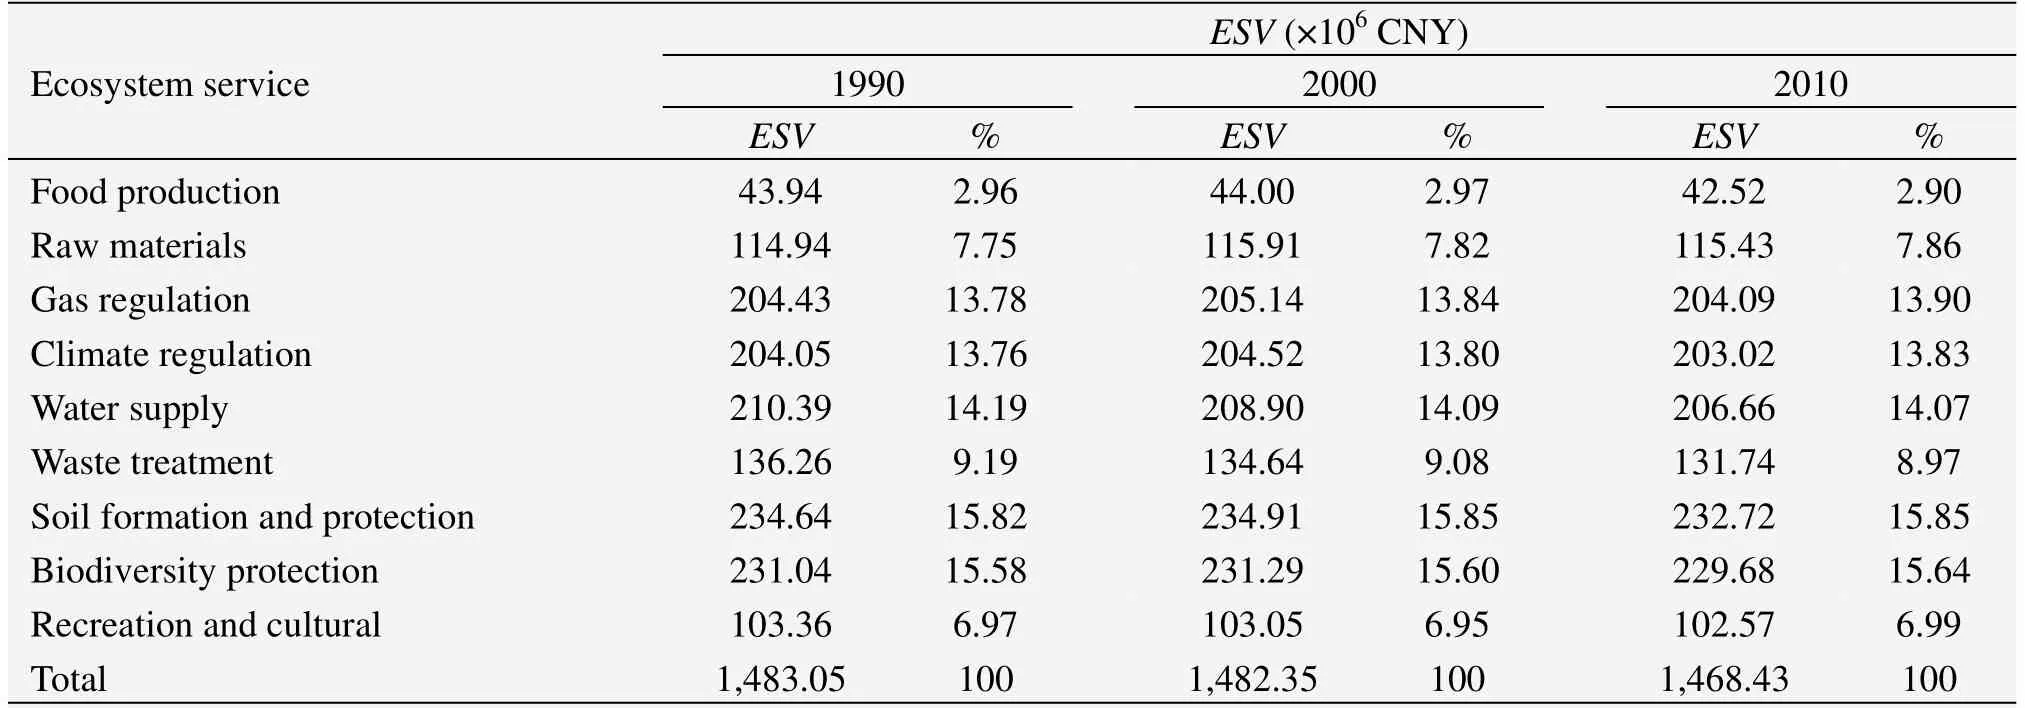
Table 6 The ecosystem value coefficients(ESV)of individual service functions for Ningwu County in 1990,2000,and 2010
5 Discussion
5.1 Discussion on valuation methods
In some studies,other methods(e.g.,indirect market evaluation)were used to calculate the value coefficients.Although different valuation methods may lead to different estimated values,leading to criticism of the ecosystem service valuation approach,since our study focused on changes inESVover time,we believe that the results are credible particularly in qualitative terms(Liuet al.,2012).To confirm this statement,we adjusted the value coefficients by up to 50%(ranging from 5% to 50%)and calculated how these adjustments changed the estimated totalESV(for a discussion of similar issues,see Liuet al.,2012).We found that totalESVthat we estimated for the study area were relatively inelastic with respect to the value coefficients,and that the estimated trend forESVwas relatively reliable.The estimation ofESVbased on land use data has also been used successfully in other case studies(e.g.,Liet al.,2010a,b;Yoshidaet al.,2010;Liuet al.,2012).
5.2 Discussion on change in ESV
Population and economic growth,combined with shifts in land use policy,have long been considered to be the major factors responsible for land use changes(e.g.,Lin and Ho,2003;Tanrivermis,2003;Longet al.,2007;Luoet al.,2008;Liuet al.,2009).Our study area's population density(82/km2)and per capita GDP(CNY 14,023)in 2010 were considerably lower than the corresponding values for Shanxi Province as a whole(228/km2and CNY 26,000,respectively)and for China as a whole(140/km2and CNY 29,000,respectively),which suggests that the intensity of human activity was weaker in the study area than in the Shanxi Province and in China as a whole.Although the population increased rapidly from 135,730 in 1990 to 161,160 in 2010,and GDP also increased rapidly,from 0.13×10⁹CNY in 1990 to 2.26×10⁹CNY in 2010,the most intense human activity was concentrated within the northeastern part of the study area,at a lower elevation and in flatter terrain than in other areas.In addition,most of the economic activities were provided by activities with high value-added(e.g.,industrial production)within an existing area or in a new small area of construction land.The result of these factors was only a slight change in the region's land use,especially in terms of woodland and grassland areas,which provide the most important ecosystem services for the study area.The net change was therefore anESVdecrease of only 1.0%.
TheESVincreased in most of the western mountainous areas with large areas of woodland,which may have resulted mainly from a low intensity of human activity combined with the implementation of ecological protection projects such as the conversion of farmland into woodland and the protection of natural forest resources,both of which have been supported financially by the Chinese government since 2000.The population density was larger and the economic increase was more rapid in the northeastern part of the study area,with flat terrain and low elevation,than in the western mountainous areas,sothatESVin the northeastern area showed the greatest decrease(Figure 3).This can be attributed mainly to the continuous expansion of construction land in this area at the expense of farmland and grassland and the abandonment of farmland due to the low income provided by farming.Such tradeoffs led to a slight net decrease(1.0%)in the totalESVof Ningwu County.
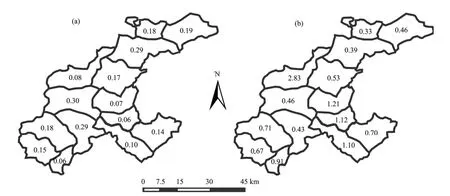
Figure 4 The spatial distribution of GDP(×109 CNY)(a)and the ratio of ESV to GDP(b)in 2010
Economic growth often seems to conflict with ecological protection(Liuet al.,2012).Although the ecological and economic characteristics of our study area and the evaluation techniques in the present study differed from those in studies of other areas of China,both the present and previous studies consistently showed thatESVhave decreased under current patterns of economic development(Liet al.,2010a;Li and Ren,2011).From 1990 to 2010,the GDP in our study area increased by 1,638%(after adjusting for inflation),while totalESVdecreased by only 1.0%.Some government officials may consider this a positive result.However,totalESVwas approximately 11.4 times the GDP in 1990,but decreased to 0.65 times the GDP in 2010.In previous research,the ratio ofESVto GNP reached 1.8 at a global scale(Costanzaet al.,1997b),and that betweenESVand GDP was 1.25 at a national scale for China(Chen and Zhang,2000).This comparison shows that although the ratio ofESVto GDP was initially much higher than the global and national average levels at the start of our study period,it was well below these levels by 2010 in most of the study area(Figure 4).
The spatial distribution shows that there exists a significantly negative relationship between the ratio ofESVto GDP and GDP in study area in 2010;that is,the ratio ofESVto GDP was low in the northeastern part of the study area and high in most other areas(Figure 4).This is a signal to regional planners that they must focus more on sustainable development and ecological protection,especially in the northeastern parts of the study area,so as to maintain a balance between economic development and ecosystem health in the future.
6 Conclusions
By analyzing and discussing changes in theESVestimated based on land use types in Ningwu County from 1990 to 2010,we reached two primary conclusions.First,totalESVfor Ningwu County decreased only slightly(by 1.0%)due to weak human activities.Woodland produced the largest proportion of theESV(about 61%),and woodland and grassland combined accounted for about 89% of the totalESV,indicating that these two land use types play major roles in providing ecosystem services.Second,we found that theESVper unit area(1 km2)was highest in the western mountainous areas due to the large areas of woodland,and increased most during the study period,probably due to the implementation of ecological protection projects.In contrast,theESVper unit area(1 km2)in flat,low-elevation terrain was relatively low,and showed the greatest decrease,probably due to the expansion of construction land and the abandonment of farmland.
Our results suggest that land use type can be used as a proxy for ecosystem services by matching the land use types to equivalent biomes,thereby facilitating the valuation of ecosystem services for large areas using remote-sensing data(Liuet al.,2012).In this paper,we used revised ecosystem value coefficients for China.However,future research must determine how to adapt the value coefficients so that they are more suitable for the study area and can account for variation within each land use type.However,for time-series analysis such as the one undertook in this study,the results of our sensitivity analysis suggest that useful results are possible despite uncertainties in the value of the coefficients(Liuet al.,2012).
This study was supported by the Open Fund Project of the Key Laboratory of Desert and Desertification,Chinese Academy of Sciences(No.KLDD-2014-001),the Important Specialized Science and Technology Item of Shanxi Province,China(No.20121101011),and the Natural Science Foundation of China(Nos.41271513,41271030).
Chen LD,Messing I,Zhang SR,et al.,2003.Land use evaluation and scenario analysis towards sustainable planning on the Loess Plateau in China—case study in a small catchment.Catena,54(1–2):303–316.DOI:10.1016/S0341-8162(03)00071-7.
Chen ZX,Zhang XS,2000.Value of ecosystem services in China.Chinese Science Bulletin,45(10):870–876.DOI:10.1007/BF02886190.
Costanza R,Cumberland J,Daly H,et al.,1997a.An Introduction to Ecological Economics.Delray Beach,FL,USA:St.Lucie Press.
Costanza R,d'Arge R,de Groot R,et al.,1997b.The value of the world's ecosystem services and natural capital.Nature,387:253–260.DOI:10.1038/387253a0.
El Serafy S,1998.Pricing the invaluable:the value of the world's ecosystem services and natural capital.Ecological Economics,25(1):25–27.DOI:10.1016/S0921-8009(98)00009-3.
Fan XH,Wang QX,Wang MB,2012.Changes in temperature and precipitation extremes during 1959–2008 in Shanxi,China.Theoretical and Applied Climatology,109(1–2):283–303.DOI:10.1007/s00704-011-0577-7.
Fu YL,Zhang XP,Chen FJ,et al.,2010.Land use/cover pattern survey under the background of grain for green policy implementation in the loess hilly-gully region—A case study of Majiagou Catchment,Ansai County.Research of Soil and Water Conservation,17(6):81–85.
Heal G,2000.Valuing ecosystem services.Ecosystems,3(1):24–30.DOI:10.1007/s100210000006.
Kozak J,Lant C,Shaikh S,et al.,2011.The geography of ecosystem service value:the case of the Des Plaines and Cache River wetlands,Illinois.Applied Geography,31(1):303–311.DOI:10.1016/j.apgeog.2010.07.001.
Kreuter UP,Harris HG,Matlock MD,et al.,2001.Change in ecosystem service values in the San Antonio area,Texas.Ecological Economics,39(3):333–346.DOI:10.1016/S0921-8009(01)00250-6.
Li J,Ren ZY,2011.Variations in ecosystem service in response to land use changes in the Loess Plateau in northern Shaanxi Province,China.International Journal of Environmental Research,5(1):109–118.
Li JC,Wang WL,Hu GY,et al.,2010a.Changes in ecosystem service values in Zoige Plateau,China.Agriculture Ecosystems &Environment,139(4):766–770.DOI:10.1016/j.agee.2010.10.019.
Li TH,Li WK,Qian ZH,2010b.Variations in ecosystem service value in response to land use changes in Shenzhen.Ecological Economics,69(7):1427–1435.DOI:10.1016/j.ecolecon.2008.05.018.
Lin GCS,Ho SPS,2003.China's land resources and land-use change:insights from the 1996 land survey.Land Use Policy,20(2):87–107.DOI:10.1016/S0264-8377(03)00007-3.
Liu H,Zhao WZ,Chang XL,et al.,2009.Characterizing landscape dynamics of a small catchment under ecological rehabilitation interventions in Northwestern China.Landscape and Urban Planning,93(3–4):201–209.DOI:10.1016/j.landurbplan.2009.07.007.
Liu Y,Li JC,Zhang H,2012.An ecosystem service valuation of land use change in Taiyuan City,China.Ecological Modelling,225:127–132.DOI:10.1016/j.ecolmodel.2011.11.017.
Long HL,Tang GP,Li XB,et al.,2007.Socio-economic driving forces of land-use change in Kunshan,the Yangtze River Delta economic area of China.Journal of Environmental Management,83(3):351–364.DOI:10.1016/j.jenvman.2006.04.003.
Luo GP,Zhou CH,Chen X,et al.,2008.A methodology of characterizing status and trend of land changes in oases:A case study of Sangong River watershed,Xinjiang,China.Journal of Environmental Management,88(4):775–783.DOI:10.1016/j.jenvman.2007.04.003.
Ma AQ,Chen DJ,Wang JH,et al.,2002.Landscape pattern and differentiation in Longdong Loess Plateau based on RS and GIS.Journal of Soil and Water Conservation,16(3):56–59.
Millennium Ecosystem Assessment,2003.Ecosystems and Human Well-being:Current State and Trends.Washington D.C.:Island Press.
Qiu HJ,Cao MM,2011.Land-use change in gully region of Loess Plateau—A case study of Luochuan County,Shaanxi Province.Bulletin Soil and Water Conservation,31(2):207–210.
Sherrouse BC,Clement JM,Semmens DJ,2011.A GIS application for assessing,mapping,and quantifying the social values of ecosystem services.Applied Geography,31(2):748–760.DOI:10.1016/j.apgeog.2010.08.002.
Su CH,Fu BJ,He CS,et al.,2012a.Variation of ecosystem services and human activities:A case study in the Yanhe Watershed of China.Acta Oecologica,44:46–57.DOI:10.1016/j.actao.2011.11.006.
Su SL,Xiao R,Jiang ZL,et al.,2012b.Characterizing landscape pattern and ecosystem service value changes for urbanization impacts at an eco-regional scale.Applied Geography,34:295–305.DOI:10.1016/j.apgeog.2011.12.001.
Tanrivermis H,2003.Agricultural land use change and sustainable use of land resources in the mediterranean region of Turkey.Journal of Arid Environment,54:553–564.DOI:10.1006/jare.2002.1078.
Van der Horst D,2011.Adoption of payments for ecosystem services:an application of the H?gerstrand model.Applied Geography,31(2):668–676.DOI:10.1016/j.apgeog.2010.12.001.
Wilson MA,Howarth RB,2002.Discourse-based valuation of ecosystem services:establishing fair outcomes through group deliberation.Ecological Economics,41(3):431–443.DOI:10.1016/S0921-8009(02)00092-7.
Xie GD,Lu CX,Leng YF,et al.,2003.Ecological assets valuation of the Tibetan Plateau.Journal of Natural Resources,18(2):189–196.DOI:10.11849/zrzyxb.2003.02.010.
Xie GD,Zhen L,Lu CX,et al.,2008.Expert knowledge based valuation method of ecosystem services in China.Journal of Natural Resources,23(5):911–919.DOI:10.11849/zrzyxb.2008.05.019.
Yoshida A,Chanhda H,Ye YM,et al.,2010.Ecosystem service values and land use change in the opium poppy cultivation region in northern part of Lao PDR.Acta Ecologica Sinica,30(2):56–61.DOI:10.1016/j.chnaes.2010.03.002.
Zhang XM,Yu XX,Wu SH,et al.,2007.Response of land use/coverage change to hydrological dynamics at watershed scale in the Loess Plateau of China.Acta Ecologica Sinica,27(2):414–421.DOI:10.1016/S1872-2032(07)60013-4.
Zhao B,Kreuter U,Li B,et al.,2004.An ecosystem service value assessment of land-use change on Chongming Island,China.Land Use Policy,21(2):139–148.DOI:10.1016/j.landusepol.2003.10.003.
Zhao J,Wei L,Chen S,2010.Dynamics of the ecosystem service values along the upper reaches of Shiyanghe River Basin.Journal of Arid Resources and Environment,1:36–40.
 Sciences in Cold and Arid Regions2015年3期
- Sciences in Cold and Arid Regions的其它文章
- The characteristics of oasis urban expansion and drive mechanism analysis:a case study on Ganzhou District in Hexi Corridor,China
- Elemental composition and its environmental significance for the varicolored hills in the northern foothills of the Qilian Mountains of Sunan Yugur Autonomous County,China
- Aesthetic evaluation of yardang landforms landscape:the Dunhuang Yardang National Geo-park example
- Characterizing stand structure in a spruce forests:effects of sampling protocols
- Biomass and water partitioning in two age-related Caragana korshinskii plantations in desert steppe,northern China
- Comparative studies on leaf epidermal micromorphology and mesophyll structure of Elaeagnus angustifoliaL.in two different regions of desert habitat