
Characterizing stand structure in a spruce forests:effects of sampling protocols
2015-12-19 08:40:00JunDuWeiJunZhaoZhiBinHeJunJunYangLongFeiChenXiZhu
Jun Du ,WeiJun Zhao ,ZhiBin He *,JunJun Yang ,LongFei Chen ,Xi Zhu
1.Linze Inland River Basin Research Station,Chinese Ecosystem Research Network,Heihe Key Laboratory of Ecohydrology and Integrated River Basin Science,Cold and Arid Regions Environmental and Engineering Research Institute,Chinese Academy of Sciences,Lanzhou,Gansu 730000,China
2.Gansu Province Qilian Water Resource Conservation Forest Research Institute,Zhangye,Gansu 734000,China
1 Introduction
The general monitoring of regeneration processes and structural pathways in natural forest landscapes is one of the most important components of forest inventory(Arevalo and Fernadez-Palacios,1998;Wittmann and Junk,2003).Silvicultural strategies,for example,should be based on the explicit understanding of the structural attributes of young and old-growth stands(e.g.,density of saplings,volume of aged trees,and volume of coarse woody debris).Indeed,local variability of these unconventional features(defined as characteristics with high randomness and spatial heterogeneity,generally difficult to measure)is still not well known,as is the insight of how sampling strategies affect the precision of assessment(Gray,2003;Králet al.,2010a;L?hmus and Kraut,2010).Most inventories of tropical and temperate forests have focused on conventional structural features such as stem density,basal area,and stand volume(Kupfer and Kirsch,1998;Youngbloodet al.,2004;Laumonieret al.,2010);these attributes are referred to as possessing relative constancy within a site.
Current efforts to assess the structure and floristic composition of forest regeneration generally include monitoring using remotely-sensed imagery on a regional scale(Hydeet al.,2006;Chenet al.,2011;Junget al.,2013b;Duet al.,2014),and biometric methods at plot-level(Kupfer and Kirsch,1998;Lindenmayeret al.,2000;Holeksaet al.,2007).With effective light absorption measurements,the satellite-based method facilitates the scaling to larger spatial extent than field-based methods by relating light absorption to photosynthetic rates as well as to vegetation structure and dynamics(Bradfordet al.,2010).However,application of remote sensing has found little empirical support for the identification of rare stand structural features(termed here:unconventional features)(Wulder,1998),possibly because the configuration of the upper canopy plays an important role in shielding of the understory,especially of saplings and snags.A greater site-level precision is often needed for monitoring of ecological stand attributes and for ground-truthing of remotely-sensed data(Gray,2003).For example,knowing how saplings regenerate and mortality varies with serial stage provides information for alternative management approaches.Moreover,the need for plot inventory for direct quantification of stand structure at individual locations is widely recognized(Kadavul and Parthasarathy,1999;Wittmann and Junk,2003;Laumonieret al.,2010).
A particular focus of field sampling is the selection of inventory protocol,including plot shape and size(Rempel and Kushneriuk,2003;Bradfordet al.,2010;Králet al.,2010a;Laumonieret al.,2010;Salakoet al.,2013).Ranges of sampling methods have been practiced in forested landscapes.Nevertheless,the considerable body of literature on the topic does not use a uniform standard.For example,square-shaped single or a few large plots(more than 1 ha)have been used in some studies(Yamakuraet al.,1986;Bileket al.,2011),while in others,results were based on a number of small and circular plots,often 0.1 ha in size(Holeksaet al.,2009;Vedriset al.,2009).Sampling protocol needs to address not only the precision of assessment but also the practicality and efficiency of traveling among sites(Stockdale and Wright,1996;Evans and Viengkham,2001;Xiaoet al.,2004).Additionally,the spatial pattern of trees in a forest stand strongly affects inventory strategies(Youngbloodet al.,2004;Rozas,2006).For example,an evenly-spaced forest stand may require fewer smaller plots to achieve the same sampling accuracy as a stand with a highly aggregated tree distribution pattern.Thus,due to the heterogeneity of forest stands,investigators need detailed prior knowledge to decide which sampling protocols are optimal,and how the sampling methods may affect the outcomes.Such information is scarce for temperate and boreal forests,especially in mountainous terrain.
The purpose of this research is to develop quantitative assessment of the effects of different sampling protocols on the results of measuring forest structural attributes such as stem density,stem height,stand basal area,the number of saplings and of large trees,and the volume of coarse woody debris(CWD).In this study,we refer to the first three attributes(stem density and height,and stand basal area)as conventional stand attributes;the others are called unconventional stand attributes.The following questions were addressed:(1)how do plot shape and size affect the precision of measurement of stand structural features?and(2)were the effects of plot shape and size the same for conventional and unconventional features?To address these questions,we examined the six stand characteristics along an altitudinal gradient in a subalpine spruce forest landscape in numerous temporary and in one permanent plot.We also discuss the impact of spatial patterns of trees on sampling methods.The spruce forest was elected as the subject investigated because it is a representative biome in semi-arid mountain regions in northwestern China(Heet al.,2012).This work can be used as reference to reduce the sampling error for stand structure measurement in this forest.
2 Methods
2.1 Study area
Sampling was conducted in two temperate forests in the Qilian Mountains in northwestern China(Figure 1):Pailougou(38°33′22″N,100°17′06″E),an upstream catchment of the Heihe River Basin,and Guantai(38°31′48″N,100°15′00″E),4 km away from Pailougou.Both sites consist primarily of an evergreen coniferous forest dominated byPicea crassifolia,naturally-regenerated following widespread logging around the middle of the 20th century.These forests have been targeted for conservation since 1988.Soils are aridic but generally well drained Haplustalfs,with the main parent material being calcareous rock(Heet al.,2012).Climate across the Qilian Mountains is characteristic of temperate continental plateau where is cool and semiarid.
Forest stands at the Pailougou catchment are located between 2,650 and 3,200 m a.s.l.,and growing on shaded or semi-shaded slopes.Annual rainfall ranged from 290.2 to 467.8 mm,with 60% of precipitation concentrated in summer(Changet al.,2014).Average annual temperature was about 2 °C at the base of the catchment to-1 °C near the upper timberline.We established 21 temporary plots along the altitudinal gradient,using a stratified sampling design.At the Guantai site,a 300m×340m,10.2 ha permanent plot was established at 2,835 m a.s.l.with the longer side parallel to the slope.
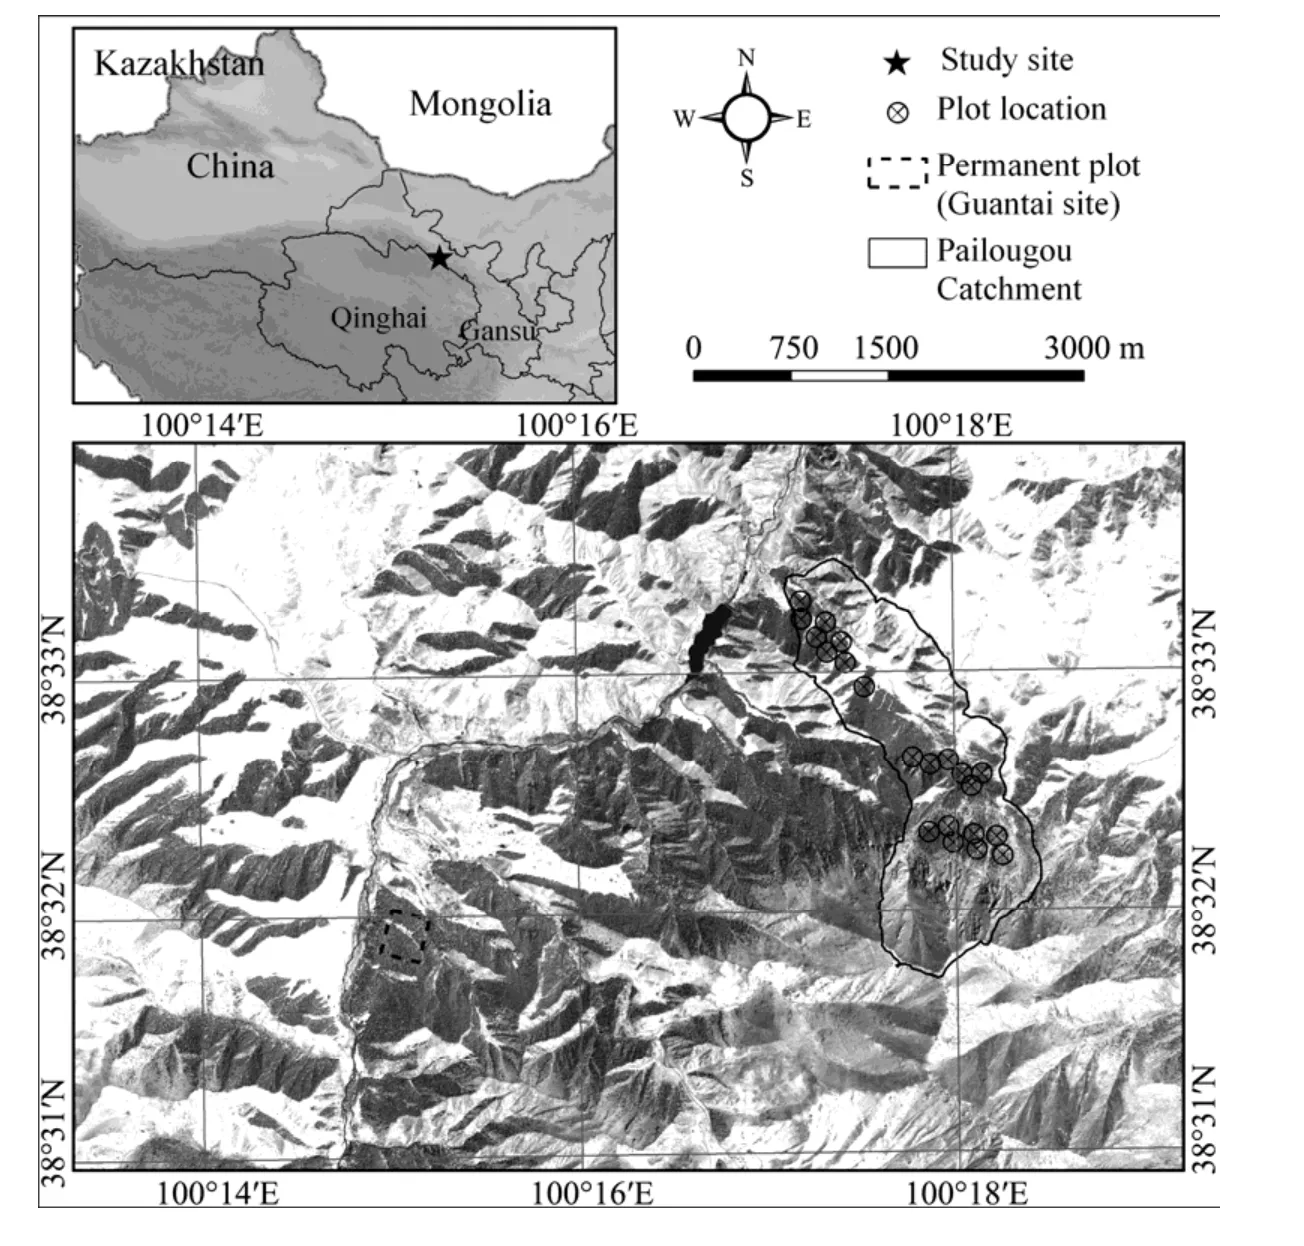
Figure 1 The location of our study site
2.2 Data collection
To ensure that our sampling reflected a wide array of environmental variables,our inventory at Pailougou was planned to be representative of three land facets(lower,mid-,and upper slope),with approximately 200 m a.s.l.difference in adjacent slope positions.Twenty-one 0.04-ha plots in all were randomly located within three slope positions.Each sampling plot was established according to the following:(1)plot shape was square(l=20 m),circular(r=11.28 m),and rectangular(defined with the ratio of long to short axis equal to 2:1,i.e.,a=14.14 m,b=28.28 m,and the direction of the long axis was east-west);(2)the three shapes had the same central point and equal areas(0.04 ha).To evaluate the effect of plot shape on the accuracy of measurement of stand structural features,we ensured that the time needed for travelling among plots and conducting enumeration was relatively consistent through the preceding sampling projection.Within each plot,we selected six attributes to characterize,including three conventional attributes(i.e.,stem density,stem height,and basal area of stand)and three unconventional attributes(i.e.,the number of saplings,the number of large trees,and volume of coarse woody debris).
All living trees and snags with a diameter at breast height(DBH)of ≥1 cm were measured in each plot.We recordedDBHto the nearest cm,and height to 0.5 m(Holeksaet al.,2009).For fallen logs,we measured diameter at a distance of 1.3 m to butt end,of which the position within plot boundary was considered to be in situ.Individual logs were uniquely tagged and mapped by measuring the angle and horizontal distance to the center point of the plot(regarded as the origin of coordinates).Because the age of the stand was generally between 50 to 70 years(Table 1)and last harvesting created a clumped distribution of low-quality residual trees(Heet al.,2010),saplings were defined as any stem between 1 and 5 cm inDBH,while individuals withDBH≥25 cm were referred to as large trees.For this study,coarse woody debris(CWD)consisted of standing(snags)and fallen dead trees,assuming they represented class 1 decay stage(recently dead,small branches and at least some foliage still attached)(Bradfordet al.,2010).Volume of CWD was calculated using equations from Liu(2012):
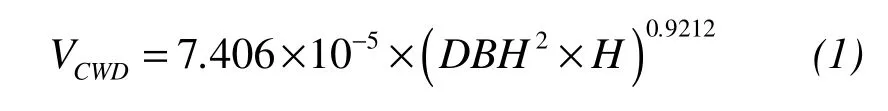
whereDBHis the diameter at breast height,andHis the total height of tree.
We used survey data from the 10.2 ha(300m×340m)permanent plot at Guantai site to simulate how the precision of measurement of forest structural features changed as sampling area increased.Additionally,different plot shapes were used in our simulation to determine if plot shape affects the outcome of structural measurement.The permanent plot at Guantai was established in 2009 by the Academy of Water Resources and Conservation Forests in the Qilian Mountains of Gansu Province to monitor forest ecosystem dynamics and to establish adaptive management strategies(Liet al.,2013).Altogether,19,927 trees withDBH≥1 cm were mapped and measured,including the coordinates,DBH,height,crown width,and status(live,stump,snag,fallen)of each tree.For this study,we focused on those attributes that we measured at the Pailougou site.The purpose of the acquired data from Pailougou site was limited to illustrate the spatial heterogeneity of stand structure and to validate the applicability of our simulation results about plot shape effects.
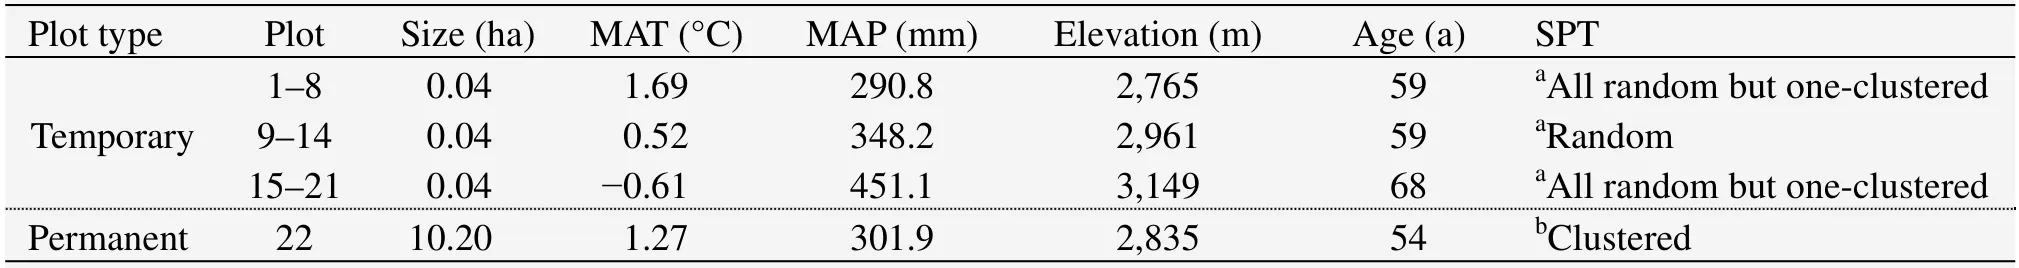
Table 1 Plot size,climatic conditions,general stand structure,and spatial pattern of trees in sampling plots.Temporary plotswere established at Pailougou stand,and permanent one at Guantai stand
2.3 Data analysis
2.3.1 Spatial pattern
Spatial autocorrelation in tree stands determines many of the attributes used to characterize forest structural conditions(Liet al.,2008;Zenner and Peck,2009),in particular the rare ones,and affects the precision of spatial surveys(Liet al.,2008).In our study,we analyzed the point patterns of mapped trees in each plot using the empirical univariate Ripley’sK(t)function(Ripley,1977;Gray and He,2009)defined as(for a given radius,t):
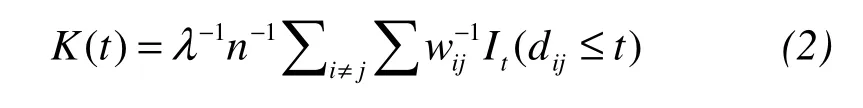
whereλis the density of events(trees per unit area);the sum of trees in our plot was taken overnpoints;dijrepresented the Euclidean distance from treeito treejwithin the plot;It(dij≤t)is an indicator function with values equal to 1 if the condition(dij≤t)held and 0 otherwise;and the weightwijdenoted the proportion of the circumference of a circle centered at theith tree passing through treejand that was within plot.Then,the statisticL(t)was applied to determine if a spatial point pattern departed from the Poisson process;the null hypothesis was that the points are distributed randomly and independently.This statistic was obtained by transforming theKfunction as proposed by Besag(1977):
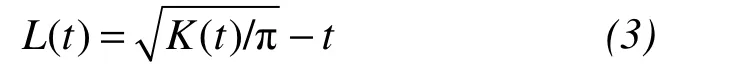
The Monte Carlo procedure was used to compute local values of a confidence interval for the departure of a pattern from complete spatial randomness.In our study,we obtained 95% confidence envelopes by performing 100 Monte Carlo simulations of the Poisson process at distances from 0 to 15 m by 1-m intervals in plots at Pailougou(Table 1),and from 0 to 100 m by 2-m intervals in plots at Guantai(Figure 1).Significant aggregation at a particular scale was indicated ifL(t)was above,and significant regularity ifL(t)fell below the confidence envelope.The calculations ofL(t)functions and Monte Carlo simulations were conducted in the R Statistical Programming Software by using the "spatstat" package(Gray and He,2009).
2.3.2 Sampling simulation
Variability in the estimates of stand structural features introduced by differences in plot shape and size was assessed using the Monte Carlo simulation(Junget al.,2013a)based on data from Guantai site.This robust method iteratively evaluates a deterministic component using sets of random values generated from probability distributions(Morioet al.,2010).During the procedure,the placement of different-sized plots were randomly assigned to the stem position maps in the same way as they were observed in the sampling inventory at Pailougou(i.e.,different-shaped plots stacked together with the same center point and equal area).Simulations were carried out for three plot shapes(i.e.,square,circular,and rectangular)and seven sizes(0.01,0.04,0.09,0.25,0.49,1.00,and 1.96 ha),and for each of the six stand characteristics described in Section 2.2.To avoid bias due to plot edges,we excluded a rectangular buffer with long axis of(70+a)m and short axis of(50+r)m,whereawas the short axis of the rectangle,andrwas the radius of a circle;that is,the center of plots to be simulated was confined to(200-2a)m×(200-2r)m.For instance,for a plot of 0.25 ha,the potential position of the center would fall in the area of 129.28m×144.6m(a=35.36 m,r=28.2 m).To evaluate the effect of plot shape,we randomly "established" 30 plots required for a statistical sample(Von Storch and Zwiers,1999)for each plot size based on the stem position map in Guaitai stand,respectively.For examining the effect of plot size,the procedure was repeated automatically 1,000 times,and values for the attributes for each selected plot were "sampled".
2.3.3 Statistical analysis
We calculated descriptive statistics(e.g.,minimum,mean,maximum),within-stand variability(e.g.,mean absolute error(MAE),coefficient of variation(CV)),and the range between the 2.5th and 97.5th percentiles(CI95)for the six observed stand characteristics for each plot shape using the SPSS software(Table 2).When necessary,data were transformed via natural logarithmic function to normalize the distribution,and the results were subsequently back-transformed.One-way analysis of variance(ANOVA)was used to detect differences among the three plot shapes,and LSD(least-significant difference)test was conducted to determine if there were any strong relationships among them.

Table 2 Statistics for structural features at Pailougou,derived from sample plots of different shapes
To examine the effects of plot shape and size on the number of plots,we used a two-stage analysis technique.First,we used a bootstrap resampling method,whose purpose is to expand virtually the amount of samples based on an unknown probability distribution,to quantify within-stand variability in different stand characteristics addressed in our study(Laumonieret al.,2010;Storck,2011).We applied the data from the stratified sampling investigation from Pailougou and the results of Monte Carlo simulations at Guaitai to generate 1,000 bootstrapped recalculations of structural features.In this step,we used subsamples of 3–200 plots with replacement(i.e.,resampling),and calculated coefficients of variation along plot sizes.Using these values,we then calculated the number of plots(n)needed to estimate the mean within an errordat an error rateαby iterative solving fornusing(Zar,1996):

wheretis the Student'st-statistic ands2is the estimate of the population variance(Kelleret al.,2001;Králet al.,2010a).In our study,we defined an acceptable accuracy level for estimating of forest structural characteristics asd≤20% for the Pailougou andd≤10% for the Guaitai stand,respectively,due to different spatial extent and environmental heterogeneity.
3 Results
3.1 Effects of plot shape
The variability in stand characteristics at Pailougou resulted in a wide range of statistical values(Figure 2)and high coefficients of variation(Table 2).Variation in stem height and stand basal area within a site generally did not exceed 20% of the overall parameter mean,independent of plot shape.However,greater differences were exhibited between slope positions in the other four stand characteristics,especially for unconventional stand attributes,with highest coefficient of variation in the volume of coarse woody debris(186%).
On the basis of random distribution at scales ranging from 10 m to 15 m(corresponding to 0.04 ha size)and with the exception of 3 plots(Table 1),the estimated mean value for a particular stand attribute was comparable among different plot shapes(Table 2);however,the percentiles characterizing the distributions,such as the 90th percentile for NOL(number of large trees)and 75th percentile for BA(basal area),depended on plot shape used(Figure 2).Effects of plot shape were more pronounced for the extreme values than for those that were close to the mean.For example,minimum stand density(D)ranged from 550 tress/ha calculated from square plots to 950 tress/ha derived from rectangular ones,maximum number of saplings(NOS)varied from as low as 2,500 tress/ha in circular plots to as many as 3,500 tress/ha in rectangular ones,and the minimum value of NOS derived from circular plots was even only half of amount based on rectangular ones.
Similar to the observation in Pailougou,visual pattern obtained from Guantai simulation illustrated that the effect of plot shape depended on the inventory biometric indicators used.At all scales,the capability of plot shape in reflecting the averaged situation was almost consistent.However,the measures of structural heterogeneity and complexity were indeed influenced by the plot shape used to assess them,such as CV and MAE(Figure 3).Further,we found that the outcomes from circular plots were more proximate to that of square ones than rectangular ones(Figure 3 and Table 3).Despite the fact that thep-values occurred as much as above 0.8 in most cases,discrepancies between rectangular-shaped plots and the others were still considerable for minimum values for unconventional features(allp<0.41),and similar cases were observed for conventional features(Table 3).
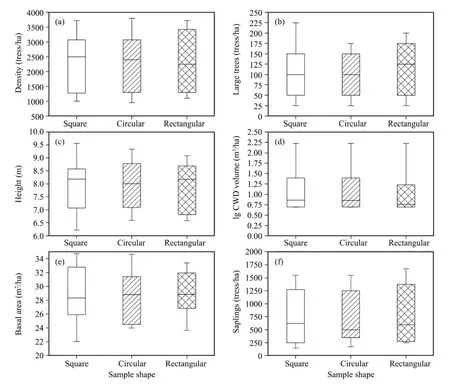
Figure 2 The distribution parameters of stand characteristics for different plot shapes measured at Pailougou.Boxes indicate the median,25th,and 75th percentile of values;whiskers above and below the box denote the 10th and the 90th percentiles,respectively
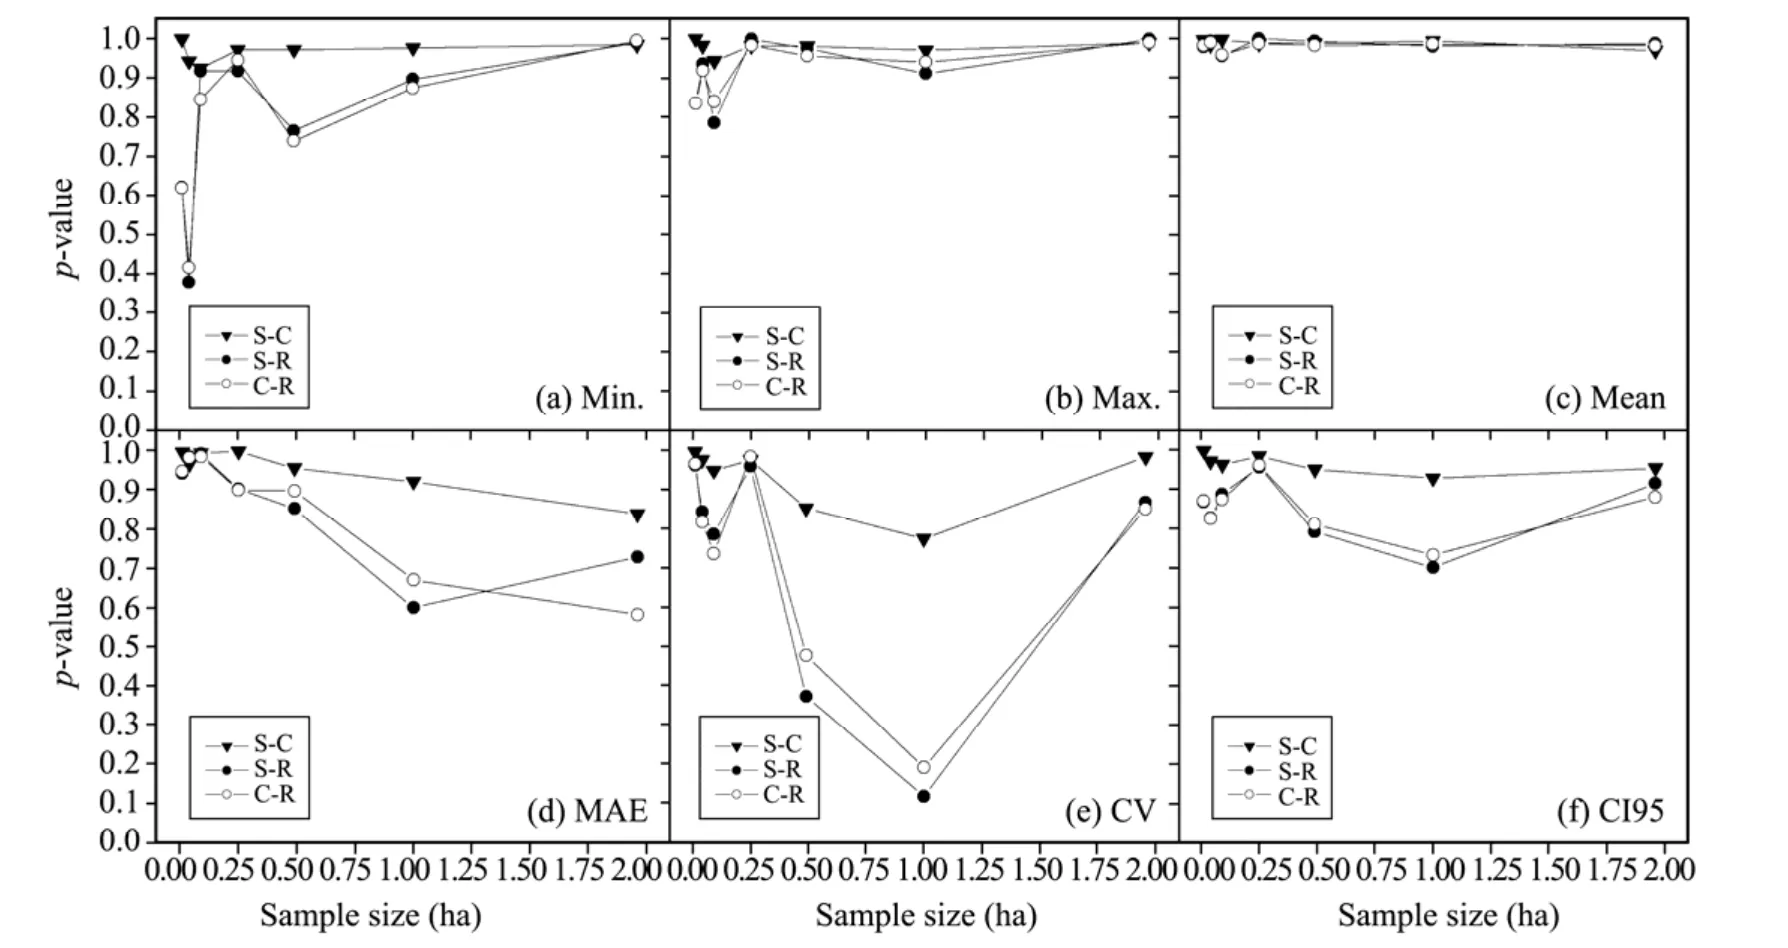
Figure 3 p-values for differences of plot shapes in measuring stand structures at Guantai based on LSD(S,square;C,circular;R,rectangular)
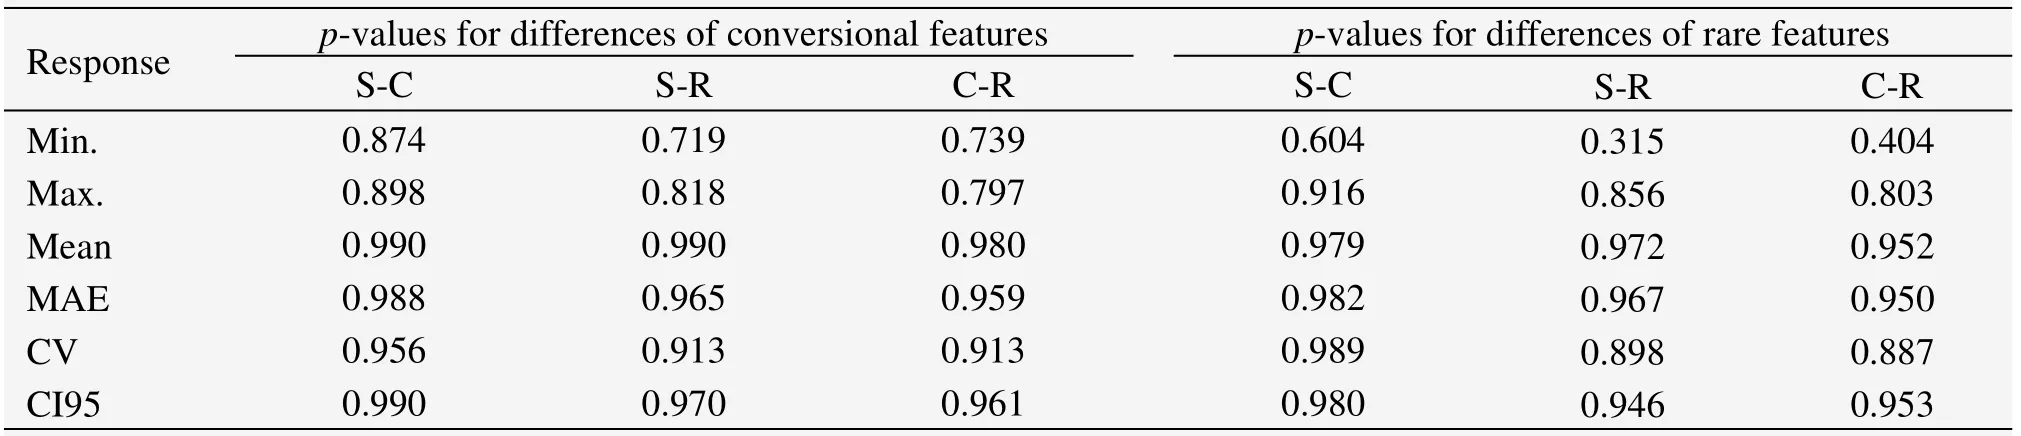
Table 3 p-values for differences of plot shapes in measuring stand structures at Pailougou based on LSD
3.2 Effects of plot size
The Ripley's K analysis showed that trees at the Guaitai stand were autocorrelated in two-dimensional space over distances up to about 100 m(Figure 4),with a tendency for high variability at small scales.As expected,variability decreased with an increase in plot size in Monte Carlo simulations,until the decline flatten out when very large plots were used(e.g.,at >1 ha in our study)(Figure 5).Regardless of plot shape,the trends in variability were remarkably similar as a function of sample size;variability appeared to closely follow the power formy=axb(Králet al.,2010a),with an initial steep decrease and a subsequent relative stabilization.
Variability was lower for conventional structural features than unconventional ones regardless of plot size;moreover,this was particularly evident when small plots were considered(Figure 5).The transition of the "reverse J-type" curve occurred at plot size of about 0.1 ha for the conventional features,when the rate of decrease dropped to <1% per 0.01 ha,while to reach that point,0.25 ha or even larger plots were required for the unconventional features.Similarly,if an error level of 20% was expected under an unchanging plot numbers,a minimum plot size of approximately 0.5 ha should be used to estimate the conventional,and >1.0 ha for the rare structural features.
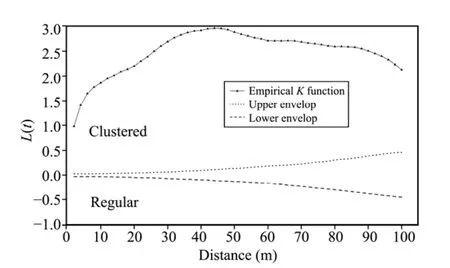
Figure 4 Empirical univariate K distributions of all trees with DBH ≥1 cm at Guaitai stand and 95% confidence envelopes
3.3 Combined influence of plot shape and size
The slopes of the error curves declined quickly and leveled off with the number of plots sampled for both conventional and rare structural features for all plot shapes and sizes in both stands(Figure 6).For a given plot shape and size(e.g.,in 0.04 ha with circular-shaped,Figure 6),the magnitude of the coefficient of variation at Pailougou was greater than that at Guaitai for the same number of plots,though randomly spatial distribution of trees at small scales appeared more often in the former,indicating that the within-site variability due to aggregated conditions was quite less than the discrepancy between land facets.When analysis included plot size only,the value of standard deviation rate was inversely proportional to the increasing plot area(Figures 5 and 6).
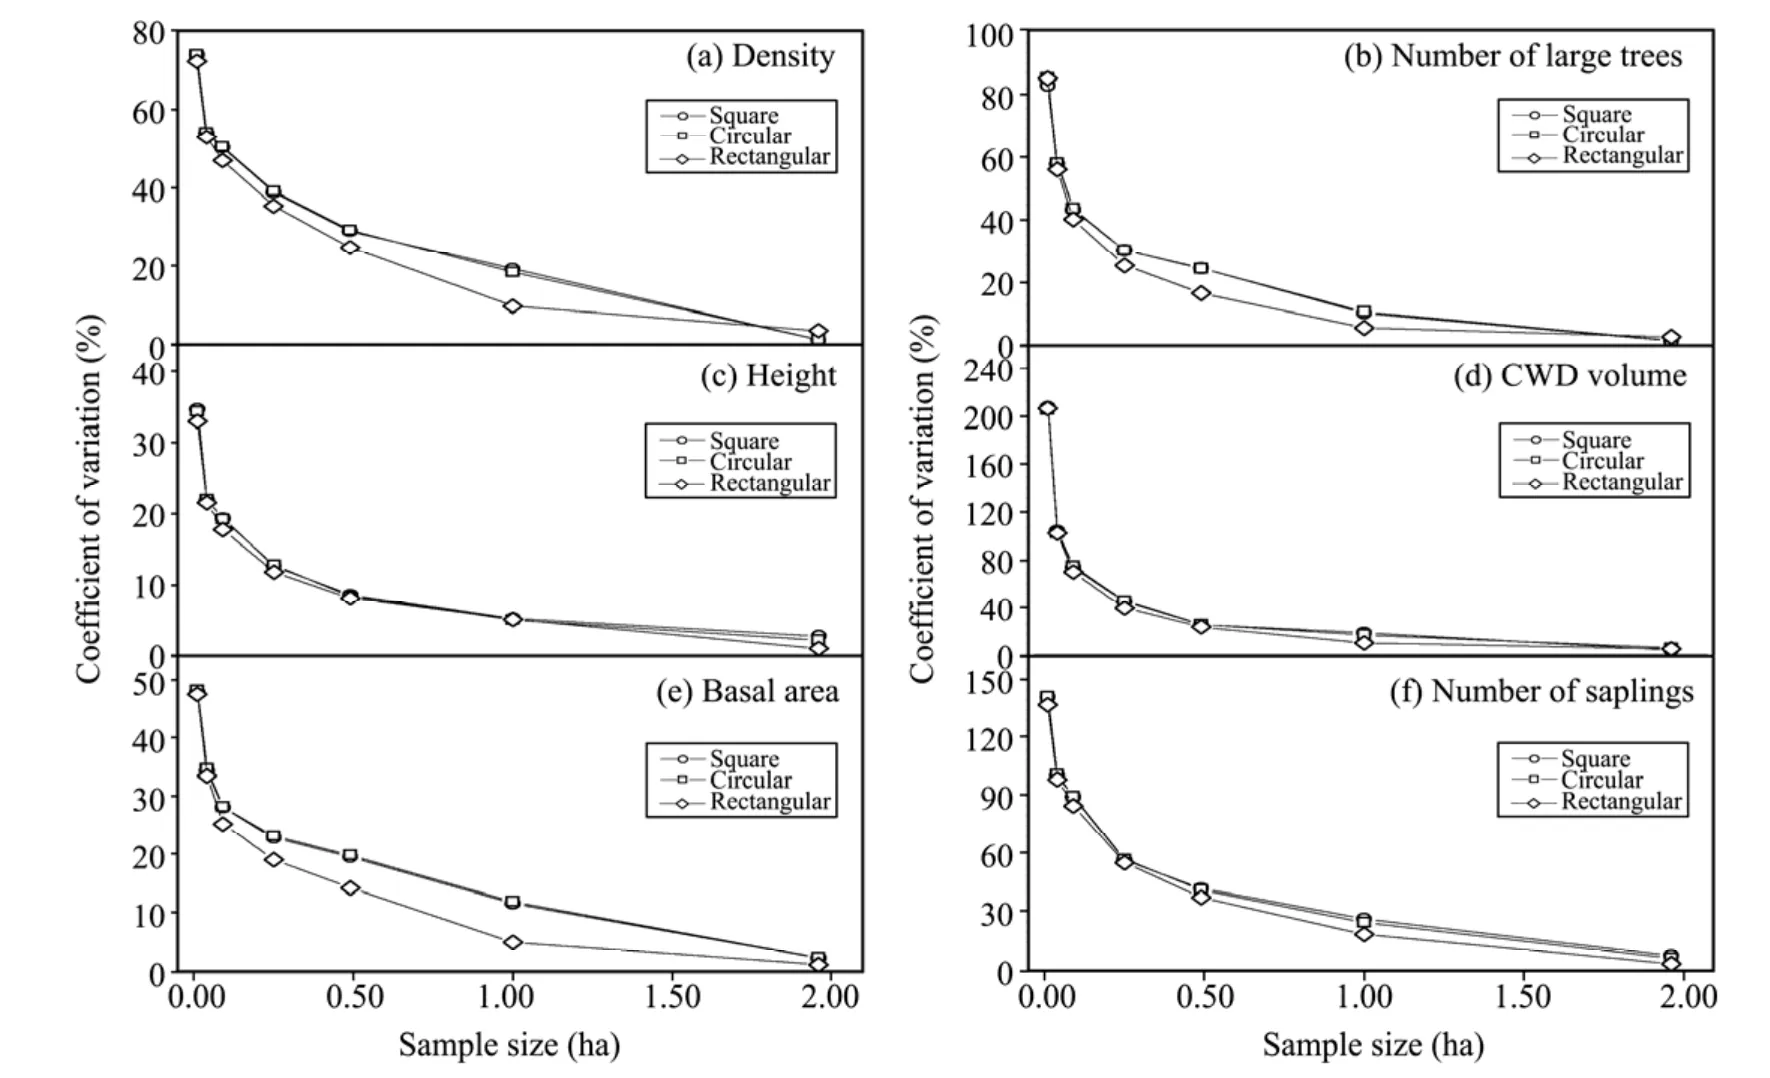
Figure 5 Coefficient of variation(%)in relation to plot size(ha)in the three shapes simulated by Monte Carlo approach in Guaitai stand
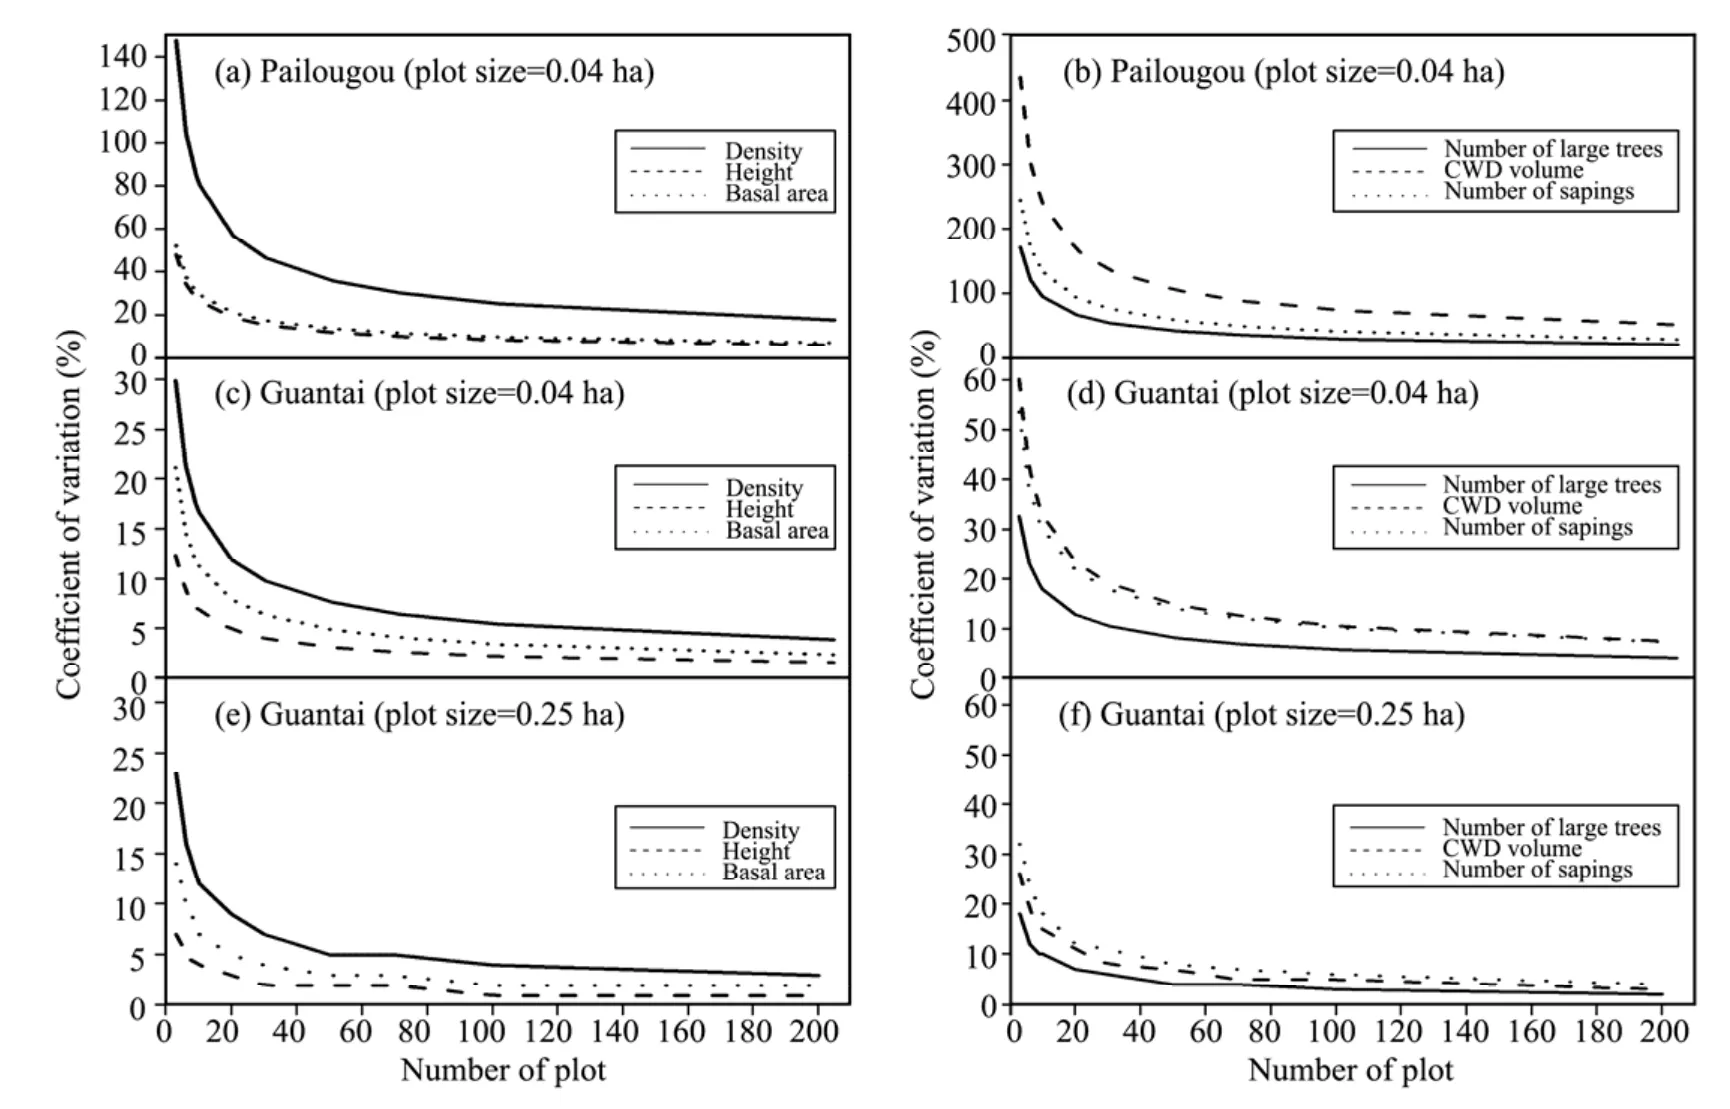
Figure 6 Coefficient of variation of the six stand characteristics with increasing plot number in circular plots
Plot shape,together with a given size,determined the minimum number of plots required to meet a certain accuracy criteria during stand structural inventory based on Equation(4).Generally,measurement of rare features was represented by requiring more plots than that of conventional features,as indicated by larger coefficients of variation,and holding a slight distinction in number of plots due to the difference of plot shapes,especially for sites with high heterogeneity(e.g.,Pailougou in our study).As presented in Table 4,it was palpable that,in any case,the number of plots decreased sharply with increasing plot size,but the total sampled area was synchronously in escalation.
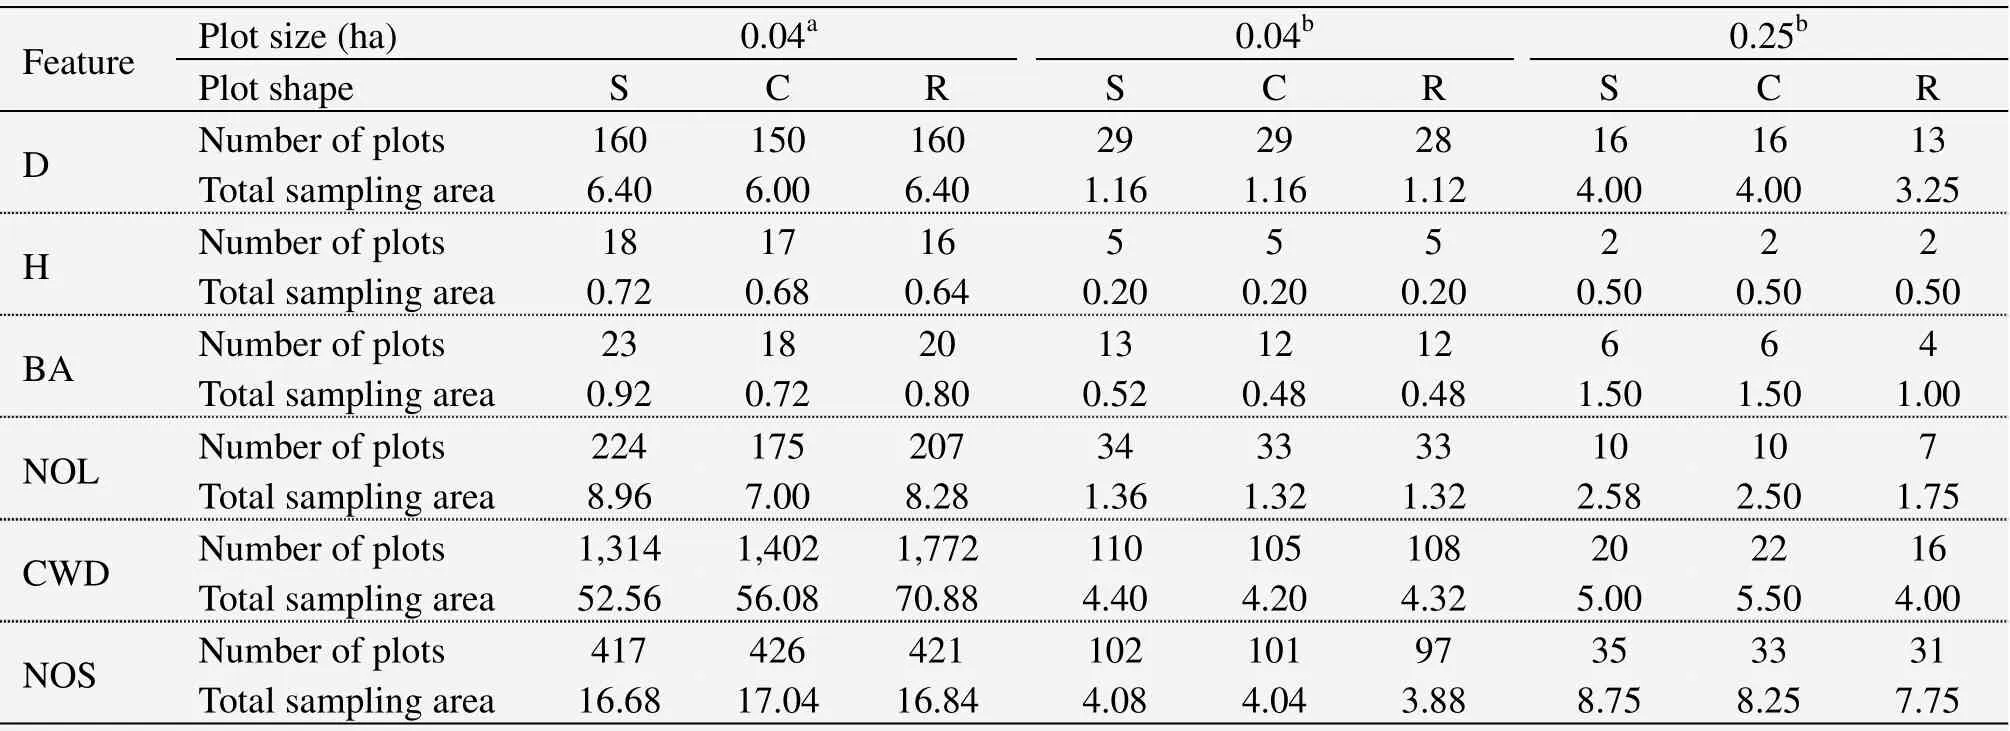
Table 4 Minimal number of plots and sampling area(ha)required for estimating forest structural features for various plot sizes and shapes
4 Discussion
Efforts to adequately capture information on forest habitat structure and diversity must be based on a clear definition of which structural attributes will be measured,because different features often exhibit a great spatial heterogeneity(Bradfordet al.,2008;Bileket al.,2011).As shown in our study,less sampling may be required to obtain a satisfactory inventory(e.g.,the total sampling area for BA measurement in a 0.04 ha plot is only about 6% of that for NOL,Table 4)of conventional features(having relative consistency within-site).However,rare structural characteristics generally exhibit tremendous variability in spatial distribution and values,making it difficult to acquire precise estimates without extensive sampling(Gray,2003;Zenner and Peck,2009).Therefore,this revealed difficulties in using uniform sampling strategy to obtain the structural information of different types.Additionally,it is worth noting that life history of natural stands should be recognized(Samonilet al.,2009;Bradfordet al.,2010);disturbance events,for example,could contribute to an understanding of the stage of forest succession and development which generally determine the condition of stand structures(Bradfordet al.,2008;Králet al.,2010b).The forests in our study experienced extensive selection harvesting during the past 50 years(Heet al.,2010)resulting in a high stand density of saplings and a low proportion of large trees with relatively sparse distribution(Figure 2 and Table 2).
When planning for inventories,forest managers and ecologists often lack the resources to investigate the effects of plot shape on stand structure;in fact,research may be guided by somewhat arbitrary recommendations for sampling design(Kangas and Maltamo,2007).Our results suggest that the degree of influence of plot shape appears to depend upon survey objectives under consideration(i.e.,determined by different statistical metrics).For example,negligible differences were found among different plot shapes if the purpose of study was the evaluations of the"mean" stand structural conditions(Table 3 and Figure 3),which suggested that the existing protocols for sampling with different plot shapes were reasonable when the "representative" characteristics were investigated.However,when habitat diversity and structural complexity were the main objectives,minimum and maximum values differed considerably depending on plot shape used for data collection(Table 2).Further,differences were also present in the number of plots and total sampling area required to meet certain accuracy criteria,especially for rare attributes(Table 4).This outcome might be of great utility;for instance,the selection of plot shapes could affect to some extent the trueness of the habitat range for plant growth and the efficiency of sampling in mountainous stands.Scattered rectangular plots may be more appropriate than other shapes for characterizing structural complexity in stands with relative consistency of environmental conditions,where trees are distributed in clusters,as reported in other studies(Jyrkiet al.,1998;Evans and Viengkham,2001).This can be explained by the expanded area in the direction of the long axis which facilitates the collection of more information on structure.Additionally,for highly heterogeneous sites(e.g.,across different slope positions),the performance of plot shapes(using least plots required)also depends on the particular features evaluated,as indicated by less sampling area based on square-than rectangular-shaped plots for volume of CWD measurement.It is possible that the longer extent for square plot along slope direction(set as the orientation of short axis of rectangular plot,see Section 2.2)enables more snags and fallen dead logs to be encountered.Our results also showed a close consistence in capturing stand structural information for circular and square plots(Figure 3 and Table 3),suggesting that those published data collected from plots in either shape could be made comparison directly as long as the sampling scale was the same.Although quantitative analyses of consuming time for enumeration are lacking,the differences in error estimates stemming from plot shapes are likely more notable than the comparison of gaging effort.
It is well known that the accuracy of assessment increases with plot size(Kelleret al.,2001;Gray,2003;Králet al.,2010a),and total sampling area(Figure 5 and Table 4).The trend of variability is well fitted by the power formy=a·xb(Králet al.,2010a),whereas heterogeneity of stand structural attributes affects this relationship in terms of theaandbcoefficients of the regression models.The prevailing view among researchers is that the effort required to sample a small number of large plots would be less effective than a large number of small plots(Dutilleul,1998;Kelleret al.,2001;Bradfordet al.,2010).However,our results suggest that a plot <0.1 ha could be the most efficient way to sample for conventional stand characteristics,and 0.25 ha or even larger plots may have a greater likelihood of capturing rare structural attributes in temperate subalpine,spruce-dominated natural forests,which are based on the comparison of degrees of variability between the number of plots and total sampling area in neighborhood size.The reason for the divergency between our results and prevailing views mentioned above may be that they had a disregard of the distinction of structural attributes.Additionally,emphasis should be placed on the range of stands inventoried as well as physiographic settings;these could be obtained from existing maps or data from remote sensors.Larger sample plots may be advisable when dealing with altitudinal differences,given that transfer between plots may be more time-consuming than within-plot enumeration(Evans and Viengkham,2001;Bradfordet al.,2010;Králet al.,2010a).
Our results highlight that the spatial clustering of individuals(e.g.,at Guaitai)or the presence of an environmental gradient(e.g.,at Pailougou)produce high variability in stand characteristics.Spatial arrangement of trees in a stand is an important factor to consider when designing sampling strategies,one that could lead to an increased understanding of spatial dependence between trees at different spatial scales(Zenner and Peck,2009).In managed even-aged forests,where individual stems are regularly distributed,well-defined stand characteristics can be adequately described within a single plot(Bileket al.,2011).In contrast,structural units are strongly intermingled across scales in natural forests,and generally result in underlying random(for old-growth stands)or aggregated(for young-growth stands)patterns.Moreover,old-growth forests exhibit significantly more within-stand structural complexity with a dynamic mosaic of patch types in different seral stages than mature and young forests;therefore,relatively larger plot sizes may be necessary to consider for the former cases compared with the later circumstance.Generally,the effect of plot shapes appears to be similar for using different plot sizes in the same stand,while that case is not held across stands with different spatial patterns.Following this perspective,we conclude that spatial pattern analysis cannot be overlooked in sampling design,and is a rough premise one should know before structural attributes classification.
It was beyond the scope of this study to include multi-species analysis of the effort to estimate the sampling efficiency.Existing research showed that sampling required to capture structural variability in less diverse forests(e.g.,in our forests)is likely to be less intensive than that in more diverse ones(Gray,2003).Indeed,if the features of a dominant species are regarded as conventional metrics,while those of a rare species are considered as unconventional,our study results also apply to sampling in more complex natural forests.
5 Conclusions
In this study,we quantified uncertainty of forest landscape structural attributes estimate from effects of sampling protocols based on field measurement and Monte Carlo simulation,and have shown that the options for plot size generated the major influence on the accuracy of evaluation compared to plot shapes.Generally,in spruce-dominated temperate forest landscape,scattered small plots,often <0.1 ha,can be the most efficient way to sample for conventional characteristics measurement;however,to capture rare structural attributes usually needs 0.25 ha or even larger plots to meet a certain accuracy criteria.If the survey purpose of getting information about the extent of forest site conditions is the case,one should take into account the effects of plot shape on investigation outcomes,because there is a striking difference among various shapes in extreme values.Overall,when planning for inventories,sampling protocols should be made on the basis of detailed knowledge over survey objectives,spatial arrangement of trees,and physiographic settings.Acquisition for accurate forest landscape context data can benefit from practical and efficient sampling projections for landscape management and biodiversity conversion.
The authors wish to thank the Academy of Water Resources Conservation Forests in the Qilian Mountains of Gansu Province for providing inventory data of the permanent plot in the Guaitai stand.This work was supported by the Hundred Talents Program of the Chinese Academy of Sciences(No.29Y127D11),the National Natural Science Foundation of China(No.41271524),Natural Science Foundation of Gansu Province(No.1210RJDA015),and Forestry Industry Research Special Funds for Public Welfare Projects(No.201104009-08).
Arevalo JR,Fernadez-Palacios JM,1998.Treefall gap characteristics and regeneration in the laurel forest of Tenerife.Journal of Vegetation Science,9:297–306.DOI:10.2307/3237094.
Besag JE,1977.Comments on Ripley's paper.Journal of the Royal Statistical Society(Series B:Statistical Methodology),39:193–195.
Bilek L,Remes J,Zahradnik D,2011.Managedvs.unmanaged.Structure of beech forest stands(Fagus sylvaticaL.)after 50 years of development,Central Bohemia.Forest Systems,20(1):122–138.
Bradford JB,Birdsey RA,Joyce LA,et al.,2008.Tree age,disturbance history,and carbon stocks and fluxes in subalpine Rocky Mountain forests.Global Change Biology,14:2882–2897.DOI:10.1111/j.1365-2486.2008.01686.x.
Bradford JB,Weishampel P,Smith ML,et al.,2010.Carbon pools and fluxes in small temperate forest landscapes:variability and implications for sampling design.Forest Ecology and Management,259:1245–1254.DOI:10.1016/j.foreco.2009.04.009.
Chang XX,Zhao WZ,Liu H,et al.,2014.Qinghai spruce(Picea crassifolia)forest transpiration and canopy conductance in the upper Heihe River Basin of arid northwestern China.Agricultural and Forest Meteorology,198–199:209–220.DOI:10.1016/j.agrformet.2014.08.015.
Chen G,Hay GJ,Castilla G,et al.,2011.A multiscale geographic object-based image analysis to estimate lidar-measured forest canopy height using Quickbird imagery.International Journal of Geographical Information Science,25:877–893.DOI:10.1080/13658816.2010.496729.
Du J,He ZB,Yang JJ,et al.,2014.Detecting the effects of climate change on canopy phenology in coniferous forests in semi-arid mountain regions of China.International Journal of Remote Sensing,35(17):6490–6507.DOI:10.1080/01431161.2014.955146.
Dutilleul P,1998.Incorporating scale in ecological experiments:study design.In:Peterson DL,Parker VT(eds.).Ecological Scale—Theory and Applications.New York:Columbia University Press,pp.369–386.
Evans TD,Viengkham OV,2001.Inventory time-cost and statistical power:a case study of a Lao rattan.Forest Ecology and Management,150:313–322.DOI:10.1016/S0378-1127(00)00589-2.
Gray A,2003.Monitoring stand structure in mature coastal Douglas-fir forest:effect of plot size.Forest Ecology and Management,175:1–16.DOI:10.1016/S0378-1127(02)00078-6.
Gray L,He FL,2009.Spatial point-pattern analysis for detecting density-dependent competition in a boreal chronosequence of Alberta.Forest Ecology and Management,259:98–106.DOI:10.1016/j.foreco.2009.09.048.
He ZB,Zhao WZ,Liu H,et al.,2010.Successional process ofPicea crassifoliaforest after logging disturbance in semiarid mountains:a case study in the Qilian Mountains,northwestern China.Forest Ecology and Management,260:396–402.DOI:10.1016/j.foreco.2009.09.048.
He ZB,Zhao WZ,Liu H,et al.,2012.Effect of forest on annual water yield in the mountains of an arid inland river basin:a case study in the Pailougou catchment on northwestern China's Qilian Mountains.Hydrological Processes,26:613–621.DOI:10.1002/hyp.8162.
Holeksa J,Saniga M,Szwagrzyk J,et al.,2007.Altitudinal variability of stand structure and regeneration in the subalpine spruce forests of the Pol'ana biosphere reserve Central Slovakia.European Journal of Forest Research,126:303–313.DOI:10.1007/s10342-006-0149-z.
Holeksa J,Saniga M,Szwagrzyk J,et al.,2009.A giant tree stand in the West Carpathians—an exception or a relic of formerly widespread mountain European forests? Forest Ecology and Management,257:1577–1585.DOI:10.1016/j.foreco.2009.01.008.
Hyde P,Dubayah R,Walker W,et al.,2006.Mapping forest structure for wildlife habitat analysis using multi-sensor(LiDAR,SAR/InSAR,ETM+,Quickbird)synergy.Remote Sensing of Environment,102:63–73.DOI:10.1016/j.rse.2006.01.021.
Jung J,Kim S,Hong S,et al.,2013a.Effects of national forest inventory plot location error on forest carbon stock estimation usingk-nearest neighbor algorithm.ISPRS Journal of Phtogrammetry and Remote Sensing,81:82–92.DOI:10.1016/j.isprsjprs.2013.04.008.
Jung M,Tautenhahn S,Wirth C,et al.,2013b.Estimating basal area of spruce and fir in post-fire residual stands in Central Siberia using Quickbird,feature selection,and Random Forests.Procedia Computer Science,18:2386–2395.DOI:10.1016/j.procs.2013.05.410.
Jyrki J,Vanha I,Tina T,1998.Optimal sample and plot size for inventory of field and ground layer vegetation in a mature Myrtillus-type boreal spruce forest.Annales Botanici Fennici,35:191–196.
Kadavul K,Parthasarathy N,1999.Plant biodiversity and conservation of tropical semi-evergreen forest in the Shervarayan hills of Eastern Ghats,India.Biodiversity and Conservation,8:421–439.
Kangas A,Maltamo M,2007.Forest inventory:methodology and applications.Dordrecht:Springer.
Keller M,Palace M,Hurtt G,2001.Biomass estimation in the Tapajos National Forest,Brazil Examination of sampling and allometric uncertainties.Forest Ecology and Management,154:371–382.DOI:10.1016/j.foreco.2010.09.020.
Král K,Janík D,Vr?ka T,et al.,2010a.Local variability of stand structural features in beech dominated natural forests of Central Europe:implications for sampling.Forest Ecology and Management,260:2196–2203.DOI:10.1016/j.foreco.2010.09.020.
Král K,Vr?ka T,Hort L,et al.,2010b.Developmental phases in a temperate natural spruce-fir-beech forest:determination by a supervised classification method.European Journal of Forest Research,129:339–351.DOI:10.1007/s10342-009-0340-0.
Kupfer JA,Kirsch SW,1998.Heterogeneity of forest characteristics in primary and secondary forest stands on the third Chickasaw loess bluff,Tennessee.Physical Geography,19:35–54.
Laumonier Y,Edin A,Kanninen M,et al.,2010.Landscape-scale variation in the structure and biomass of the hill dipterocarp forest of Sumatra:implications for carbon stock assessments.Forest Ecology and Management,259:505–513.DOI:10.1016/j.foreco.2009.11.007.
Li LF,Wang JF,Cao ZD,et al.,2008.An information-fusion method to identify pattern of spatial heterogeneity for improving the accuracy of estimation.Stochastic Environmental Research and Risk Assessment,22:689–704.DOI:10.1007/s00477-007-0179-1.
Li XX,Liu XD,Zhao WJ,2013.Community structure of a dynamical plot ofPicea crassifoliaforest in Qilian Mountains,China.Journal of Desert Research,33(1):94–100.DOI:10.7522/j.issn.1000-694X.2013.00013.
Lindenmayer DB,Cunningham RB,Donnelly CF,et al.,2000.Structural features of old-growth Australian montane ash forests.Forest Ecology and Management,134:189–204.DOI:10.1016/S0378-1127(99)00257-1.
Liu XM,2012.Modeling potential distribution and spatial distribution biomass C stock of Qinghai spruce(Picea Crassifolia)in Qilian Mountains.Doctor thesis,Gansu Agricultural University,Lanzhou,Gansu,China.
L?hmus A,Kraut A,2010.Stand structure of hemiboreal old-growth forests:characteristic features,variation among site types,and a comparison with FSC-certified mature stands in Estonia.Forest Ecology and Management,260:155–165.DOI:10.1016/j.foreco.2010.04.018.
Morio J,Pastel R,Le Gland F,2010.An overview of importance splitting for rare event simulation.European Journal of Physics,31:1295–1303.DOI:10.1088/0143-0807/31/5/028.
Rempel RS,Kushneriuk RS,2003.The influence of sampling scheme and interpolation method on the power to detect spatial effects of forest birds in Ontario(Canada).Landscape ecology,18:741–757.
Ripley BD,1977.Modeling spatial patterns.Journal of the Royal Statistical Society(Series B:Statistical Methodology),39(2):172–212.
Rozas V,2006.Structural heterogeneity and tree spatial patterns in an old-growth deciduous lowland forest in Cantabria,northern Spain.Plant Ecology,185(1):57–72.DOI:10.1007/s11258-005-9084-1.
Salako VK,Kaka? RLG,Assogbadjo AE,et al.,2013.Efficiency of inventory plot patterns in quantitative analysis of vegetation:a case study of tropical woodland and dense forest in Benin.South Forests,75:137–143.DOI:10.2989/20702620.2013.816232.
Samonil P,Antolik L,Svoboda M,et al.,2009.Dynamics of windthrow events in a natural fir-beech forest in the Carpathian Mountains.Forest Ecology and Management,257:1148–1156.DOI:10.1016/j.foreco.2008.11.024.
Stockdale MC,Wright HL,1996.Rattan inventory:determining plot shape and size.In:Edwards DS,Booth WE,Choy SC(eds.).Tropical Rainforest Research—Current Issues.The Netherlands:Kluwer Academic Publishers,pp.523–533.
Storck L,2011.Partial collection of data on potato yield for experimental planning.Field Crop Research,121:286–290.DOI:10.1016/j.fcr.2010.12.018.
Vedris M,Jazbec A,Frntic M,et al.,2009.Precision of structure elements' estimation in a Beech-Fir stand depending on circular sample plot size.Sumarski List,133:369–379.
Von Storch H,Zwiers FW,1999.Statistical Analysis in Climate Research.Cambridge,UK:Cambridge University Press.
Wittmann F,Junk WJ,2003.Sapling communities in Amazonian white-water forests.Journal of Biogeography,30:1533–1544.DOI:10.1046/j.1365-2699.2003.00966.x.
Wulder M,1998.Optical remote-sensing techniques for the assessment of forest inventory and biophysical parameters.Progress in Physical Geography,22:449–476.DOI:10.1177/030913339802200402.
Xiao XY,Gertner G,Wang GX,et al.,2004.Optimal sampling scheme for estimation landscape mapping of vegetation cover.Landscape Ecology,20:375–387.DOI:10.1007/s10980-00 4-3161-z.
Yamakura T,Hagihara A,Sukardjo S,et al.,1986.Aboveground biomass of tropical rain forest stands in Indonesian Borneo.Vegetatio,68(2):71–82.
Youngblood A,Max T,Coe K,2004.Stand structure in eastside old-growth ponderosa pine forests of Oregon and northern California.Forest Ecology and Management,199:191–217.DOI:10.1016/j.foreco.2004.05.056.
Zar JH,1996.Biostatistical Analysis,3rd Ed..Prentice-Hall,Upper Saddle River,New Jersey.
Zenner EK,Peck JE,2009.Characterizing structural conditions in mature managed red pine:spatial dependency of metrics and adequacy of plot size.Forest Ecology and Management,257:311–320.DOI:10.1016/j.foreco.2008.09.006.
 Sciences in Cold and Arid Regions2015年3期
- Sciences in Cold and Arid Regions的其它文章
- The characteristics of oasis urban expansion and drive mechanism analysis:a case study on Ganzhou District in Hexi Corridor,China
- Characterizing changes in ecosystem service values in China's eastern Loess Plateau
- Elemental composition and its environmental significance for the varicolored hills in the northern foothills of the Qilian Mountains of Sunan Yugur Autonomous County,China
- Aesthetic evaluation of yardang landforms landscape:the Dunhuang Yardang National Geo-park example
- Biomass and water partitioning in two age-related Caragana korshinskii plantations in desert steppe,northern China
- Comparative studies on leaf epidermal micromorphology and mesophyll structure of Elaeagnus angustifoliaL.in two different regions of desert habitat