
Microseismic monitoring and numerical simulation on the stability of high-steep rock slopes in hydropower engineering
2015-10-19 06:57:32ChunTngLinhongLiNuwenXuKe
Chun’n Tng,Linhong Li,Nuwen Xu,Ke M
aSchool of Civil Engineering,Dalian University of Technology,Dalian,116024,China
bState Key Laboratory of Hydraulics and Mountain River Engineering,Sichuan University,Chengdu,610065,China cInstitute of Mechanics,Chinese Academy of Sciences,Beijing,100190,China
1.Introduction
Among the stability analysis methods for geotechnical engineering,the development of slope stability analysis method is the most remarkable.Especially,the stability of high-steep rock slopes has always been a problem that many researchers have been trying to solve but not satisfactorily solved yet.With the development of computers,a number of numerical methods have been proposed and widely applied to slope stability analysis,such as finite difference method(FDM), finite element method(FEM),boundary element method(BEM),element free method,meshless method,discrete element method(DEM),discontinuous deformation analysis(DDA)method,fast Lagrange interpolation method,and manifold method.Among these methods,the FEM is a relatively mature numerical method.Its application to stability analysis of rock and soil slopes can be dated back to 1967 and it is also one of the most widely used numerical methods at present.Although it cannot well deal with the problems of large deformation and discontinuous displacement,the FEM has a rigorous theory system that considers the stress-strain relationship of sliding mass and can simulate the interaction between the sliding mass and supporting structure.The FEM also has great advantages in coupling of deformation and seepage of sliding mass.The slope stability analysis based on FEM can be generally divided into three categories.The first is the slip surface stress analysis(SSA),which combines the limit equilibrium theory and the FEM results(Duncan,1996).Based on the finite element stress analysis,the most probable slip surface can be determined by various optimization methods.The computation process is simple and practical.However,the theoretical defects also exist,i.e.the SSA is unable to reflect the region where slip most probably occurs and the evolution process of failure.The second is the strength reduction method(SRM),which is a direct method proposed by Zienkiewicz et al.(1975).Its fundamental principle is to combine the strength reduction concept,the limit equilibrium principle and the finite element principle.First,the slope strength parameters are reduced and a new pair of strength parameters is obtained as the input parameters for FEM calculation.The corresponding strength reduction coefficient is the minimum factor of safety.A great amount of research work on this method has been conducted(Dawson et al.,1999;Lian et al.,2001;Zheng and Zhao,2004).The third method based on FEM is the centrifugal loading method(or the gravity increase method)(Swan and Seo,1999;Xu and Xiao,2007;Li et al.,2009).The principle of the centrifugal loading method is opposite to that of the SRM.The shear strength parameters of rock or soil,c and φ,remain constant.Finite element analysis is performed with increasing gravitational acceleration g until the critical failure state is reached.The ratio between the corresponding gravitational acceleration glimand the real gravitational acceleration g0(g0is usually taken as 9.81 m/s2)is the factor of safety of the slope.Increasing the gravitational acceleration is in fact equivalent to increase of rock or soil gravity.Therefore,this method is named as the centrifugal loading method or the gravity increase method.
Besides numerical analysis,in situ monitoring and analysis are also necessary for evaluating slope stability.Due to the complexity in geological conditions and various influencing factors,stability analysis of rock slopes has to rely on monitoring techniques for verification.Currently,the traditional monitoring devices and methods for slopes include:(1)Slope surface geodetic survey(e.g.theodolite,level gauge,range finder,total station);(2)GPS monitoring;(3)Displacement meter;(4)Infrared remote monitoring method;(5)Laser micro-displacement monitoring;(6)Synthetic aperture radar interferometry(e.g.SAR interferometry,INSAR);(7)Time-domain reflectometry(TDR)technique;(8)Borehole inclinometer,anchor dynamometer and pressure monitoring device inside the slope;(9)Acoustic emission(AE)and microseismic monitoring technique.Among these monitoring devices and methods mentioned above,items(1)-(7)are mainly used to monitor the slope surface,and items(8)and(9)mainly to monitor the sliding mass at a certain depth.With the development of science and technology,the non-contact,fully remote-controlled,highly intelligent,high-precision integrated monitoring techniques from slope surface to interior are the future development trend for slope monitoring.
As a tempo-spatial dynamic monitoring method,the microseismic(AE)monitoring technique can capture the damage or microcracks initiated in the rock mass in time,which has been gradually applied to qualitative analysis of slope stability in recent years(Dixon and Spriggs,2007;Cheon et al.,2011).The microseismic monitoring technique is currently used to understand the slope deformation characteristics and microseismicity parameters,e.g.the relationship between major microseismic events,the accumulative events and energy rate,and todetermine the position of the potential slip surface(zone).For example,the microseismic monitoring technique was applied to high slopes of Guanyin Mountain in 1983.Both displacement and groundwater level were monitored for prediction of slope stability(Hou,1989).In mountainous Switzerland,microseismic monitoring networks have been installed since 2001 in a number of mountains where potential landslides may occur.The monitoring network was provided by Swiss Seismological Service,with frequency in the range between 1 Hz and 200 Hz(Eberhardt et al.,2004;Spillmann et al.,2007);For Suusammyr road slopes in Kyrgyzstan,a microseismic monitoring network with the frequency ranging from 10 Hz to 100 Hz was adopted to predict the landslide mode(Arosio et al.,2009).The microseismic monitoring technique has been widely applied in highway slopes in recent years in developed countries such as USA and Japan(Shiotani,2006).More applications to slope hazards prediction for open mines in USA,Canada,South Africa and Australia have been reported(Glazer and Hepworth,2004;Yang and Hou,2008).As for slope monitoring for water resources,hydropower and reservoir bank,a landslide of 40-70 million cubic meter in volume was estimated at the Aaknes reservoir bank in Norway.In order to provide early warning information for landslide hazards,a microseismic monitoring system with 8 three-phase transducers was installed in 2005 to detect the microseismic events in real time during the progressive deformation process(Ganer?d et al.,2008).In China,microseismic monitoring was implemented for the high slope of the double-line five-stage ship lock of the Three Gorges Project,the Mabukan high slope,the left bank slope of Jinping I Hydropower Station,and the right bank slope of Dagangshan Hydropower Station,etc.(Yan et al.,1998;Li and Wang,2001;Wan et al.,2003;Xu et al.,2011;Ma et al.,2013).
For any sources triggering landslides(including excavation unloading,cavern excavation in slope,blasting,grouting,and extreme environment during the service lifetime,such as earthquake,rainstorm,rapid rise or drop of reservoir water level),the essence of potential slip surface formation process is a process of damage initiation and accumulation.It has been recognized that the landslide evolution is a process of continuous to discontinuous deformation or even separation.Therefore,the slope stability is essentially a dynamic stability state,i.e.during excavation and service lifetime of slope,the physico-mechanical properties of rock masses within the slip surface zone always change dynamically.Therefore,the factor of safety of a slope varies with elapsed time(Zhou et al.,2004;Li and Qian,2010).The meaning of“dynamic stability”includes two aspects.One is the dynamic development of an objective target.Its stability has to be traced and monitored so as to provide objective conditions for data acquisition and analysis of“interactive monitoring and simulation”.The other is the objective understanding of the dynamic change of slope in the entire service lifetime.The boundary condition and parameters for simulation need to be modified constantly and thus the stability assessment is dynamic.
The meaning of dynamic stability provides a good opportunity for combination of microseismic monitoring and numerical modeling.If a three-dimensional(3D)geomechanical model is built for numerical analysis of slope stability,the reliability and applicability of the model and corresponding parameters should be verified by real physical information.If the slope slip surface is identified only by AE monitoring,the evolution process of slip surface cannot be represented elaborately either.In this study,the intrinsic effects and relationship between the stress field,development of the slip surface,and microseismic information(tempospatial coordinates,source size,energy dissipation and other physical information)of 3D geomechanical model are considered.The numerical and monitoring methods are integrated and supplementary for each other.The numerical analysis can help to understand the characteristics and modes of microseismic events monitored.The monitored microseismic physical information can be mutually used for modification of sensitive parameters and calibration of numerical model.Taking the left bank slope of Jinping I Hydropower Station and the right bank slope of Dagangshan Hydropower Station for examples,microseismic monitoring and numerical simulations are performed for slope stability analysis in this study.
2.Slope stability analysis method based on microseismic monitoring and numerical simulation
2.1.Principle of microseismic monitoring
The failure of rock element means that a through-running failure surface is formed in the element and the element loses its bearing capacity.The global failure of rock mass means that the failure surface of each rock element coalesces and the overall structure cannot function properly any more.According to the deformation and failure patterns of rock elements,Zhu and Cheng(2000)and Xie et al.(2004,2005)suggested that the energy release is the internal driving force triggering sudden failure of rock elements.The global failure criterion for rock element was then established based on the releasable strain energy in the rock element.In this criterion,part of the work exerted on rock mass by external forces is transformed to the dissipated energy Udin the medium,leading to gradual loss of rock strength.The other part of the work is transformed to gradually increasing releasable strain energy Ue.When Ueaccumulates to a certain extent,it tends to be released along a direction which is easy for energy release.Once energy release in this direction reaches the energy required for rock element failure,the rock element failure occurs.
During the rock damage process,with collapses of voids or propagation of microcracks,the strain energy stored in the rock mass is released rapidly in the form of elastic wave,leading to infrasonic,sonic or ultrasonic waves,i.e.AE or microseismic phenomena.The AE parameters,such as amplitude and frequency,can reflect the quantity,size,location and energy dissipation of microcracking in rock,which are related to the degree of rock damage.The microseismic monitoring technique for slope is a technique to monitor the stability of engineering rock masses by utilizing the elastic waves emitted due to excavation or construction disturbances(Blake et al.,1975;Tang et al.,2010;Cheon et al.,2011;Xu et al.,2012,2014).Elastic energy is released during microcracking,resulting in formation of elastic waves.Every microseismic signal contains abundant information on the state change in the rock mass and can be detected by the sensors installed in the slope within an effective range.The information on elastic waves can be captured by multiple sensors.The time,location and property of microcracking in rock mass,i.e.the three key elements of“time,space and intensity”in geophysics,can be obtained by back analysis.Based on the magnitude,concentration degree,and intensity of microcracking,the development trend of macroscopic failure in rock mass can be deduced.This is the core idea of the microseismic monitoring technique.
However,it is not enough to only utilize the single “monitoring”function of the microseismic monitoring for tempo-spatial positioning of rock mass failure in slope.Besides the tempo-spatial coordinates,abundant seismic source information can be obtained by AE/microseismic monitoring,such asmagnitude,moment magnitude,amount and density of energy,static and dynamic stress drop,spatial error,vibration frequency,and vibration moment associated with microcracking in rock mass.The abundant“real physical information of rock mass”can be utilized for data integration and more in-depth studies:(1)The mechanical parameters near the zone of slipping surface of rock slope can be calibrated and modified in real time according to the tempo-spatial coordinates of the damage elements,amount and density of energy release,and data related to microcracking;(2)Based on the tempospatial coordinates of damaged elements,the modified mechanical parameters of the slip surface can be used in the geomechanical model of slope so as to back-analyze the real-time factorof safety of slope(as the damage caused by the triggering sources accumulates,the mechanical properties of rock mass in the range of slip surface and key structural planes may deteriorate gradually).However,this is rarely reported in previous stability analysis of rock slopes.
Therefore,from the viewpoint of monitoring technology for rock mass instability associated with the current development of high technology,various remote,intelligent and high-precision monitoring techniques used on the slope surface or the interior have been enhanced.Especially,the microseismic monitoring data are the indicators of slope failure caused by rock mass fracture and damage.The entire loading history and the damage evolution process of rock masses can be monitored and located in real time.However,it can only provide limited amount of data.Processing and interpretation of the data require support by the damage mechanics and wave dynamics theories.Accordingly,the inherent relationship between the rock mass damage evolution induced by stress accumulation and the microseismic events can be established.The precursory information of microseismic events in rock mass can be explored and the prediction of slope instability can be realized.
From the viewpoint of the damage theory,the numerical approach based on the damage theory has its advantage in providing comprehensive evaluation data and mechanism explanation for slope stability.However,the parameters based on the monitoring data may be slightly different from the actual ones.The current damage evolution model for rock slope and the characterization method for mechanical parameters need to be verified by monitored data.Therefore,the mechanism of the damage and failure zones in rock slope and the characterization method for strength parameters shall be studied.The mechanical model for rock mass damage evolution can be established based on back analysis of microseismic monitoring information.In this way,the numerical model and parameters are obtained on an objective basis and the microseismic monitoring and analysis can have a sound mechanical foundation.
2.2.Evaluation method for dynamic slope stability based on microseismic monitoring and numerical modeling
For a microseismic event,the strain energy UT,released by fract
ure and slip in rock,is the total energy consumed by heat and the release of seismic elastic wave.The ratio between the seismic energy U and the total energy released during microcracking is defined as the seismic efficiency,i.e.η=U/UT.Mcgarr(1984)calculated the seismic efficiency of a gold mine in South Africa by comparing the total energy release UTduring roadway excavation and the radiation energy recorded by the microseismic monitoring system,which was about 0.24%.Cai et al.(1998)analyzed microseismic events triggered by roadway excavation and proposed a tensile failure model for calculating the size of seismic source for microcracking.They also studied the size of seismic source,assuming the seismic efficiencyηbeing 0.1 or 1.The abovementioned seismic efficiency is based on the back-calculated total energy consumption for microcracking by using the radiation energy recorded by microseismic monitoring.In this study,this method is employed to calculate the seismic efficiency of the left bank slope of Jinping I Hydropower Station.The energy is first calculated by using the seismic source parameters recorded by the microseismic monitoring system during blasting tests.The seismic efficiency is the ratio between the calculated energyand the energy generated by the actual amount of explosives at the blasting points.The percentage of the blasting energy calculated according to the data recorded by the microseismic monitoring system in the total actual energy release at the blasting point can be determined.It is assumed that all the blasting energy is transformed into the energy of elastic wave in rock masses,and the energy dissipation,such as heat or radiation energy,which may occur during blasting,is not considered.In addition,it is noted that the changes in strain energy due to unloading are not incorporated in this study.More studies along this line are needed to more accurately calculate energy variations for damaged elements.
If the radiation energy for the damaged rock elements within the seismic source range recorded by the microseismic monitoring system is represented byΔU,the total energyΔU generated by the actual damage of rock elements(corresponding to single microseismic event)can be written as

How to back-analyze the actual rock damage based on the radiation energy obtained by the microseismic monitoring was rarely reported in the literature.In this paper,attempts are made for some exploratory study.Since the rock mechanics parameters in the back calculation of elastic strain energy based on the microseismic monitoring data are taken as the initial elastic modulus E0and the Poisson’s ratio ν(i.e.no rock damage occurs before the microseismic event,which is an ideal assumption),the total releasable energy in the rock element,with consideration of the microseismic damage effect,can be obtained by the following equation:whereσ1,σ2and σ3are the major,intermediate and minor principal stresses,respectively.
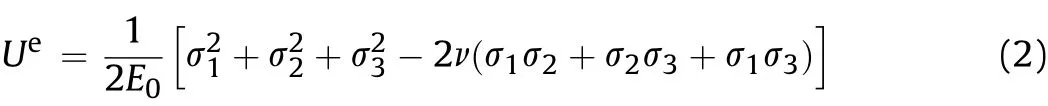
The damage variable D of rock element within the seismic source range is the ratio between the back-analyzed energyΔU distributed in the element based on seismic radiation energy and the total releasable strain energy Ue(the releasable energy per unit volume):

Hence,in consideration of microseismic energy dissipation,the elastic modulus Erand the cohesion crof rock element can be expressed by
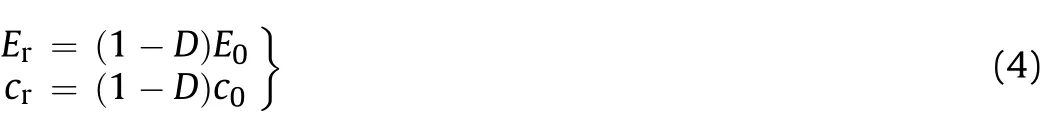
where c0is the initial cohesion of rock element.Since the stiffness of the rock element is reduced by the damage evolution,the cohesion will be affected subsequently.The cohesion of each element is assumed to follow the similar degradation law as stiffness in this study.
It is assumed that the mechanical parameters of rock mass deteriorate proportionally to the damage variable D during numerical simulations when considering the microseismic damage effect.The following assumptions are made for the damage process of rock element:
(1)Macroscopic rock mass(composed of lots of individual rock elements)is heterogeneous,while each individual rock element is homogeneous and isotropic.The effect of energy dissipation during rock fracturing on the mechanical parameters of rock mass is considered.
(2)The energy dissipation only affects the elements within its influencing range in the 3D numerical model(such as finite element model).The corresponding finite element is automatically searched according to the 3D coordinates of microseismic events.The seismic energy is evenly distributed for elements within the seismic source range.The mechanical parameters of rock elements are modified based on the energy damage criterion as mentioned in Eq.(4).
(3)The damage of rock elements within the seismic source range recorded by the microseismic monitoring system is brittle failure.
Based on the above analysis and assumptions,the analysis process of slope stability considering real-time damage in rock masses is described as follows:
(1)Establish an one-to-one relationship between the 3D finite element model and spatial coordinates of microseismic events and ensure that the spheres representing microseismic events are reflected in the 3D model.
(2)The parameters of seismic source information for microseismic events,such as spatial coordinates,amount of energy dissipation,and seismic magnitude,are extracted by identification and analysis of microseismic signals.
(3)The modified mechanical parameters of damaged rock masses is imported to the 3D finite element model for back analysis so as torealize the 3D back analysis of rock slope stability based on microseismic monitoring.Since the microseismic monitoring data are collected in real time,they are continuously updated and the mechanical parameters of 3D finite element model can be modified in real time.
In this way,the slope stability analysis method based on microseismic monitoring and numerical simulation is implemented.A flow chart for a dynamic stability analysis of the rock slope considering microseismic damage effects is shown in Fig.1.
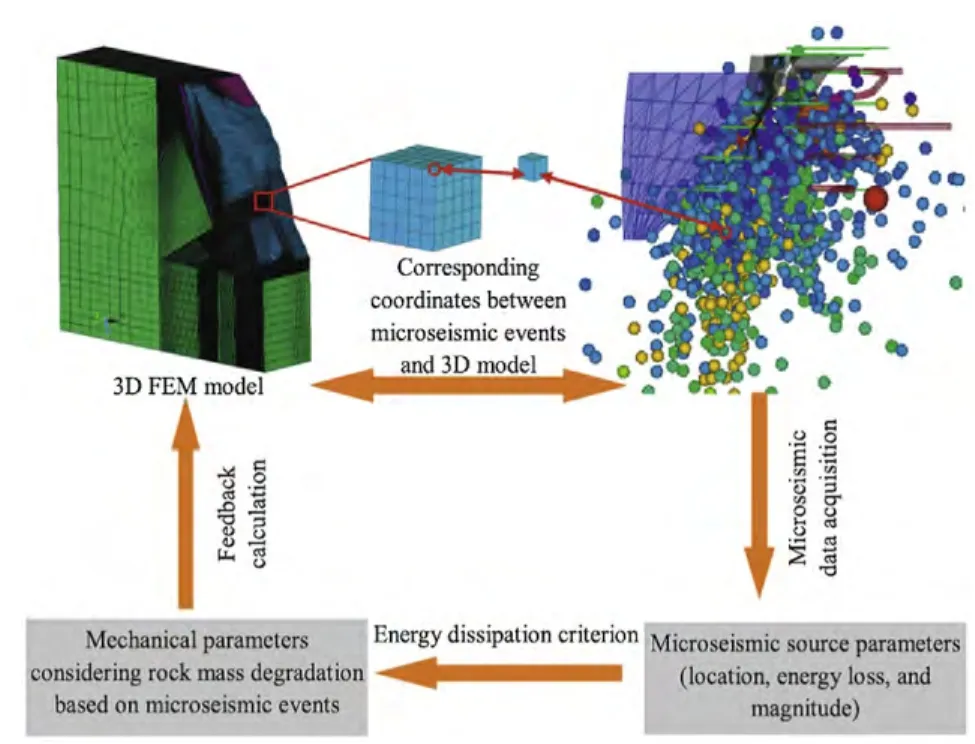
Fig.1.Flow chart of dynamic stability analysis of rock slope.
3.Case studies of slope stability analysis
3.1.Stability analysis of the left bank slope of Jinping I Hydropower Station
The project site of Jinping I Hydropower Station is characterized by high mountains and steep slopes.Complex geological conditions,such as deep fractures,low-velocity relaxed rock masses,lamprophyre(X)and faults f2and f5,exist in the left bank slope.The left bank slope consists of thick to extremely thick metamorphic sandstone intercalated with thin slate of the third member of Zagunao group above elevation 1800 m and marble of the second member with predominantly moderately thick structures and thick block structures below elevation 1800 m.The weak structural planes in the slope are mainly faults f2,f5,f8,f42-9,the inter-layer squeezed fault zone and lamprophyre(X).Marble below elevation 1800 m in the cut slope mainly consists of fresh rock masses without unloading.Only a small amount of weathered and unloaded rocks exists near the river.Most sandy slate above elevation 1800 m is slightly unloaded rock mass,deformed rock mass with tensile cracks or toppling rock mass.The geological map of the project area and the profile of the river valley are shown in Fig.2(Song et al.,2010).
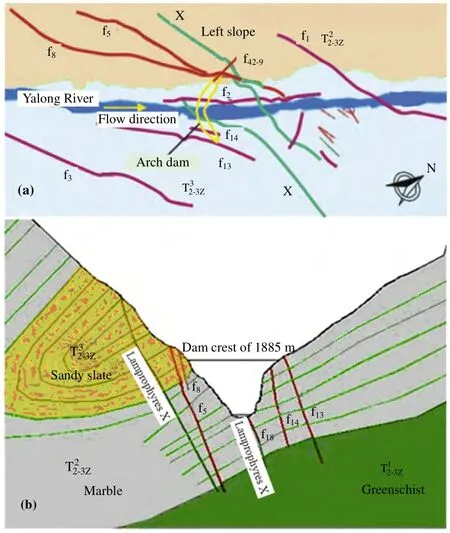
Fig.2.The geological map of dam site at Jinping I Hydropower Station(Song et al.,2010).(a)Geological map of the project area,and(b)Cross-sectional profile of the Yalong River valley.
3.1.1.Microseismic monitoring system for the left bank slope of Jinping I Hydropower Station
In order to conduct real-time monitoring and analyze the microseismic event of deep rock masses in the left bank slope,a microseismic monitoring system,manufactured by ESG Solutions,Canada,was installed in June 2009.The monitoring system mainly consists of the Hyperion digital signal processing system,the Paladin digital data acquisition system,acceleration sensors,optical cables,a modem for data communication and 3D visualization software MMS-View based on remote network transmission.Twenty eight uniaxial accelerometers(sensors shown in Fig.3)were used in this slope.The dominant frequency range of the sensor is 50 Hz-10 kHz(ESG Solutions,2006).The 28-channel microseismic monitoring system covers a range off400m×400 m×600 m in the left bank slope(Fig.3).The 24 h continuous monitoring on microseismic events due to unloading of deep rock masses can be achieved by the sensors distributed at 5 elevations in the slope.The sensors were installed in drainage tunnels in the left bank slope at 5 elevations and distributed spatially as an array.In details,a borehole was drilled at an angle of 70°upward on the vertical tunnel wall at 2.5 m above the invert of drainage tunnel.The borehole diameter was 50 mm,and the depth was about 3 m.The front tip of the sensor was fixed at the end of borehole by resin.The acceleration sensor was in point-to-point contact with the intact rock.Hence,it can receive elastic wave signals from all directions in the slope body.
Using this microseismic monitoring system,a great number of seismic source parameters(i.e.location,seismic moment,energy,ratio of S-and W-wave energy,seismic source size,stress drop,etc.)were determined by the ESG data acquisition software(ESG Solutions,2006).Wave filtering was performed on the monitoring data so as to provide complete waveform and wave spectrum.The type of microseismic events was automatically identified.Noises were removed by wave filtering,threshold setting and bandwidth detection.
After the monitoring system was installed,positioning accuracy and waveform analyses were performed,mainly including the following aspects.
(1)Determination of wave velocity for the monitoring system
Seven fixed-position blasting tests were conducted at the elevations of 1785 m and 1829 m within the sensor array range in the left bank slope.The basic parameters of the monitoring system were adjusted and determined.The blasting tests were conducted in the drainage tunnels at the two elevations.A 3 m deep borehole was drilled perpendicularly to the tunnel wall.No.2 emulsion explosive for rock was adopted and detonated by high-current detonation.The charge in each hole was 300 g.In order to avoid energy loss,the borehole was filled by discarded nylon bags.According to the data provided by HydroChina Chengdu Engineering Corporation(HCEC),the elastic wave velocity of rock in the study area is 3500-5000 m/s.The average wave velocities for P-and S-waves in rock were set as 3900 m/s and 2250 m/s,respectively,for the monitoring system during the blasting tests.With different wave velocities,the first arrival time of elastic wave to the sensor would be different.Therefore,the wave velocities set in the monitoring system has a great impact on positioning of microseismic events.By waveform analysis,the P-wave velocity was adjusted and optimized:10 types of wave velocities were set for P-wave in the monitoring system,varying from3800 m/s to4700 m/s.The positioning accuracy under each wave velocity was assessed.By comparing the exact location of the blasting point and the position obtained by microseismic monitoring,it is found that the minimum positioning error of 11.5 m can be achieved when the P-wave velocity was set at 4200 m/s.
(2)Verification of positioning accuracy by artificial blasting
By tempo-spatial comparison analysis of the blasting points and the positions obtained by microseismic monitoring and after determination of P-wave velocity for the monitoring system,the positioning results for 7 blasting tests are listed in Table 1.It is shown that the planar positioning error is less than 14 m and the vertical positioning error is less than 11 m.The positioning accuracy satisfies the system positioning requirement(ESG Solutions,2006).(3)Waveform analysis and identification
Since the microseismic monitoring system was installed and operated in the left bank slope of Jinping I Hydropower Station,about 5 microseismic events were recorded every day,given that noises were removed.The microseismic events mainly concentrated on the spandrel groove of the dam and near the pulverization corridor at an elevation of 1730 m.The lowest magnitude of recorded events was-2.5.The microseismic events recorded during foundation excavation and cavern construction in the left bank slope can be divided into 3 major types:excavation and blasting,rock mass activities,mechanical vibration and noises.
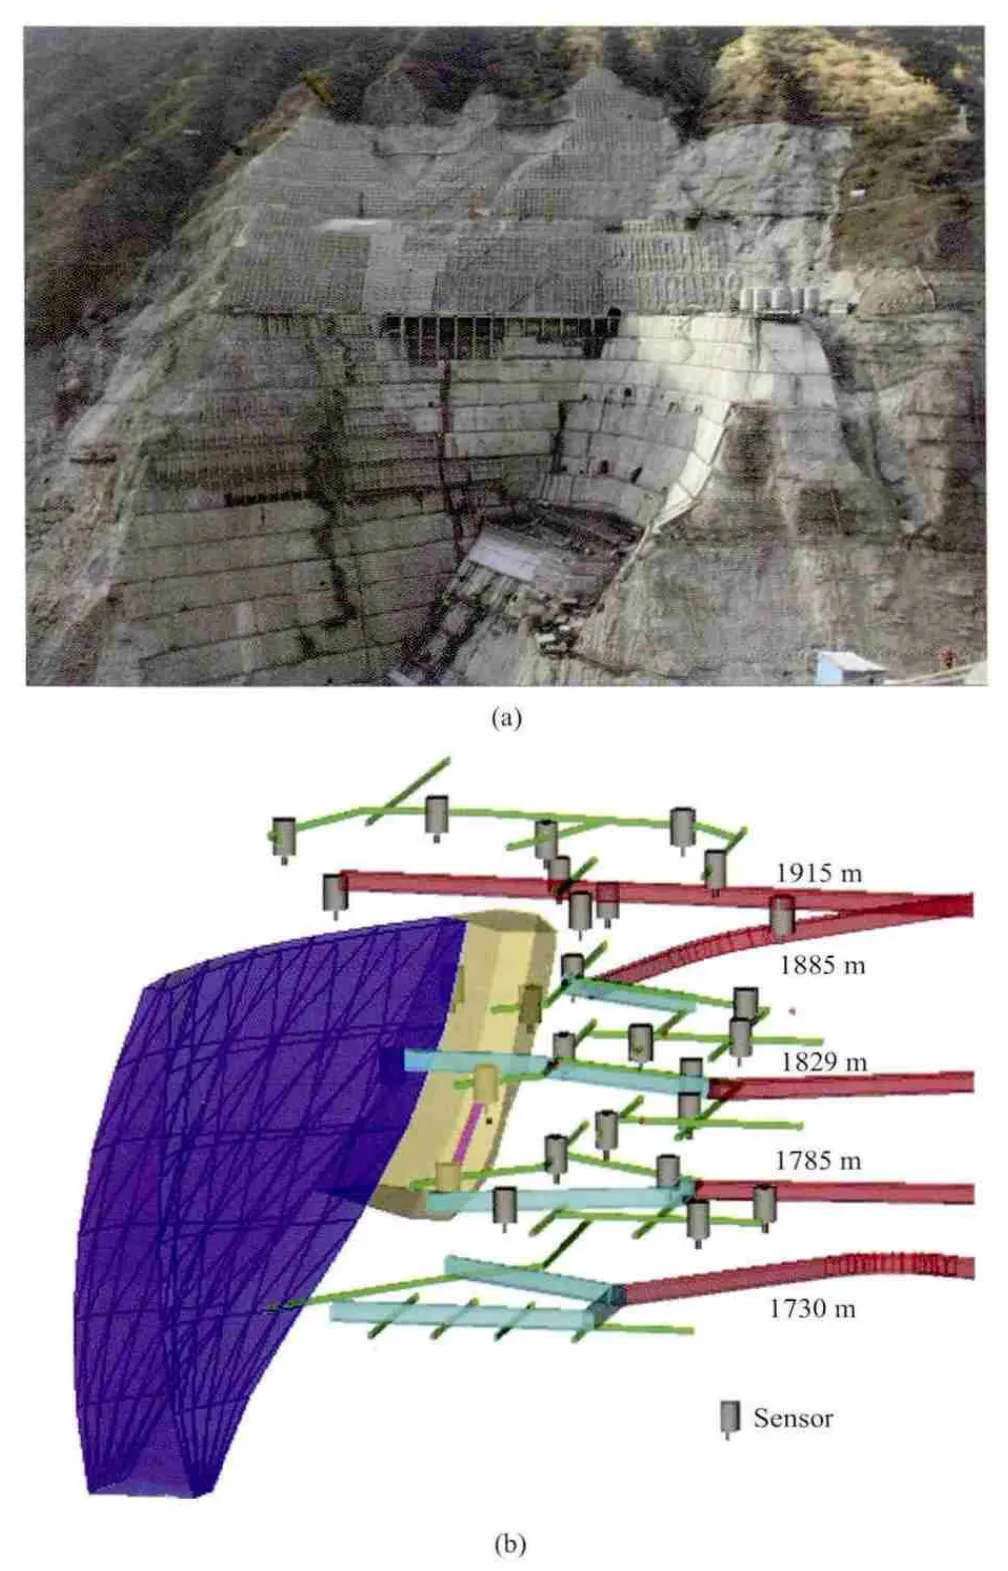
Fig.3.Left bank slope after excavation and spatial layout of sensors in the left bank slope.(a)In-site photo of the monitoring region of the left bank slope,and(b)Layout of optimal sensors at different elevations(the gray columns represent sensors,the blue block denotes the dam,and the red blocks represent transportation tunnels).
3.1.2.Microseismic event and stability analysis of the left bank slope of Jinping I Hydropower Station
Up to 31 May 2011,1640 valid microseismic events were detected in the monitored area by the microseismic monitoring system in the left bank slope of Jinping I Hydropower Station in about 2 years.After waveform recognition,adjustment and removal,1331 microseismic events were identified.The spatial distribution of microseismic events after processing is shown in Fig.4.The microseismic monitoring results reveal the potential instability surface and failure zones in the entire slope.Microcracking mainly concentrates near the spandrel groove of the dam and is distributed in strips at the elevations of 1400-1800 m and about 80 m away from the slope surface.Fig.5 shows the damage zones and energy dissipation density nephogram of microseismic events according to the monitoring data.It is shown that the dense energy dissipation zones mainly concentrate on the potential slip surface between the dam foundation and elevation 1785 m,and the energy dissipation density for unit volume is relatively small.
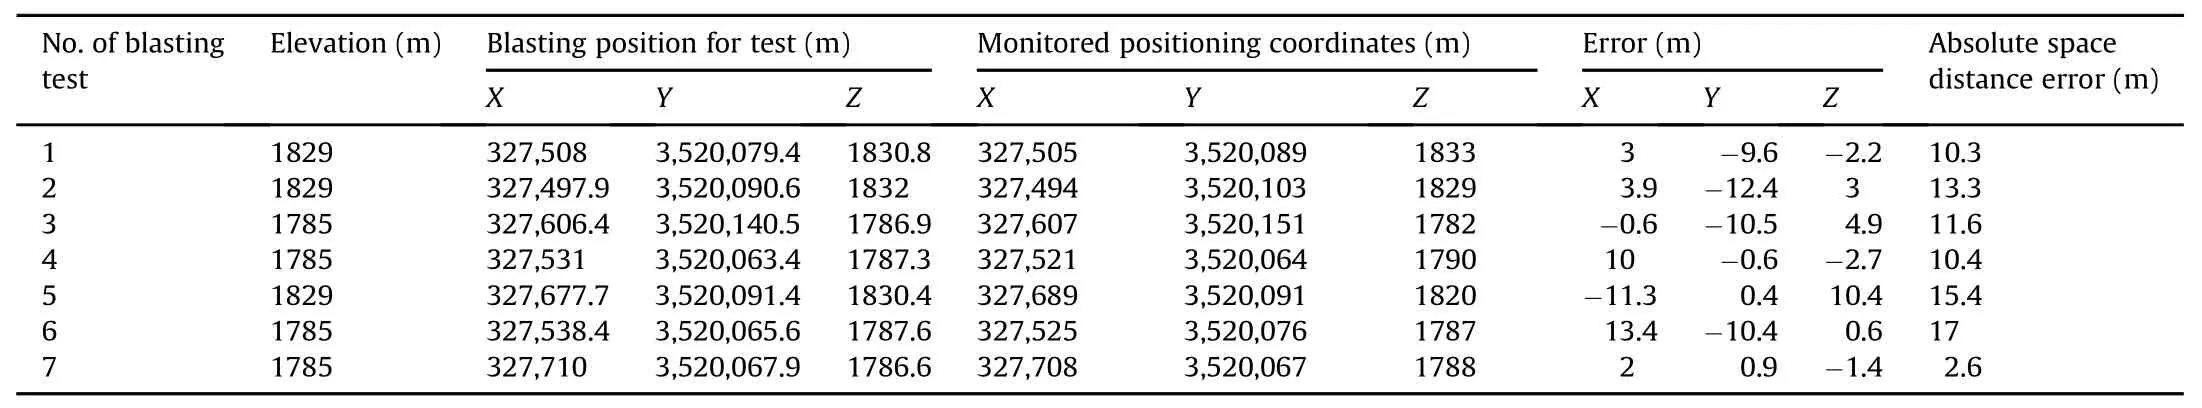
Table 1Comparison of artificial blasting points and microseismic monitoring results.
Three multi-point extensometers,M4wgd-9,10 and 11,were installed along the tunnel axis in the consolidation grouting adit#2 at an elevation of 1829 m in the left bank slope.The deformation measured by M4wgd-10 and 11 was rather stable,which was always below 0.4 mm since the instrument was in place and the displacement at the orifice tended to converge.The displacement recorded by M4wgd-9 increased stepwise since 30 June 2009(Fig.6).The deformation mainly occurred between the orifice and the measurement point#1(6.2 m away from the orifice).The deformation rate increased obviously in October 2009.The accumulated displacement at the orifice reached 19.12 mm on 24 December 2009.Field investigation revealed thata crack in lining at peg No.K0+10 in the consolidation grouting adit#2 has already initiated.The crack developed circumferentially around the adit and the crack opening ranged between 1 cm and 1.5 cm.
For the active microseismic zones in the left bank slope,the microseismic information recordedon 31 October2009 and 28 May 2011 was compared.The corresponding spatial distributions of microcracking events are shown in Fig.7.From the spatial distribution of microseismic events in the lower slope at an elevation of 1829 m,it can be seen that there exist a great number of microseismic event concentration zones below elevation 1829 m(Figs.4 and 7),distributed in strips at the dam spandrel groove,especially along the faults f5and f8,and lamprophyre X.Analysis indicates that shear failure due to unloading leads to an accumulation of rock microcracking events in the slope below elevation 1829 m.Microseismic events triggered deformation of rock masses in the lower slope along the weak structural plane,such as the faults f5and f8,leading to apparent horizontal deformation of the upper slope along the valley direction.This can preliminarily explain the large variation in the measurement by multi-point extensometer M4wgd-9 in November 2009.Therefore,microseismic events in deep rock masses can well reflect the apparent horizontal deformation measured by multi-point extensometers.In addition,grouting was commenced on 30 June 2009 in the consolidation grouting adit#2 at an elevation of 1829 m.In early October 2009,main grouting started and the grouting pressure was increased.The tempo-spatial characteristics of microseismic events and the measurement results by multi-point extensometers were in good correlation with the grouting schedule.Within surrounding rocks,high pressure by grouting action may cause partial relaxation of rock,tensile failure,and formation of a large number of micro-fractures in deep rock near weak planes(such as faults f5,f8),which showed intensive microseismic events in a 3D view of microseismic monitoring result.
Although the slope was overall stable,damage has already occurred and aggravated in the slope.The factor of safety may further decrease(i.e.its stability changes dynamically).In order to investigate the dynamic change of factor of safety for the left bank slope,numerical simulations are performed based on back analysis of microseismic monitoring data.
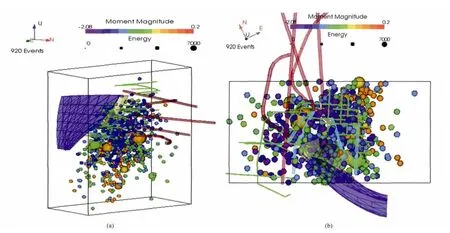
Fig.4.Distribution of microseismic events in the left bank slope of Jinping I Hydropower Station.(a)Spatial distribution of microseismic events,and(b)Plan view of spatial distribution of microseismic events.
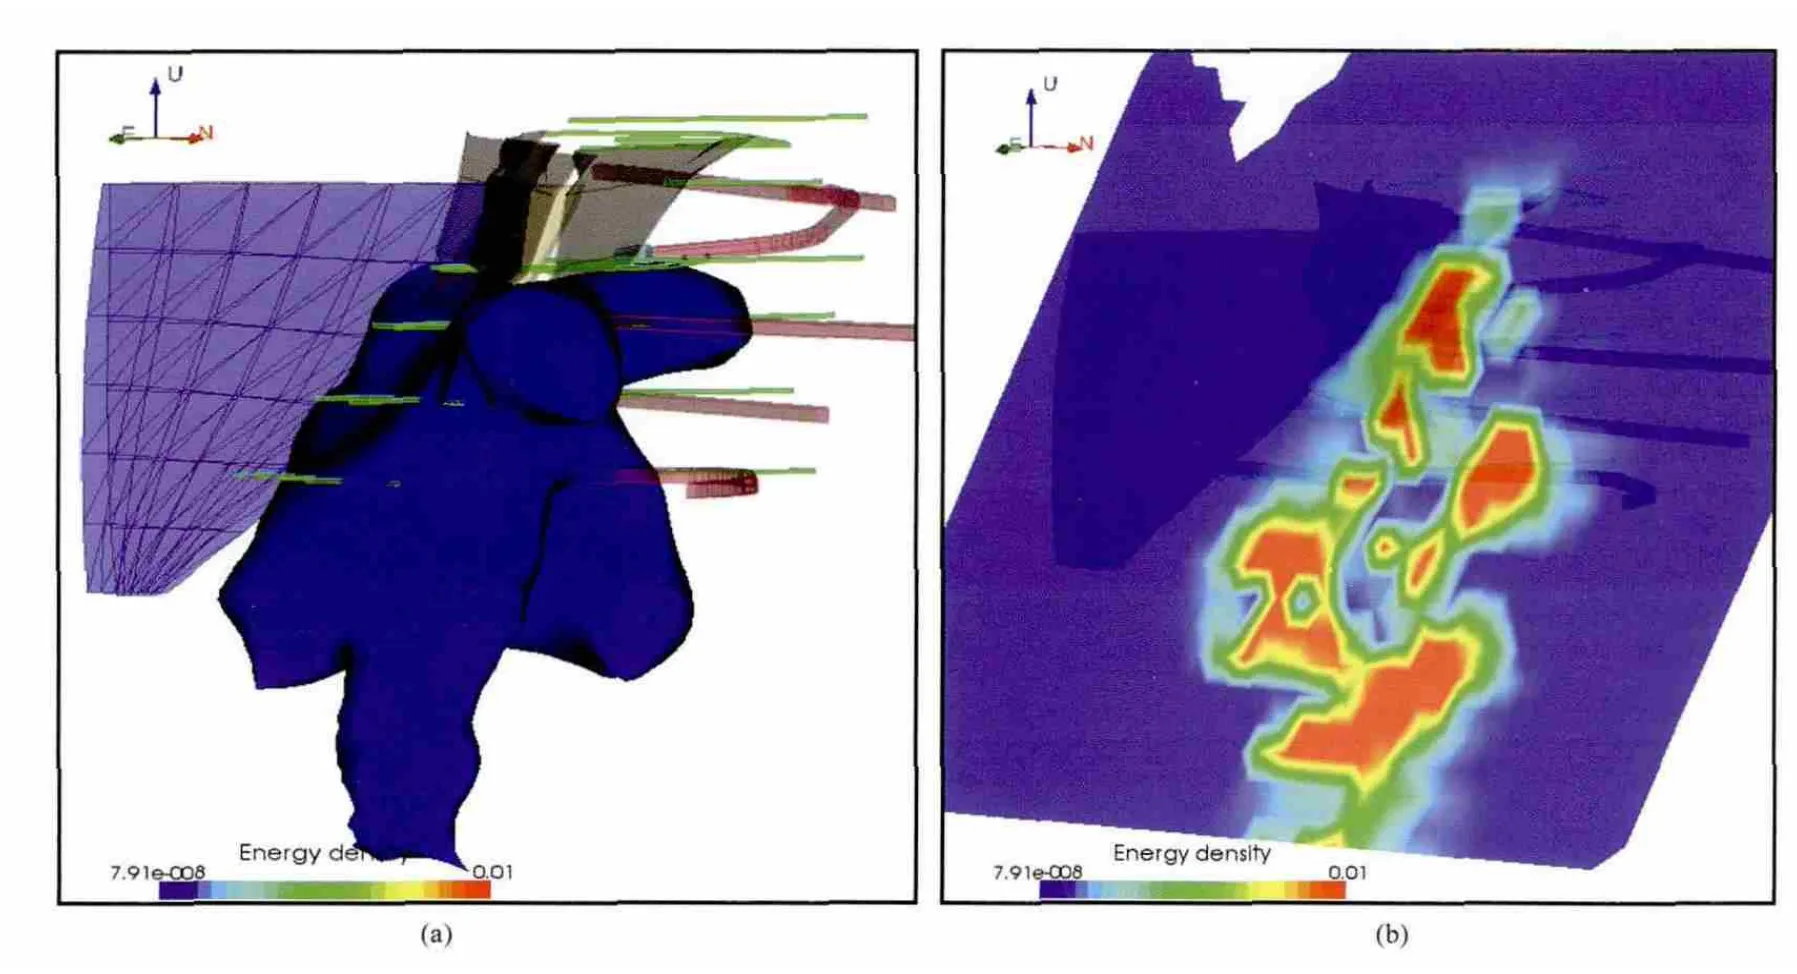
Fig.5.(a)Energy dissipation density nephogram of microseismic events,and(b)Related rock mass damage zone(from June 2009 to May 2011).
3.1.3.Numerical analysis of stability of the left bank slope based on microseismic monitoring
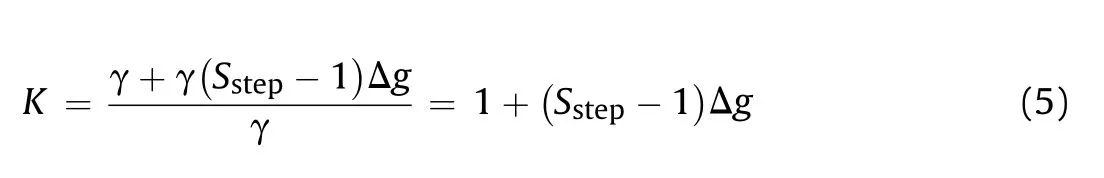
The numerical model and fault distribution based on microseismic monitoring are shown in Fig.8.The model dimension is 240 m×960 m×1025 m(width×height×length),consisting of 659,840 elements and 689,007 nodes in total.The model mesh is re fined for the shallow slope portion.The damage caused by valid microseismic events in deep rock masses within the sensor array range is considered.A total number of 1125 valid microseismic events are considered in the computation range,with moment magnitude in the range of-2.5-0.5 and microseismic energy varying from tens to thousands of Joules.The initial mechanical parameters of rock masses are selected based on the work by HCEC(2003),as shown in Table 2.The mechanical parameters are modified in real time during computation according to microseismic monitoring and the procedures as described in Section 2.2(Fig.1).This study focuses on the effect of microseismic events on the overall slope stability(i.e.how the factor of safety changes with microcracks or damage evolution).The numerical code,RFPA(rock failure process analysis)(Li et al.,2009),is employed to conduct simulation to evaluate the factor of safety of the slope.As the model shown in Fig.8 is the fully excavated slope,the factor of safety in the numerical simulations corresponds to the stage of the excavation completed.The coefficient of centrifugal loading,Δg,is taken as 0.01 per step in numerical calculation(Li et al.,2009).The factor of safety K is defined as the ratio of the self-weight of an element at failure to that in the initial state:where Sstepis the loading step at which the number of the failed elements reaches a maximum,andγis the material unit weight.
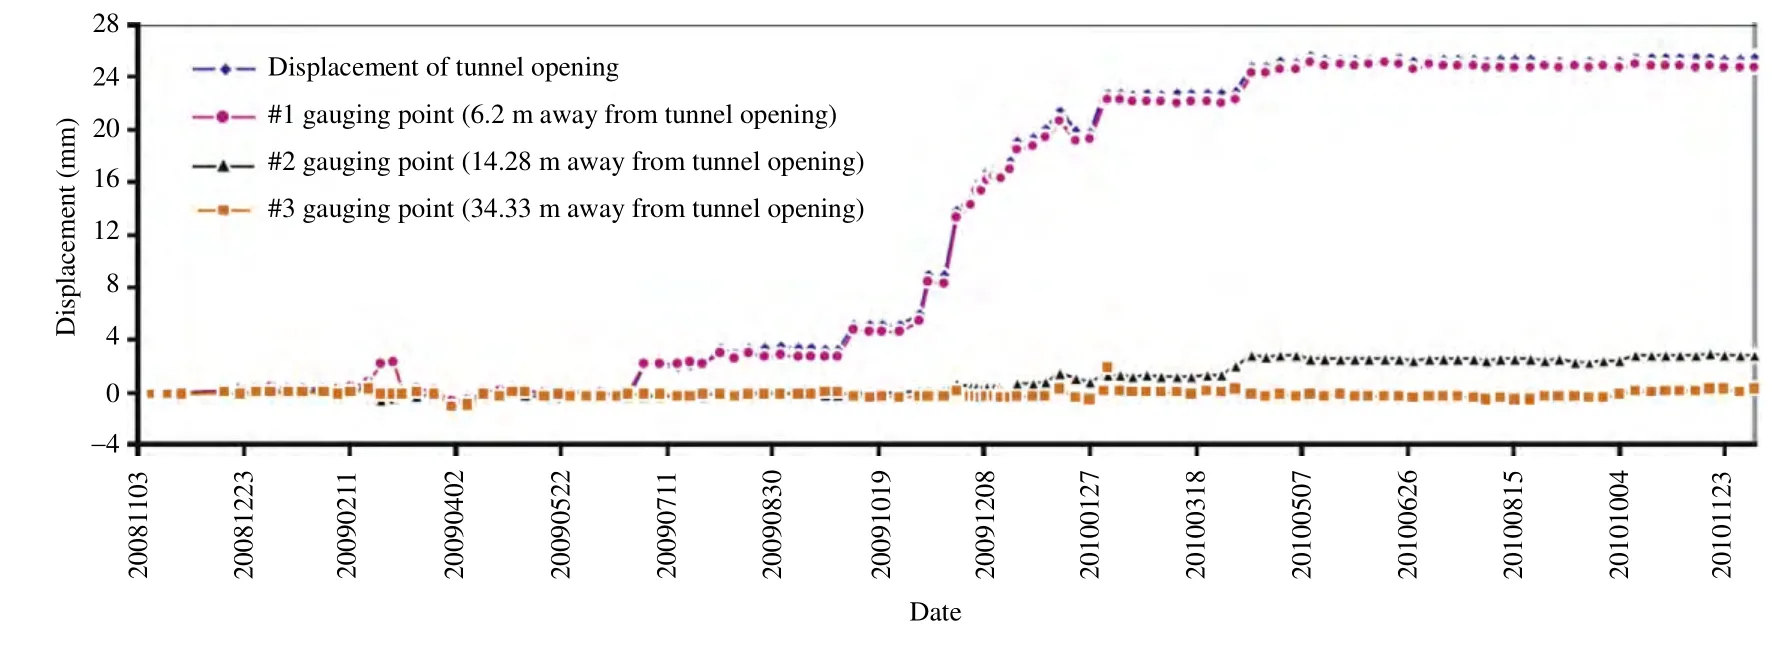
Fig.6.The plot of the extensometer data recorded by M4wgd-9 at the consolidation grouting adit#2 located at the elevation of 1829 m.
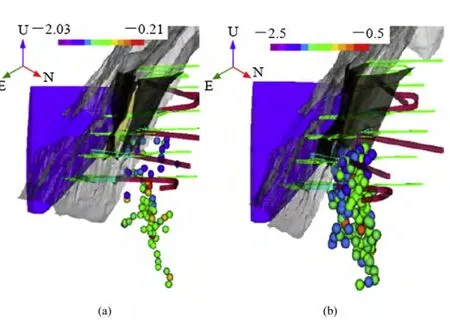
Fig.7.Distribution of microseismic events in the active microseismic region.(a)Microseismic events(totally 88 events)during 25 June and 31 October 2009,and(b)Microseismic events(totally 218 events)during 25 June 2009 and 28 May 2011.
In the numerical simulations with RFPA,a specified type of material is used to represent the faults and lamprophyre X between intact rock matrixes.The faults and lamprophyre X are assumed to consist of “weak material”with a lower strength and stiffness compared to other intact rock mass.
Fig.9 shows the numerical results of slope failure process.The variation of damage field is presented by the damage degree of individual elements(Li et al.,2009).The following phenomena are observed in the rock slope:
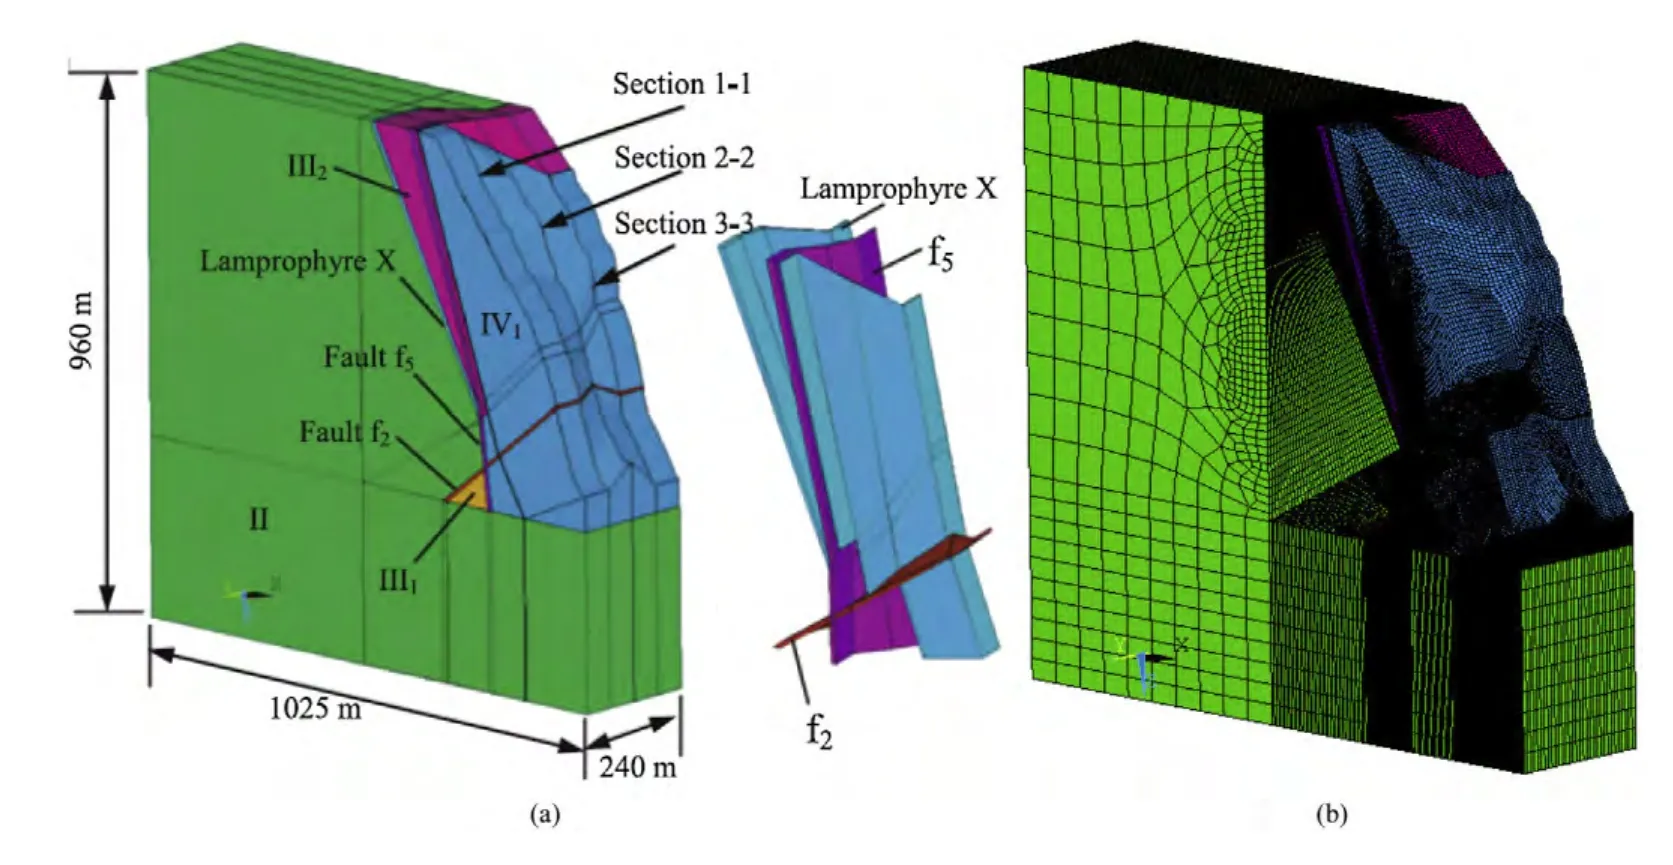
Fig.8.3D numerical model and distribution of main faults.(a)Simplified 3D model,and(b)Model meshing.
(1)The centrifugal loading is applied until macroscopic failure
occurs.The corresponding factor of safety is 1.53.The factor of safety for the left bank slope in consideration of microcracking and damage on deep rock masses is reduced by 0.11(HCEC,2003),compared to that for 3D slope without considering microseismic effects.As slope reinforcement is not considered in the numerical simulations,the factor of safety is smaller than the actual one.However,the stability still satisfies the minimum factor of safety required by design specifications.Therefore,if rock mass damage induced by construction(revealed by microseismic monitoring)is considered for slope stability analysis,the safety assessment may be affected and the simulation results shall be more close to the real situation.
(2)Damage first occurs on the potential slip surface in the upper slope along the fault f5and the lamprophyre dike X(Fig.9a).At step 54-0,the subsidence occurs in rock masses between the lamprophyre dike X and the fault f5and local damage occurs.Meanwhile,a small amount of damage occurs near the fault f2,leading to local tensile and shear failure.At step 54-5,a potential sliding block has already formed,with the lamprophyre dike X and the fault f5as the upper slip surface and the fault f2as the lower slip surface.It indicates that the lamprophyre dike X and the fault f5still play a controlling role in the overall slope stability and slip occurs in the fault f2at a later stage,leading to tensile and shear failure.
(3)For damage of deep rock masses considering the microseismic effects,especially after the main faults are damaged,the slope instability mechanism is the evolution,development,extension and coalescence of the potential fracture surface along large faults or weak zones until macroscopic failure.The 1125 microcracking events detected by microseismic monitoring in the left bank slope are of small magnitude and low energy.Their effect on the damage of the intact rock masses in the slope is not obvious.However,the factor of safety is smaller compared to the case without considering microcracking(microseismic events).In addition,based on the microseismic monitoring and 3D numerical simulation results,it is shown that the faults and weak zones in the deep slope affect the slope stability significantly.
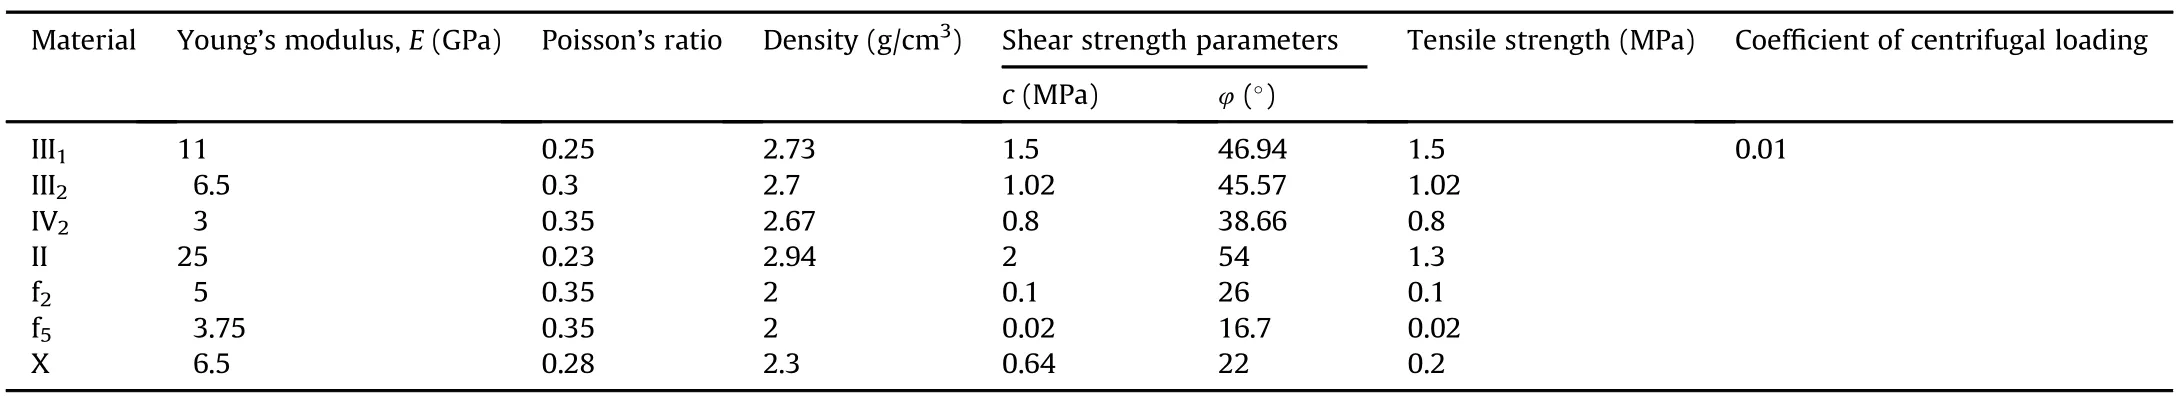
Table 2Physico-mechanical parameters adopted for numerical simulation of the left bank slope of Jinping I Hydropower Station.
3.2.Stability analysis of the right bank slope of Dagangshan Hydropower Station
3.2.1.The microseismic monitoring system for the right bank slope of Dagangshan Hydropower Station
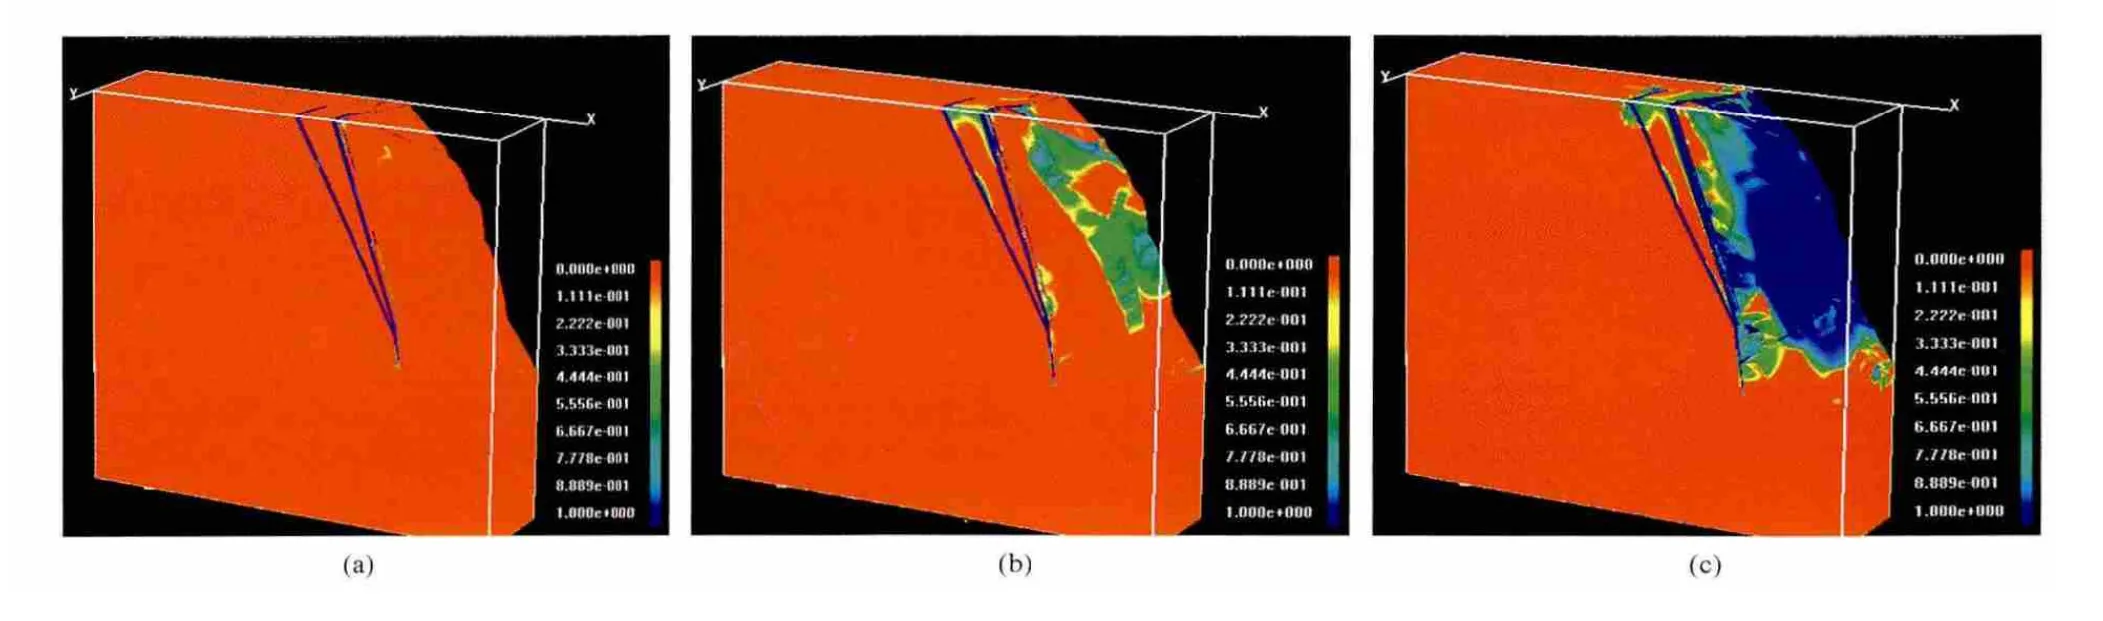
Fig.9.Variation of internal damage zones during the slope failure process.(a)Step 10-1.(b)Step 54-5.(c)Step 54-9.The number means the damage degree,“0”means elastic state and “1”means complete failure.
The right bank slope of Dagangshan Hydropower Station is located on the fault block cut by the Daduhe Rupture and the Moxi Rupture.It is subjected to high geo-stresses and rock masses are highly unloaded,with poor tectonic stability.There are main dikes including b146,b82(f74),b40(f71),b73(f118),b142,b5(F1),gL5,b4,b85,b62,b83,b68,b117(f78),b43,b8(f7),6 sets of joints,faults f65,f85,f119,f231,f208and two large-scale deep unloading dense fracture zones XL-316 and XL-915.The slope is overall stable under natural conditions.However,during slope excavation,the slipresisting rock masses on the slope surface were excavated.The unloading fractured zone XL-316 and the shallow downslope fault f231lead to formation of a series of unstable rock blocks with an approximate volume of about 2-5 million cubic meter in the range of 100-200 m upstream and downstream at a height of 200-300 m.The slope stability problem was challenging during slope construction.For instance,on 3 May,16 August and 1 September 2009,a number of macroscopic fractures appeared successively in the right bank slope during excavation.In addition,deformation and dislocation appeared a few times near the shear opening along the unloading fractured zone XL-316 and the fault f231,forcing to suspend the excavation work. In order to control the deformation of geological structures,additional 250 million RMB was invested to reinforce the slope.Anti-shear galleries backfilled by low expansion concrete back fill were adopted to replace the weak geological structures. Anti-shear galleries with same cross sectional dimension and different lengths were arranged at the elevations of 1240 m,1210 m,1180 m,1120 m and 1060 m in the right bank slope(HCEC,2009).In this study,the in situ microseismic monitoring data and numerical simulations are combined to study the slope stability before and after slope reinforcement by anti-shear galleries and to quantitatively analyze variations in factor of safety.Meanwhile,the rationality of slope reinforcement by anti-shear galleries is evaluated.It is attempted to provide a basis for explanation of large deformation problems during the slope excavation.
The microseismic monitoring system,manufactured by ESG Solutions,Canada,was employed for the right bank slope of Dagangshan Hydropower Station.Twenty two sensor arrays were installed in caverns at 11 elevations in the right bank slope for 24-h real-time monitoring.A large number of seismic source parameters,such as tempo-spatial data,errors,magnitude and energy,were collected.After filtering of the collected data,the complete waveform and spectral analysis diagram of seismic sources were obtained.The types of microseismic events were automatically identified,and noises were filtered out.The monitoring system covered the range of 300 m from the dam abutment along the upstream and downstream directions,respectively,the elevation between 800 m and 1400 m,and 400 m deep from the slope surface(i.e.600 m×600 m×400 m),as shown in Fig.10.
3.2.2.Microseismic event during excavation of the right bank slope of Dagangshan Hydropower Station
The early-stage microseismic monitoring for the right bank slope was meant for analysis of microcracking in rock masses triggered by excavation and unloading of the main slope.As shown in Fig.11,the spatial distribution of microseismic events indicates that microseismic events mainly initiate and evolve at the controlling structure formed by the unloading fractured zone XL-316 and the fault f231.In this figure,the size and color of microseismic events represent the amount of energy and moment magnitude of microseismicity.As can be seen from Fig.11,the microseismic energy release zones mainly concentrate at the elevations of 1240-1080 m during slope excavation.The energy density of microseismic events continuously accumulates,releases and transfers during slope excavation.It can be inferred that this is the result of local stress adjustment.The zones with relatively higher energy density concentrate below elevation of 1125 m and run through the slope along the main controlling structure XL-316 and the fault f231.The microseismic energy induced by excavation is released,transferred and adjusted continuously.The zones with energy dissipation continuously increase and the microcracking accumulates and extends.When the stress caused by energy dissipation superposition in the elastic zone is less than the elastic strength of rock material,the failure zone stops propagating and the failure surface stops extending.During the failure process,the energy loss mainly concentrates in the unloading fractured zone at the elevations of 1135-1240 m,near the fault f231at the elevations of 979-1100 m(red area)and about 80-150 m below the slope surface.This is consistent with the geological condition revealed by in-site investigation.Microseismic monitoring can effectively identify and delimit the rock damage zones in deep slope triggered by construction,which provides a reference for slope construction and reinforcement measures.3.2.3.Evaluation of reinforcement effect of anti-shear gallery in the right bank slope of Dagangshan Hydropower Station
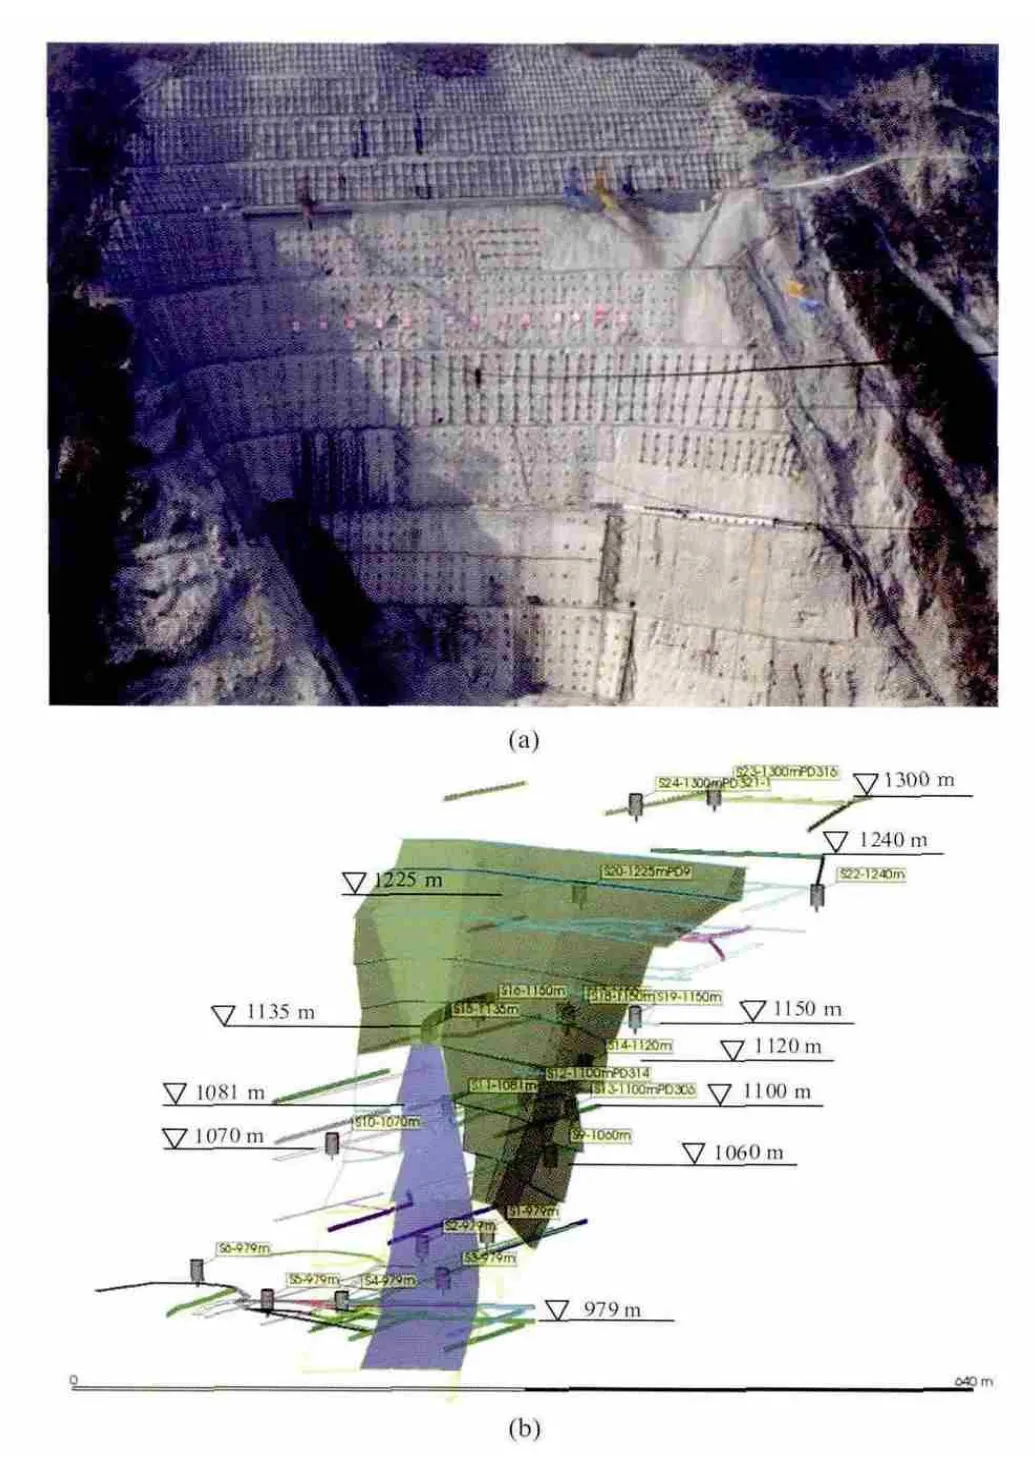
Fig.10.In-site photo of the right bank slope of Dagangshan Hydropower Station and wiring of microseismic monitoring system.(a)In-site photo of slope and wiring of microseismic monitoring.(b)Spatial distribution of sensors for microseismic monitoring(the gray columns represent sensors,the blue block denotes the dam,and the green blocks represent the slope surface).
Based on analysis of topography and geological conditions of the right bank slope,reinforcement measures dominated by anti-shear gallery were implemented to ensure the overall stability of slope(Fig.12),aiming at the delimited large-scale controlling structures which are likely to fail.Anti-shear galleries were adopted to reinforce the unloading fractured zone XL-316,mainly in the range of(cable crane)0+074.6-219.3 at an elevation of 1180 m,(cable crane)0+070.4-171.8 at an elevation of 1150 m,(cable crane)0+081.1-148.4 at an elevation of 1120 m,(cable crane)0+055.2-109.5 at an elevation of 1060 m.The unloading fractured zone XL-316 and diabase dikes at the elevations of 1240 m and 1210 m were replaced.The dimension of anti-shear galleries was 8 m×9 m(width×height).The plan view of six anti-shear galleries is shown in Fig.13.These anti-shear galleries were back filled to a certain depth by grouting with low-expansion concrete,so as to reduce the gap between contact surfaces due to concrete shrinkage(DL/T5353-2006,2006).Proper amount of reinforcement bars and profile bars were used in the concrete to increase the shear stiffness.Finally,a reinforcement system was built for a super largescale soft rock structures along the unloading fractured zone XL-316 and the fault f231.
In order to compare the numerical simulations with microseismic monitoring results,a 3D finite element model proportional to the scope of microseismic monitoring is established,according to the distribution and characteristics of unloading dense fracture zones in the right bank slope.The model covers 690 m along the direction perpendicular to the river,400 m along the river,1060 m in the vertical direction,including profiles I-IX of cable crane platform in turn from upstream to downstream.The lithology of various rocks is differentiated by color(Fig.14),and the macroscopic mechanical parameters are listed in Table 3.The model is built by commercial software,ANSYS,following the modeling principle of“point→line→surface→volume”.The model consists of 1,118,264 hexahedral elements and 1,153,843 nodes in total.The model is re fined for shallow slope portion and the elements in the shallow slope account for about 93%of the total number of elements.The side boundaries of the computation domain are restrained in the normal direction,the bottom boundary is hinged and the surface is free.Based on the model,RFPA method is adopted for finite element simulation to analyze the factor of safety of the slope.The factor of safety in numerical simulations corresponds to the stage of the excavation completed.The coefficient of centrifugal loading,Δg,is taken as 0.005 per step in numerical calculation(Li et al.,2009).In this modeling,a specified type of material is used to represent the anti-shear galleries.The anti-shear galleries assumed to consist of“strong material”with a higher strength and stiffness compared to other intact rock mass.As in real construction of the anti-shear galleries,the C25 concrete was employed,and the mechanical parameters related to the C25 concrete are used in numerical modeling.
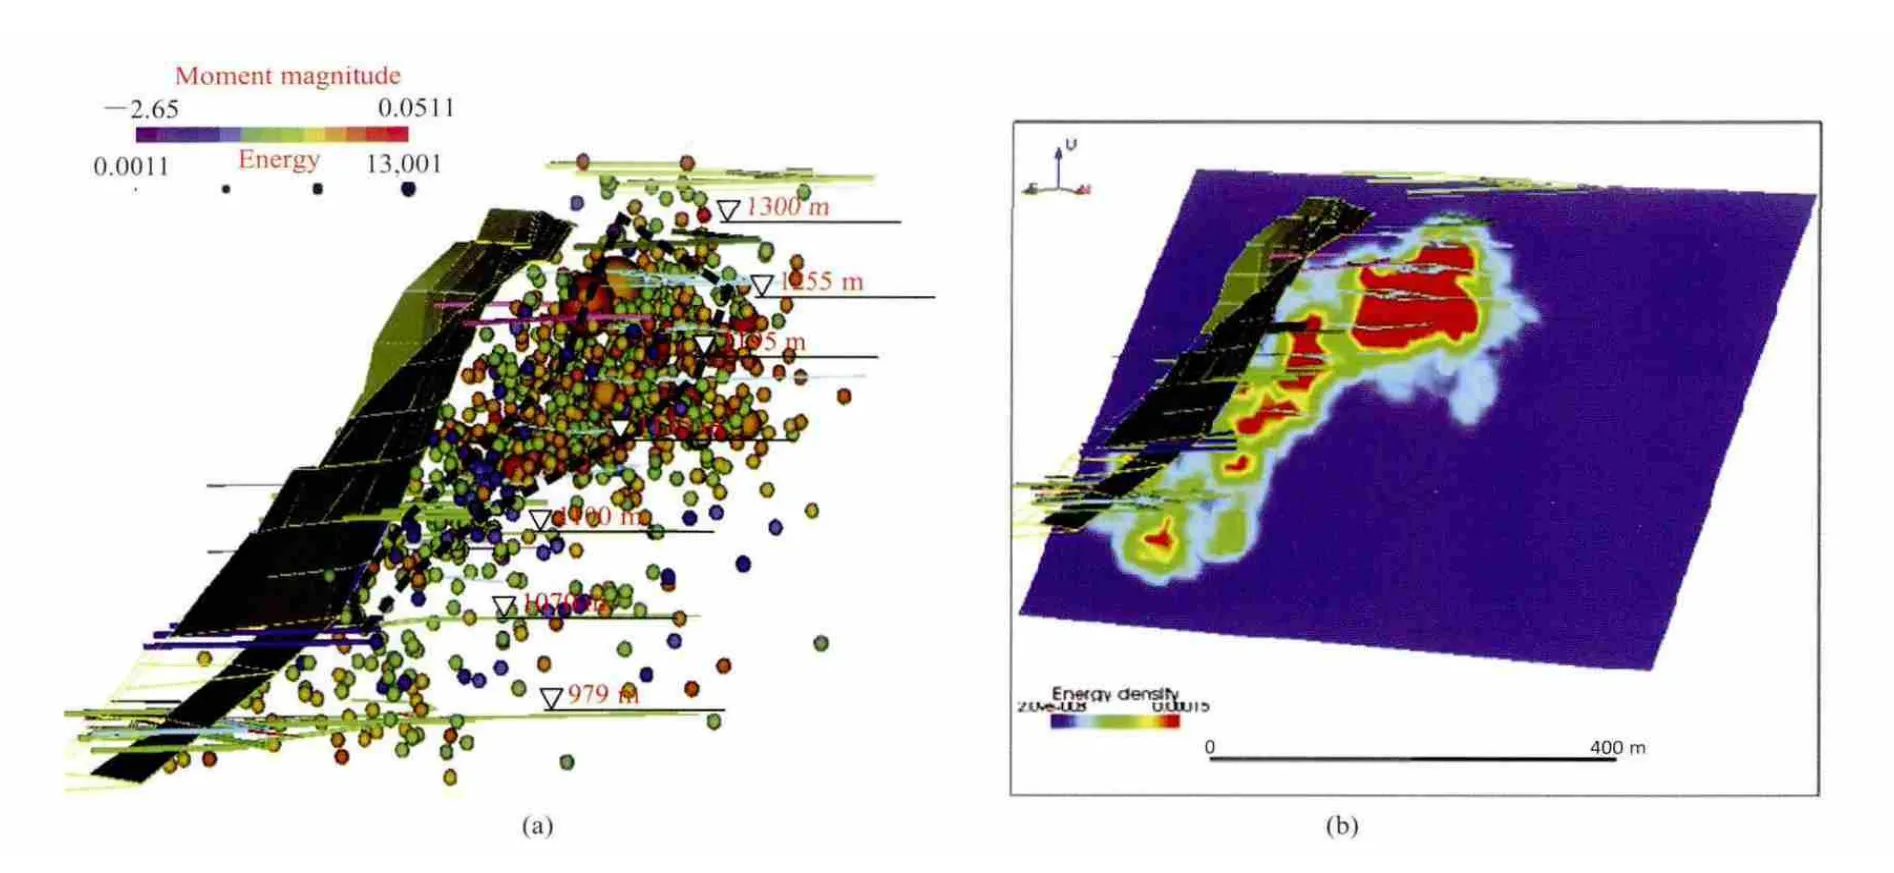
Fig.11.Spatial distribution of microseismic events and energy dissipation density during slope excavation.(a)Spatial distribution of microseismic events during slope excavation.(b)Energy dissipation density(from 4 May 2010 to 30 September 2011).
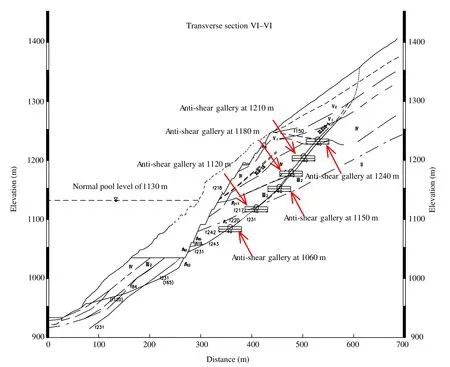
Fig.12.Layout of anti-shear galleries in the right bank slope of Dagangshan Hydropower Station.
The numerical results are shown in Fig.15.In Fig.15a,the zone surrounded by the dotted lines refers to excavated zone,while in Fig.15c the zone surrounded by the dotted lines refers to the potential sliding block.It is indicated that,after excavation is completed,slope instability develops first along the unloading fractured zone XL-316 and then cracks occur along the interface of rock strata in the unloading fractured zone.Obvious stress concentration occurs at the two sides of anti-shear galleries.Apparently,the stress gradually “moves”to the anti-shear gallery during the loading process.Due to the presence of enormous tensile stresses,the stress in the rock masses surrounding the anti-shear galleries is generally distributed as a splitting “knife-edge”(as shown in Fig.15a and b).This is consistent with the deformation detected by microseismic monitoring.Fig.16 shows the microseismic deformation around the 6 anti-shear galleries(Ma et al.,2012).The microseismic deformation indicates the relative displacement of fracturing planes deduced by the monitored stress waves(ESG Solutions,2006).The microseismic deformation u can be calculated by(Hu,2006):where M0is the seismic moment and related to moment magnitude M(M=2 log10M0/3-6),A is the area of fracturing plane,and G is the shear modulus of rock mass.
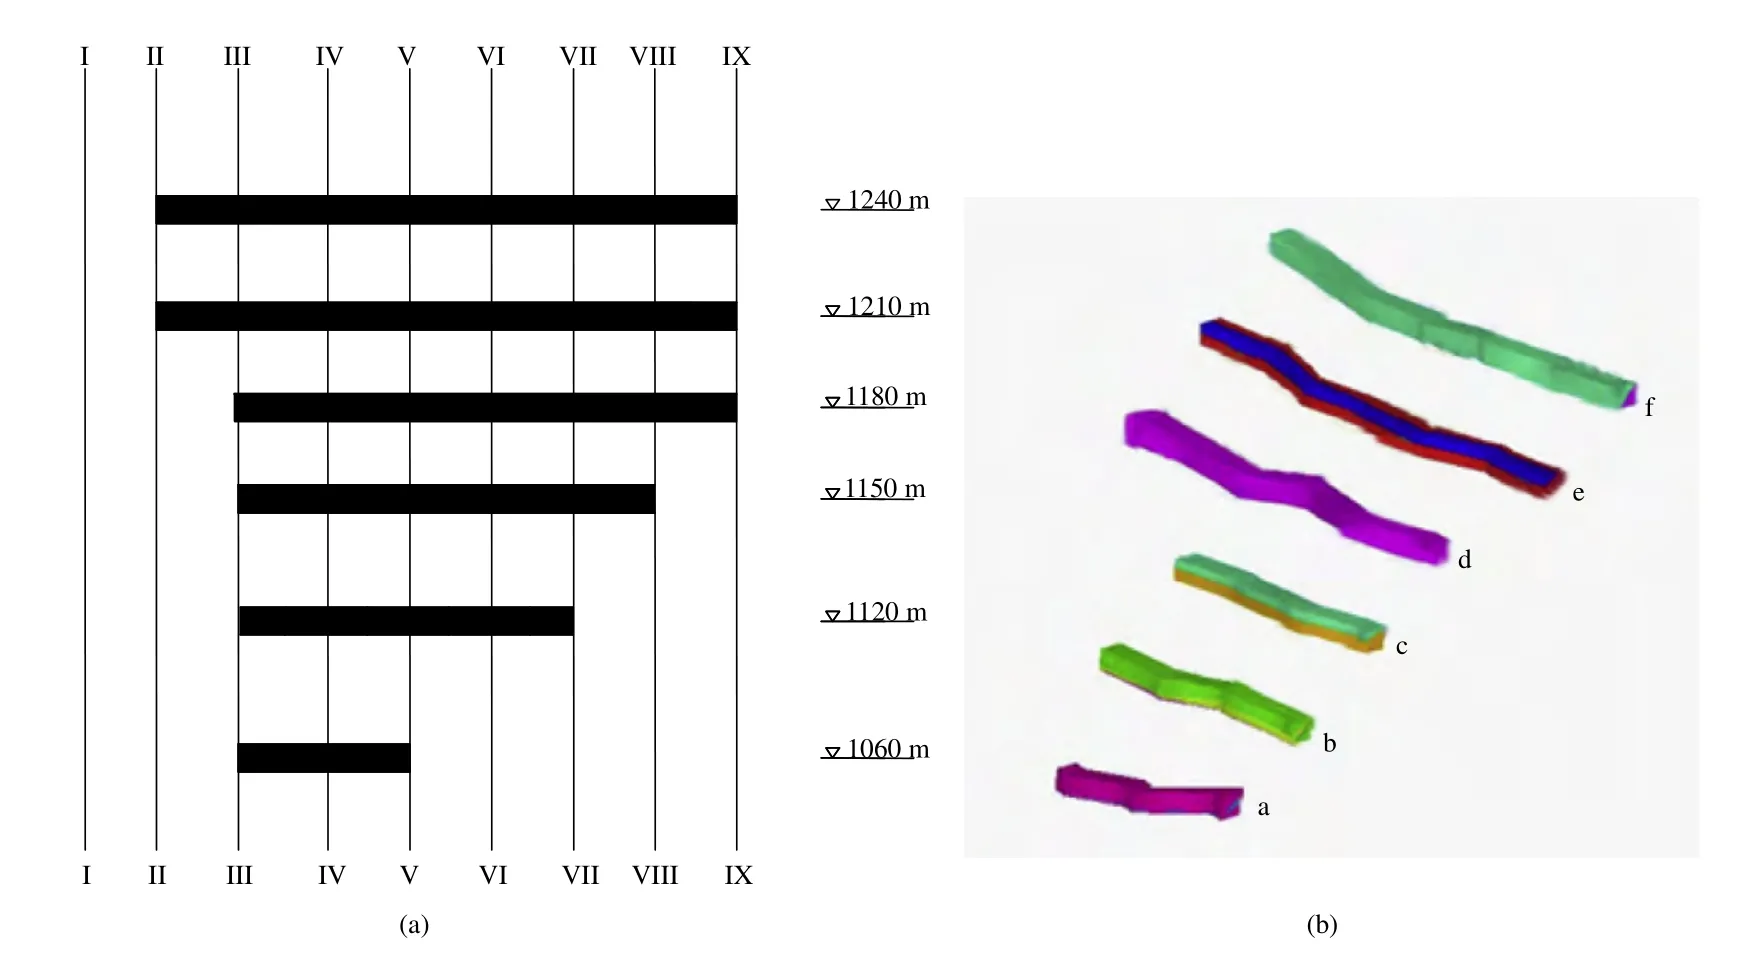
Fig.13.Sketch of anti-shear gallery model(9 section lines I-IX and 6 anti-shear galleries a-f).(a)Plan view of anti-shear galleries.(b)Spatial distribution of anti-shear galleries.

Fig.14.Finite element model for numerical simulation(including 6 anti-shear galleries at various elevations).
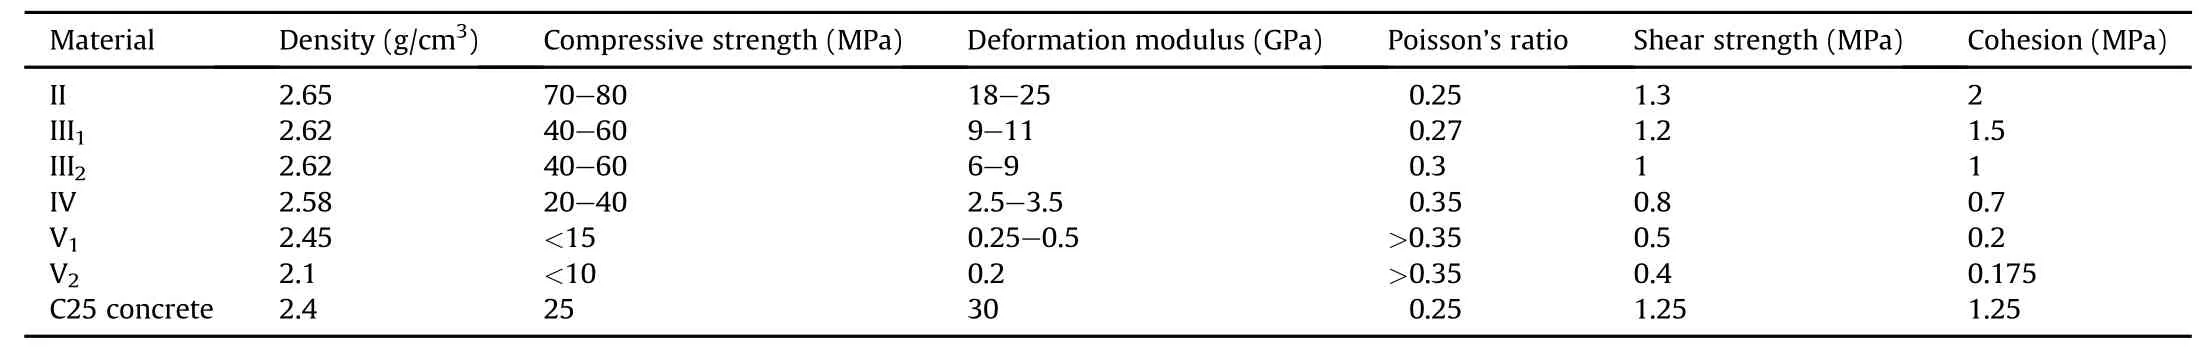
Table 3Physico-mechanical parameters adopted for numerical simulation of the right bank slope of Dagangshan Hydropower Station.

Obviously,the deformation around the anti-shear galleries is different from that of far field.This indicates the loading and stress concentration of the anti-shear galleries and also proves the reinforcement effect of anti-shear galleries.As the overloading method is adopted,the potential failure mode of the slope can be simulated.At step 189,the potential slip surface coalesces.A potential huge block is formed with the block controlled by the unloading fractured zone XL-136 as the hanging wall,and the block controlled by the fault f231as the foot wall.It can be seen that the interfaces between weak rock strata,faults and unloading fractured zones are still the main factors for slope instability.Slip of potential sliding blocks first occurs at locations without shear resistance tunnel at the elevations of 1240 m,1210 m,1180 m,1150 m,1120 m,and 1060 m(Fig.15c).No failure occurs near the concrete-back filled anti-shear galleries,indicating the remarkable reinforcement effect.
The variations of microseismic events before and after reinforcement obtained by numerical simulations are shown in Fig.17.It can be seen that,with increasing number of anti-shear galleries,the overall factor of safety of slope increases gradually.The factor of safety for the current reinforcement scheme(with 6 anti-shear galleries)is 1.83,which is enhanced by 51.2%,compared to the case without reinforcement by anti-shear galleries(which is 1.21).The microseismic events before and after reinforcement by antishear gallery also indicate that,up to the end of May 2012,with sealing and grouting of the lower three anti-shear galleries(at the elevations of 1150 m,1120 m,and 1060 m,respectively)and consolidation grouting of the upper 3 anti-shear galleries(at the elevations of 1240 m,1210 m,and 1180 m,respectively),only 42 microseismic events were detected in that month,which was reduced by about 66.4%,compared to 125 microseismic events(including blasting)before construction of anti-shear galleries in May 2010.It indicates that,with construction of anti-shear galleries,rock damage at large depth in the slope tended to reduce,microseismic events became weaker and the damage induced by unloading tended to cease gradually.
The consistency between numerical simulations and microseismic monitoring results verifies the concentrated microcracking zones in the right bank slope of Dagangshan Hydropower Station and reveals that the controlling structure formed by the unloading fractured zone XL-316 and the fault f231is the key to the stability of the right bank slope.Therefore,it is suggested to closely monitor the deformation and convergence of rock masses at the intersection of the unloading fractured zone XL-316 and the fault f231.Numerical simulations and monitoring results indicate that reinforcement by anti-shear galleries is feasible and can increase the factor of safety of the slope.
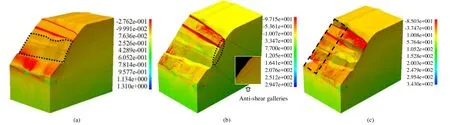
Fig.15.Variation of maximum principal stress during the progressive failure process of slope(unit:MPa).(a)Step 59.(b)Step 167.(c)Step 189.
4.Conclusions and discussions
According to the concept that the progressive damage and failure(microseismicity)of rock slope are the essence of the precursor of slope instability,establishment of the slope damage evolution model and implementation of the dynamic stability assessment method for rock slope based on microseismic monitoring and numerical simulations are the trend in prediction of high-steep rock slope stability for hydropower engineering.Based on the case studies,the following conclusions can be drawn:
(1)The physical monitoring information of high-steep rock slopes for hydropower engineering (microseismic monitoring)changes objectively and dynamically.Therefore,the subjective stability evaluation for slope(numerical simulations)shall be dynamic.Considering the intrinsic influence and correlation between the background stress field,development of slip surface and microseismic information(tempo-spatial coordinates,seismic source size,energy release,and other physical information)of a slope,microseismic monitoring and numerical simulations can be combined and are supplementary for each other.
(2)The analysis between microseismic event and numerical simulations of the left bank slope of Jinping I Hydropower Station indicates that the microseismic events in the left bank slope are distributed in strips along the spandrel groove of the dam.If the microseismic effect is considered,especially when the main faults are damaged,the slope instability mechanism is the evolution,development,extension and coalescence of the potential fracture surface along large faults or weak zones until macroscopic failure.The factor of safety of the slope is reduced by 0.11.It is proven that the continuously accumulating damage affects the factor of safety of slope.
(3)For the right bank slope of Dagangshan Hydropower Station,the damage zones in the deep rock mass of the right bank slope triggered by excavation are delimited and identified based on the stress field variation and the microseismic events.The reinforcement effect of the anti-shear gallery is also evaluated.It is shown that,without anti-shear galleries,the slope tends to slip along an arc-shaped slip surface controlled by the unloading fractured zone XL-316 and the fault f231.When the slope is reinforced by anti-shear galleries,damage and failure occur at locations without anti-shear galleries,and no failure occurs near the concrete back filled antishear galleries.The shear resistance of weak structure has been improved greatly after reinforcement.The factor of safety of slope is 1.83,which is about 51.2%higher than that(1.21)before reinforcement.
(4)Damage in the slope basically increases with time.Based on the idea proposed in this study,correlation can be established between microseismic events and strength weakening due to damage deterioration in rock masses and dynamic instability during the slope failure process.The real-time and dynamic evaluation can better reflect the actual factor of safety of slopes.By theoretical studies and practical explorations,in the authors’opinion,the stability analysis method for high-steep rock slopes by combining microseismic monitoring and numerical simulations can be improved in the following aspects:
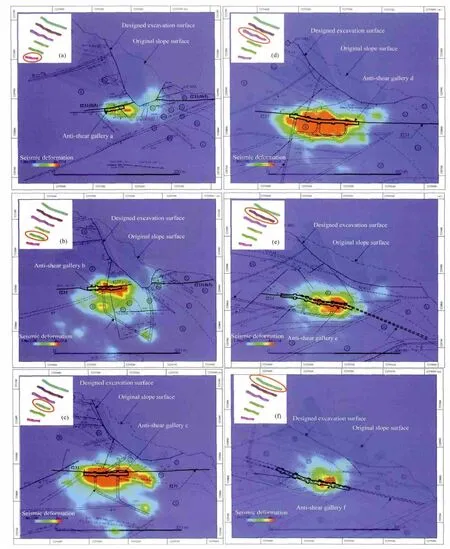
Fig.16.The microseismic deformation after reinforcement by anti-shear galleries(Ma et al.,2012).
(1)The theory and techniques for positioning accuracy of the microseismic monitoring system should be developed.The objective factors affecting microseismic positioning accuracy in rock slopes include as follows:(a)The sensors are installed at various elevations.Due to the existence of slip surfaces of deep faults,a great number of fillings,and cavities such as transportation tunnels and drainage tunnels,the physical properties can be quite different from that of the surrounding rock masses,and thus affect the positioning accuracy for microseismic events.(b)The interfaces between rock masses with different physical properties may reflect,refract or disperse elastic waves,and even block wave propagation and reduce wave energy,affecting positioning accuracy of microseismic events.Wave diffraction occurs at free surfaces,leading to delay in the first arrival time to the sensor and false positioning of microseismic events.(c)The velocity of elastic waves increases with increasing rock mass density.For rock masses with different properties or moisture contents,the wave velocity may differ significantly.Rock masses are anisotropic and propagation of elastic waves is directional.In the authors’opinion,there is no big technical obstacle in improving monitoring accuracy.The accuracy can be greatly improved by increasing the number of sensors.Due to limited research fund,only 30 sensors or less were employed for both cases presented in this study.
(2)To capture the key microseismic monitoring data reflecting the critical failure state of slope,the authors attempted to evaluate the risk of slope instability using spatial distribution of microseismic events,change in energy level and the b-value.There is still much space left for improvement in terms of theory in this aspect.
(3)The correlation between the microseismic monitoring data and numerical modeling parameters should be established.Given the limited monitoring data(points),how to properly represent the microseismic points in the numerical model by appropriate source size,energy level and accurate spatial coordinates is of practical significance for evaluation of dynamic stability of slopes.
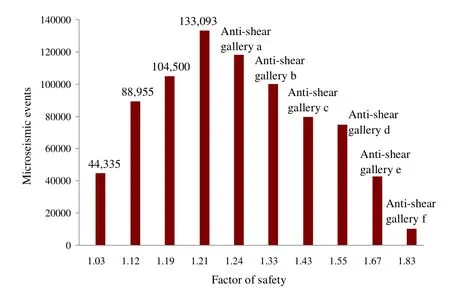
Fig.17.Variation of AE counts before and after reinforcement by anti-shear gallery obtained by numerical simulations.
Conflict of interest
The authors confirm that there are no known conflicts of interest associated with this publication and there has been no significant financial support for this work that could have influenced its outcome.
The study was jointly supported by grants from the National Basic Research Program of China(Grant Nos.2011CB013503,2014CB047103)and the National Natural Science Foundation of China(Grant Nos.51279024,51209127).The authors are grateful for these supports.
Arosio D,Longoni L,Papini M,Scaioni M,Zanzi L,Alba M.Towards rockfall forecasting through observing deformations and listening to microseismic emissions.Natural Hazards and Earth System Sciences 2009;9:1119-31.
Blake W,Leighton F,Duvall WI.Microseismic techniques for monitoring the behavior of rock structures.International Journal of Rock Mechanics and Mining Science and Geomechanics Abstracts 1975;12(4):69.
Cai M,Kaiser PK,Martin CD.A tensile model for the interpretation of microseismic events near underground openings.Pure and Applied Geophysics 1998;153:67-92.
Cheon DS,Jung YB,Park ES,Song WK,Jang HI.Evaluation of damage level for rock slopes using acoustic emission technique with wave guides.Engineering Geology 2011;121(1):75-88.
Dawson EM,Roth WH,Drescher A.Slope stability analysis by strength reduction.Géotechnique 1999;49(6):835-40.
Dixon N,Spriggs M.Quantification of slope displacement rates using acoustic emission monitoring.Canadian Geotechnical Journal 2007;44(8):966-76.
DL/T5353-2006.Design specifications for slope of hydropower and water conservancy project.Beijing,China:China Water Power Press;2006(in Chinese).
Duncan JM.State of the art:limit equilibrium and finite element analysis of slopes.Journal of Geotechnical Engineering 1996;122(7):577-96.
Eberhardt E,Spillmann T,Maurer H,Willenberg H,Loew S,Stead D.The Randa rockslide laboratory:establishing brittle and ductile instability mechanisms using numerical modelling and microseismicity.In:Proceedings of the 9th International Symposium of Landslides.Leiden,Netherlands:A.A.Balkema;2004.p.481-7.
ESG Solutions.ESG solutions:User’s guide.Kingston,Canada:ESG Solutions;2006.Ganer?d GV,Gr?neng G,R?nning JS,Dalsegg E,Elvebakk H,T?nnesen JF,Kveldsvik V,Eiken T,Blikra LH,Braathen A.Geological model of the ?knes rockslide,western Norway.Engineering Geology 2008;102(1-2):1-18.
Glazer S,Hepworth N.Seismic monitoring of block cave crown pillar-Palabora Mining Company,RSA.In:Proceedings of MassMin 2004,Santiago,Chile;2004.Hou DY.Application of acoustic emission technology on the stability analysis of Guanyinshan high slope.Subgrade Engineering 1989;3(1):34-8(in Chinese).
Hu YX.Earthquake engineering.2nd ed.Beijing,China:Earthquake Press;2006(in Chinese).
HydroChina Chengdu Engineering Corporation(HCEC).Engineering geological report on stability analysis of the right bank slope in Dagangshan hydropower station at Dadu River.Chengdu,China:HCEC;2009(in Chinese).
HydroChina Chengdu Engineering Corporation(HCEC).Special report on safety monitoring and stability feedback analysis of the left bank slope at Jinping first stage hydropower station along Yalong River,Sichuan Province.Chengdu,China:HCEC;2003(in Chinese).
Li JH,Wang GJ.The AE monitoring of stability on the high slopes of the Three Gorges permanent shiplock.Rock and Soil Mechanics 2001;22(4):478-80(in Chinese).
Li LC,Tang CA,Zhu WC,Liang ZZ.Numerical analysis of slope stability based on the gravity increase method.Computers and Geotechnics 2009;36(7):1246-58.
Li N,Qian QH.Four criteria of stability analysis and assessment of high rock slope.Chinese Journal of Rock Mechanics and Engineering 2010;29(9):1754-9(in Chinese).
Lian ZY,Han GC,Kong XJ.Stability analysis of excavation slope by strength reduction FEM.Chinese Journal of Geotechnical Engineering 2001;23(4):407-11(in Chinese).
Ma K,Tang CA,Li LC,Li H,Xu NW,Xiao P,Yang JY.Reinforcement effects of antishear gallery of Dagangshan right bank slope based on microseismic monitoring and numerical simulations.Chinese Journal of Rock Mechanics and Engineering 2013;32(6):1239-47(in Chinese).
Ma K,Tang CA,Xu NW,Li LC.The concluding report on microseismic monitoring project of right slope of Dagangshan hydroelectric station at Dadu River,Sichuan Province.Dalian,China:Dalian University of Technology;2012(in Chinese).
Mcgarr A.Some applications of seismic source mechanism studies to assessing underground hazard.In:Proceedings of the 1st International Congress on Rockburst and Seismicity in Mines.Johannesburg,South Africa:South African Institute of Mining and Metallurgy;1984.p.199-208.
Shiotani T.Evaluation of long-term stability for rock slope by means of acoustic emission technique.NDT&E International 2006;39(3):217-28.
Song SW,Xiang BY,Yang JX,Feng XM.Stability analysis and reinforcement design of high and steep slopes with complex geology abutment of Jinping I hydropower station.Chinese Journal of Rock Mechanics and Engineering 2010;29(3):442-58(in Chinese).
Spillmann T,Maurer H,Green AG,Heincke B,Willenberg H,Husen S.Microseismic investigation of an unstable mountain slope in the Swiss Alps.Journal of Geophysical Research 2007;112(B7).http://dx.doi.org/10.1029/2006JB004723.
Swan CC,Seo YK.Limit state analysis of earthen slopes using dual continuum/FEM approaches.International Journal for Numerical and Analytical Methods in Geomechanics 1999;23(12):1359-71.
Tang CA,Wang JM,Zhang JJ.Preliminary engineering application of microseismic monitoring technique to rockburst prediction in tunneling of Jinping II project.Journal of Rock Mechanics and Geotechnical Engineering 2010;2(3):193-208.Wan ZJ,Zhou CL,Ma WD,Dou LM,Zhu CZ.Experimental study on acoustic emission monitoring of slope’s stability.Rock and Soil Mechanics 2003;24:213-6(in Chinese).
Xie HP,Ju Y,Li LY.Criteria for strength and structural failure of rocks based on energy dissipation and energy release principles.Chinese Journal of Rock Mechanics and Engineering 2005;24(17):3003-10(in Chinese).
Xie HP,Peng RD,Ju Y.Energy dissipation of rock deformation and fracture.Chinese Journal of Rock Mechanics and Engineering 2004;23(21):3565-70(in Chinese).Xu NW,Dai F,Liang ZZ,Zhou Z,Sha C,Tang CA.The dynamic evaluation of rock slope stability considering the effects of microseismic damage.Rock Mechanics and Rock Engineering 2014;47(2):621-42.
Xu NW,Tang CA,Li H,Dai F,Ma K,Shao JD,Wu JC.Excavation-induced microseismicity:microseismic monitoring and numerical simulation.Journal of Zhejiang University:Science A(Applied Physics&Engineering)2012;13(6):445-60.
Xu NW,Tang CA,Li LC,Zhou Z,Sha C,Liang ZZ,Yang JY.Microseismic monitoring and stability analysis of the left bank slope in Jinping first stage hydropower station.International Journal of Rock Mechanics and Mining Sciences 2011;48(6):950-63.
Xu WY,Xiao W.Study on slope failure criterion based on strength reduction and gravity increase method.Rock and Soil Mechanics 2007;28(3):505-11(in Chinese).
Yan M,Miao F,Wang ST,Huang RQ.The application of acoustic emission monitoring to rock-mass stability study of Mabukan high slope.Journal of Geological Hazards and Environment Preservation 1998;9(1):29-33.
Yang YQ,Hou KP.Application of acoustic emission technology on the stability analysis of one open-pit slope.Express Information of Mining Industry 2008;11:102-4(in Chinese).
Zheng YR,Zhao SY.Application of strength reduction FEM in soil and rock slope.Chinese Journal of Rock Mechanics and Engineering 2004;23(19):3381-8(in Chinese).
Zhou HM,Sheng Q,Li WS,Xiao GQ.Excavation-disturbed zone and weaken degree of mechanical properties for rock mass of TGP shiplock slope.Chinese Journal of Rock Mechanics and Engineering 2004;23(7):1078-81(in Chinese).
Zhu WS,Cheng F.Constitutive model of energy dissipation and its application to stability analysis of shiplock slope in the Three Gorges Project.Chinese Journal of Rock Mechanics and Engineering 2000;19(3):261-4(in Chinese).
Zienkiewicz O,Humpheson C,Lewis R.Associated and non-associated visco-plasticity and plasticity in soil mechanics.Géotechnique 1975;25(4):671-89.
 Journal of Rock Mechanics and Geotechnical Engineering2015年5期
- Journal of Rock Mechanics and Geotechnical Engineering的其它文章
- Slope mass rating and kinematic analysis of slopes along the national highway-58 near Jonk,Rishikesh,India
- Investigation of meso-failure behaviors of Jinping marble using SEM with bending loading system
- Regressive approach for predicting bearing capacity of bored piles from cone penetration test data
- Prediction ofroadheaders’performance using arti fi cialneuralnetwork approaches(MLP and KOSFM)
- Experimental study of polyurethane foam reinforced soil used as a rock-like material
- Computing in-situ strength of rock masses based upon RQD and modi fi ed joint factor:Using pressure and damage sensitive constitutive relationship