
Analyses of Trawling Track and Fishing Activity Based on the Data of Vessel Monitoring System (VMS): A Case Study of the Single Otter Trawl Vessels in the Zhoushan Fishing Ground
2015-03-31 02:53:56WANGYangWANGYingbinandZHENGJi
WANG Yang, WANG Yingbin, and ZHENG Ji
?
Analyses of Trawling Track and Fishing Activity Based on the Data of Vessel Monitoring System (VMS): A Case Study of the Single Otter Trawl Vessels in the Zhoushan Fishing Ground
WANG Yang, WANG Yingbin*, and ZHENG Ji
,,316022,
The original purpose of Vessel Monitoring System (VMS) is for enforcement and control of vessel sailing. With the application of VMS in fishing vessels, more and more population dynamic studies have used VMS data to improve the accuracy of fisheries stock assessment. In this paper, we simulated the trawl trajectory under different time intervals using the cubic Hermite spline (cHs) interpolation method based on the VMS data of 8 single otter trawl vessels (totally 36000 data items) fishing in Zhoushan fishing ground from September 2012 to December 2012, and selected the appropriate time interval. We then determined vessels’ activities (fishing or non-fishing) by comparing VMS speed data with the corresponding speeds from logbooks. The results showed that the error of simulated trajectory greatly increased with the increase of time intervals of VMS data when they were longer than 30 minutes. Comparing the speeds from VMS with those from the corresponding logbooks, we found that the vessels’ speeds were between 2.5kn and 5.0kn in fishing. The cHs interpolation method is a new choice for improving the accuracy of estimation of sailing trajectory, and the VMS can be used to determine the vessels’ activities with the analysis of their trajectories and speeds. Therefore, when the fishery information is limited, VMS can be one of the important data sources for fisheries stock assessment, and more attention should be paid to its construction and application to fisheries stock assessment and management.
single otter trawls; Zhoushan fishing ground; Vessel Monitoring System (VMS); trajectory; fishing activity
1 Introduction
The original purpose of Vessel Monitoring System (VMS) is for enforcement and control of vessel sailing. This technology has also been used in fisheries for management control and enforcement to check whether a vessel is fishing in the area where the fishing operations are not allowed (Defra, 2004; Mills., 2004). This technology has been operated in fisheries around the world for several years (Drouin, 2001). With the development of science and technology as well as the decline of the world's major traditional fishery resources, some developed countries have started applying VMS for conservation and management of fishery resources. The European Union has brought VMS into fisheries management since 2002.
Data recorded from VMS include position, heading, speed, and date, They are increasingly used by scientist to study spatial and temporal patterns of fishing activity and fishing impact (Die and Ellis, 1999; Jennings and Kaiser, 1998; Piet., 2000), which have potential applications for the analysis of dynamics of fisheries (Fonseca., 2008), the impact of fishing effort, its high-resolution maps and the estimation of fishing effect on the sea bed (Deng., 2005), as well as providing information on the distribution of fishing resources (Mullowney., 2005). Therefore, VMS data are becoming a valuable information source for fishery researches.
Despite its importance, VMS has two shortcomings. Firstly, it provides no information on catch made by a vessel. However, catch and fishing trip-related information can be obtained from logbooks which usually record the times, locations, fishing types, species and catch. So logbooks provide a major source of data about the management of fishery production. By combining these two kinds of data, we can make the most use of VMS data on fishery stock assessment. Secondly, although VMS provides vessel navigation data 24h a day, it can only record data at intermediate time. In contrast, logbooks only provide data for fishing operation. To solve this problem, interpolation methods for the VMS data can be used to provide smoothed trajectories for vessels’ trawling operations and aid in assessment. Originally, linear interpolation was used to simulate vessels trajectories. However, VMS data are often recorded in a 1 or 2-h interval, which cannot meet the requirement of simulating the vessels’ trawling trajectory (Deng., 2005). Vessels are also most unlikely to fish along straight lines. Therefore, we need to use more advanced interpolation methods to obtain more smooth and accurate trajectories of fishing vessels. The acquired information from these methods allows more detailed research to understand spatial distributions of fishing effort and its impact on benthic organisms (Rijnsdrop., 1998; Kourti., 1998; Gerritsen and Lordon, 2011).
In some developed countries, there are some researches on interpolating trajectory of vessels (Deng., 2005; Mills., 2007; Fonseca., 2008). These interpolation methods can be broadly divided into two categories: the linear interpolation method and nonlinear ones such as spline interpolation.
The linear interpolation method can not only connect the continuous data points, but also deal with discontinuous data. It is the simplest and quickest interpolation method. Straight lines can be treated as fishing vessel’s trajectories when the time intervals are short (Eastwood, 2007). When the time intervals are long, the difference between the real trajectories and the substituted straight line ones will be large, and this will affect further analysis of fishing efforts. The linear interpolation method cannot take speed and heading into consideration. Thus, it can cause a large deviation between a simulative trajectory and a real trajectory. To alleviate the problems of linear interpolation, spline interpolation is commonly used. This method considers the complexity of the data structures and represents an efficient algorithm; it also takes heading and speed into account, and makes the greatest use of data (Hedger., 2008). The family of spline interpolation methods is large. Each of them has its advantages and disadvantages. Many spline functions need four data points to interpolate the trajectory between two successive points (Hu, 2011). Compared with linear interpolation which includes only two points, spline interpolation often performs betters in terms of the accuracy of interpolation (Li, 2007).
In China, there are two types of VMS data: one is obtained by Automatic Identification System (AIS), and the other is obtained by marine satellite. AIS, which was applied for sailing vessels in the 2000s, is an application with global positioning system (GPS), modern communication and computer technologies and other kinds of high-tech for sailing (Ye and Chi., 2012). China, as the A class member of International Marine Organization (IMO) and the signatory for ‘International Convention for the Safety of Life at Sea’ (SOLAS), seriously takes action to check the AIS equipment of vessels. In September 2008, Zhejiang province carried out a province-wide installation of AIS on fishing vessels to ensure the safety of fishing. Fishing vessels with main engine power higher than 44.1kW or length larger than 12 m had AIS installed. In Zhoushan, the automatic identification equipment based on the Class B technology has been installed in vessels.
AIS automatically exchanges dynamic information, including location, speed and heading, with vessels using the same type of the device, which can effectively prevent collisions. Meanwhile, it can also send the name, identification number, destination and other static information of a vessel to a basis station on the shore and receive warning information from it. When AIS is applied for fishing vessels, their trajectories can indicate their fishing behavior, from which we can analyze the distributions of fishing effort and fisheries resource. By using the AIS, it can improve the capability of a shore base station in the regulation of navigation and fishing of vessel.
At present, VMS is mainly used for navigation. No study has been reported on the use of VMS data for fisheries stock assessment in China. In this paper, we simulated the trawl trajectories using a cHs interpolation method based on the data from VMS, and selected appropriate time intervals to ensure the accuracy of the simulated trawl trajectories. We then combined the characteristics of fishing activities from VMS with vessel speed data from the corresponding logbooks to identify a vessel’s behavior (fishing or non-fishing). The research in this paper is important for further analysis about distribution of fishing effort and fishery impact, and it is also a useful approach for the fisheries stock assessment in data-poor or data-limited situations.
2 Materials and Methods
2.1 Data
We obtained VMS data from Zhoushan Fishery Bureau’s 8 randomly selected single otter vessels (‘Zhe Puyu 30018’, ‘Zhe Puyu 30019’, ‘Zhe Puyu 30020’, ‘Zhe Puyu 30095’,‘Zhe Puyu 32227’,‘Zhe Puyu 32228’,‘Zhe Puyu 32267’, and ‘Zhe Puyu 32316’) from vessels fishing in the Zhoushan fishing ground from September 2012 to December 2012. These data contain about 36000 data points. We also obtained the logbooks of the corresponding vessels, which include fishing time, date, location, fishing type, species and catch. The main fishing area covered 29?00′–31?33′N, 122?50′–125?30′E (Fig.1). The main engines of the vessels were between 235kW–353kW, which cover the power range of single otter trawls fishing in the Zhoushan fishing ground.
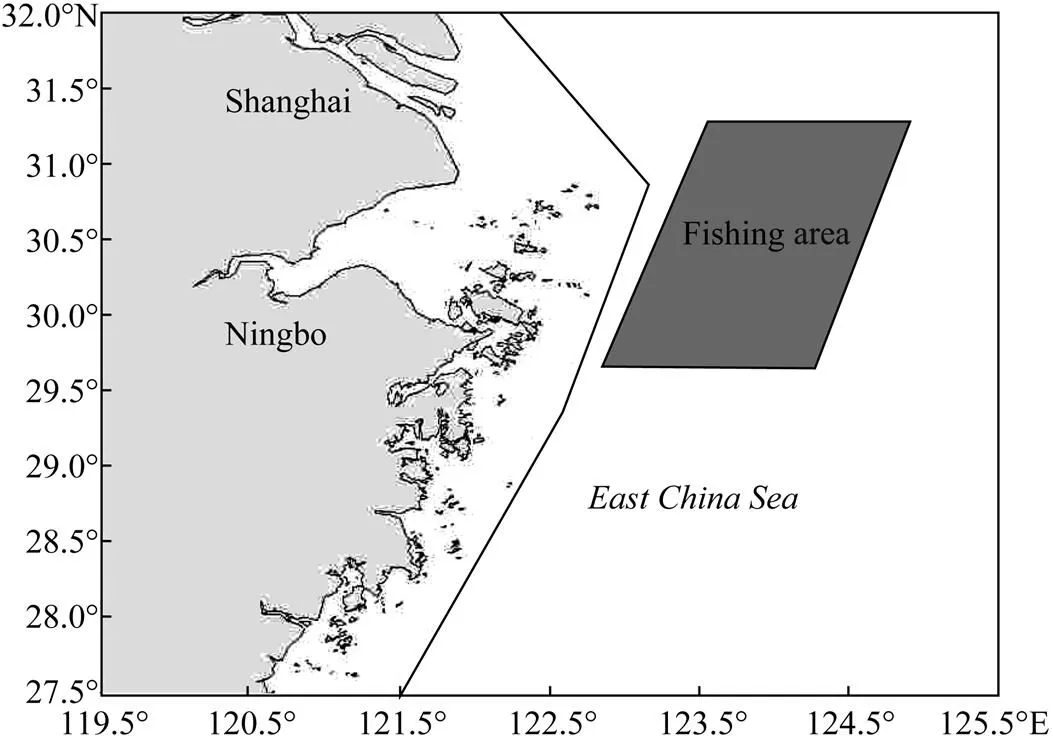
Fig.1 Fishing area of five sample single otter trawl boats. The solid line is the boundary of closed fishing area for bottom trawl fishery by motorboat.
2.2 Methods
2.2.1 Cubic Hermite spline (cHs) method
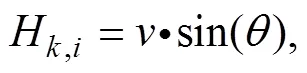
The cHs method can be used in the interpolation of discontinuous points. It is based on four polynomials and regards heading and speed as two points. Its interpolation curve passes all the data points, and constructs a simulative trajectory (Hintzen., 2010). Two polynomials are applied separately by cHs to describe the interpolation of latitude and longitude in relation to time. Each polynomial contains the combination of two control parameters, speed () and heading (). In the cHs calculations, we useHandHto describe longitudinal and latitudinal movement, respectively (Eq. (1)) (Hintzen., 2010):
Hand1are the vectors representing speed and heading in the longitudinal and latitudinal movement. With(0,1),0 means the stating position,1 means the ending position.
Eq. (2) describes the cHs in both longitude and latitude (represented by flon() and flat(), respectively), where0and1are two succeeding points, and represent the parameters at two control points, respectively. We assumed them as the starting point and the ending point, respectively (Hintzen., 2010).
,

where,is a processing parameter of interpolation, with(0.1)(Hintzen., 2010).
Fig.2 is the schematic representation of vessel’s trajectory between two succeeding points. The arrows represent the heading of vessel. They determine the curvature of the interpolation. More convex trajectories are caused by higher speed.
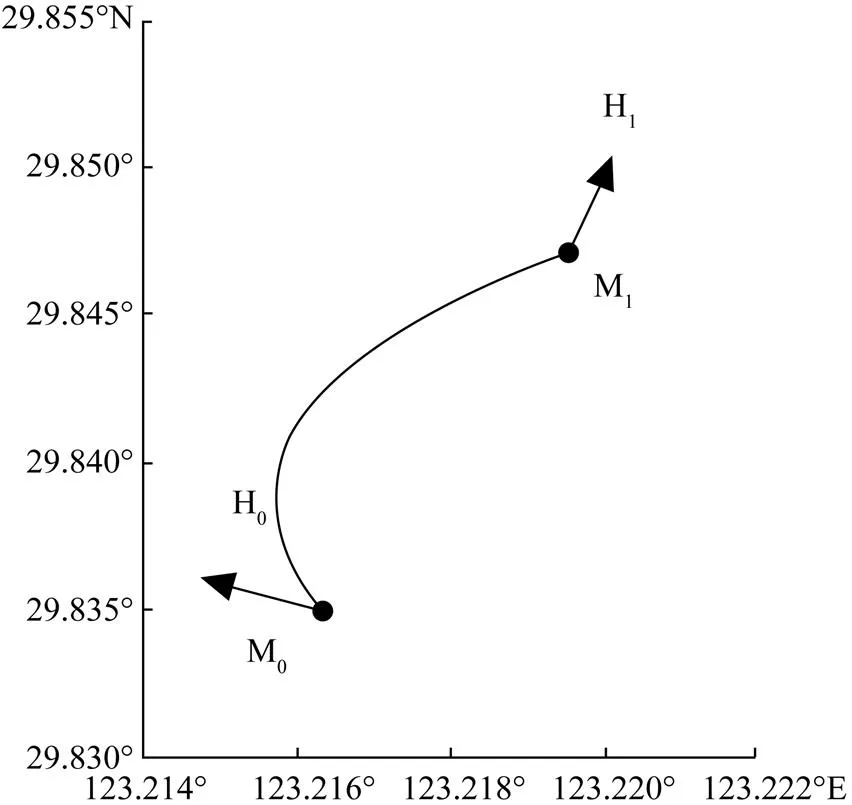
Fig.2 The vessel’s trajectory between two succeeding points.
2.2.2 Accuracy of interpolated trajectories at different time intervals
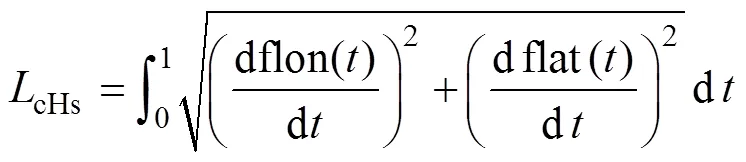
To obtain the characteristics of an interpolated trajectory at different time intervals, we compared the length of an interpolated trajectory with that of the real trajectory. The length of the cHs interpolation (cHs) can be calculated analytically (Eq. (3)). A data set with 5-min interval is assumed to be connected by straight lines, which is treated as the real trajectory. The length of the real trajectory (SL, see Eq. (5)) can be obtained by adding up all the lengths between two succeeding points (SL, see Eq. (4)).
(4)
, (5)
whereis the earth’s radius in kilometer and=6730km, (x1,y1), (x2,y2) are position coordinates recorded by VMS with 5 min interval.
In some studies, researchers often use the ratio of an interpolation area to the corresponding real trawling area to obtain the similarity between the interpolation and real fishing areas (Deng., 2005; Hintzen., 2010). Because vessels’ gear was stable, we used the percentage of simulation length to the corresponding real trajectory instead of the ratio of interpolation area to the corresponding real trawling area (see Eq. (6)) as follows:
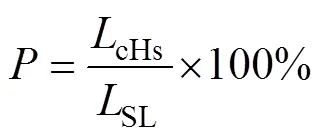
whererepresents the similarity betweencHsandSL. It is the ratio of interpolation to the corresponding real trajectory.
In this study, we carried out the exploratory analyses to obtain the distribution of original data with Excel, and used the interpolation tools in Matlab to obtain the simulative trajectory of data collected by VMS.
3 Results
Straight line interpolation (SL) is one of the simplest method that has been used in estimating fishing trajectories (Deng., 2005; Walter., 2007; Stelzenmuller., 2008). It can not only connect the succeeding points but also deal with discontinuity in data. Howerver, linear interpolation ignores additional information such as heading and speed, which indicate the trend of vessel’s track. That may lead to inaccuracy in fishing track recontructions, especially when the time interval of the VMS data is long with a longer time interval, vessels are not likely to be travelling along a straight line and the straight line interpolation may give incorrect estimates in track simulation.
Fig.3 shows the comparison of cHs interpolation, SL interpolation and real trajectory between two data points of one trip (when the time interval is 20min). Theaxis represents the latitude andaxis represents the longitude. The dash line represents the real trajectory of vessels, the solid line represents simulated trajectory using the cHs method, and the bold black line represents the linear inter-polation result. The trend of the solid line and that of the dash lines are similar and they accurately reflected the trajectory of vessels. The error of the interpolation will increase with the growth of numbers of data points. It means that the cHs interpolation method can give more accurate results. Hence, the cHs interpolation method is more useful than the linear method in predicting trajectories using data recorded by VMS.
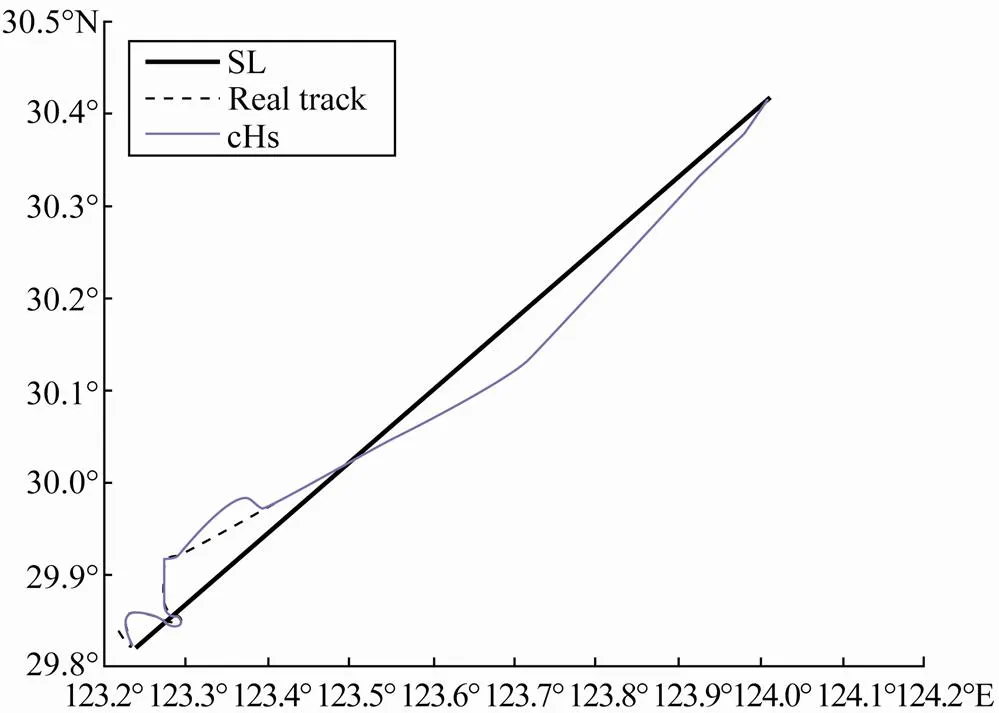
Fig.3 The comparison of real track, cubic Hermite spline (cHs) and straight line (SL) interpolation between two succeeding points when the time interval is 20min.
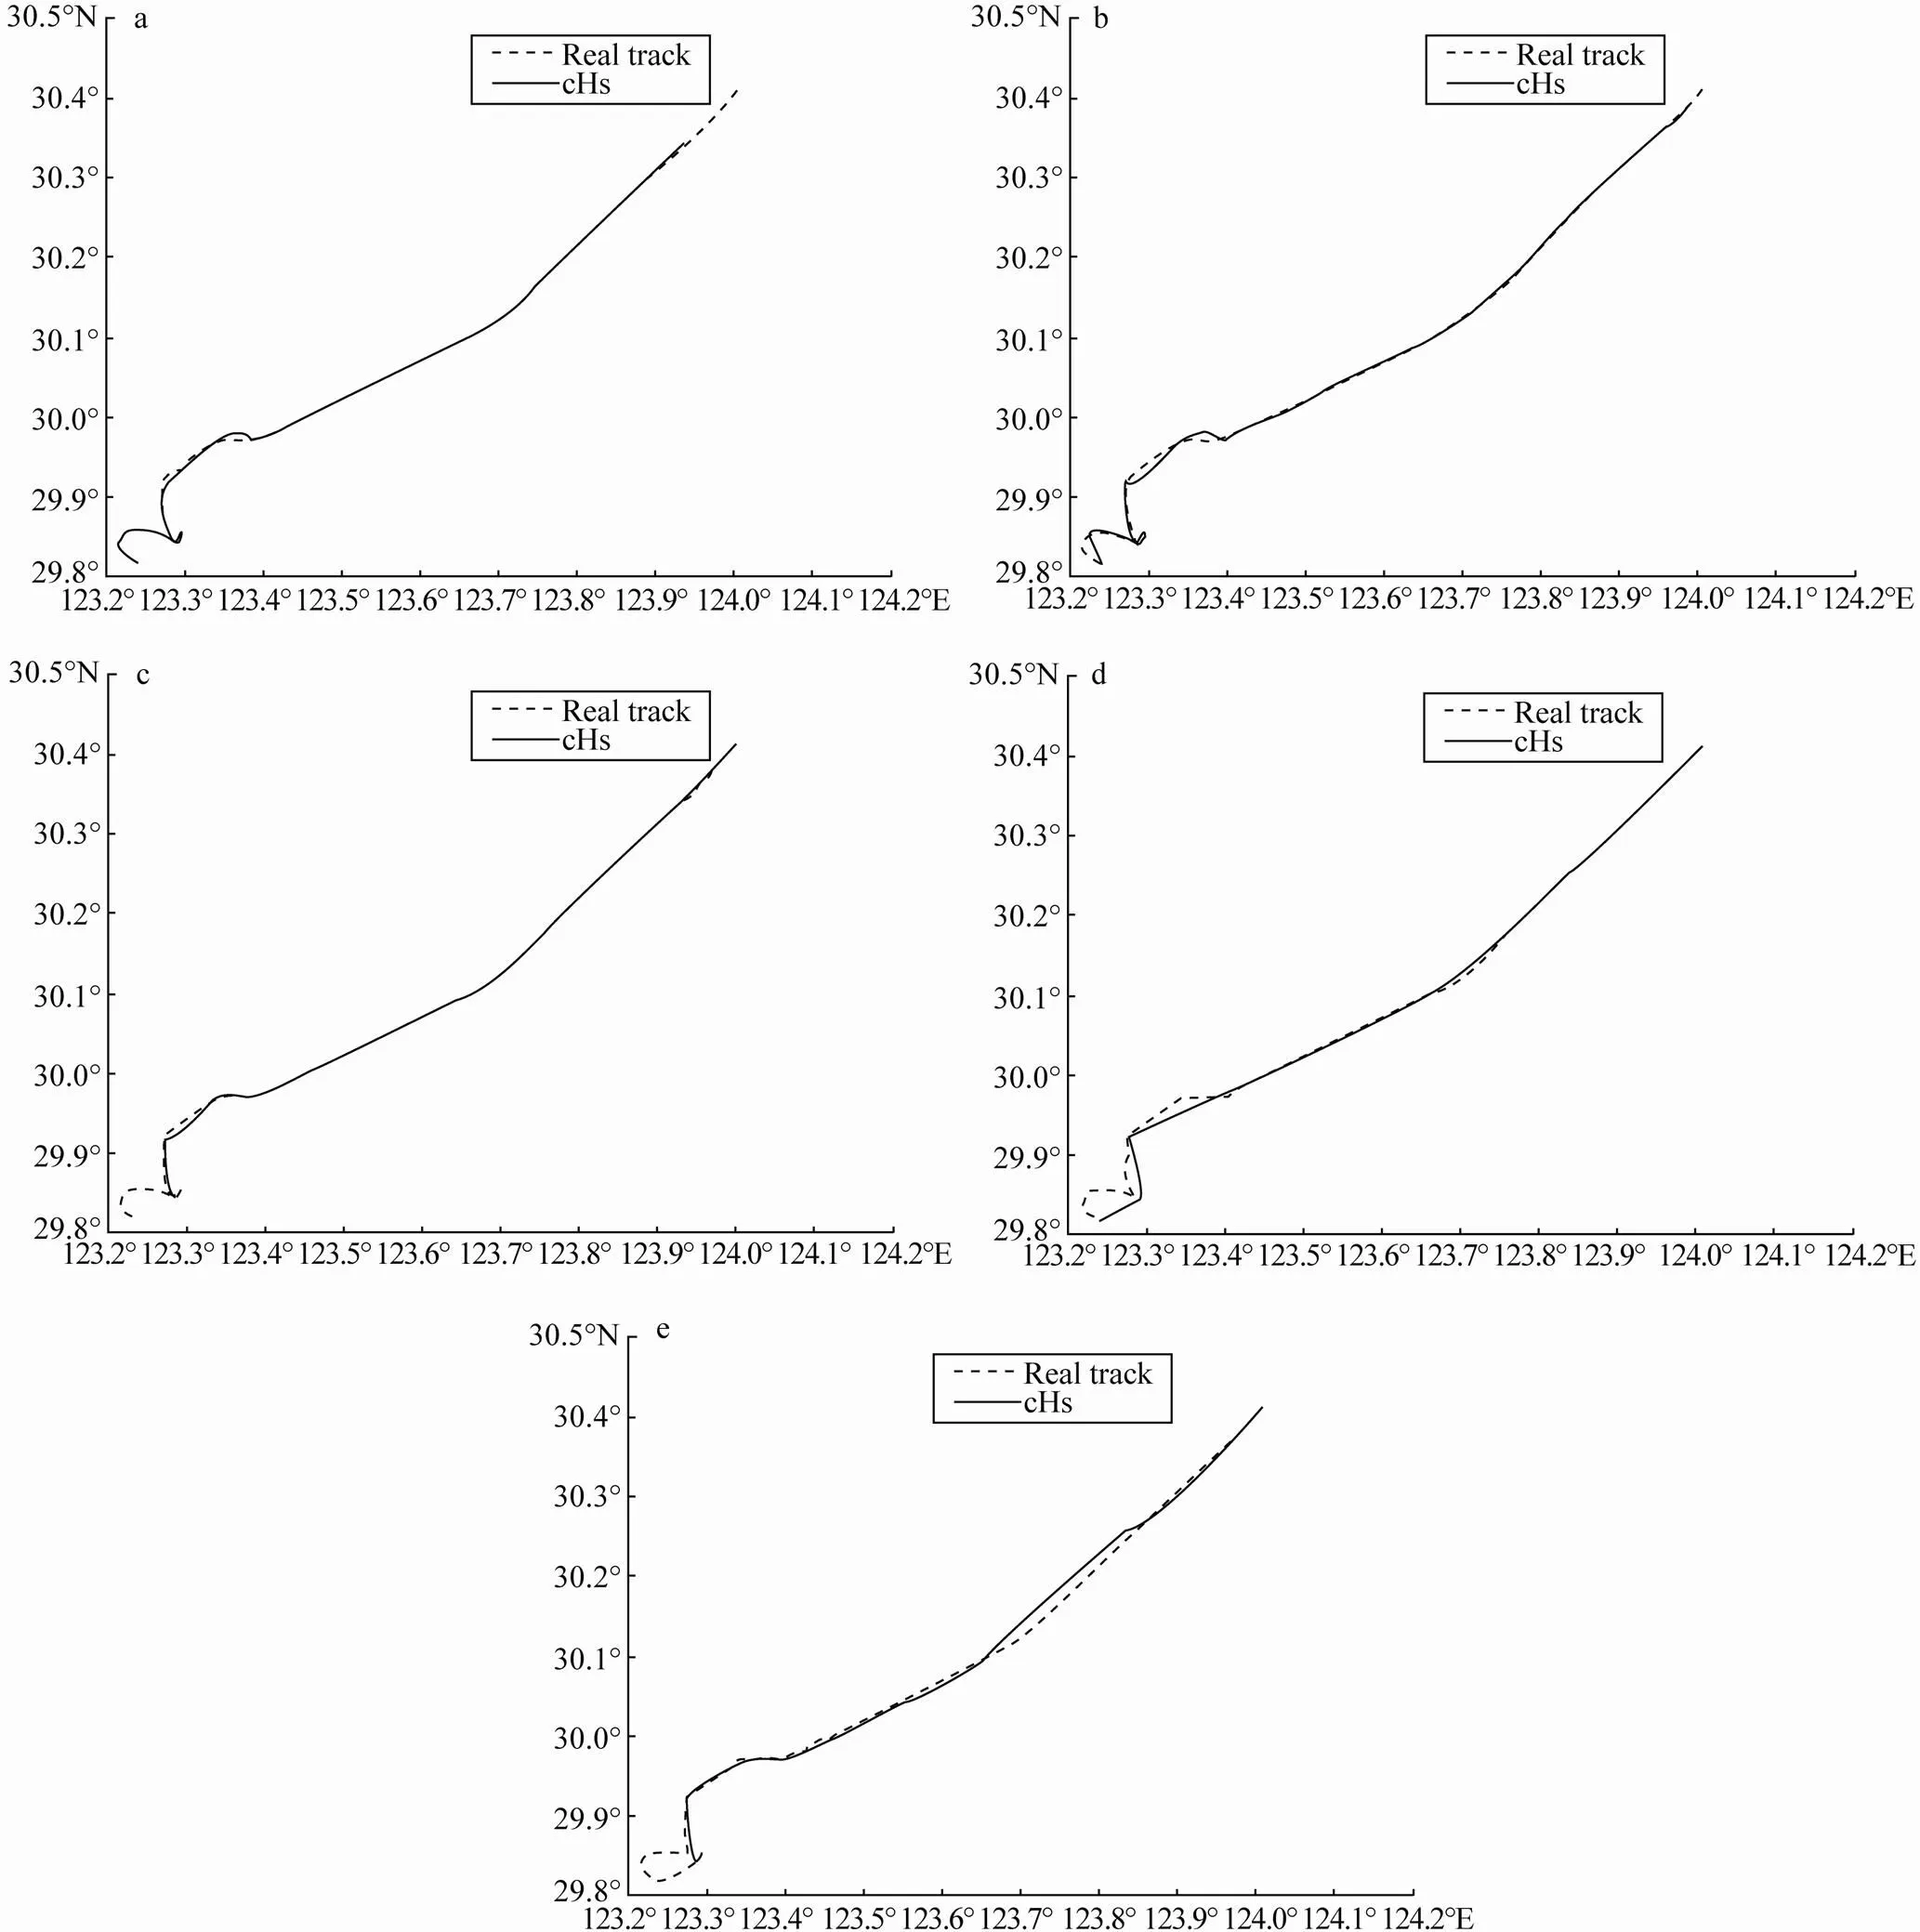
Fig.4 The real vessel’s trajectory and the simulated trajectory when the time interval is (a) 10, (b) 20, (c) 30, (d) 60 and (e) 120min. The solid line is the simulated trajectory and the dashed line is the real track.
Fig.4 shows the simulated trajectories using cHs interpolation method and the real tracks when the time interval increased successively from 10min to 120min. Theaxis represents the latitude andaxis represents the longitude. The ratios of cHs length to real track at the corresponding time intervals are shown in Fig.5. From these two figures, we can see that the difference between a real track and the simulated track increased with the increase of the time interval. The ratio of difference became higher irregularly with the increase of time interval. All the figures (Figs.4a–4e, Fig.5) show that all the simulated trajectories underestimated the real trajectories for all the time intervals considered, and the error increased with the length of time intervals, especially when the vessels were fishing in the area between 30?00′–30?24′N, 123?24′E– 124?00′E.

Fig.5 Ratios of the simulated trajectories to the real trajectories for different time intervals.
3.2 Determination of Fishing Activities
3.2.1 Determination of fishing activities by speed
VMS data cannot be directly used to indicate whether a vessel is fishing or not, which is a key factor to estimate fishing effort (Bastardie., 2010). Speed is usually used to classify fishing and non-fishing activities (Eastwood., 2007; Mullowney. 2009; Lee., 2012). We compared the percentage frequency distribution of VMS speed with the corresponding records in the logbooks to determine whether and when a vessel was fishing.
Percent frequency distributions of speed recorded by VMS were plotted (Fig.6). The speeds intervals were divided into 6 intervals (0.0–2.5kn, 2.5–5.0kn, 5.0–7.5kn, 7.5–10.0kn, 10.0–12.5kn, 12.5–15.0kn). These were then compared with percent frequency distributions of the logbook data (Fig.7). Logbook datasets contain information on the exact locations of fishing operations. According to the logbook data, the speeds recorded during the periods of fishing mainly concentrated in the interval at 2.5–5.0kn. In Fig.6, the percent frequency of speed at 2.5–5.0kn was about 15%. This is consistent with the observation that the speed of bottom trawler is usually lower than 6.5kmh?1(3.6kn, Murawski., 2005) and the speed at fishing activities falls within a narrow range (Plamer and Wigley, 2009). Comparing to the corresponding logbook data (Fig.7), we can infer that when speed is between 2.5kn and 5.0kn, a vessel can be considered as trawling.
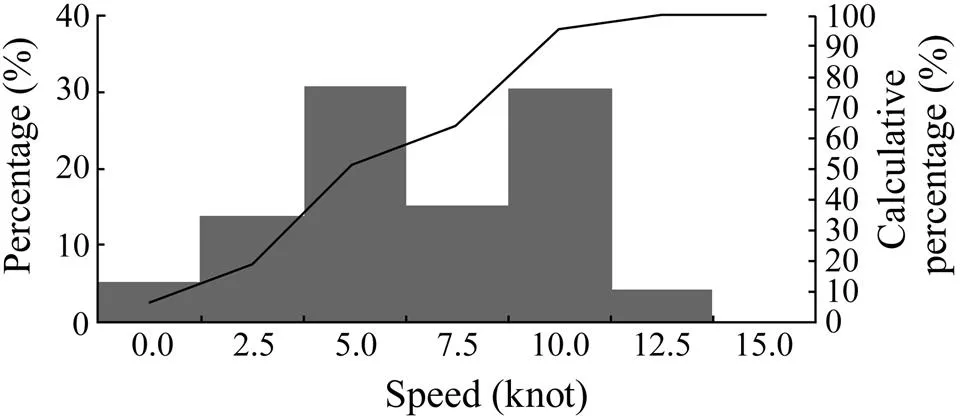
Fig.6 Percent frequency (bars) and cumulative percent distribution (line) of vessel speed as determined from Association for Information Systems (AIS) and marine satellite positions for single trawls.
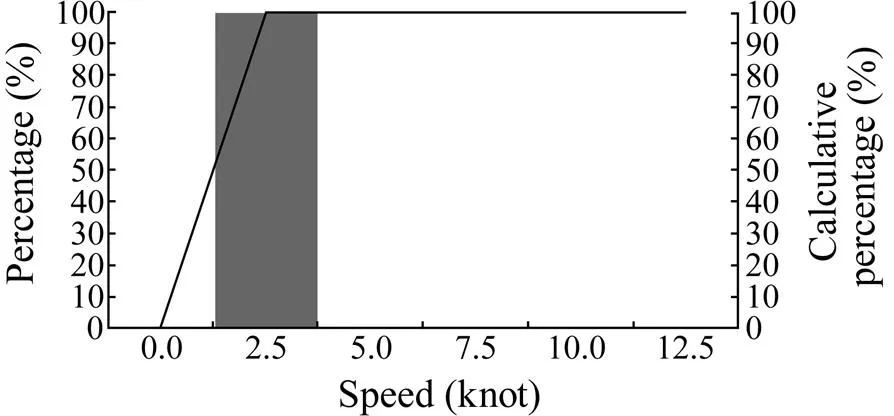
Fig.7 Percent frequencies (bar) and the cumulative distribution (line) of vessel speed as determined from logbook positions for single trawls.
3.2.2 Determination of fishing activities by trajectories
針對(duì)性強(qiáng) 交流深入 首屆國際水文監(jiān)測(cè)儀器設(shè)備推介會(huì)反響大…………………………………………………… 田靈燕(23.70)
Fig.8 shows some schematic fishing operations, in which the trajectory is separated into two parts: fishing and traveling. Theaxis represents the latitude andaxis represents the longitude. According to the characteristics of trawling fishing activities, when a vessel is fishing, it will go back and forth in an area frequently and will not leave for another area until the catch becomes low. As Fig. 8 shows, there is a straight line on the left side. It is a single line and not overlapped; it represents the trajectory when the vessel is steaming. Most trajectories overlap in the heavy rectangles, meaning vessels are back and forth frequently. This indicates that the vessels are fishing in the area of 30?00′–30?12′N, 124?30′–125?00′E.
When a single otter trawl vessel is fishing, the speed is relatively low (Ren and Yao, 2003). The solid lines show the speed interval to determine vessels’ activity. The speed is usually about 3kn, and its maximum speed does not exceed 6kn (generally between 2.5kn and 5kn) as indicated by the logbook data. By comparing the speeds recorded by VMS with those recorded by logbooks, we can easily verify whether vessels are fishing or not. Therefore, determining the fishing activities of vessels by speed is the simplest method. This method works well for VMS data which refer the same locations recorded on logbooks. It can successfully categorize almost 100% of fishing activities (Fig.9). However, because VMS covers larger area than logbooks, only relying on speed sometimes may underestimate a vessel’s activity. For instance, when a vessel slows down after steaming, its speed may be between 2.5–5.0kn. This situation may be easily treated as fishing if we can only read the speed from VMS when logbook data are unavailable. From Fig.9, we can see that this method also classifies 40.2% of other activities as fishing activity. By simulating the track, we can directly determine the vessels’ behavior without difficulty which may cause incorrect categorization by speed. Then the possibility of underestimates will be reduced and the fishing effort distributions can be learnt in any areas. Therefore, to ensure the accuracy of the estimate, we should combine the speed method with the simulated tracks to determine the vessels’ behavior.
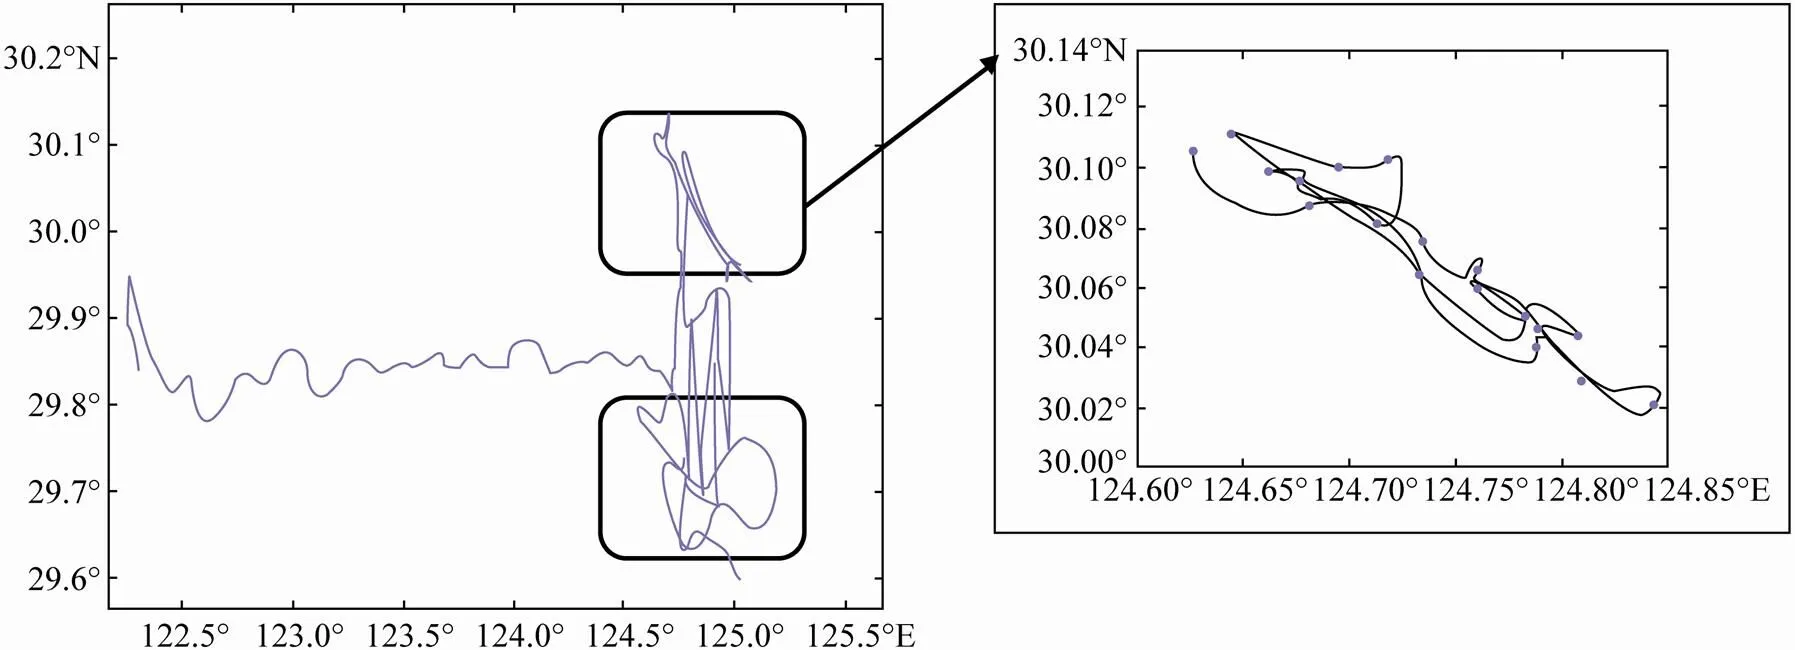
Fig.8 The determination of vessel’s behavior by track.
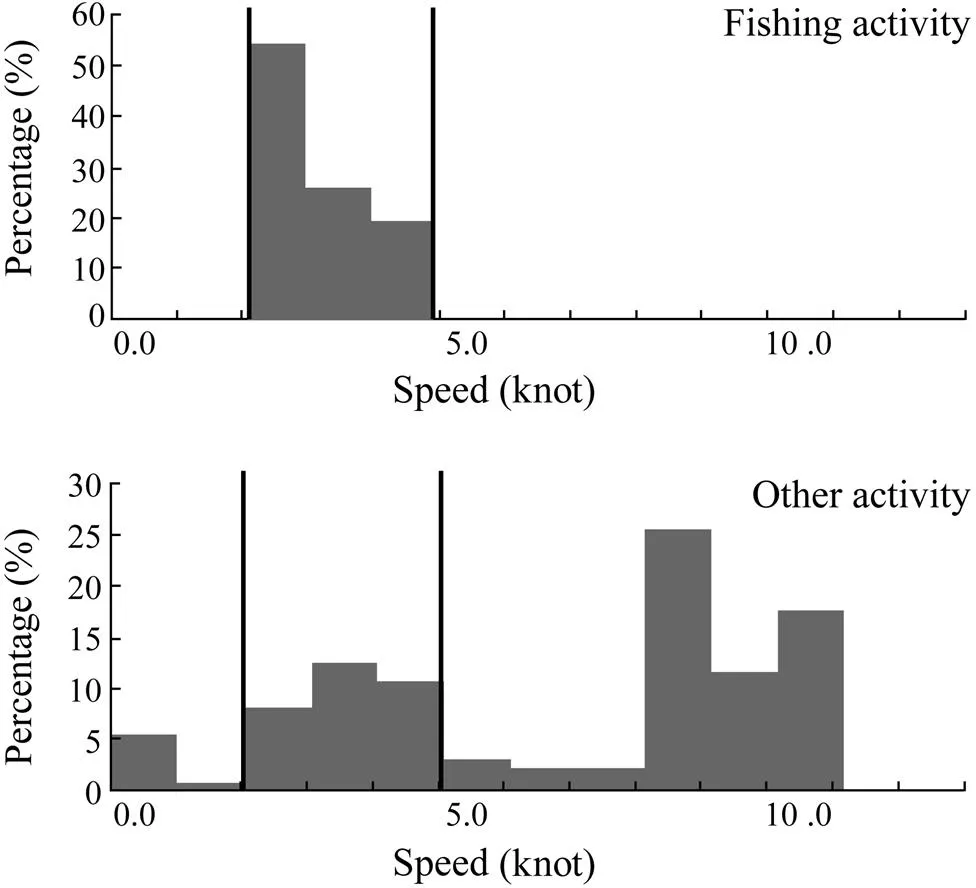
Fig.9 Percentage distribution of speed data treated as fishing or other activity recorded by VMS.
4 Discussion
As Fig.6 shows, the speed at 0.0–2.5kn is in the 5% of the entire speed interval. There are two reasons leading to the above result. Firstly, it may be a new fishing strategy in trawling fishing activity. For some experienced fishermen, they do this for waiting for the fish stocks to get a larger catch. Secondly, the vessel may be broken during fishing, and cannot move any longer or just float. Thus it will present speed of zero or very low speed. Besides, there are other two peaks at the speed interval of 5.0–7.5kn and 10.0–12.5kn. The data consisted of two parts, AIS data and marine satellite data. In this study, most of the VMS speed data was recorded by AIS. AIS only covered the waters west to 123?E, belonging to the closed fishing area for bottom trawl, which cannot engage in fishing activity. Therefore, the vessels almost go only along straight line in this area, and AIS usually records the speed when the vessels are departing from port, steaming or returning to port. The recording frequency of AIS increases with the increase of vessel’s speed. When a vessel is steaming, its speed is high, generally above 6kn. Thus the number of recorded AIS data will be large, and faster speed leads to higher frequency of AIS recording data. We assume that this part of the track follows the SL method, and we can obtain the approximate real track. Marine satellite covers the area on the east of 123?E, which is out of the closed fishing area for bottom trawl. Therefore, we used the speed data recorded by marine satellite to determine the vessels’ behavior and compared it with that from the speeds recorded by logbook to make sure whether vessels were fishing or not. Because the cost of transmission of AIS data is relatively low, there are large amounts of AIS data in the dataset. However, the data transmitted by marine satellite is very expensive, and the pulling frequency of marine satellite data is low, so the data bulk is not large. The time interval in marine satellite data may be long, and sometimes it may be almost 1–2h. The low frequency data may limit the precision in the fishing assessment. Therefore, stable and high frequency of marine satellite data are important to improve the application of VMS in fishery science.
According to Deng. (2005) and Walter. (2007), the effects of time interval infer that when vessels are fishing, their tracks are rarely along a straight line. Therefore, it is likely that linear interpolations cannot give the real trajectory. Furthermore, in the course of curve interpolation, different time intervals can also lead to different degrees of deviation of simulated track. In our study, all the trajectories in different time intervals were plotted for each of the simulated time intervals with cHs interpolation. Fig.4 shows that all the simulated trajectories deviate more or less from the real trajectories in all the time intervals. When the time interval was set within 30 minutes, the trajectory simulated by cHs interpolation was close to the real one (the difference between them was lower than 30%); however, when the time interval was longer than 30 minutes, it caused a serious bias. Therefore, the accuracy of the estimated results is dependent on the time intervals. Because the movement of vessels had many possibilities with their directions at the low pulling frequency, we could not define their exact movement in a long time interval and estimated their trajectories correctly. To ensure the accuracy of the interpolation, the pulling frequency collected by marine satellite should be controlled within 30 minutes.
By comparing the data of eight vessels fishing in the Zhoushan fishing ground recorded by VMS with the corresponding logbook data, we analyzed vessels’ speeds and trajectories. The logbook data can be treated as the basis to ensure the results of interpolation. In this research, we used the logbook data to validate the vessels’ behavior. We expect that by doing so for several years, we can use the VMS data without logbooks to determine the vessels’ behavior. Based on the daily and monthly VMS data, we can simulate the vessels’ track and make their fishing effort distribution map with the location and speed information. Then the main fishing area can be determined by analyzing the fishing effort map. With such a fishing effort distribution map, the abundance of fishery resource can be estimated and the change of fishery stocks can be predicted. Then the fishing impact on fisheries resource or the sea bed can be analyzed in the further study to provide the scientific basis for understanding the fishing impact on environment and ecosystem.
It is very important to have accurate data in fishery resource assessment. China brought in Vessel Monitoring System in the middle of 2000s (Cui., 2010), but only used it in fisheries research recently. The system is still not perfect; its data resource is unstable and the data component is complex. What’s worse, the pulling frequency of each component is uncertain. All these cases above make it difficult to estimate fishing resources accurately. The method used in this study provides a new choice to simulate the vessels’ track, though the interpolation is limited by the pulling frequency. Interpolating VMS records for fisheries with shorter haul duration requires a higher VMS record frequency. Developing a sound VMS for vessel which can achieve full coverage of coastal and offshore regions, and establishing a more standardized data management system to improve the accuracy of the data, will be beneficial to both fishery research and data collection.
5 Acknowledgements
We thank Dr. Huang Hongying for her help in the application of interpolation method. We also thank the anonymous reviewers for their constructive comments on the manuscript. This research is supported by the National Natural Science Foundation (No. 40801225), the Natural Science Foundation of Zhejiang Province (No. LY13D 010005) and Young academic leader climbing program of Zhejiang Province (grant number pd 2013222).
Bastardie, F. J., Nielsen, R., Ulrich, C., Egekvist,J., and Degel, H., 2010. Detailed mapping of fishing effort and landings by coupling fishing logbooks with satellite-recorded vessel geo-location., 106: 41-53,DOI:10.1016/j. fishers.2010.06.016.
Cui, X. F., Huang, X. S., and Wang, S. M., 2010. The design of Vessel Monitoring System., 37(1):67-72.
Defra,2004.. Department for Environment. Food and Rural Affairs, London, 1-139.
Deng, R., Dichmont, C., Milton, D., Haywood, M., Vance, D., Hall, N., and Die, D.,2005. Can vessel monitoring system data also be used to study trawling intensity and population depletion? The example of Australia’s northern prawn fishery., 62(3):611-622, DOI:10.1139/F04-219.
Die, D., and Ellis, N., 1999. Aggregation dynamics in penaeid fisheries:banana prawns (Penaeus merguiensis) in the Australian Northern Prawn Fishery., 50: 667-675, DOI:10.1071/MF98124.
Drouin, M., 2001.Vessel Monitoring Systems gain ground., 22: 31.
Eastwood, P.D., Mills, C.M., Aldridge, J. N.,Houghton, C. A., and Rogers, S. I., 2007. Human activities in UK offshore waters: An assessment of direct, physical pressure on the seabed., 64: 453-463, DOI:10.1093/icesjms/fsm001.
Fonseca, T., Campos, A., Afonso-Dias, M., Fonseca, P., and Pereira,J.,2008. Trawling for cedhalopods off the Portuguese coast–fleet dynamic and landings composition., 92:180-188, DOI:10.1016/j.fishres.2008.01.015.
Gerritsen, H., and Lordan, C., 2011. Inteagrating vessel monitoring systems (VMS) data with daily catch data from logbooks to explore the spatial distribution of catch and effort at high resolution., 65:245-252,DOI: 10.1093/icesjms/fsq137.
Hedger, R.D., Martin, F., Dodson, J.J., Hatin, D., Caron, F., and Whoriskey, F. G., 2008. The optimized interpolation of fish positions and speeds in an array of fixed acoustic receivers., 65 (7):1248-1259, DOI:10.1093/icesjms/fsn109.
Hintzen, N. T., Piet, G. J., and Brunel, T., 2010. Improved estimation of trawling tracks using cubic Hermite spline interpolation of position registration data., 101(1): 108-115,DOI: 10.1016/j.fishres.2009.09.014.
Hu, Y. H., 2011. The research on the optimized methods of geometric Hermite interpolation. Master thesis. Central South University, Changsha, 11-17.
Jennings, S., and Kaiser, M.J., 1998. The effects of fishing on marine ecosystems., 34: 201-352, DOI:10.1016/S0065-2881(08)60212-6.
Kourti, N., Shepherd, I., Greidanus, H., Alvarez, M., Aresu, E., Bauna, T., Chesworth, J., Lemoineg, G., and Schawrtz, G.,2005. Integrating remote sensing in fisheries control.12 (5): 295-307, DOI: 10.1111/j.1365-2400.2005.00452.x.
Lee, J., South, A.B., and Simon, J., 2012. Developing reliable, repeatable, and accessible methods to provide high-resolution estimates of fishing-effort distributions from vessel monitoring system (VMS) data., 4: 1260-1271, DOI: 10.1093/icesjms/fsq010.
Li, J. J., 2007. The research on the optimized methods of cubic geometric Hermite interpolation.Master thesis. Central South University, Changsha, 13-42.
Mills, C. M., Rogers, S. I., Tasker, M.L., Eastwood, P.D., and Piet, G.J., 2004. Developing the use of satellite fishing Vessel Monitoring System data in spatial management. International Council for the Exploration of the Sea. Annual Science Conference, Vigo, Spain.
Mills, C.M., Townsend, S. E., Jennings, S., Eastwood, P. D., and Houghton, C. A.,2007. Estimating high resolution trawl fishing effort from satellite-based vessel monitoring system data., 64:248-255,DOI: 10.1093/icesjms/fsl026.
Mullowney, D.R., and Dawe, E.G., 2009. Development of performance indices for the Newfoundland and Labrador snow crab () fishery using data from a vessel monitoring system., 100:248-254,DOI: 10.1016/j.fishres.2009.08.006.
Murawski, S.A., Wigley, S. E., Fogarty, M.J., Rago, P.J., and Mountain, D.G., 2005.Effort distribution and catch patterns adjacent to temperate MPAs., 62: 1150-1167, DOI:10.1016/j.icesjms.2005.04.005.
Piet, G. J., Rijnsdorp, A. D., Bergman, M. J. N., van Santbrink, J. W., Craeymeersch, J., and Buijs,J., 2000. A quantitative evaluation of the impact of beam trawling on benthic fauna in the southern North Sea.,57:1332-1339,DOI: 10.1006/jmsc.2000.0915.
Plamer, M. C., and Wigley, S. E., 2009. Using positional data from Vessel Monitoring Systems to validate the logbook-re- ported area fished and the stock allocation of commercial fisheries landings.,29:928-942,DOI:10.1577/M08-135.1.
Ren, Y. Q., and Yao, J., 2003. Statistical study on the action of collision avoidance of trawling vessel., 18 (1): 72-74.
Rijnsdrop, A.D., Buys, A. M., Storbeck, F., and Visser, E. G., 1998. Micro-scale distribution of beam trawl effort in the southern North Sea between 1993 and 1996 in relation to the trawling frequency of the sea bed and the impact on benthic organisms., 65:1081-1091,DOI: 10.1016/j.fishres.2009.08.006.
Stelzenmuller, V., Rogers, S. I., and Mill, C., 2008. Spatio- temporal patterns of fishing pressure on UK marine landscapes, and their implications for spatial planning and management., 65: 1081-1091, DOI:10.1093/icesjms/fsn073.
Walter, III, J. F., Hoening, J. M, and Gedamke, T., 2007. Correcting for effective area fished in fishery-dependent depletion estimates of abundance and capture efficiency., 64: 1760-1771, DOI: 10.1093/ icesjms/fsm147.
Ye, Y. M., and Chi, H. F., 2012. The application of AIS for vessel in Zhoushan., 12 (2): 13-14.
(Edited by Qiu Yantao)
DOI 10.1007/s11802-015-2467-6
ISSN 1672-5182, 2015 14 (1): 89-96
(August 27, 2013; revised November 4, 2013; accepted May 13, 2014)
. Tel: 0086-580-2265052 E-mail: yingbinwang@126.com
? Ocean University of China, Science Press and Spring-Verlag Berlin Heidelberg 2015
猜你喜歡
工會(huì)博覽(2022年14期)2022-07-16 05:48:06
少林與太極(2020年11期)2020-03-25 01:27:24
華人時(shí)刊(2019年23期)2019-11-17 18:10:42
消費(fèi)導(dǎo)刊(2018年11期)2018-08-13 10:54:44
計(jì)算機(jī)測(cè)量與控制(2017年6期)2017-07-01 16:24:21
中國水利(2015年8期)2015-02-28 15:13:12
江蘇第二師范學(xué)院學(xué)報(bào)(2014年6期)2014-04-16 03:10:42
機(jī)械制造與自動(dòng)化(2014年1期)2014-03-01 04:22:04
海峽姐妹(2014年5期)2014-02-27 15:09:21
化學(xué)分析計(jì)量(2013年3期)2013-03-11 16:37:26
 Journal of Ocean University of China2015年1期
- Journal of Ocean University of China的其它文章
- A Comparative Study of CART and PTM for Modelling Water Age
- Numerical Study of the Secondary Circulations in Rip Current Systems
- Effect of Anthracene on the Interaction Between Platymonashelgolandica var. tsingtaoensis and Heterosigma akashiwoin Laboratory Cultures
- Application of Numerical Simulation for Analysis of Sinking Characteristics of Purse Seine
- The Structure and Formation Mechanism of a Sea Fog Event over the Yellow Sea
- Molecular Cloning, Expression Pattern, and 3D Structural Prediction of the Cold Inducible RNA - Binding Protein (CIRP) in Japanese Flounder (Paralichthys olivaceus)