
Sulfur determination by laser ablation high resolution magnetic sector ICP-MS applied to glasses,aphyric lavas, and micro-laminated sediments
2015-01-17 09:25:33XuJieShuCinTyLee
Acta Geochimica 2015年3期
Xu-Jie Shu?Cin-Ty A.Lee
Sulfur determination by laser ablation high resolution magnetic sector ICP-MS applied to glasses,aphyric lavas, and micro-laminated sediments
Xu-Jie Shu1,2?Cin-Ty A.Lee1
Sulfur(S)is an important element for understanding redox processes,ore formation,environmental chemistry,volcanismandclimate.Here,wepresentamethod forinsituSconcentrationmeasurementbyLA-ICP-MSatthe 50–100 μm length scale using a 213 nm laser ablation set up coupled to a single-collector magnetic sector ICP-MS with high resolution capabilities.Analyses were performed in medium mass resolution(m/Δm=3000)mode,which allows for the separation of32S and34S from molecular interferences.S is simultaneously analyzed along with all major and minor elements so that a priori knowledge of an internal standardconcentration isnot necessary;thisallows for insitu bulkanalysisofaphyricgroundmassinvolcanicrocksorother fne-grained samples.The primary limitation in analyzing S bylaser ablationwas foundtobelong-terminstrumentaldrift in fractionation of elemental S relative to other elements, presumably due to drift in laser dynamics.A method for correcting for such fractionation over time was implemented. Aftercorrectingforsuchdrift,measurementsofhomogeneous basaltic glasses are reproducible to within 10%for high concentration samples(>500 ppm)and to within 20%for low concentration samples(<200 ppm).The applicability of the method was demonstrated using natural and synthetic glasses,aphyric lavas,and micro-laminated sediments.
Sulfur·Icp-ms·Glass
1 Introduction
In this paper,we outline a method for in situ bulk measurement of S at the 50–100 μm lengthscale by laser ablation inductively coupled plasma mass spectrometry(LAICP-MS).We also develop new glass reference materials and provide new concentration measurements of existing reference materials,calibrated against gravimetric S standards determined by solution ICP-MS(Erdman et al. 2013).Our interest in in situ bulk measurements by LAICP-MS is motivated by the importance of S to redox,ore deposits,environmental chemistry,volcanic gases,and climate(Alt 1995;Alt et al.2012,1993;Burgisser and Scaillet 2007;De Hoog et al.2004,2001;Jego and Dasgupta 2013;Jugo 2009;Lee et al.2012;Mavrogenes and O’Neill 1999;Metrich and Mandeville 2010;O’Neill and Mavrogenes 2002;Self et al.2008;Wallace 2005;Wallace and Edmonds 2011).Whole-rock analysis of S is wellestablished using combustion,titration or dissolution of rock powders,followed by analysis using spectrophotometers or mass spectrometers.Sample masses as low as 30 mg can now be analyzed by these whole-rock methods. For a nominal density of~2.7 g/cm3,this means that whole-rock analyses(via microdrilling)could in theory provide S concentration determinations at the 3–4 mm lengthscale or larger.In cases where the sample is smaller, such as in the case of melt inclusions,or when one desires to avoid the effects of alteration,in situ determination may be necessary.The best established techniques for in situ determination of S are secondary ion mass spectrometry (SIMS)and electron probe micro-analysis(EPMA).These methods require homogeneous samples at the<20 μm scale and have become the standard method for measuring the S content of volcanic glasses,particularly melt inclusions hosted within phenocrysts.There is,however,a needfor measurements at intermediate lengthscales because many samples of interest(authigenic materials,sediments, and the majority of aphyric volcanic rocks)are heterogeneous on the tens of microns lengthscale.
Laser ablation inductively coupled plasma mass spectrometry(LA-ICP-MS)offers the potential for measuring S contents at lengthscales of 20–100 μm and is well-established as a sensitive and rapid analytical method for in situ measurement of trace elements in geological materials(Lee etal.2009;Liuetal.2008;Longerichetal.1996).Rareearth elements,large ion lithophile elements,high feld strength elements,and frst row transition metals are convention. Measurement of S concentration by LA-ICP-MS,however, has not been fully developed.The main limitations in measuringSconcentration byLA-ICP-MSaretheavailabilityof well-characterized standards,molecular interferences on all the S masses,and instrumental drift(Ripley et al.2011).In particular,because laser ablation is destructive,existing S referencematerials,suchasmid-oceanridgebasalt(MORB) glasses,are in dwindling supply.This paper discusses these complications and how we overcome them.
2 Analytical methods
The primary focus of this study was to measure major and trace elements concentrations in situ by LA-ICP-MS at Rice University.We used a New Wave 213 nm laser ablation system coupled to a Thermo-Finnigan Element 2 magneticsector ICP-MS.Ablation was performed with a circular spot size of 110 μm in diameter,15 J/cm2fuence,and a repetitionrateof10 Hz.Theablatedmaterialwascarriedoutofthe ablationcellwithHegas(850 mL/min)andthenmixedwith Ar gas before entering the ICP-MS(cool gas of 13.33,auxiliarygasof0.95andsamplegasof0.8 L/min).Sensitivityin low mass resolution(m/Δm~300)was~30,000 cps per ppm of La for a spot size of 55 μm.Sensitivity in medium mass resolution(m/Δm~3000)was~3000 cps per ppm of La for a spot size of 55 μm.In order to resolve32S,33S,and34S from molecular intereferences,measurements were made in medium mass resolution mode(m/Δm=3000). Thismassresolutionissuffcientenoughtoseparate32S,33S, and34Sfromthedominantmolecularinterferences16O16O+,16O17O+,and16O18O+(Fig.1).Sensitivity for sulfur in medium mass resolution was 1000 cps/ppm for 55 μm diameter spot size,15 J/cm2fuence,and a repetition rate of 10 Hz.The following masses were analyzed in our general protocol:23Na,25Mg,27Al,30Si,31P,32S,33S,34S,39K,43Ca,45Sc,48Ti,49Ti,51V,52Cr,55Mn,57Fe,59Co,60Ni,63Cu,66Zn,69Ga,73Ge,74Ge,89Y,91Zr.Becauseweanalyzedinmedium massresolutionwheresensitivitiesare lower,allsignalsizes were within the linear range of the detector.In addition,the concentrations of elements in our external standards were similartotheconcentrationsinthesamplestowithinanorder of magnitude,so no corrections for non-linearity were needed.Mass spectrometry protocols were as follows:8 samples per peak,0.001 s sampling time(in E-scan),0.03 s magnetic settling time,and 100%mass window.The time foronecyclewas3.5 s,andatotalof50cycles,including10 cycles with the laser off,were measured.Long term drift of masscalibrationwascorrectedforinrealtimebymonitoring the mass offset of the40Ar40Ar+dimer before everymeasurement and correcting the total mass calibration accordingly.Small systematic deviations from the mass calibration were corrected for by calculating the mass offset of the peak relative to the actual mass of the isotope of interest.Laser ablation analyses were done in time-resolved mode(Fig.2),beginning with a~30 s background acquisition(laser off),followed by a 3–4 min ablation interval, and ending with another~30 s background acquisition. Reference glass standards were run before and after each sequence of samples(approximately every 2 h).Most measurements represent spot analyses.When line scans were performed,a scan speed of 15 μm/s was adopted.
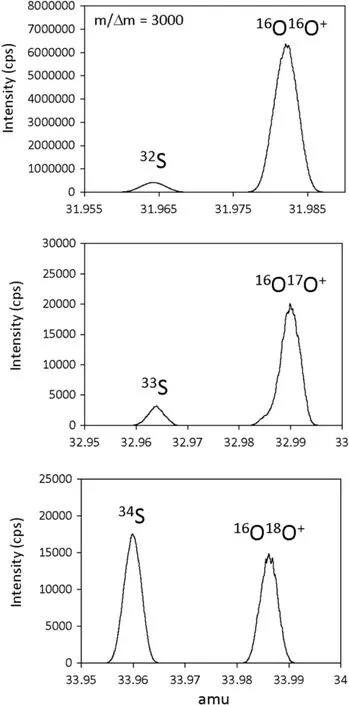
Fig.1 Mass scans of S isotopes and nearby molecular interferences in medium mass resolution mode(m/Δm=3000).Note that in these scans,no attempt was made to refne the mass calibration of the magnet,so measured mass does not correspond exactly to the actual mass of a particular nuclide

Fig.2 Example of a timeresolved signal for laser ablation inductively coupled plasma mass spectrometry(LA-ICPMS),including background and sample analysis
3 External standards and samples
Samples utilized in this study include both synthetic and natural glasses.These include synthetic United States Geological Survey Hawaiian basalt glass(BHVO-2g)and Columbia River basalt glass(BCR-2g),mid-ocean ridge basalt(MORB)glasses from the Smithsonian Museum collection(Melson et al.2002),natural rhyolitic obsidian glasses M3-86,M3-79 and M3-33 from the Oregon Cascades(Savov et al.2009),synthetic S-bearing colored glasses manufactured by Bullseye Glass(001322-0003-FP001 and 000203-0003-F-P005;www.bullseyeglass.com) and synthetic S-bearing amber-colored glass from a Bud LightTMbeer bottle(Anheuser-Busch)and a Saint Arnold’s beer bottle(a local Texas brewery).BHVO-2g,BCR-2g were used simultaneously as external standards for all elements(Gao et al.2002)except for S.
We used established MORB glasses as external standards for S.Reported concentrations of S by EPMA,SIMS or LA-ICP-MS for VG2(from Juan de Fuca ridge,Jarosewich et al.1979;Thornber et al.2002)are shown in Table 1:1403±31 ppm(1 SD for all the errors,O’Neill and Mavrogenes 2002),1340±80 ppm(Dixon et al. 1991),1420±40 ppm(Wallace and Carmichael 1992),1400 ppm(Nilsson and Peach 1993),1365±29 ppm (Thordarson et al.1996),1450±30 ppm(Metrich et al. 1999),1416±36 ppm (De Hoog et al.2001),and 1300±44(Bell et al.2009).Reported values for A99 are 177±21 ppm(De Hoog et al.2001),135±50 ppm (Cameca trace routine),200±50 ppm (CSIRO trace routine;Thordarson et al.1996),170±30 ppm(Dixon et al.1991),and 155±9 ppm(Bell et al.2009).It can be seen that interlaboratory values for VG2 vary by~11% (1300–1450 ppm) and those for A99 by ~48% (135–200 ppm).The higher variability for A99 is almost certainly due to diffculties in measuring S at such low abundances.In this study,we use VG2 as an external S standard.

Table 1 Published S concentrations of MORB glass standards
4 Data reduction
4.1 Internal and external calibration
Sample signal intensities were converted to concentrations using a combination of external and internal standards following the basic principles outlined in Longerich et al. (1996).For external calibration,we used VG2 for S and USGS BHVO-2g and BCR-2g for all other elements(Gao et al.2002).To correct for slight variations in ablation effciency between samples and external standards,an internal standard was monitored.In general,the internal standard is usually chosen to be an element that occurs in suffcient quantity in all samples and standards and whose concentration is known independently.However,in the case of sample unknowns,prior knowledge of the concentration of an internal standard is not necessary if all major and minor elements are analyzed,as shown below (Lee et al.2008;Liu et al.2008).
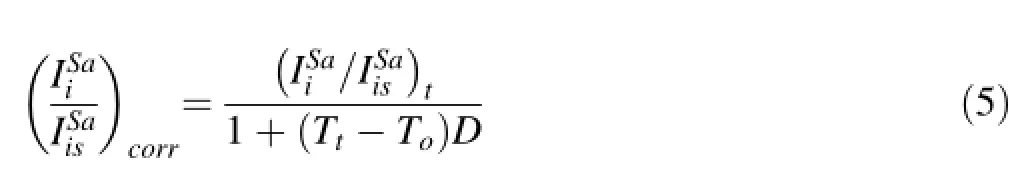
Data reduction proceeded as follows.We frst averaged the pre-ablation background signal for each element.This background signal was then subtracted from every ablation signal to obtain a background-corrected signal,which is the quantity we refer to from here on.To convert sample signal intensity(cps)to concentration(ppm)for an element i,e.g.,,the following equation was used
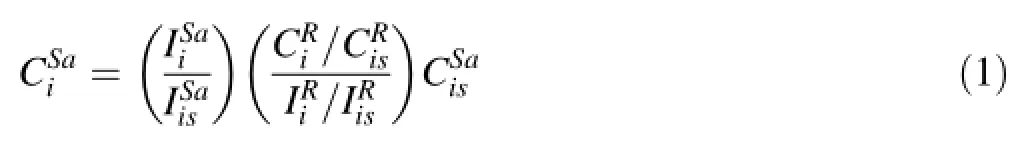
The frst parenthesized quantity corresponds to the measured background-corrected signal of an element i in the samplenormalized to the signal of the internal standard is in the sample.The second parenthesized quantity essentially represents the external calibration, whereinis the concentration ratio of element i to the internal standard in the external standard andis the signal ratio of element i to the internal standard signal in the external standard.When using more than one external standard for calibration,the second parenthesized quantity represents the slope of the concentration versus signal intensity calibration curve.Finally,the last quantity on the right isis the concentration of an internal standard in the sample.The internal standard concentration in the sample and the external calibration factor must be known to convert sample intensities into concentrations.
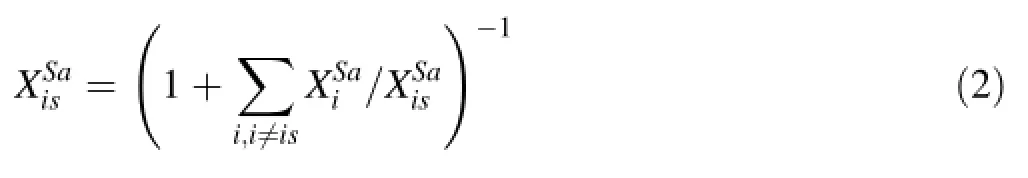
Determining the concentration of the internal standard in a sample was done by analyzing all major and minor cations and assuming their oxides sum to 100%.We measured Na,K,Ca,Mg,Al,Si,P,Mn,Fe and Ti and assumed their oxides correspond to K2O,CaO,MgO,Al2O3,SiO2, P2O5,MnO,FeO and TiO2.All Fe was taken to be in the +2 valence state,so an uncertainty is introduced if some fraction of the total Fe is Fe3+.Because we do not measure H2O or other volatiles,concentrations are thus estimated ona volatile-free basis.The assumption here is that S is not a major element because we are interested primarily in silicates.Signal intensities for a given element were converted to effective oxide intensities by(1)dividing by the isotopic abundance fraction of the monitored isotope,(2)dividing by the number of cations per oxide formula unit(e.g.,to convert Al to Al2O3,divide by 2 Al/Al2O3)and(3)multiplying by the molecular weight of the oxide.Then the following algorithm was performed.The assumption that all major and minor oxides were determined gives,whereis the oxide weight fraction of element i and the summation is over all oxides.Dividing by a reference cation,,which we take here to be our internal standard and re-arranging yields
The oxide weight fraction ratios are calibrated against external standards using Eq.1 after converting elemental signal intensities to effective oxide signal intensities as described above:
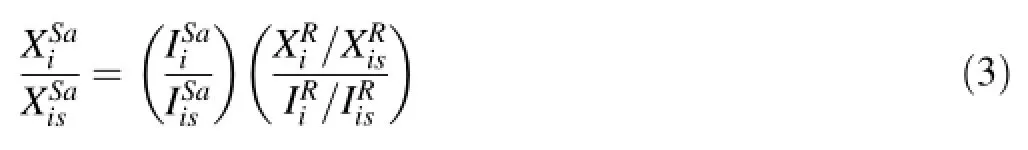
Equation 3 is then plugged into Eq.2 to obtain XSais. Then Eq.1 is used to determine absolute concentrations of all oxides and elements.While the above equations are designed for the analysis of trace S in silicate materials,it is trivial,with a little thought,to modify the above equations to accommodate materials,such as sulfdes and sulfates,in which S is a major element.
4.2 Long-term drift in elemental fractionations
An implicit assumption of reducing LA-ICP-MS data is that relative sensitivity between elements does not change, even if the absolute sensitivity of the instrument drifts with time or between samples.However,in our study,we found that measured elemental ratios drift with time,especially the ratio of S with respect to other elements.For example, raw S/Mg signal ratios drift by 15%over the course of 5 h, whereas ratios of other elements relative to Mg drifted by no more than 5%.Presumably,the effect on S is more pronounced because S is volatile,but we do not see any drift in S/Mg signal during a single analysis,that is,there is no downhole elemental fractionation.We fnd that these long-term drifts do not appear to be related to changes in the gas background associated with accumulation of materials on the side walls of the tubing or ablation cell because we observe no change in gas background signal during the day or from day to day.More likely,the longterm drifts in elemental fractionation,especially that of S, are probably related to long-term drifts in gas fow dynamics of the ablation cell or laser fuence,although we cannot be certain.
What is important is that S/Mg fractionation factors drifts linearly on long timescales(>1 h)so that regardless of what is causing the drift,a drift correction can be made. In Fig.3,we show that S/Mg signal ratios drift for all samples.In particular,we show that all samples display the same relative rate of drift to within error,regardless of S concentration.For example,VG2 and MORB 2380-12 have S concentrations>1000 ppm and BHVO-2G,BCR-2G and A99<300 ppm S,but they exhibit the same relative drift in S/Mg intensity ratios.These observations indicate that the relative rate of drift is not dependent on S concentration,matrix effects,or accumulated memory effects.To correct for drift in elemental fractionation,we adopt the following protocol,which we applied to S and all other elements.We defne the relative rate of change of an elemental ratio D as

Fig.3 Elemental fractionation drift with time.a Change of32S/25Mg background-corrected signal ratios(cps/cps)over time,which shows a linear increase in32S/25Mg ratio with time.b Change of32S/25Mg normalized to initial32S/25Mg showing that relative drift is constant regardless of S concentration and S/Mg ratio

Tois the clock time at which a given sample was initially measured and Ttis the clock time at which the same sample was later measured.Ideally,the difference in time between the two measurements(Tt-To)should be long enough to bracket an interval over which a number of samples were measured,but not so long that the relative drift rate has changed.For our studies,the appropriate time difference was~2–3 h.The other symbols in Eq.4 represent the signal ratios measured at time Ttand To.D can be determined by measuring the same sample at the beginning and end of an analysis period.In practice,D is determined by measuring many different samples and then averaged to generate a universal D.Because Eq.4 does not require knowledge of absolute concentrations,D can be determined from external standards as well as sample unknowns, although materials with high S content (>800 ppm)are preferable so as to establish a statistically signifcant D.


Fig.4 External standard calibration of32S/25Mg before and after correction for drift in elemental fractionation
4.3 Limit of detection and precision
Limit of detection(LOD)is the minimum signal that can be resolved from the background.We defne the LOD as three times the standard deviation of the background signal 3σback,normalized to the sensitivity of the instrument during each measurement.This is given by

Internal precision(in-run precision)is defned by the standard deviation of the ratio of a given signal normalized to the signal of the internal standard mass.External precision for individual spot measurement is quantifed by multiple analyses on the same sample,assuming the sample is homogeneous.
5 Results
5.1 Data quality and standardization using VG2

Fig.5 Externalreproducibility (1 SD)as a function ofS concentration

Table 2 Volcanic glasses

Table 2 continued
We measured32S,33S and34S,but the signal to background ratio of33S was too low to evaluate,owing to its low isotopic abundance.The LOD for a 110 μm diameter spot is 10 ppm for32S and 20 ppm for34S,low enough to analyze most geological materials.External precision is controlled by instabilities in the instrument,laser ablation system,and natural heterogeneity.External RSD values decrease from~25%for samples with<100 ppm S to<10%for samples with>1000 ppm S(Fig.5).For high concentration samples,external reproducibilities are not as good as those reported for electron microprobe analysis (<5%),but for low concentrations,external reproducibilities are comparable or better than electron microprobe analysis(10–50%)as can be seen by comparing Tables 1 and 2.

Fig.6 Volcanic glasses.a Plot of S(ppm)versus FeOtotal(wt%)in various glasses.Each point represents the mean value of several repeat measurements.Error bars represent external reproducibilities (1 SD).b S concentration versus MgO(wt%)versus S in MORB glasses
We used MORB glass VG2 for external calibration. We adopted a value of 1378 ppm,representing the average of literature-compiled data in Table 1.MORB glass A99 was not used for calibrations because of the need for large extrapolations when analyzing high S content materials.Literature compiled values of S for A99 range between 96 and 200 ppm.Calibrated against 1378 ppm S in VG2,our measurements give a value of 187±29 ppm for A99.
5.2 Sulfur in rhyolite and MORB glasses
Sulfurconcentrationsin3rhyoliteand17MORBglassesare shown in Fig.6 and Table 2.The rhyolite glasses have 58–94 ppm S while the MORB glasses have 960–1660 ppm except for sample A99.External reproducibilities for the rhyolites are 16–22%(1 RSD).Most MORB glasses show less than 10%external RSD although some show RSDs as low as 3%.Higher RSDs of 16%may thus refect sample heterogeneity.
In Fig.6a,we plot S contents of rhyolites and MORBs againsttotalFeOcontentdeterminedbylaserablation.Itcan be seen that most samples,including the rhyolites,defne a positivecorrelationbetweenSandFeO.Afewsamples,such as MORB A99 as well as Hawaiian basalt BHVO-2g,fall well below the array.The positive correlation is consistent with the fact that S solubility at sulfde saturation correlates with total FeO content because Fe-sulfde complexesincrease S solubility in the melt(Mavrogenes and O’Neill 1999;Perft et al.1983).The variation in FeO is due to crystal-liquid fractionation,indicating that MORBs are sulfde-saturatedorquicklybecomesulfde-saturatedsoonafter leaving their mantle source regions and differentiating. Those samples with anomalously low S for a given FeO content likely lost S by degassing.

Fig.7 S and Cu contents in an aphyric vesiculated alkali basalt from the Sierra Nevada, California(USA).a,b represent spatial variation of S as a function of distance along the transects.Locations of bubbles are denoted.c,d show S versus Cu and FeOtotal.Lack of correlation indicates that Cu remains unaffected by S degassing


5.3 Sulfur in aphyric groundmass of basaltic lavas
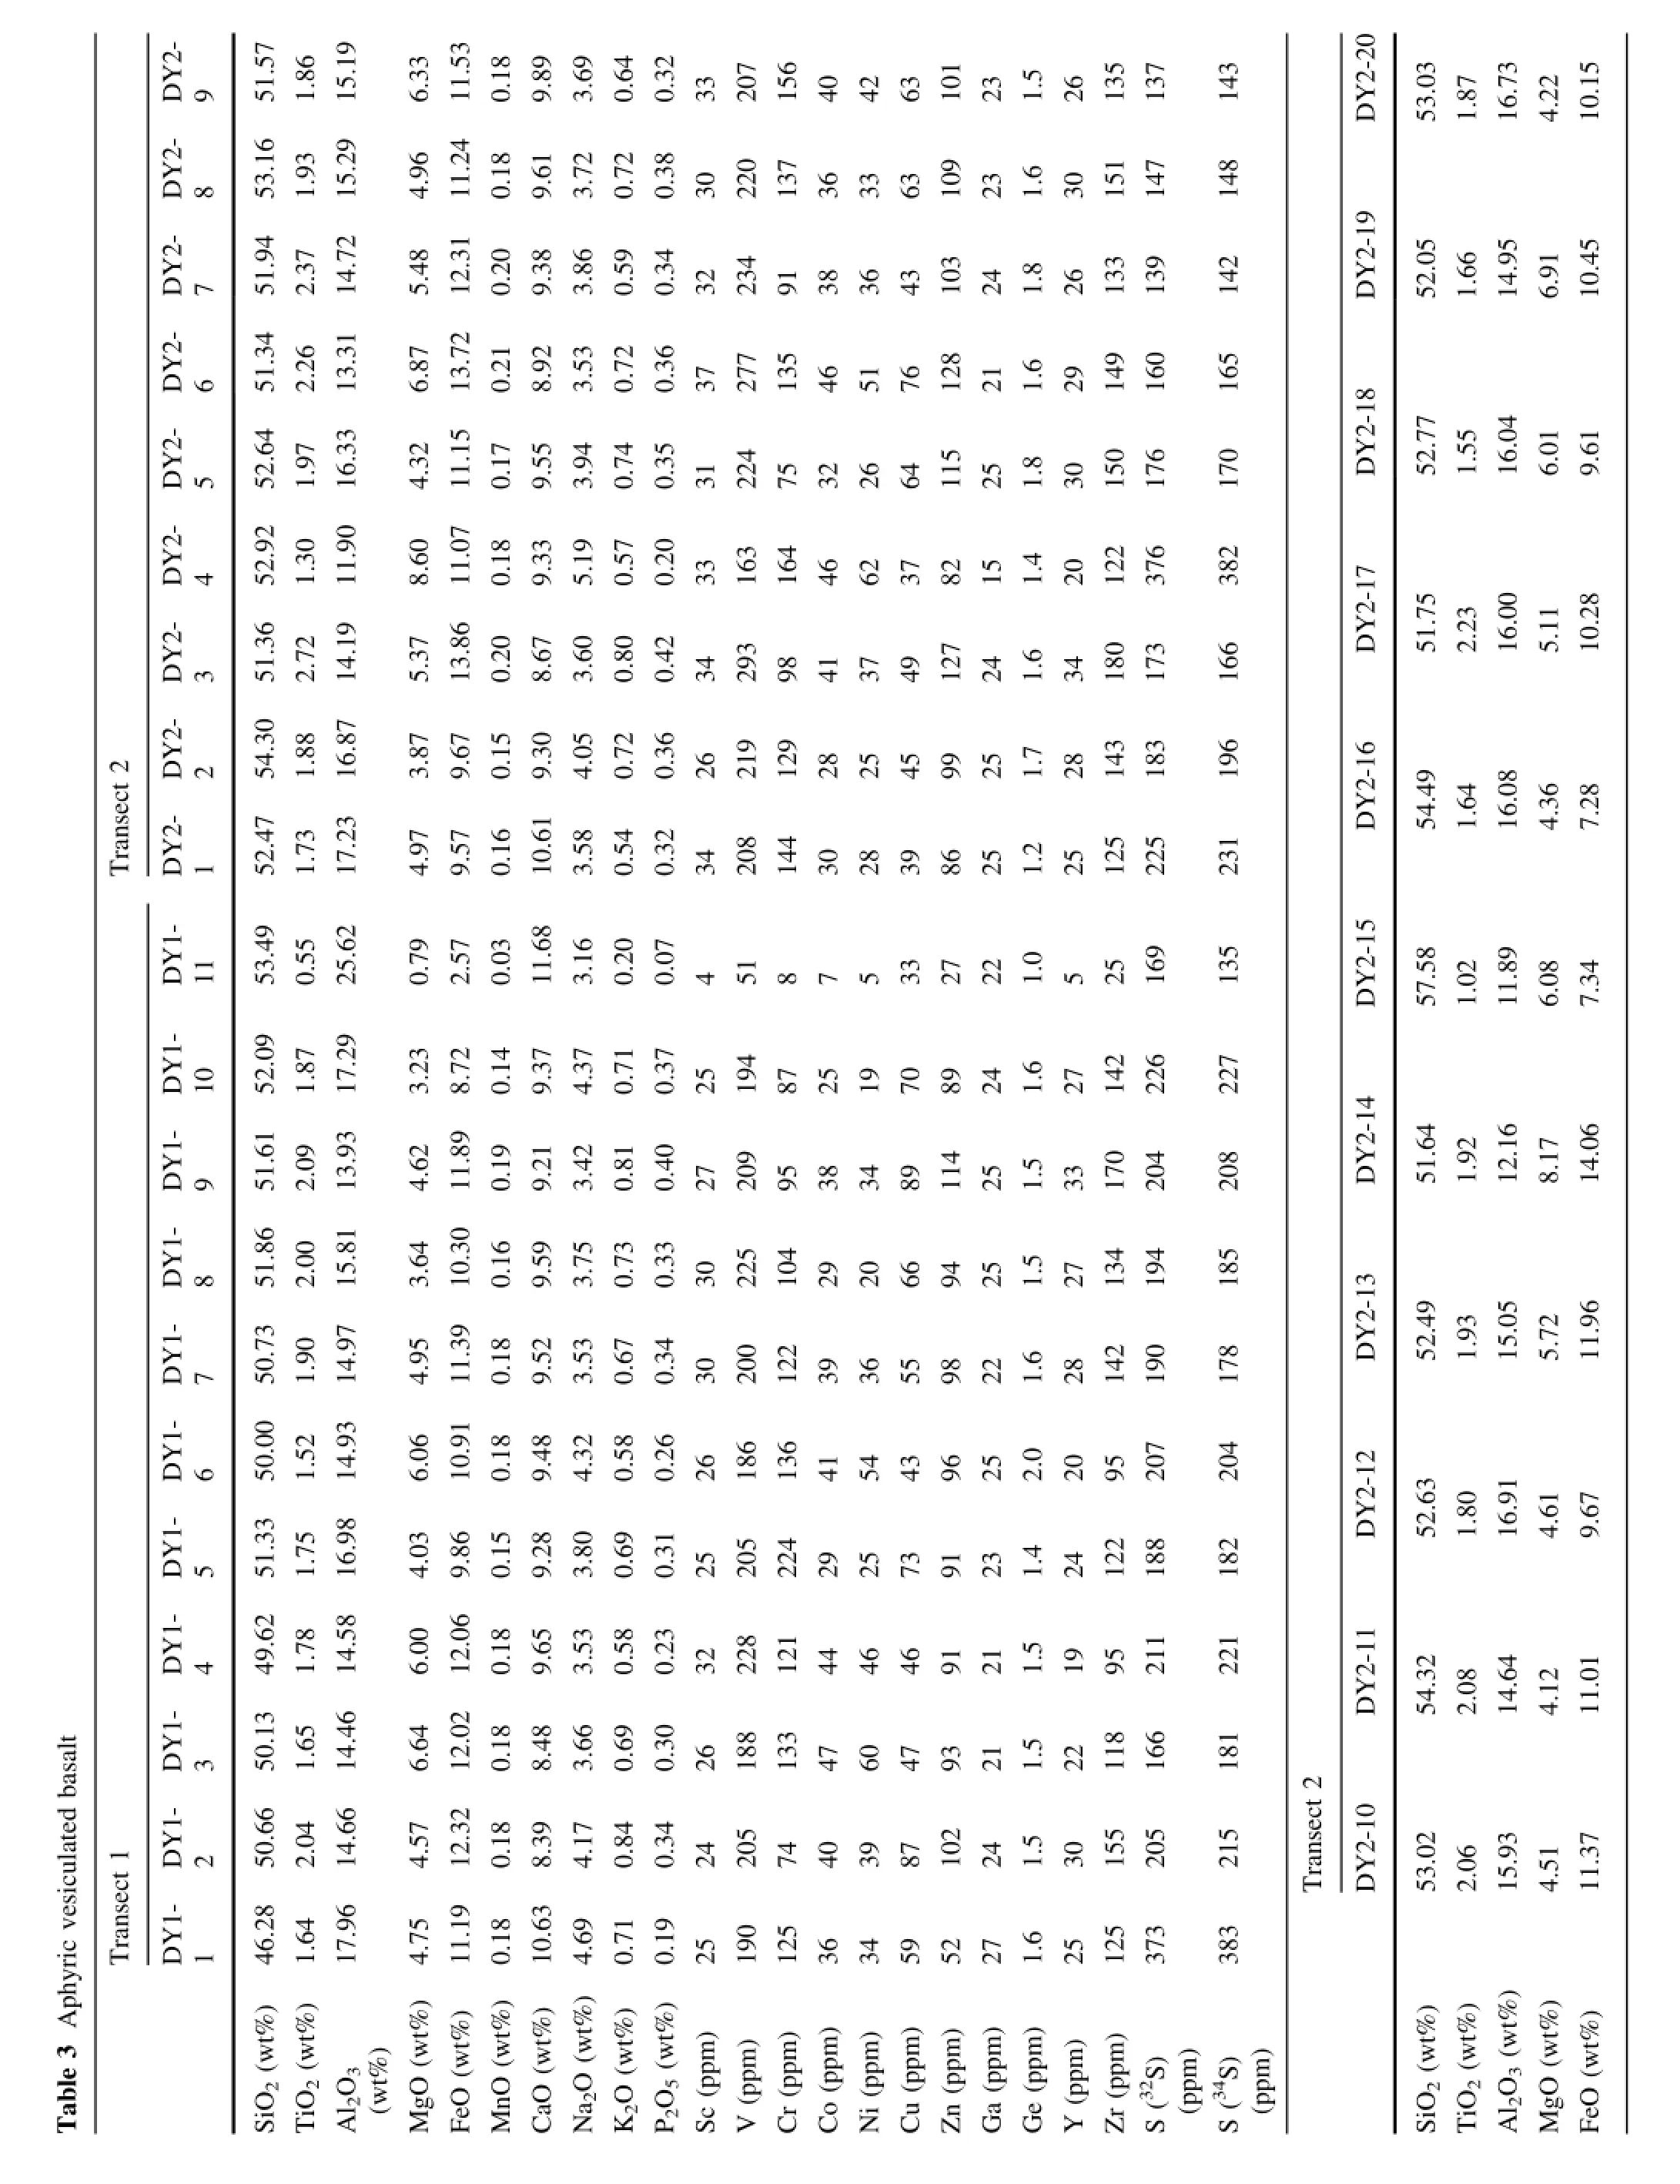
Although laser ablation holds no advantage over electron probe micro-analysis in analyzing homogeneous samples, such as glasses,the ability to perform in situ bulk sampling by laser ablation may be useful when the S content of aphyric groundmass in lavas is desired.The amount of S remaining in erupted lavas or shallowly intruded magmas is often used to quantify how much S has degassed during emplacement(Self et al.2008),provided some estimate of undegassed S content is known(this is usually taken as the S content at sulfde saturation).To date,most S measurements are done by whole-rock analyses,but lava fows are commonly subjected to weathering and alteration,especially in highly vesiculated samples.These post-emplacement processes could lead to addition or leaching of S.In situ methods may allow one to quantify S in small areas of the rock that have not been altered.To explore this,we analyzed S in a vesiculated basalt with an aphyric groundmass,consisting of microlites and microphenocrysts less than 30 μm in diameter.
In Fig.7 and Table 3 we show two line traverses across a basalt thin section(DY1,an ultrapotassic lava fow from the Owens Valley,California).The traverses were designed to explore how S varies with distance from high permeability areas,such as the vesicles.S contents are mostly around 200 ppm,indicating that at least 80%of the S has degassed.We note that concentrations as high as 400 ppm are found near vesicle walls.This could imply that external S has been added to the basalt via the vesicles.Alternatively,the S on vesicle walls could represent a fraction of the S degassed into the vesicles,but a more dedicated study is necessary to evaluate this possibility.For completeness, we show that Cu,simultaneously analyzed with S,does not correlate with S.Cu is strongly controlled by the presence of sulfde,so the lack of correlation suggests that any sulfdes present have already broken down(resulting in volatile loss of S)or most of the S was originally dissolved in the silicate magma,but was lost by degassing.
5.4 Micro-laminated sediments
Another application of this method is the fne-scale elemental mapping of micro-laminated sediments.We examined an organic rich marl from the mid-CretaceousEagleford Shale(near the Cenomanian-Turonian boundary),sampled by Lee from the Lozier Canyon section in Terrell County,Texas.This marl is intercalated by numerous discrete volcanic ash layers associated with mid-Cretaceousmagmatic fareup in the Sierra Nevada batholith towards the west(Lee et al.2013).The ash layers are nearly always recessive whereas the marls tend to form resistant layers.Our objective was to examine the fnely laminated marl layers to quantify whether such layers also contain ash.This was done by performing a continuous realtime 50 mm long line transect with a 110 μm laser spot size(10 Hz repetition rate and 10 J/cm2power)at a velocity of 15 μm/s.Signal intensities were converted to concentrations using methods outlined above(see also Lee et al.2009).To correct for concentration/dilution effects associated with variations in sample density(caused by variations in porosity and crack density),all elements were normalized to Ca.Select elemental transects are shown in Fig.8,where we have also normalized to the long-term average so that all elemental ratios can be plotted on the same scale.To reduce some of the inherent instability of the measurements,a 15 point running average was applied. Variations in the marl and detrital components can be seen in the variations of Al/Ca ratio among other elemental ratios.Figure 9,shows individual data points(15 point running average)of elements normalized to Ca.It can be seen that K,Al,and Si are highly correlated and their regression parameters intersect zero to within error.Such behavior indicates that the marls represent simple mixtures between pure limestone and a detrital component.In contrast,even though Mg/Ca and Al/Ca are well correlated, there is a non-zero Mg/Ca intercept,indicating that the pure limestone contains a small amount of Mg.More surprising is the correlation of Fe/Ca and Zr/Ca versus Al/Ca. These elements,especially Zr,are not expected to be enriched in clays.Zr is more likely associated with volcanic ash or zircons,but the lack of Zr spikes in the transect suggest that such Zr is not related to the presence of zircon grains.We note that the Si/Al ratio(Fig.9b)defned by our data matches that of dacites/rhyolites rather than basalts and andesites and/or pure clay components,providing additional support for an ash component even in the fnely laminated marls.It is in this context where our S measurements may be interesting.In Fig.9f,it can be seen that S/Ca is weakly correlated with Al/Ca(and by inference with K,Si,Zrand Fe as well).We do not know how to interpret this preliminary data,but such a correlation at frst seems surprising because volcanic ash(or any detrital component),which consists of silicates and oxides primarily,is not expected to have much S.We thus interpret the S-Al correlation as possible evidence that precipitation of S,in the form of sulfde in these organic C rich marls, must be enhanced in the presence of volcanic ash,which may serve as a nutrient(Censi et al.2010;Lee et al.2013). More work is necessary to explore the signifcance of this correlation,but this study highlights the potential for using laser ablation to S microstratigraphy.

Fig.8 Elemental composition of micro-laminated Cretaceous Eagleford Formation limestones.Ca-normalized elemental profles versus distance across a micro-laminated organic rich limestone from the Cretaceous Eagleford Formation in Lozier Canyon,Texas.Data represent 15 point running averages.Normalization to Ca was done to eliminate the dilution/concentration effects of changes in material density due to variations in porosity or crack density.Data are in units of wt%metal divided by w%Ca metal

Fig.9 Elemental composition of micro-laminated Cretaceous Eagleford Formation limestones.Same analyses as in Fig.8,but individual running averages for different elements are plotted against each to evaluate correlations.All data re normalized to Ca.X-axis in all panels corresponds to Al/Ca(wt%/wt%by metal).a K/Ca.b Si/Ca.c Mg/Ca.d Fe/Ca.e Zr/Ca.f S/Ca.In b,range of Si/Al ratios(by weight)for dacite/ rhyolite and basalt/andesite are shown for reference

Table 4 Synthetic amber glasses
5.5 Amber glasses as in-house standards
Finally,towards developing a homogeneous in house standard of suffcient quantity,we have turned to industrial amber glasses.Sulfate is used in the fning process of making glass and reduced S is important for making the dark color of amber glasses through the formation of Fe3+-S2-chromophores(Albayrak and Sengel 2008).We have chosen amber beer glass from Anheuser-Busch’s Bud LightTM(Jones and Brossia 2006)and Saint Arnold’sTMbeer and S-bearing glasses(001322-0003-F-P001 and 000203-0003-F-P005)used fordecorative glass arts (Bullseyeglass.com).Random fragments of these glasses were analyzed to assess homogeneity and S concentrations (Table 4).The glasses range from~300 to 700 ppm S. BullseyeTMglass P001 has the lowest RSD deviation of 5%for32S,followed by BullseyeTMglass P005 at 9% RSD,St.Arnold’sTMat 8%and Bud LightTMat 13%.
6 Conclusions
Sulfur measurement by LA-ICPMS is established here with a longtime reproducibility for homogenous samples of 10%for high concentration samples(>900 ppm)and~20%for low concentration(<200 ppm)samples.The primary challenge is correcting for long-term instrumental drift in elemental fractionation factors.This method is shown here to be applicable to rapid in situ characterization of S in glass,aphyric groundmass of volcanic rocks,and micro-laminated sediments.
AcknowledgmentsThisworkwas supportedbyNSF OCE-1338842.The contents in the amber beer bottles were quantitatively decanted into a kitchen sink to prevent unintentional(or intentional)consumption by human subjects.Monica Erdman, Michael Farner,and Xun Yu are thanked for discussions and help in the laboratory.
Albayrak G,Sengel H(2008)Review of sulphate chemistry and its impact on glass production.Eur J Glass Sci Technol 49:289–296
Alt JC(1995)Sulfur isotopic profle through the oceanic crust:sulfur mobility and seawater-crustal sulfur exchange during hydrothermal alteration.Geology 23:585–588
Alt JC,Shanks WCI,Jackson MC(1993)Cycling of sulfur in subduction zones:the geochemistry of sulfur in the Mariana Islandarc andback-arc trough.Earth Planet SciLett119:477–494
Alt JC,Garrido CJ,Shanks WCI,Turchyn AV,Padron-Navarta JA, Sanchez-Vizcaino VL,Pugnaire MTG,Marchesi C(2012) Recycling of water,carbon,and sulfur during subduction of serpentinites:a stable isotope study of Cerro del Almirez,Spain. Earth Planet Sci Lett 327–328:50–60
Bell AS,Simon A,Guillong M(2009)Experimental constraints on Pt, Pd,and Au partitioning and fractionation in silicate melt-sulfdeoxide-aqueous fuid systems at 800OC,150 MPa and variable sulfur fugacity.Geochim Cosmochim Acta 73:5778–5792
Burgisser A,Scaillet B(2007)Redox evolution of a degassing magma rising to the surface.Nature 445:194–197
Censi P,Randazzo LA,Zuddas P,Saiano F,Arico P,Ando S(2010) Trace element behaviour in seawater during Etna’s pyroclastic activity in 2001:concurrent effects of nutrients and formation of alteration minerals.J Volcanol Geotherm Res 193:106–116
De Hoog JCM,Mason PRD,Van Bergen MJ(2001)Sulfur and chalcophile elements in subduction zones:constraints from a laser ablation ICP-MS study of melt inclusions from Galunggung volcano,Indonesia.Geochim Cosmochim Acta 65:3147–3164
de Hoog JCM,Hattori KH,Hoblitt RP(2004)Oxidized sulfur-rich mafc magma at Mount Pinatubo,Philippines.Contrib Mineral Petrol 146:750–761
Dixon JE,Clague DA,Stolper EM(1991)Degassing history of water, sulfur,and carbon in submarine lavas from Kilauea Volcano, Hawaii.J Geol 99:371–394
Erdman ME,Lee C-TA,Yang W,Ingram L(2013)Sulfur concentration in geochemical reference materials by solution ICP–MS. Geostand Geoanal Res 38:51–60
Gao S,Liu X,Yuan H,Hattendorf B,Gu¨nther D,Chen L,Hu S (2002)Determination of forty two major and trace elements in USGS and NIST SRM glasses by laser ablation-inductively coupled plasma-mass spectrometery. Geostand Newsl 26:181–196
Jarosewich EJ,Nelen JA,Norberg JA(1979)Reference samples for electron microprobe analysis.Geostand Newsl 4:43–47
Jego S,Dasgupta R(2013)Fluid-present melting of sulfde-bearing ocean-crust:experimental constraints on the transport of sulfur from subducting slab to mantle wedge.Geochem Cosmochim Acta 110:106–134
Jones S,Brossia CE(2006)Method for the production of amber glass with reduced sulfur-containing emissions,United States Patent Application Publication.Anheuser-Busch Inc,United States of America
Jugo PJ(2009)Sulfur content at sulfde saturation in oxidized magmas.Geology 37:415–418
Lee C-A,Oka M,LuffP,Agranier A(2008)Internal distribution of Li and B in serpentinites from the Feather River Ophiolite, California,based on laser ablation inductively coupled plasma mass spectrometry.Geochem Geophys Geosyst 9.doi:10.1029/ 2008GC002078
Lee C-TA,Oka M,LuffP,Agranier A(2009)Internal distribution of Li and B in serpentinites from the Feather River Ophiolite, California based on laser ablation inductively coupled plasma mass spectrometry.Geochem Geophys Geosyst 9.doi:10.1029/ 2008GC002078
Lee C-TA,LuffP,Chin EJ,Bouchet R,Dasgupta R,Morton DM,Le Roux V,Yin Q-Z,Jin D(2012)Copper systematics in arc magmasand implicationsforcrust-mantledifferentiation. Science 336:64–68
Lee C-TA,Shen B,Slotnick BS,Liao K,Dickens GR,Yokoyama Y, Lenardic A,Dasgupta R,Jellinek M,Lackey JS,Schneider T, Tice M(2013)Continental arc-island arc fuctuations,growth of crustal carbonates and long-term climate change.Geosphere 9:21–36
Liu Y,Hu Z,Gao S,Gu¨nther D,Xu J,Gao C,Chen H(2008)In situ analysis of major and trace elements of anhydrous minerals by LA-ICP-MS without applying an internal standard.Chem Geol 257:34–43
Longerich HP,Jackson SE,Gunther D(1996)Laser ablation inductively coupled plasma mass spectrometric transient signal data acquisition and analyte concentration calculation.J Anal Atomic Spectrom 11:899–904
Mavrogenes JA,O’Neill HSC(1999)The relative effect of pressure, temperature and oxygen fugacity on the solubility of sulphide in mafc magmas.Geochim Cosmochim Acta 63:1173–1180
Melson WG,O’Hearn T,Jarosewich E(2002)A data brief on the Smithsonian Abyssal Volcanic Glass data fle.Geochem Geophys Geosys 3:1–11
Metrich N,Mandeville C(2010)Sulfur in magmas.Elements 6:81–86
Metrich N,Schiano P,Clocchiatti R,Maury RC(1999)Transfer of sulfur in subduction settings:an example from Batan Island (Luzon volcanic arc,Philippines).Earth Planet Sci Lett 167:1–14
Nilsson K,Peach CL(1993)Sulfur speciation,oxidation state,and sulfur concentration in back arc magmas.Geochim Cosmochim Acta 57:3807–3813
O’Neill HSC,Mavrogenes JA(2002)The sulfde capacity and the sulfur content at sulfde saturation of silicate melts at 1400& #xB0;C and 1 bar.J Petrol 43:1049–1087
Perft MR,Fornari DJ,Malahoff A,Embley RW(1983)Geochemical studies of abyssal lavas recovered by DSRV Alvin from eastern Galapagos Rift,Inca Transform,and Ecuador Rift 3.Trace element abundances and petrogenesis.J Geophys Res 88: 10551–10572
Ripley EM,Li C,Moore CH,Elswick ER,Maynard JB,Paul RL, Sylvester P,Seo JH,Shimizu N(2011)Analytical methods for sulfur determination in glasses,rocks,minerals and fuid inclusions.Rev Mineral Geochem 73:9–39
Savov IP,Leeman WP,Lee C-TA,Shirey SB(2009)Boron isotopic variations in NW USA rhyolites:Yellowstone,Snake River Plain,Eastern Oregon.J Volcanol Geotherm Res 188:162–172
Self S,Blake S,Sharma K,Widdowson M,Sephton S(2008)Sulfur and chlorine in late Cretaceous Deccan magmas and eruptive gas release.Science 319:1654–1657
Thordarson T,Self S,Oskarsson N,Hulsebosch T(1996)Sulfur, chlorine,and fuorine degassing and atmospheric loading by the 1783–1784 AD Laki(Skaftar Fires)eruption in Iceland.Bull Volcanol 58:205–225
Thornber CR,Sherrod DR,Siems DF,Heliker CC,Meeker GP, Oscarson RL,Kauahikaua JP(2002)Whole-rock and glass major-element geochemistry of Kilauea Volcano,Hawaii,Nearvent eruptive products,September 1994 through September 2001.US Geological Survey Open File Report OF02-17
Wallace PJ(2005)Volatiles in subduction zone magmas:concentrations and fuxes based on melt inclusion and volcanic gas data. J Volcanol Geotherm Res 140:217–240
Wallace PJ,Carmichael ISE(1992)Sulfur in basaltic magmas. Geochem Cosmochim Acta 56:1863–1874
Wallace PJ,Edmonds M(2011)The sulfur budget in magmas: evidence from melt inclusions,submarine glasses,and volcanic gas emissions.Rev Minerol Geochem 73:215–246
Received:1 December 2014/Revised:25 March 2015/Accepted:29 March 2015/Published online:16 April 2015
?Science Press,Institute of Geochemistry,CAS and Springer-Verlag Berlin Heidelberg 2015
? Cin-Ty A.Lee
ctlee@rice.edu
1Department of Earth Science,MS-126,Rice University, 6100 Main Street,Houston,TX 77005,USA
2State Key Laboratory for Mineral Deposits Research,School of Earth Science and Engineering,Nanjing University, Nanjing 210093,China
- Acta Geochimica的其它文章
- Trace elements of Carboniferous-Permian coal from the Adaohai Mine,Daqingshan Coalfield,Inner Mongolia,China
- Chinese Journal of Geochemistry
- Petrography and stable isotopic variations in Dalmiapuram Formation of Cauvery Basin,South India:implication on OAE1d
- Metal contamination assessment in the urban stream sediments and tributaries of coastal area southwest Nigeria
- Thermal evolution of aliphatic and aromatic moieties of asphaltenes from coals of different rank:possible implication to the molecular architecture of asphaltenes
- Environmental baseline evaluation of lead in shallow groundwater based on statistical and spatial outlier identifcation