
Simulation and analysis of river runoff in typical cold regions
2011-12-09 09:36:38QiuDongZhaoBaiShengYeYongJianDingShiQiangZhangChuanChengZhaoJianWangZengRuWang
QiuDong Zhao , BaiSheng Ye , YongJian Ding ,, ShiQiang Zhang ,ChuanCheng Zhao , Jian Wang , ZengRu Wang
1. Division of Hydrology and Water-Land Resources in Cold and Arid Regions, Cold and Arid Regions Environmental and Engineering Research Institute, Chinese Academy of Sciences, Lanzhou, Gansu 730000, China
2. State Key Laboratory of Cryospheric Sciences, Cold and Arid Regions Environmental and Engineering Research Institute,Chinese Academy of Sciences, Lanzhou, Gansu 730000, China
Simulation and analysis of river runoff in typical cold regions
QiuDong Zhao1*, BaiSheng Ye2, YongJian Ding1,2, ShiQiang Zhang1,ChuanCheng Zhao1, Jian Wang1, ZengRu Wang2
1. Division of Hydrology and Water-Land Resources in Cold and Arid Regions, Cold and Arid Regions Environmental and Engineering Research Institute, Chinese Academy of Sciences, Lanzhou, Gansu 730000, China
2. State Key Laboratory of Cryospheric Sciences, Cold and Arid Regions Environmental and Engineering Research Institute,Chinese Academy of Sciences, Lanzhou, Gansu 730000, China
It is generally agreed that global warming is taking place, which has caused runoff generation processes and apparently total runoff amount changes in cold regions of Northwestern China. It is absolutely necessary to quantify and analyze earth surface hydrological processes by numerical models for formulating scientific sustainable development of water resources. Hydrological models became established tools for studying the hydrological cycle, but did not consider frozen soil or glacier hydrology. Thus, they should be improved to satisfy the simulation of hydrological processes in cold regions. In this paper, an energy balance glacier melt model was successfully coupled to the VIC model with frozen soil scheme, thus improving the models performance in a cold catchment area. We performed the improved VIC model to simulate the hydrological processes in the Aksu River Basin, and the simulated results are in good agreement with observed data. Based on modeling hydrological data, the runoff components and their response to climate change were analyzed. The results show: (1) Glacial meltwater recharge accounts for 29.2% of runoff for the Toxkan River, and 58.7% for the Kunma Like River. (2) The annual total runoff of two branches of the Aksu River show increasing trends, increased by about 43.1%, 25.95×10⁶m3per year for the Toxkan River and by 13.1%, 14.09×10⁶m3per year for the Kunma Like River during the latter 38 years. (3) The annual total runoff of the Toxkan River increased simply due to the increase of non-glacial runoff, while the increase of annual total runoff of the Kunma Like River was the result of increasing glacial (42%) and non-glacial runoff (58%).
glacier; energy and mass balance; hydrologic model; hydrologic process simulation; Aksu River Basin
1. Introduction
In Northwestern China, mountain glaciers and seasonal snowpack play important roles in the hydrological cycle.They form the headwaters for hydrologic systems that provide water to some of the most populated areas, especially in arid and semiarid inland river basins, where the main water resources come from mountainous watersheds (Kanget al.,1999; Chenet al., 2006, 2008). Glaciers and frozen soil hydrology are indispensable parts of hydrology in mountain regions of Northwestern China. However, with global warming, glaciers are shrinking significantly, along with universal permafrost degradation in the cold regions of Northwestern China. Changes in the ecosystem and microclimate environment alter the generation processes of watershed’s runoff and its total amount as well (Yanget al.,2000; Mark and Seltzer, 2003; Barnettet al., 2005). In the long run, continuing mass loss of glaciers will raise the risk of low-flow in arid and semiarid regions as the amount of water from glacier melt diminishes with glacier retreat. In the short term, glaciers melting faster than ever will lead to an increased risk of flooding in the vicinity of glaciers when peak flows increase dramatically in summer seasons, mainly due to faster generation of runoff (Braunet al., 2000; Hocket al., 2005). Cryospheric change has a great influence on China’s water security, thus there is an urgent need to quantitatively evaluate and forecast this change so as to promote the sustainable development of water resources.
The runoff from mountainous watersheds is one of the main water sources for inland river basins of arid and semiarid regions in Northwestern China. It is very important to simulate and predict the flow discharge in mountainous watersheds for its sustainable development in the mid- and downstream regions, where precipitation is low. In the past decade, distributed physically-based hydrological models(e.g., DHSVM, MIKE SHE, WATFLOOD, IISDHM, and VIC; for reviews, see Lianget al., 1994; Storck, 2000; Beven, 2001) are established tools for studying the hydrological cycle, considering its present state and possible future changes in climate and land use from individual basins to global scale (Barnettet al., 2005; Singh and Bengtsson,2005; Christensen and Lettenmaier, 2007; Viviroliet al.,2007). The distributed physical-based models incorporate streamflow, precipitation, evaporation, averaged stochastic groundwater flow and spatial properties of the catchment such as elevation data, topographic indices, glacier grid, land use, and soil types. However, few distributed hydrological models have been designed specially for cold mountain regions where frozen soil, snow and glacier hydrological processes are critical variables. Abundant studies aim to simulate snow-melt induced runoff (Martinec and Rango, 1986;Liet al., 2009; Zhaoet al., 2009), although lacking focus on modeling glacial discharge (Hock, 1998; Hock and Holmgren, 2005). Additionally, most existing soil water transfer models do not include frost effects.
The Variable Infiltration Capacity (VIC) macroscale hydrologic model is a surface water and energy balance model designed for large-scale applications. It is applied to grid cells, typically with spatial dimensions from 0.125° to 2° latitude by longitude, connected so as to represent large continental river basins (Lianget al., 1994, 1996; Nijssenet al., 2001; Bowlinget al., 2004; Costa-Cabralet al., 2008).The model is distinguished from other SVATS(Soil-vegetation-atmosphere transfer schemes) by its focus on runoff processes. Over the last several years, a number of changes have been made to improve the VIC model’s representation in cold regions, in conjunction with the Global Energy and Water Balance Experiment (GEWEX) Continental-scale International Project (GCIP) activities in the upper Mississippi River Basin (Cherkauer and Lettenmaier,1999). VIC has developed an algorithm to represent the effects of frozen soil, the addition of an algorithm to simulate the interception of snow by forest canopies, and general improvements to the snow accumulation and ablation algorithm (Cherkauer and Lettenmaier, 2003). Unfortunately,there is no glacier melt model in the VIC model to model mountain hydrological processes in Northwestern China,especially in highly glacierized mountain areas.
The first purpose of this study was to couple an energy balance glacier melt algorithm to the VIC model to improve the models performance in cold mountain catchments. Then,this study applied the improved VIC model to simulate hydrological processes from 1970 to 2007 in a large mountain catchment area, Aksu River. The observed daily discharge was used for model calibration and parameters optimization.Then runoff comments and variation characteristics were analyzed based on the observed and simulated runoff data during the last 38 years.
2. Model description
A glacier scheme is developed within framework of the VIC macroscale hydrology model. We describe the glacier algorithm in the VIC model by adding one special land use or land cover class that can be added to the grid cell mosaic as well as vegetation and bare soil land classes (Figure 1).Energy and mass balance of the glacier are resolved at each model time step. The glacier algorithm is based on Hock(2005), Hock and Holmgren (2005), Hocket al. (2005) and Jiang (2008). This section describes the glacier coupled scheme and glacier melt algorithm.
2.1. Variable infiltration capacity (VIC) macroscale hydrological model
The VIC model is a semi-distributed grid-based macroscale hydrologic model (Lianget al., 1994; Nijssenet al.,1997, 2001), which adopts the variable infiltration capacity curve to describe the distribution of soil moisture, and considers explicitly the effects of vegetation, topography, and soils on the exchange of moisture and energy between land and atmosphere. One distinguishing characteristic of the VIC model is the use of "mosaic" scheme. Early simulations with the VIC model were conducted with two soil layers.Lianget al. (1996) determined that a thin top layer (5-15 cm)significantly improved evapotranspiration predictions in arid climates, and a third soil layer was added, called VIC-3L model. Soil column will be divided into more than ten soil thermal layers when in frozen soil scheme. The VIC model includes a two-layer canopy model for evapotranspiration using the Penman-Monteith equation (Shuttleworth, 1993), an energy balance model for snow accumulation and melting(Wigmostaet al., 1994; Cherkauer and Lettenmaier, 2003), an approximate soil temperature profile for frozen soil freezing-thawing (Cherkauer and Lettenmaier, 1999, 2003) and a channel network for surface runoff and baseflow routing(Nijssenet al., 1997; Lohmannet al., 1998a, b).
Primary input data include daily precipitation, maximum and minimum daily temperatures. They are modeled or partitioned to the model time step. If radiation data and vapor pressure data were unavailable, these data were calculated by the model based on daily precipitation and daily mini-mum and maximum temperatures, using algorithms developed by Thornton and Running (1999). If wind speed was not provided, the default value (1.5 m/s) was assumed. Air pressure was calculated by pressure lapse rate from sea-level pressure (Mesinger and Treadon, 1995) or using default values (95.5 kPa) when air pressure was unavailable.

Figure 1 Schematic representation of the VIC glacier scheme
2.2. Model development: glacier scheme
2.2.1 Sub-grid variability in meteorological elements
Most glaciers are distributed in high-altitude complex terrain. The meteorological conditions (such as temperature,precipitation, wind speed, and radiation) of glacier area are largely different from the macroscale model grid cell mean.So a sub-grid representation of meteorological elements must be adopted firstly based on topography. In this study, average terrain information (slope, aspect and elevation) of glacier area within a model grid cell is statistically derived from the ASTER GDEM (http://www.gdem.aster.ersdac.or.jp/), 30-m resolution digital elevation data that are available globally.Although ASTER GDEM has some deficiencies in mountain areas, it can be used to obtain the altitude of glacier areas.Atmosphere pressure of glacier area can be calculated by pressure lapse rate from sea-level pressure based on glacier area mean elevation.
The temperature (maximum and minimum temperatures)of glacier area can be computed by the gradient method:

whereTg(°C) is the glacier area temperature,Zg(m) is the glacier area mean elevation,Z0(m) is the grid cell mean elevation, andl(°C/m) is the temperature gradient that can be derived from observation.T0(°C) is the grid cell mean(and median) temperature, which is represented by using gradient plus inverse distance weighting interpolation from station observations to the grid cell centers.
If shortwave radiation and the daily dew point temperature were not provided, they were calculated by using the MT-CLIM (Mountain Climate Simulator, Thornton and Running, 1999). However, the effects of slope and aspect on solar radiation are neglected during calculating the large-scale grid cell mean shortwave radiation in the original version of VIC. Considering the effects of complex terrain in glacier area to solar radiation, the glacier area mean slope and aspect were reintroduced when calculating shortwave radiation of glacier area.
2.2.2 Energy and mass balance of glacier area
Glacier melt is determined by energy balance at the glacier-atmosphere interface, which is controlled by meteorological conditions above the glacier and the physical properties of the glacier itself. A physically based approach to compute melt involves the assessment of the energy fluxes to or from the surface at first. When glacier surface temperature equals 0 °C, any surplus of energy at the glacier surface-air interface is assumed to be used immediately for melting. The main formula of the mass balance model (Figure 2; Mass, kg/m2) is as follows:
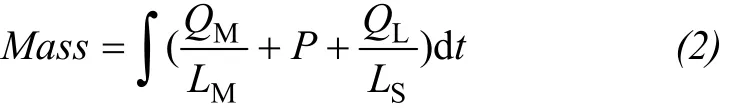
whereQM(W/m2) is the melt energy involved in melting,P(m) is the snow accumulation andQL(W/m2) represents the mass exchange due to sublimation.LM(3.34×10⁵J/kg) is the latent heat of melting, andLS(2.83×10⁶J/kg) is the latent heat of sublimation.
QMwas calculated from the glacier surface energy balance, it can be expressed as:

whereQN(W/m2) is net radiation,QH(W/m2) is the sensible heat flux,QL(W/m2) is the latent heat flux (QHandQLare referred as turbulent heat fluxes),QG(W/m2) is the ground heat flux in ice or snow,i.e., the heat exchange in a vertical column from the surface to the depth where vertical heat transfer is negligible,QR(W/m2) is the heat flux supplied by precipitation andQM(W/m2) is the energy consumed by melting. As commonly defined in glaciology, a positive sign indicates an energy gain to the surface while a negative sign signifies an energy loss.
Net radiation of a surface is the difference between incoming and outgoing energy absorbed or emitted by the surface. The net radiation may be written as:

whereS(W/m2) is global shortwave radiation,αis albedo,L↓ (W/m2) is incoming longwave radiation (atmosphere longwave radiation) andL↑ (W/m2) is the emitted longwave radiation.
The albedoαdepends on the characteristics of glacier surface including wetness, grain size, snow age, snow depth,and snow density. In this study, snow albedo calculation is based on albedo algorithm developed by Gray and Landine(1987) and described by Sunet al. (1999). In contrast to snow albedo, ice albedo is often treated as a temporal and spatial constant. Some studies suggest that there is a good relationship between ice albedo and daily air temperature(Jiang, 2008). In our study, the ice albedo algorithm is adopted.

whereαgis the ice albedo andTa(°C) is the temperature.Considering the gap of glacier surface albedo between a fixed or variable snow value and a lower fixed ice value as soon as snow has melted completely, a function is introduced based on Brocket al. (2000).
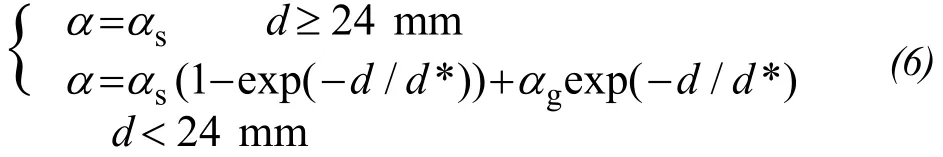
whereαis the glacier surface albedo,αsis the snow albedo,αgis the ice albedo,d(mm) is the snow water equivalent which is calculated from snow accumulation and melts over the ice surface using the VIC two-layer energy balance snow model (Cherkauer and Lettenmaier, 2003), andd* is the characteristic scale for snow depth (24 mm w.e.).
The incoming longwave radiationL↓ is estimated based on the fractional cloud cover, the current air temperature,and the atmospheric vapor pressure (described by Bras,1990) in the VIC model. Longwave outgoing radiation L↑ is approximated by:

where is the emissivity of the surface (assumed to be 1),σis the Stefan-Boltzmann constant andTS(°C) is the temperature of the glacier surface. The surface temperature is assumed to be zero if the energy available for melting is positive. If melting turns negative, the surface temperature is calculated using the Brent iteration method (Brent, 1973),which has been embedded in the VIC model.
The turbulent heat fluxes (QHandQL) are calculated from the bulk aerodynamic method, assuming sensible and latent heat flux to be proportional to air temperature, wind speed and vapor pressure at designated height above the surface, as described by Cherkauer and Lettenmaier (2003).Precipitation occurring below a threshold temperature is assumed to be snow. The model accounting for the energy advected by rainQRis calculated by:

whereρwis the density of water (kg/m3),cwis the specific heat of water (4.18 kJ/(kg·K)),Ris the rainfall rate (m/s) andTR(°C) andTS(°C) are the temperatures of precipitation(assumed to be equal to air temperature) and the surface,respectively.TRbecomes equal toTSbefore rain leaves the glacier surface.
Some studies and observations show that ground heat flux is approximately 0-5 W/m2after the ice had been exposed (Hock, 1998; Jiang, 2008). The direction of the flux is downward at day, while it is upward at night during ablation season. The amount is very small and is nearly 0 during daily cycle. So in our study, ground heat flux (QG) is set to be 0.
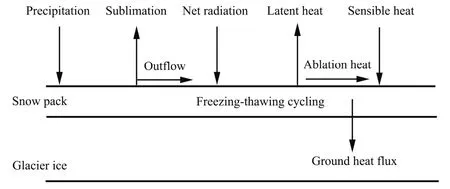
Figure 2 The energy-mass balance ice melt model
3. Study area and data
3.1. Study area
The Aksu River Basin (the international river between China and Kyrgyzstan) lies in the northwestern arid area of the Tarim Basin, which is bounded by 75°08′E-80°13′E,40°20′N-42°25′N (Figure 3). The catchment area is 5.2×10⁴km2. It is the most important headstream of the Tarim Basin,contributing 75% of the total streamflow of the main stream of the Tarim River. Vast territory, diverse topography, complex terrain, and evident regional climate variations make up characteristics of the northwestern mountain climate. The high mountain zone has lower temperatures, plentiful precipitation, and aged snow while the middle mountain zone clearly brings about changes in temperature, and is the largest precipitation distribution area. The low mountain zone suffers from drought, large temperature changes, and is fairly well in heat conditions, which reflects typical characteristics of dry continental climate such as minimal precipitation,intense evaporation, adequate sunshine, and extreme heat(Tanget al., 1992).
The Kunma Like and Toxkan rivers converge to form the Aksu River. The Kunma Like River district, where the Termier and Hantengere Mountain glaciers come together, spans 293 km from the source to the point where the river converges.The hydrological station, Xie Hela, controls a catchment area of 1.33×10⁴km2(2.8×10³km2is glacierized). The Toxkan River spans 457 km from the source to the area where the Kunma Like River converges. In its mountain pass, the Shali Guilanke hydrological station covers a catchment area larger than 1.94×10⁴km2(9.0×10²km2is glacierized). The Aksu River represents the rivers of which glacial and snow melt water are the primary source of water supply. The combination of ice/snow melt and precipitation in summer forms the hydrological discharge process in the flood seasons of the Aksu River Basin. Some studies have shown that hydrological discharge process is so sensitive to climate change that it is necessary to study the relationship between the river’s streamflow and climate (Shiet al., 2002; Jianget al., 2005).

Figure 3 Location of the Aksu River Basin, the stations and glaciers
3.2. Data collection
The time-series daily atmospheric forcing data (maximum and minimum temperature, precipitation, and wind speed) for the period of 1970-2007, topography and land cover classification (elevation, vegetation, soil) and parameters are required for running the VIC hydrological model.Daily temperature data of the study area are obtained from neighboring meteorological stations of the Chinese Meteorological Institute and interpolated to each model grid cell (at 5'×5' spatial resolution) by using a gradient plus inverse distance weighting method. Precipitation data are obtained from daily gridded precipitation dataset (APHRO_V0902 datasets on 0.25°×0.25° grids) which was created by the project of Asian Precipitation Highly Resolved Observational Data Integration Towards the Evaluation of Water Resources (APHRODITE) (Akiyoet al., 2009). The precipitation data were interpolated to 5' spatial resolution by using an inverse distance weighing method.
Soil property data such as soil type, water holding capacity and saturated hydrologic conductivity are from the Food and Agriculture Organization (FAO) Soil Database,which provides the most detailed, globally consistent soil data (FAO, 1971-1981; Webbet al., 1993). Vegetation classification and their parameters (such as monthly leaf area index and albedo) are from the University of Maryland’s 1-km Global Land Cover product. The proportion of each vegetation type in covered grid cell is defined statically with GIS. Basic topography data come from the global 30"GLOBE-DTM. The 30" Shuttle Radar Topography Mission DTM (Farret al., 2007) is used to create the routing model input files, including the gridded fraction file about the fraction of each grid cell that flows into the basin being routed,and gridded flow direction file which tells the routing model how all of the grid cells are connected in routing net.
The glaciers catchment data in China are from the Chinese Glacier Inventory which contains information from about 26,000 glaciers throughout China collected and digitized by the Cold and Arid Regions Environmental and Engineering Research Institute, CAS. The glaciers catchment data in Kyrgyzstan are based on Landsat TM (1989-1993)remote sensing data. The topography of glaciers (elevation,slope and aspect) is obtained from 10" ASTER GDEM. The proportion of glacier in each covered grid cell and topographical information of glacier such as mean elevation,slope and aspect are defined statically.
Daily discharge data (1980-1989) and monthly discharge data (1970-2007) for the Aksu catchments are obtained from the Xinjiang Uyghur Autonomous Region Hydrological Institute and used for calibration and analysis of the VIC model.
4. Results and discussion
In this study, the streamflow from 1970 to 2007 of the Aksu River, an important branch river of the Tarim River,was simulated in day time step. Each grid cell was divided into four elevation bands for snow melting and accumulation.The VIC model was calibrated by observed daily discharge data of two hydrometric stations (Shali Guilanke and Xie Hela) on the branches of the Aksu River. Toxkan River and Kunma Like River, mentioned in the following analysis are the catchment area controlled respectively by Shali Guilanke and Xie Hela hydrometric stations.
4.1. Model calibration
As described above, the VIC-3L model contains a number of tunable parameters which are used to adjust the model to the conditions prevailing in a specific catchment. Although most of the vegetation and soil parameters can be estimated according to the literature, some soil parameters are subjected to calibration based on the agreement between simulated and observed hydrographs. These include the infiltration parameter (binfilt), which controls the amount of water that can infiltrate into the soil; the depths of the three soil layersdi(i=1, 2, 3), which affect the maximum storage available for transpiration; the three parameters in the baseflow scheme including the maximum velocity of baseflow (Dsmax), the fraction of maximum baseflow (Ds),and the fraction of maximum soil moisture content of the third layer (Ws) at which a nonlinear baseflow response is initiated, which determines how quickly the water stored in the third layer is depleted.
Model calibration is performed by using the following procedures:
(1) Calibrate the model parameters (DsandDsmax) to fit the baseflow that can occur from the lowest soil layer.
(2) Adjust the infiltration parameterbinfiltto match the observed flow peaks, with a higher value to give lower infiltration and yield higher surface runoff.
(3) A higher value ofWswill raise the required rapidly increasing water content, non-linear baseflow will tend to delay runoff peaks.
(4) Set the estimated value for the depth of the soil layers(d2,d3), commonly with a deeper depth for arid regions and a shallower depth for humid regions.
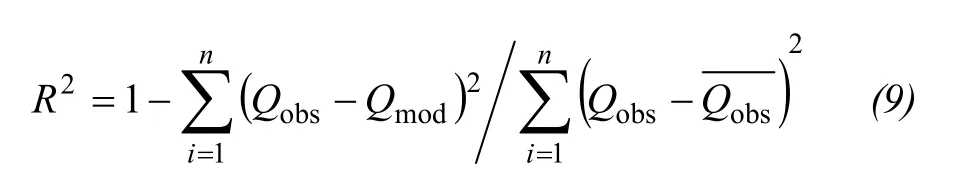
The parameters often adjusted during calibration of the VIC model includebinfilt,Ds,Ws,Dsmaxand the depth of the second soil layer (Huang and Liang, 2006; Xie and Yuan,2006). Calibration is made manually and the Nash-Sutcliffe model efficiency coefficientR2(Nash and Sutcliffe, 1978) is used as the objective function, which describes the matching extent of the hydrograph between the simulated and observed values:

In this study, the related typical parameters (binfilt,Ds,Dsmax,Ws) were used as the starting values for the Aksu watersheds (http://www.hydro.washington.edu/Lettenmaier/Models/VIC/Documentation/SoilParam.shtml). Only daily observed discharge data over the period 1980 to 1989 was collected, so the model was calibrated with the observed daily discharge data.
4.2. Results analysis
In this paper, the 10-year period from 1980 to 1989 is chosen for model calibration and parameters optimization.The VIC model has six main parameters to calibrate:Dsmax,Ds,Wsandd3were adjusted based on the observed daily discharge in cold seasons,binfiltandd2were optimized based on the observed discharge on rainy days. The VIC model has no automation optimization function, which makes parameter optimization to be difficult. Eventually the best daily simulation results were obtained by manual adjustment of parameters.
4.2.1 Discharge simulations
To further clarify the model performance of VIC, the modeled daily and monthly streamflows were compared with measurements from the stream gauge records for the calibration period 1980-1989 and complete period 1970-2007 (Figures 4 and 5), and the statistical test is listed in Table 1.
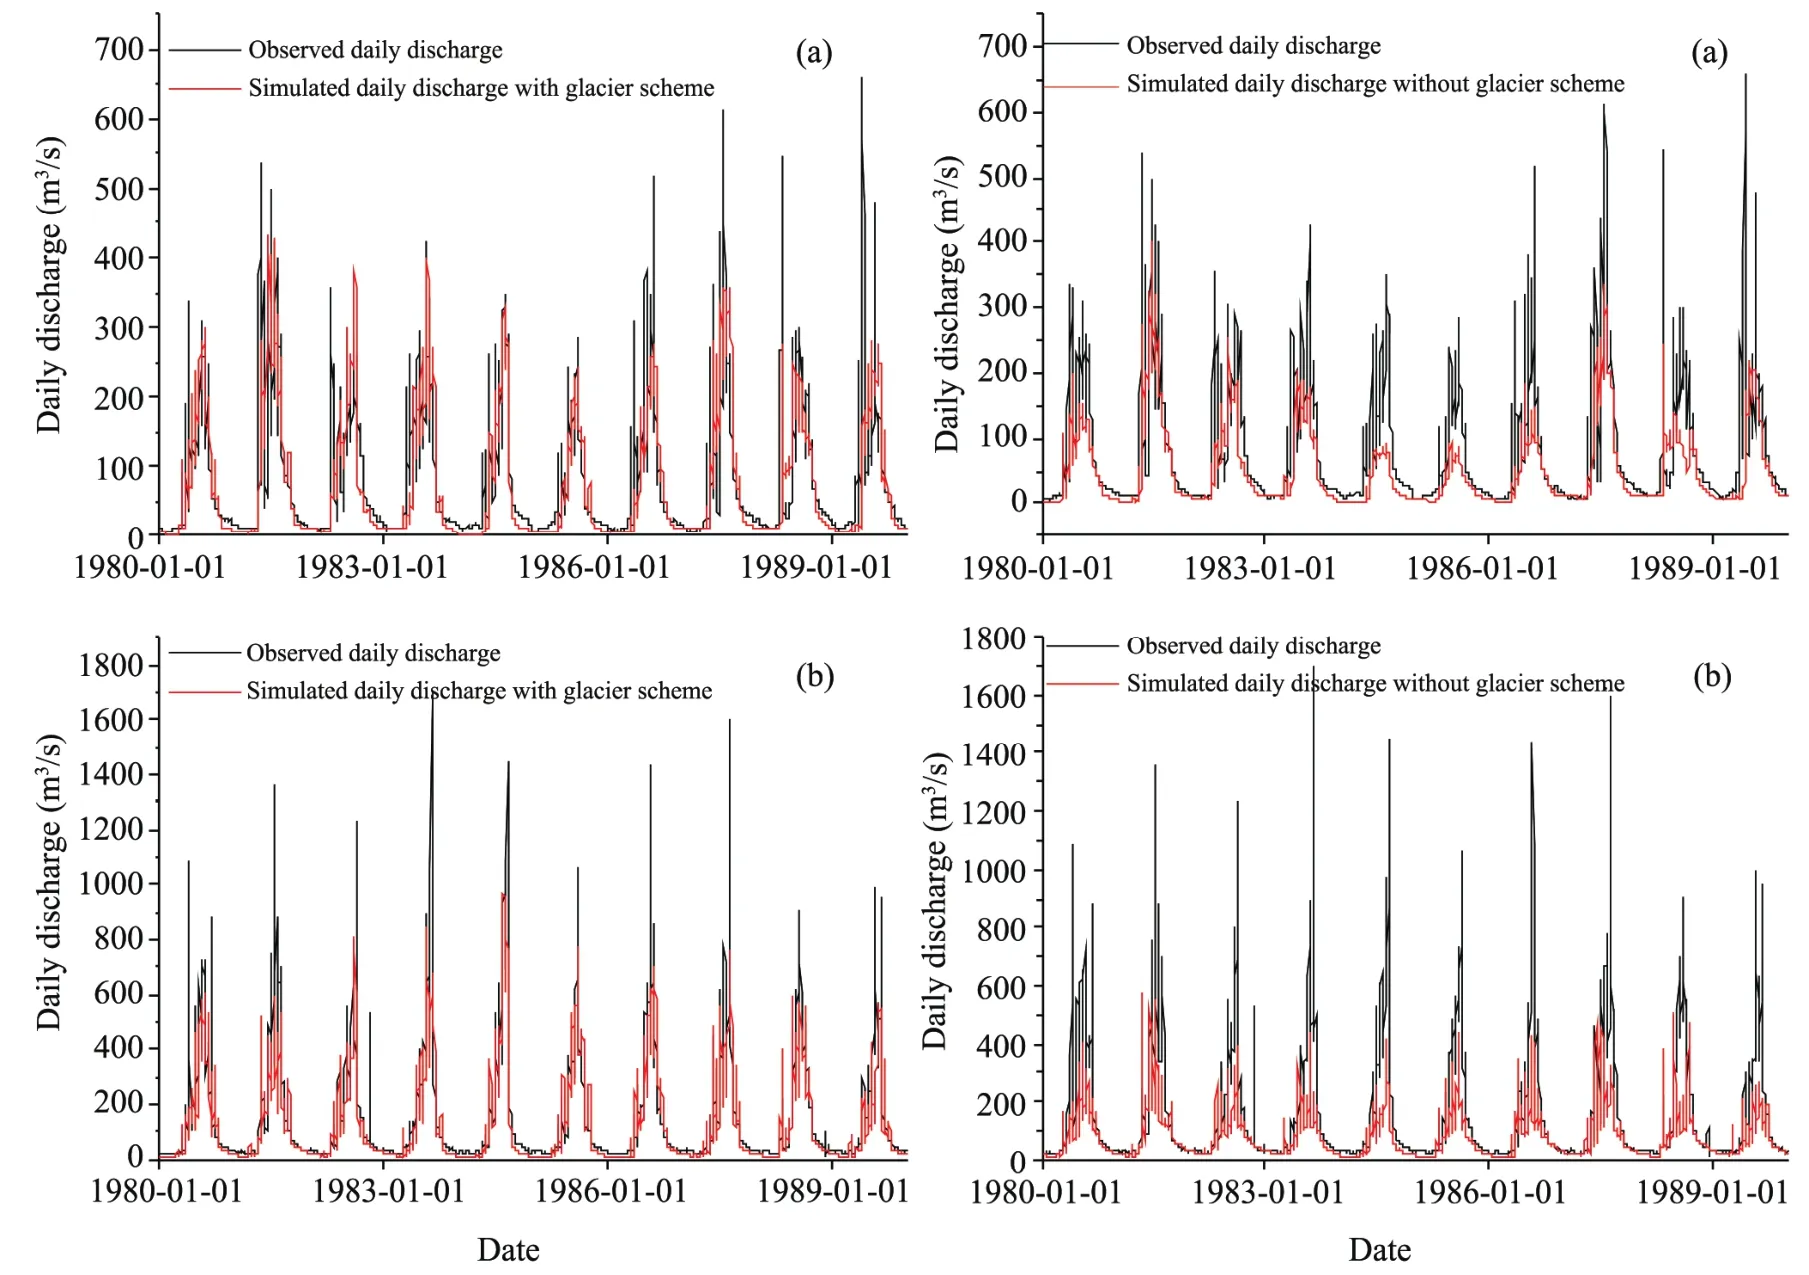
Figure 4 Observed and simulated daily discharge during calibrated period 1980-1989 (a: Toxkan River, b: Kunma Like River)
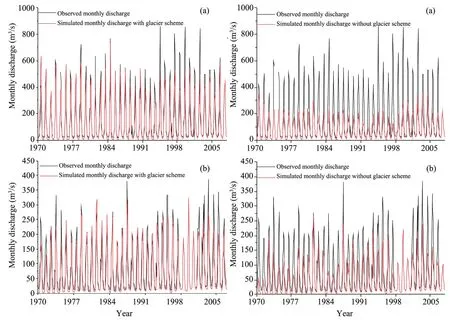
Figure 5 Observed and simulated monthly discharge 1970-2007 (a: Toxkan River, b: Kunma Like River)

Table 1 The Nash-Sutcliffe model efficiency coefficient R2 for the linear correlation between the modeled and measured runoff of the Aksu watershed
From the figures and table the following conclusions can be made:
(1) The previous VIC model without glacier scheme systematically underestimates the streamflow, especially for the higher glacier extent catchment, Kunma Like River. The Nash-Sutcliffe model efficiency coefficientR2was 0.46 for the Toxkan River and 0.34 for the Kuma Like River for calibration period. Because glacial melt water is the main component of the hydrological cycle, glacier hydrology must be considered in hydrological modeling for high glacier extent watershed, but does not improve the model performance just by parameter optimization of model system.
(2) The model performance was obviously improved through coupling glacier scheme. The improved model achieved the efficiency coefficients ofR2=0.62 for the Toxkan River andR2=0.77 for the Kuma Like River for calibration period, and theR2for the Kuma Like River (higher glacier extent) was greater than that for the Toxkan River (lower glacier extent), which also indirectly shows that the glacier scheme is feasible.
(3) Simulation of the monthly runoff for complete period(1970-2007) using the previous VIC model without glacier scheme underestimate the observations which can be seen as the curves of the discharges (Figure 5). The efficiency coefficients ofR2are small, only 0.42 for the Toxkan River and 0.35 for the Kuma Like River. While the improved VIC model achieved the desired results, the efficiency coefficients ofR2=0.77 for the Toxkan River andR2=0.87 for the Kuma Like River for complete period, andR2for higher glacier extent river basin is greater than that for lower glacier extent.The simulated performance of monthly discharge is better than that of daily discharge.
(4) The simulated discharge during wet-season has a slight tendency to underestimate the observations which can be seen from Figure 4, and the highest observations have not been simulated as high. We inferred that the underestimations of the simulated discharges were mainly due to the lack of accurate spatial precipitation. Owing to the complexity of spatial pattern of precipitation, how to accurately estimate areal precipitation in alpine region remains a scientific problem.
(5) In general, application of the improved VIC model coupled with glacier scheme to the glacierized catchment area shows an acceptable model performance, and achieved an efficiency coefficientR2>0.6 for calibration period andR2≈0.8 for complete period. From the analysis in this section, we can draw the conclusion that our designed glacier scheme is acceptable, and model performance is obviously improved. The simulated discharge can be used for further analysis.
4.2.2 Runoff components and variation characteristics
In this study, runoff of the Aksu River is broken up into glacial discharge (including snow melting above ice) and non-glacial discharge. Our detailed analysis of simulated discharge shows that glacial meltwater accounts for a larger proportion in the runoff of the Kunma Like River (58.7%) than that of the Toxkan River (29.2%). Shenet al. (2009) determined the glacial meltwater recharged 58.65% of the Kunma Like River runoff by maximum entropy method. Our results are consistent with the experiments, which show our simulation is credible.
Figure 6 is the annual mean air temperature, annual precipitation of Aksu weather station and annual runoff processes of two branches of the Aksu River. Detailed analysis is as follows:
(1) Figure 6 tells us that from year 1970 to 2007, annual mean air temperature and annual precipitation had a rising trend. Annual air temperature and precipitation data of the last 38 years indicate that air temperature had a positive trend of 0.5 °C per decade, and precipitation had a positive trend of 7.6 mm per decade. From Figure 6, we can find the trend of annual precipitation: years from 1970 to 1988 were the declining period (a negative trend of-15.2 mm per decade); from 1989 to 2005 were the rising period with a slight fluctuation (a positive trend of 24.6 mm per decade); after the year 2005, annual precipitation declined again. The climatic shift from warm dry to warm humid appeared in the Aksu River Basin, which is consistent with climate change in Northwestern China (Shiet al., 2002).
(2) From 1970 to 1997, the change tendency of annual glacial runoff is similar to that of annual mean air temperature and they take on a fluctuating rising trend. After 1997,although air temperature was at a higher level, glacial runoff was at a lower level. For explaining the special variation characteristics, solar radiation observed data of Urumqi weather station was collected (Figure 7, from Tanget al.,2010) because of the missing solar radiation observed data of Aksu weather station. Figure 7 shows that after 1997,contrary to air temperature, as the principal source of energy for melting snow/ice, solar radiation was at a lower level, so that glacial runoff appeared the similar variation characteristics. The simulated annual glacial runoff of the last 38 years indicates that glacial runoff of the Toxkan River had a slightly declining trend of -0.87×10⁶m3per year, while that of the Kunma Like River had a positive trend of 5.9×10⁶m3per year.
(3) During the last 38 years, non-glacial runoff had a notable fluctuating rising trend. Non-glacial runoff of the Toxkan River had a positive trend of 26.83×10⁶m3per year, and that of the Kunma Like River also had a rising trend of 8.19×10⁶m3per year. After 1997, continued growth of glacial runoff was particularly striking, and rising trend was larger than that of precipitation. After analysis and comparison, it is considered that after 1997, air temperature grew rapidly to accelerate permafrost melt releasing vast amounts of water. The fluctuation of annual non-glacial runoff was inconsistent with that of annual precipitation, because winter precipitation of mountain basin is in the form of snow,which melts in the following spring.
(4) As seen from Figure 6, it is obvious that the fluctuation of annual glacial runoff was against that of annual non-glacial runoff. In other words, annual glacial runoff was smaller in wet years, while it was greater in dry years. This is because solar radiation is affected by precipitation frequency and vapor was lower in wet years, and a large amount of precipitation forming thick snow pack on ice to slow snow/ice melt was due to higher snow albedo. This phenomenon is generally referred as the "glacier compensation effect" (Lang, 1986): glaciers tended to dampen annual streamflow variations, where ablation variations offset precipitation variations.
(5) The annual total runoff variations of two branches of the Aksu River were not identical. Due to different glacier extent, the fluctuation of annual total runoff of the Toxkan River was in agreement with that of non-glacial runoff,while the variation of annual total runoff of the Kunma Like River was in agreement with that of glacial runoff. In general, during the last 38 years, annual total runoff of the two rivers had a fluctuating positive trend. Compared to the years from 1970 to 1979, average annual total runoff of the Toxkan River from 2000 to 2007 was 43.1% higher, it increased by 25.95×10⁶m3per year, and by 13.7%, 14.09×10⁶m3per year for the Kunma Like River. Annual total runoff of the Toxkan River increased simply due to the increase of non-glacial runoff, while the increase of annual total runoff of the Kunma Like River was the result of increasing glacial runoff and increasing non-glacial runoff, and 42% of the increasing total runoff was from glacial runoff and 58% was from non-glacial runoff.

Figure 6 The varying characteristics of annual discharge (1970-2007) (a: Toxkan River; b: Kunma Like River)

Figure 7 The observed solar radiation at Urumqi station (from Tang et al., 2010)
5. Conclusions
Although the characteristics and importance of glacier and frozen soil in the land surface hydrology of cold regions have long been recognized, surprisingly, few hydrological models contain these numerical models. In view of this, in this study we coupled an energy-balance ice melt model to the variable infiltration capacity (VIC) macroscale hydrological model (with frozen soil and permafrost algorithm),considering sub-grid variability in meteorological elements of glacier area, to improve modeling performance in cold mountain catchments. Then we applied the improved VIC model to simulate the discharge from 1970 to 2007 in the glacierized catchment, Aksu River Basin. The daily discharge data (1980-1989) of two hydrological stations (Shali Guilanke and Xie Hela) was used to calibrate the VIC model to obtain optimized model parameters. Using these optimized parameters, the simulation achieved a Nash-Sutcliffe model efficiency coefficient ofR2=0.62 for the Toxkan River andR2=0.77 for the Kuma Like River for calibration period.The simulation of the monthly runoff for complete period(1970-2007) also achieved the desired results, the efficiency coefficient ofR2=0.77 for the Toxkan River andR2=0.87 for the Kuma Like River. The simulated results show that the model performance was obviously improved through coupling glacier scheme, and it is necessary to consider glacier hydrology in modeling the mountain hydrological processes in Northwestern China, especially in highly glacierized catchments. Numerical simulation test clearly demonstrate that the improved VIC model could accurately simulate the hydrological processes in cold glacierized catchments. Our glacier coupling methodology is a practical approach and supplies important references for the design of glacier scheme in a large scale land surface model.
The analysis of the simulated runoff components outlined that glacial meltwater accounts for 29.2% of runoff of the Toxkan River, while 58.7% of runoff of the Kunma Like River. Then runoff variation characteristics were analyzed,which show that from 1970 to 1997, the fluctuation of annual glacial runoff was consistent with that of annual mean air temperature, but after 1997, air temperature was at a higher level, and glacial runoff was at a lower level. This is because solar radiation, which is the principal source of energy for melting ice, was at a lower level. As a whole, the annual glacial runoff of the Toxkan River had a slightly decreasing trend of -0.87×10⁶m3per year, while the annual glacial runoff of the Kunma Like River had a rising trend of 5.9×10⁶m3per year. During the last 38 years, non-glacial runoff had a rising trend of 26.83×10⁶m3per year for the Toxkan River and 8.19×10⁶m3per year for the Kunma Like River. After 1997, the increase of non-glacial runoff was especially noticeable. On the one hand, this is because precipitation increased; on the other hand, air temperature grew rapidly which accelerated permafrost melt releasing vast amounts of water. Annual total runoff had a fluctuating rising trend, increased by 43.1% for the Toxkan River and 13.7% for the Kunma Like River during the last 38 years.Due to different glacial runoff ratio, annual total runoff of the Toxkan River increased simply due to an increase of non-glacial runoff, while the increase of annual total runoff of the Kunma Like River was the result of increasing glacial and non-glacial runoff, and 42% of the increased total runoff was from glacial runoff and 58% was from non-glacial runoff. In conclusion, our research methodology contributes to the qualitative evaluation and forecast of water resource change, and provides reference for formulating the scientific sustainable development of water resources in Northwestern China.
The work was supported by a grant from the Global Change Research Program of China (2010CB951404), the China National Natural Science Foundation (Grants No. 41030527,41130368), and the Hundred Talents Program of Chinese Academy of Sciences. Many thanks to Dr. Zhao CC and Dr.Wang J who contributed a lot to this study.
Akiyo Y, Osamu A, Kenji K, Haruko K, Masato IN, Atsushi H, 2009. A 44-year daily gridded precipitation dataset for asia based on a dense network of rain gauges. SOLA, 5: 137-140.
Barnett TP, Adam JC, Lettenmaier DP, 2005. Potential impacts of a warming climate on water availability in snow-dominated regions. Nature,438(7066): 303-309.
Beven KJ, 2001. Rainfall Runoff Modeling: The primer. John Wiley and Sons Ltd. 1-355.
Bowling LC, Pomeroy JW, Lettenmaier DP, 2004. Parameterization of blowing-snow sublimation in a macroscale hydrology model. Journal of Hydrometeorology, 5(5): 745-762.
Bras, 1990. Hydrology, an Introduction to Hydrologic Science. Addison Wesley, Inc., Reading, MA.
Braun LN, Weber M, Schulz M, 2000. Consequences of climate change for runoff from Alpine regions. Annals of Glaciology, 31: 19-25.
Brent RP, 1973. Algorithms for Minimization without Derivatives. Prentice-Hall, Englewood Cliffs NJ.
Brock BW, Willis IC, Sharp MJ, 2000. Measurment and parameteriziation of albedo variations at Haunt Glacier d’Arolla, Switzerland. Journal of Glaciology, 46(155): 675-688.
Chen RS, Kang ES, Ji XB, Yang JP, Yang Y, 2006. Cold regions in China.Cold Regions Science and Technology, 45(2): 95-102.
Chen RS, Lu SH, Kang ES, Ji XB, Yang Y, Zhang JS, 2008. A distributed water-heat coupled model for mountainous watershed of an inland river basin of Northwest China. Environ. Geol., 53: 1299-1309.
Cherkauer KA, Lettenmaier DP, 1999. Hydrologic effects of frozen soils in the Upper Mississippi River basin. J. Geophys. Res., 104(d16):19599-19610.
Cherkauer KA, Lettenmaier DP, 2003. Simulation of spatial variability in snow and frozen soil. J. Geophys. Res., 108(D22): 8858. Doi:10.1029/2003JD003575.
Christensen NS, Lettenmaier DP, 2007. A multimodel ensemble approach to assessment of climate change impacts on the hydrology and water resources of the Colorado River Basin. Hydrology and Earth System Sciences, 11: 1417-1434.
Costa-Cabral MC, Jeffrey ER, Jopalakrishna G, Dennis PL, Christoph F,Anond S, 2008. Landscape structure and use, climate, and water movement in the Mekong River basin. Hydrol. Process, 22(12): 1731-1746.
FAO and International Society of Soil Science (1971-1981), Soil map of the world: scale 1:5,000,000, Paris, UNESCO.
Farr TG, Paul AR, Edward C, Robert C, Riley D, Scott H, Micheal K, Mimi P, Ernesto R, Ladislav R, David S, Scott S, Joanne S, 2007. The Shuttle Radar Topography Mission. Rev. Geophys., 45: RG2004.
Gray DM, Landine PG, 1987. Albedo model for shallow prairie snow covers.Can. J. Earth Sci., 24(9): 1760-1768.
Hock R, 1998. Modeling of glacier melt and discharge. Diss. ETHZ 12430,Zürcher Geographische Schriften, 70: ISBN 3-906148-18-1, 140.
Hock R, 2005. Glacier melt: a review of processes and their modeling. Progress in Physical Geography, 29(3): 362-391.
Hock R, Holmgren B, 2005. A distributed surface energy-balance model for complex topography and its application to Storglaci?ren, Sweden. Journal of Glaciology, 51(172): 25-36.
Hock R, Jansson P, Braun L, 2005. Modeling the response of mountain glacier discharge to climate warming. In Global Change and Mountain Regions—A State of Knowledge Overview Advances in Global Change Series. In: Huber UM, Reasoner MA, Bugmann H (Eds.). Springer:Dordrecht. 243-252.
Huang M, Liang X, 2006. On the assessment of the impact of reducing parameters and identification of parameter uncertainties for a hydrologic model with applications to ungaged basins. J. of Hydrol., 320(1-2): 37-61.
Jiang X, 2008. Model study of the surface energy and mass balance of July 1st Glacier at Qilian Mountains in China during the summer ablation period. PhD thesis, States Key Laboratory of Cryospheric Sciences, Cold &Arid Regions Environmental and Engineering Research Institute, Chinese Academy of Sciences. 53-115.
Jiang Y, Zhou CH, Cheng WM, 2005. Analysis on runoff supply and variation characteristics of Aksu drainge basin. Journal of Natural Resources,20(1): 27-34.
Kang ES, Cheng GD, Lan YC, Jin HJ, 1999. A model for simulating the response of runoff from the mountainous watershed of inland river basins in the arid area of northwest China to climatic changes. Sci. China (Ser.D), 29(supp. 2): 49-54.
Lang H, 1986. Forecasting meltwater runoff from snow-covered areas and from glacier basins, in "River flow modelling and forecasting". In: Kraijenhoff DA, Moll JR (Eds.). D. Reidel Publishing, Dordrecht. 99-127.
Li X, Li XW, Li ZY, Ma MG, Wang J, Xiao Q, Liu Q, Che T, Chen EX,Yan GJ, Hu ZY, Zhang LX, Chu RZ, Su PX, Liu QH, Liu SM, Wang JD,Niu Z, Chen Y, Jin R, Wang WZ, Ran YH, Xin XZ, Ren HZ, 2009.Watershed allied telemetry experimental research. J. Geophys. Res., 114:D22103, 554.
Liang X, Lettenmaier DP, Wood EF, Burges SJ, 1994. A simple hydrologically based model of land surface water and energy fluxes for general circulation models. Journal of Geophysical Research, 99(D7):14415-14428.
Liang X, Wood EF, Lettenmaier DP, 1996. Surface soil moisture parameterization of the VIC-2L model: evaluation and modification. Glob. Planet.Change, 13(1-4): 195-206.
Lohmann D, Raschke E, Nijssen B, Lettenmaier DP, 1998a. Regional scale hydrology: I. Formulation of the VIC-2L model coupled to a routing model. Hydrological Sciences Journal, 43: 131-141.
Lohmann D, Raschke E, Nijssen B, Lettenmaier DP, 1998b. Regional scale hydrology: II. Application of the VIC-2L model to the Weser River,Germany. Hydrological Sciences Journal, 43: 143-157.
Mark BG, Seltzer GO, 2003. Tropical glacier meltwater contribution to stream discharge: a case study in the Cordillera Blanca, Peru. J. Glaciol.,49(165): 271-281.
Martinec J, Rango A, 1986. Parameter values for snowmelt runoff modeling.J. Hydrol., 84: 197-219.
Mesinger F, Treadon RE, 1995. "Horizontal" reduction of pressure to sea level: Comparison against the NMC’s Shuell method. Mon. Wea. Rev.,123: 59-68.
Nash JE, Sutcliffe JV, 1978. River flow forecasting through conceptual models, Part I: A discussion of principles. J. Hydrol., 10(3): 282-290.
Nijssen B, Lettenmaier DP, Liang X, Wetzel SW, Wood EF, 1997. Streamflow simulation for continental-scale river basins. Water Resource. Res.,33: 711-724.
Nijssen B, Schnur R, Lettenmaier DP, 2001. Global retrospective estimation of soil moisture using the Variable Infiltration Capacity landsurface model, 1980-1993. Journal of Climate, 14(8): 1790-1808.
Shen YP, Wang GY, Ding YJ, Mao WF, Liu SY, Wang SD, 2009. Changes in glacier mass balance in watershed of Sary Jaz-Kumarik rivers of Tianshan Mountains in 1957-2006 and their impact on water resources and trend to end of the 21th Century. Journal of Glaciology & Geocryology, 31(5): 792-800.
Shi YF, Shen YP, Hu RJ, 2002. Preliminary study on signal, impact and foreground of climatic shift from warm-dry to warm-humid in Northwest China. Journal of Glaciology & Geocryology, 24(3): 219-226.
Shuttleworth WJ, 1993. Evaporation. In: Maidment DR (Ed.). Handbook of Hydrology. McGraw-Hill Inc., New York. 4.1-4.53.
Singh P, Bengtsson L, 2005. Impact of warmer climate on melt and evaporation for the rainfed, snowfed and glacierfed basins in the Himalayan region. Journal of Hydrology, 300: 140-154.
Storck P, 2000. Trees, snow and flooding: an investigation of forest canopy effects on snow accumulation and melt at the plot and watershed scales in the Pacific Northwest, Water Resource Series. Technical Report, Dept.of Civil Engineering, University of Washington, USA. 161: 1-53.
Sun S, Jin J, Xue Y, 1999. A simple snow-atmosphere-soil transfer model. J.Geophys. Res., 104(D16): 19587-19597.
Tang QC, Qu YG, Zhou ZC, 1992. Hydrology and Water Resources of Arid Area in China. Science Press, Beijing. 44-80.
Tang WJ, Yang K, Qin J, Chen CCK, He J, 2010. Solar radiation trend across China in recent decades: a revisit with quality-controlled data.Atmos. Chem. Phys. Discuss., 10: 18389-18418.
Thornton PE, Running SW, 1999. An improved algorithm for estimating incident daily solar radiation from measurements of temperature, humidity, and precipitation. Agric. Forest Meteorol., 93 (4): 211-228.
Viviroli D, Dürr HH, Messerli B, Meybeck M, Weingartner R, 2007.Mountains of the world water towers for humanity: typology, mapping and global significance. Water Resources Research, 43(7): W07447.
Webb RS, Rosenzweig CE, Levine ER, 1993. Specifying land surface characteristics in general circulation models: Soil profile data set and derived water-holding capacities. Global Biogeochemical Cycles, 7(1): 97-108.
Wigmosta MS, Vail LW, Lettenmaier DP, 1994. A distributed hydrology-vegetation model for complex terrain. Water Resources Research,30(6): 1665-1679.
Xie Z, Yuan FA, 2006. Parameter estimation scheme of the land surface model VIC using the MOPEX databases. IAHS Publication, 307: 169-179.
Yang ZN, Liu XR, Zeng QZ, 2000. Hydrologic process in cold region of China. Science Press, Beijing. 1-105.
Zhao Q, Liu Z, Ye B, Qin Y, Wei Z, Fang S, 2009. A snowmelt runoff forecasting model coupling WRF and DHSVM. Hydrol. Earth Syst. Sci.,13: 1897-1906.
10.3724/SP.J.1226.2011.00498
*Correspondence to: QiuDong Zhao, Cold and Arid Regions Environmental and Engineering Research Institute, Chinese Academy of Sciences. No. 320, West Donggang Road, Lanzhou, Gansu 730000, China. Email: dsslab@163.com
23 June 2011 Accepted: 26 September 2011
 Sciences in Cold and Arid Regions2011年6期
- Sciences in Cold and Arid Regions的其它文章
- Analysis on the temporal-spatial distribution character and effect factors of PM10 in the hinterland of Taklimakan Desert and surrounding area
- Variability of atmospheric freezing level height derived from radiosonde data in China during 1958-2005 and its impact to cryosphere changes
- Impacts of snow cover and frozen soil in the Tibetan Plateau on summer precipitation in China
- Incident analyses of frost heaving failure of municipal underground gas pipelines in cold regions of northern China
- Characteristics of dynamic strain and strength of frozen silt under long-term dynamic loading
- Climatic changes have led to significant expansion of endorheic lakes in Xizang (Tibet) since 1995