
A novel CBAMs-BiLSTM model for Chinese stock market forecasting
2024-05-13 09:47:08ChenhaoCuiandYongLi
中國科學(xué)技術(shù)大學(xué)學(xué)報 2024年2期
Chenhao Cui, and Yong Li ?
School of Management, University of Science and Technology of China, Hefei 230026, China
Abstract: The convolutional block attention module (CBAM) has demonstrated its superiority in various prediction problems, as it effectively enhances the prediction accuracy of deep learning models.However, there has been limited research testing the effectiveness of CBAM in predicting stock indexes.To fill this gap and improve the prediction accuracy of stock indexes, we propose a novel model called CBAMs-BiLSTM, which combines multiple CBAM modules with a bidirectional long short-term memory network (BiLSTM).In this study, we employ the standard metric evaluation method(SME) and the model confidence set test (MCS) to comprehensively evaluate the superiority and robustness of our model.We utilize two representative Chinese stock index data sets, namely, the SSE Composite Index and the SZSE Composite Index, as our experimental data.The numerical results demonstrate that CBAMs-BiLSTM outperforms BiLSTM alone,achieving average reductions of 13.06%, 13.39%, and 12.48% in MAE, RMSE, and MAPE, respectively.These findings confirm that CBAM can effectively enhance the prediction accuracy of BiLSTM.Furthermore, we compare our proposed model with other popular models and examine the impact of changing data sets, prediction methods, and the size of the training set.The results consistently demonstrate the superiority and robustness of our proposed model in terms of prediction accuracy and investment returns.
Keywords: stock index prediction; BiLSTM; CBAM; MCS; SME
1 Introduction
Stocks play a pivotal role in financial markets, making stock indexes of great interest to regulators and investors alike.At the macro level, stock indexes are influential factors in the stability of the financial environment and economic development, as well as serving as early warning indicators for the economic climate[1].Thus, stock indexes hold significant importance for regulators.On a micro level, the fluctuations of stock indexes directly impact investment risks and returns.Accurate prediction of stock indexes not only aids regulators in overseeing stock markets but also assists investors in making informed investment decisions.However, the prediction of stock indexes is a challenging task due to the complex factors influencing them, such as price levels, monetary policies, and market interest rates[2,3].
Traditionally, researchers in stock index prediction have favored statistical methods, such as regression analysis[4], generalized autoregressive conditional heteroscedasticity(GARCH)[5], autoregressive integrated moving average(ARIMA)[6,7], and smooth transition autoregressive model(STAR)[8].However, these methods rely on assumptions of time series stationarity and linearity among normally distributed variables, which are not satisfied in real stock markets[9].Consequently, these models exhibit poor prediction accuracy when dealing with nonlinear and nonstationary stock data[10].
Machine learning models, particularly neural networks,have shown better performance in extracting nonlinearity and nonstationarity from financial time series compared to classical statistical models[11].Neural networks leverage nonlinear activation functions to capture complex information in the data[12,15].For instance, Yu et al.[13]utilized a local linear embedding dimensionality reduction algorithm (LLE) to reduce the dimensionality of factors influencing stock indexes.They then employed a back-propagation (BP) neural network to optimize stock index prediction.Recurrent neural networks(RNNs) in deep learning can effectively extract autocorrelation information due to their recurrent structure[16].Long shortterm memory (LSTM), a type of RNN, not only extracts autocorrelation information but also addresses the vanishing or exploding gradient problem through gating functions[17].Bidirectional LSTM (BiLSTM) differs from LSTM by considering both historical and future information, enhancing sequence analysis[18].Several studies have confirmed the predictive superiority of BiLSTM over LSTM in stock data[19-21].
The attention mechanism (AM) is a network module that dynamically learns the weights of each feature, while the convolutional block attention module (CBAM) represents an enhanced version of the attention mechanism.CBAM introduces an attention mechanism for spaces and channels, enabling models to focus on essential features and disregard irrelevant ones, thereby improving the prediction accuracy of network models[14].Additionally, CBAM effectively reduces the interference caused by redundant features[22].Cheng et al.[23]integrated CBAM into a temporal convolutional network(TCN) to create the hybrid model TCN-CBAM for predicting chaotic time series.The experimental results demonstrate that incorporating CBAM significantly enhances the prediction accuracy of the TCN.Li et al.[24]proposed a fault diagnosis model for rolling bearings that combines a dual-stage attention-based recurrent neural network (DA-RNN), CBAM,and convolutional neural network (CNN).By utilizing two vibration data sets from rolling bearings, they confirmed that the proposed DARNN-CBAM-CNN method improves the fault diagnosis accuracy by 1.90% compared to a DARNNCNN method without CBAM.In the domain of gold price prediction, Liang et al.[14]highlighted that CBAM, unlike the attention mechanism, allocated weights across the two independent dimensions of channel and space, leading to better prediction accuracy in theory.Moreover, CBAM has proven effective in improving prediction accuracy in other areas,such as global horizontal irradiance (GHI) prediction[25]and PM2.5 concentration prediction[26].However, despite the extensive research on CBAM’s effectiveness in other fields, it has been relatively underutilized in stock index prediction.Furthermore, existing studies lack a detailed analysis of whether the position and quantity of CBAM in models affect prediction accuracy.
In summary, this paper aims to leverage the proven superiority of CBAM in other prediction problems and the established effectiveness of BiLSTM in stock data.To achieve this, the paper proposes a novel model called CBAMBiLSTM, which combines CBAM with BiLSTM to further enhance the prediction accuracy of stock indexes.The experimental data consist of two representative Chinese stock index data sets, namely, the SSE Composite Index and the SZSE Composite Index.The prediction accuracy of the models is assessed using standard metric evaluation methods (SME)and the model confidence set test (MCS).For comparison,classical models in time series prediction problems, such as BiLSTM, CNN, LSTM, CNN-LSTM, and CNN-BiLSTM,are chosen as benchmark models.
The initial experiments focus on conducting a detailed analysis of how the position and quantity of CBAM affect the prediction accuracy of BiLSTM.The numerical results demonstrate that the proposed model exhibits significant improvements compared to BiLSTM alone, with an average reduction of 13.06%, 13.39%, and 12.48% in MAE, RMSE,and MAPE, respectively, and an average improvement of 1.98% inR2.These findings confirm that the combination of CBAM and BiLSTM can further enhance the prediction accuracy of BiLSTM.
Furthermore, the paper validates the superiority and robustness of the proposed CBAM-BiLSTM model by comparing it with other popular models and evaluating its performance under different data sets, prediction methods, and training set sizes.This analysis encompasses both prediction accuracy and investment returns.
The innovations and contributions of this paper can be summarized as follows.First, the paper introduces a rational strategy that combines CBAM and BiLSTM to propose the advanced CBAM-BiLSTM model, thereby further improving the accuracy of stock index prediction.Second, the paper conducts a detailed analysis to investigate the impact of the position and quantity of CBAM on the prediction accuracy of BiLSTM.
The rest of the paper is organized as follows.Section 2 presents the methodology, which provides a detailed explanation of the structure and principles of the proposed CBAMBiLSTM model.Section 3 comprises an analysis of the experiments, including information about the experimental data,experimental design, and result analysis.Finally, Section 4 concludes the article by summarizing the key findings, discussing some shortcomings, and outlining future research plans.
2 Methodology
2.1 Structure and principle of CBAM-BiLSTM
The structure of CBAM-BiLSTM is shown in Fig.1.Multiple CBAMs and a BiLSTM are mixed using a linear stacking approach, with multiple CBAMs placed in front of BiLSTM used to achieve a sufficiently rational distribution of attention weights to input features.In CBAM-BiLSTM, the number of CBAMs is a hyperparameter that needs to be set artificially.Similar to other hyperparameters in a deep learning model, the number of CBAMs can be chosen as an appropriate value by comparing the prediction accuracy of models on the validation set.CBAMn-BiLSTM is CBAM-BiLSTM containingnCBAM.For example, CBAM3-BiLSTM means that the CBAM-BiLSTM model contains three CBAM modules.The structures of CBAM and BiLSTM are described in detail below.
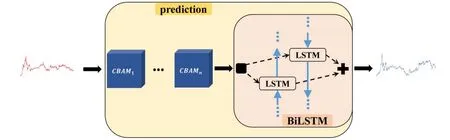
Fig.1.Structure of CBAM-BiLSTM.
2.2 Structure and principle of BiLSTM
LSTM overcomes the problem of gradient disappearance or explosion that RNNs have by introducing long-term memory states and multiple gating functions.These gating functions selectively forget or remember new information in the longterm memory state, which in turn allows information useful for subsequent moments of computation to be passed and useless information to be discarded[27,28].BiLSTM consists of two independent LSTM layers that have the same input but transfer information in opposite directions.Therefore, compared to LSTM, BiLSTM can improve the prediction accuracy by fully considering both historical and future information.The cell structure of LSTM and the network structure of BiLSTM are shown in Fig.2.

Here,w,bare the weight matrix and the deviation vector of the corresponding gating functions, respectively.c?tdenotes the long-term memory state of the current input.“ ?”denotes the scalar product between vectors.“ ·” denotes matrix multiplication.
In the network structure of BiLSTM, the same input data arefedtotheforwardLSTMlayerandbackwardLSTM layer, andthe hiddenstateinthe forwardLSTMlayerand the hidden statein the backward LSTM layer are computed.In the forward LSTM layer, forward computation is performed from time 1 to timet.In the backward LSTM layer, backward computation is performed from timetto time 1.The outputs of the current prehidden state and posthidden state are obtained and saved at each time unit.Then, two hidden states are connected to calculate the output value of BiLSTM.Eqs.(7)-(9) represent the calculation process of BiLSTM.
Here, L STM(·) denotes the mapping of the already defined LSTM network layers.wfandwbdenote the weight matrices of the forward LSTM layer and backward LSTM layer, respectively.bdenotes the deviation vector of the output layer.
2.3 Structure and principle of CBAM
CBAM can implement an attention mechanism on both space and channel, which in turn can focus on key features and ignore useless features.After features are brought up by the convolutional neural network implementation, CBAM computes the weight mapping of feature mapping from both channel and spatial dimensions and then multiplies the weights with input features for adaptive learning.This lightweight general-purpose module can be integrated into a variety of convolutional neural networks for end-to-end training[31].Fig.3 illustrates the network structure of CBAM.
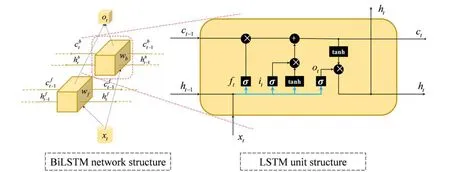
Fig.2.Structure of LSTM and BiLSTM.
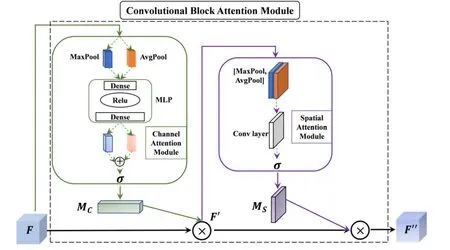
Fig.3.Structure of CBAM.
From Fig.3, the channel attention module (CAM) outputs a one-dimensional channel attention vectorMC, which is used to assign weights to each channel, indicating the importance of each channel.The spatial attention module outputs a threedimensional spatial attention tensorMS, which indicates which features at which locations in the three-dimensional space are key features and which are secondary features.Eqs.(10) and (11) represent the whole calculation process.
Here,MC(F) represents the output of the channel attention module when the input isF.MS(F′) represents the output of the spatial attention module when the input isF′.? represents element multiplication.Pooling operations in CBAM include two types: “MaxPool” and “AvgPool”.Pooling can extract high-level features, and different pooling methods mean that the extracted high-level features are richer.From Fig.3,we can see that Eq.(12) represents the computation process of the channel attention module, and that Eq.(13) represents the computation process of the spatial attention module.
Here, AvgPool(·) is the average pooling of input features.MaxPool(·) maximizes the pooling of input features.MLP(·)is the output of a multilayer perceptron.Conv(·) is the output of a convolutional layer.
2.4 Evaluation of model performance
The standard metric evaluation method (SME) and model confidence set test (MCS) are used to comprehensively evaluate the performance of the models.
2.4.1 Standard metric evaluation method Loss error is the difference between the observed and predicted values and is used to evaluate the prediction accuracy of models.The mean absolute error (MAE), root mean square error (RMSE), mean absolute percentage error (MAPE), and coefficient of fit (R2) are chosen to comprehensively evaluate the prediction accuracy of the models.Smaller MAE, RMSE,and MAPE values indicate a higher prediction accuracy of the models; largerR2values indicate a higher prediction accuracy of the models.The true value isy=(y1,y2,···,yn), and the predicted value isy?=(y?1,y?2,···,y?n).The equations below are expressions of metrics.
The Sharpe ratio is an indicator that combines the returns and risk of an investment.Experiments use the Sharpe ratio to evaluate the superiority of models in terms of investment returns.The expression of the Sharpe ratio is given as
Here,Rpis the return sequence.E(Rp) is the mean ofRp.Rfis the risk-free rate.σpis the standard deviation ofRp.To facilitate calculation, letRf=0.
2.4.2 Model confidence set test
The model confidence set (MCS) test proposed by Hansen et al.[33]is used to test whether there is a significant difference between the prediction accuracy of different models.More conveniently, we can calculate MCSpvalues of models to quantify the model’s prediction accuracy and to visually compare the strengths and weaknesses of different models’ prediction accuracy.This method is widely used to test differences in prediction performance between different predictive models[34-36].
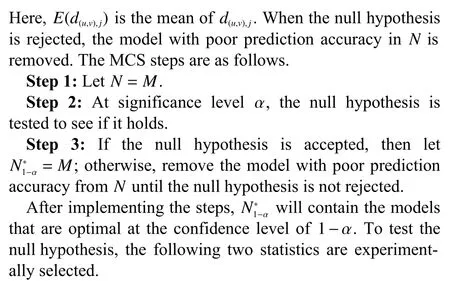
The MCS test is designed to test the significance of differences in the prediction accuracy of models in a set and to eliminate the model with poor prediction accuracy.Therefore,in each test, the null hypothesis is that all models have the same prediction accuracy.That is.
3 Analysis of experiments
3.1 Data introduction
Two representative Chinese stock index data sets, the SSE Composite Index (index code: 000001; the abbreviation for it is SHCI in this article) and the SZSE Composite Index(index code: 399106; the abbreviation for it is SZCI in this article), have been carefully selected as the experimental data for this study.The SHCI data set consists of all stocks listed on the Shanghai Stock Exchange, including A shares and B shares.It effectively captures the price movements of stocks listed on the Shanghai Stock Exchange.The SZCI data set represents a weighted composite stock index compiled by the Shenzhen Stock Exchange.It is calculated based on all stocks listed on the Shenzhen Stock Exchange, with each stock’s issue weight taken into account.The time period for the two data sets spans from 2012-06-14 to 2022-08-31.Daily data for the study are obtained from the Wind database.
In this study, the closing price of the stock indexes is chosen as the experimental data.The data are divided into three parts: training data, validation data, and test data, as illustrated in Fig.4.The training data are utilized to calculate the weights and biases of the models.The validation data are employed to determine the optimal number of CBAMs if necessary.Finally, the trained models are evaluated on the test set.Notably, all models have been trained and converged, ensuring that there is no overfitting issue.
Table 1 summarizes the statistics of the two data sets.Based on the results of the Jarque-Bera (JB) test, the null hypothesis of a normal distribution is rejected at the 5% significance level for both the SHCI and SZCI.Additionally, the results of the Ljung-Box test suggest that the null hypothesis of no autocorrelation up to the 20th order is rejected at the 5%significance level for both data sets, indicating the presence of long-term serial autocorrelation in SHCI and SZCI.
3.2 Preprocessing of data
Max-min normalization can speed up the training process of models and facilitate the convergence of models[14].Therefore,the data are first normalized.The normalization formula is as follows.
Here, ← denotes assignment.yiis the closing price at momenti.The prediction method in the experiments is to use 60 days as a time step to predict the next day and then keep sliding forward.The form of the data is shown in Fig.5.The expression is shown in Eq.(22).
3.3 Related hyperparameter settings
The experiments were conducted usingPython3.8.1 as the programming language andPyCharm2020.1.2 (Community Edition) as the compiler.ThePythonlibraries used include numpy 1.23.3, pandas 1.4.4, matplotlib 3.6.1, TensorFlow 2.10.0, keras 2.10.0, sklearn 1.1.3, and arch 5.3.1.To ensure reproducibility of the results, random seeds were set to 12,1234, and 2345.To focus on the performance of the models rather than the influence of hyperparameters on the prediction results, consistent hyperparameter values were used for different models, as indicated in Table 2.The default values were retained for the remaining hyperparameters.
3.4 The impact of CBAM on BiLSTM
Despite the demonstrated superiority of CBAM in various domains, there is a lack of detailed analysis in existing studies regarding the influence of CBAM’s position and quantity on prediction accuracy.To fill this gap, the experiments are divided into two parts.The first part examines the impact of CBAM position on the prediction accuracy of BiLSTM, while the second part investigates the effect of CBAM quantity on the prediction accuracy of BiLSTM.This approach allows for a comprehensive understanding of how the position and amount of CBAM in models can affect prediction accuracy.
3.4.1 The impact of the position of CBAM on BiLSTM

Fig.4.Two stock indexes.

Table 1.Summary statistics of data sets.
First, the impact of CBAM position on prediction accuracy is analyzed.Two modeling schemes are considered: CBAM in front of BiLSTM (CBAM_f_BiLSTM) and CBAM behind BiLSTM (CBAM_b_BiLSTM).Fig.6 illustrates these two modeling schemes, and Table 3 presents the results on the test sets for both schemes.Furthermore, the robustness analysis of the two modeling schemes on the test sets is shown in Table 4.
The values in Table 4 are explained as follows.The“model 1 / model 2” column represents the percentage optimization of model 1 compared to model 2.The “Mean” column displays the mean optimization percentage for the two modeling schemes across different data sets, while the “Std” column represents the standard deviation of the optimization percentage for the two schemes across different data sets.
To illustrate the calculation process, let us consider the example of the MAE optimization percentage in the mean column (-1.65%).For the SHCI data set, CBAM_f_BiLSTM/BiLSTM = (34.0270 - 35.3833)/34.0270 × 100% =-3.99%, where 34.0270 and 35.3833 are values from Table 3.Similarly, for the SZCI data set, CBAM_f_BiLSTM/BiLSTM = (30.8811 - 30.6652)/30.8811× 100% = 0.70%,where 30.8811 and 30.6652 are values from Table 3.Thus,for MAE, the mean of CBAM_f_BiLSTM/BiLSTM is calculated as (-3.99% + 0.70%)/2 = -1.65%.The standard deviation (Std) of CBAM_f_BiLSTM/BiLSTM is computed as follows:
Here, Sqrt{ } represents the arithmetic square root function,and Square[] represents the square function.
The optimization percentages for RMSE and MAPE are calculated in the same manner as MAE.However, the optimization percentage forR2is calculated in the opposite way to MAE.Let us consider the example of theR2optimization percentage in the mean column (0.11%).For the SHCI data set,CBAM_f_BiLSTM/BiLSTM = (0.9404 - 0.9448)/0.9448 ×100% = -0.47%, where 0.9404 and 0.9448 are values from Table 3.Similarly, for the SZCI data set, CBAM_f_BiLSTM/BiLSTM =(0.9466-0.9400)/0.9400×100%=0.70%,where 0.9466 and 0.9400 are values from Table 3.Therefore,forR2, the mean of CBAM_f_BiLSTM/BiLSTM is calculated as ( -0.47%+0.70%)/2=0.11%.The standard deviation is computed as Std = Sqrt{Square[-0.47% - 0.11%] +Square[0.70% - 0.11%]} = 0.5850.
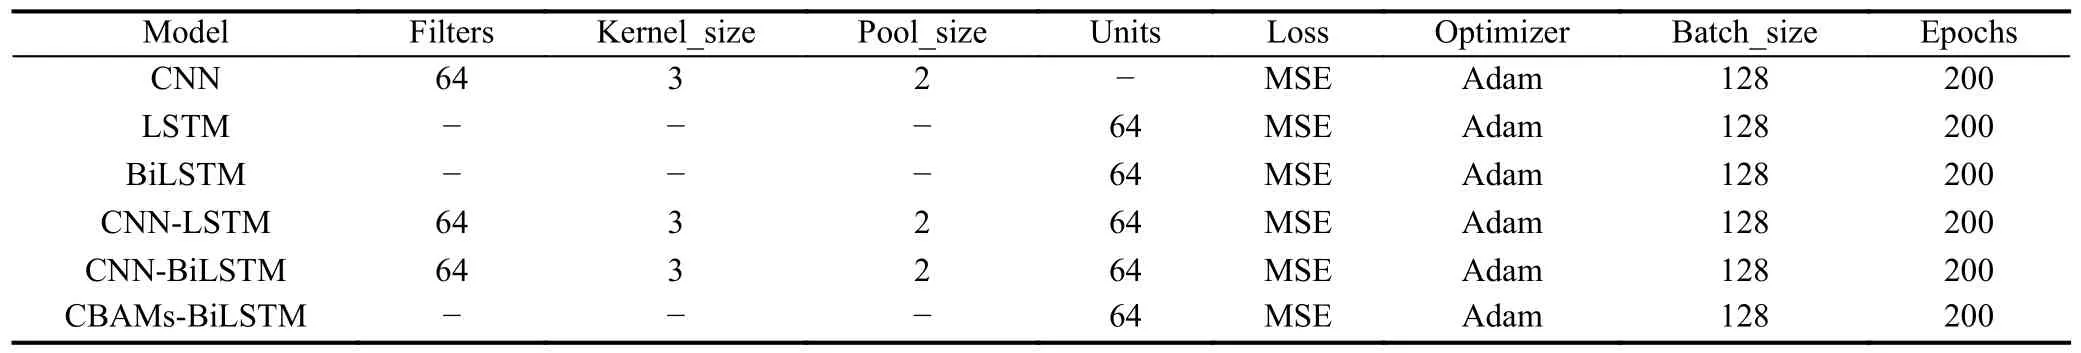
Table 2.Hyperparameters of models.
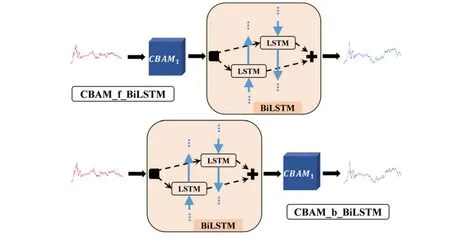
Fig.6.Two modeling schemes.

Table 3.SME of two modeling schemes on test sets.
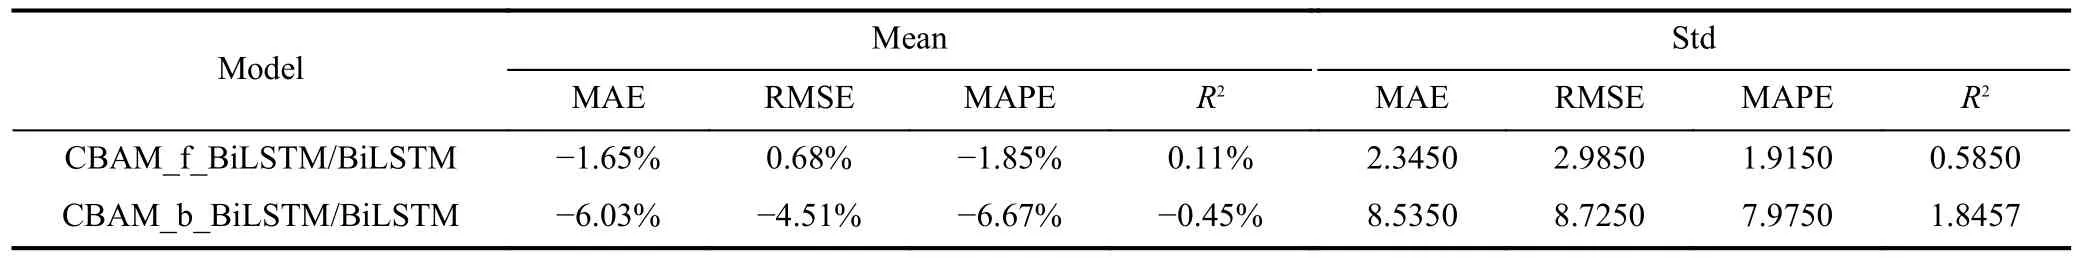
Table 4.Robustness analysis of two modeling schemes on test sets.
Table 4 clearly shows that CBAM_f_BiLSTM outperforms CBAM_b_BiLSTM in all metrics.Additionally,CBAM_f_BiLSTM exhibits smaller standard deviations for each metric.These findings indicate that CBAM_f_BiLSTM not only achieves better prediction accuracy but also demonstrates stronger robustness.Consequently, the modeling scheme with CBAM in front of BiLSTM is considered superior.
3.4.2 The impact of the amount of CBAM on BiLSTM
Although CBAM_f_BiLSTM demonstrates better prediction accuracy and robustness than CBAM_b_BiLSTM, it is slightly less effective than the standalone BiLSTM model.Therefore, the analysis now focuses on increasing the amount of CBAM to examine its impact on prediction accuracy.
Fig.7 displays the results of models with varying amounts of CBAM on the test sets, ranging from 1 to 15.Table 5 presents the corresponding results, while Table 6 provides the robustness analysis of these models.The symbols and calculation procedure in Table 6 are consistent with those in Table 4.
From Fig.7, it is evident that when the amount of CBAM is set to 6 or 15, the proposed model performs poorly on SZCI, despite its good performance on SHCI.Table 6 reveals that in such cases, the standard deviation for each metric is higher compared to the other results.Additionally, the mean for each metric is negative.These observations indicate that when the amount of CBAM is 6 or 15, the model not only predicts worse than BiLSTM but also exhibits poor robustness.Based on these experimental findings, it is apparent that the prediction accuracy of CBAM-BiLSTM significantly improves compared to BiLSTM when the amount of CBAM is not equal to 1, 6, 10, or 15.
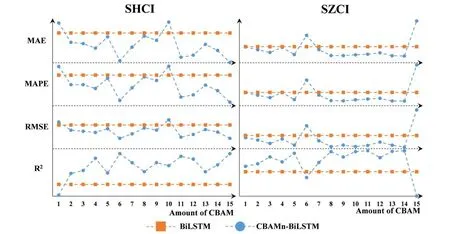
Fig.7.Results for models with different amounts of CBAM on test sets, which are calculated based on the data without normalization.

Table 5.SME of models with different amounts of CBAM on test sets.
Furthermore, Table 6 indicates that when the amount of CBAM is 8, 9, 11, 12, 13, or 14, the standard deviation for each metric is smaller, while the mean for each metric is larger.This suggests that the model not only achieves higher prediction accuracy but also maintains good robustness.
To further validate the experimental findings presented in Table 6, the model confidence set (MCS) test is employed to analyze the prediction accuracy and robustness of the models with varying numbers of CBAM.Table 7 displays the MCSpvalues for the models obtained by summing errors from different test sets.The MCS test in these experiments is implemented using thePythonlibrary arch 5.3.1, with the random seed set to 12345.It is important to note that the MCSpvalues are not the result of a probability calculation and do not possess probabilistic significance.Instead, larger values indicate higher prediction accuracy for the corresponding model,with a maximum value of 1.
As observed in Table 7, when the amount of CBAM is set to 11, the MCSpvalues for the model reach 1.00 for both test statistics, indicating the model’s superior prediction accuracy.In line with this, Table 6 demonstrates that compared to BiLSTM, CBAM11-BiLSTM exhibits an average reduction of 13.06%, 13.39%, and 12.48% in MAE, RMSE, and MAPE, respectively, while showcasing an average improvement of 1.98% inR2.
3.5 Superiority and robustness of CBAM-BiLSTM
The aforementioned experiments provide a comprehensive analysis of the impact of the position and amount of CBAM on the prediction accuracy of BiLSTM.This section further explores the superiority and robustness of CBAM-BiLSTM in terms of prediction accuracy and investment returns.
First, the prediction accuracy of the models is examined using different prediction methods on the test sets.Subsequently, the influence of the training sample size on the prediction accuracy of the proposed model is analyzed.Finally,the experiments delve into the assessment of investment returns generated by the models on the test sets.
Tables 8 and 9 present the outcomes of the SME and MCSpvalues, respectively, on the test sets when models are based on different prediction methods.Eq.(22) illustrates the expression for autoregressive one-step prediction, while Eq.(23) showcases the expression for autoregressive multistep prediction.Additionally, Eq.(24) demonstrates the expression for multivariate one-step prediction.
Here,yirepresents the closing price at momenti,xirefers to the opening price at momenti,hidenotes the highest price at momenti,lirepresents the lowest price at momenti,visignifies the volume at momenti, andtirepresents the turnover at momenti.
From Table 8, it is evident that the proposed model exhibits the minimum error in each prediction method.Moreover,in Table 9, the MCSpvalues for the proposed model are consistently 1 across all prediction methods.These findings reinforce that, compared to other popular models, the proposed model achieves the highest prediction accuracy across different data sets and prediction methods.Thus, the results in Table 8 and Table 9 validate the superiority and robustness of the proposed model in terms of prediction accuracy.
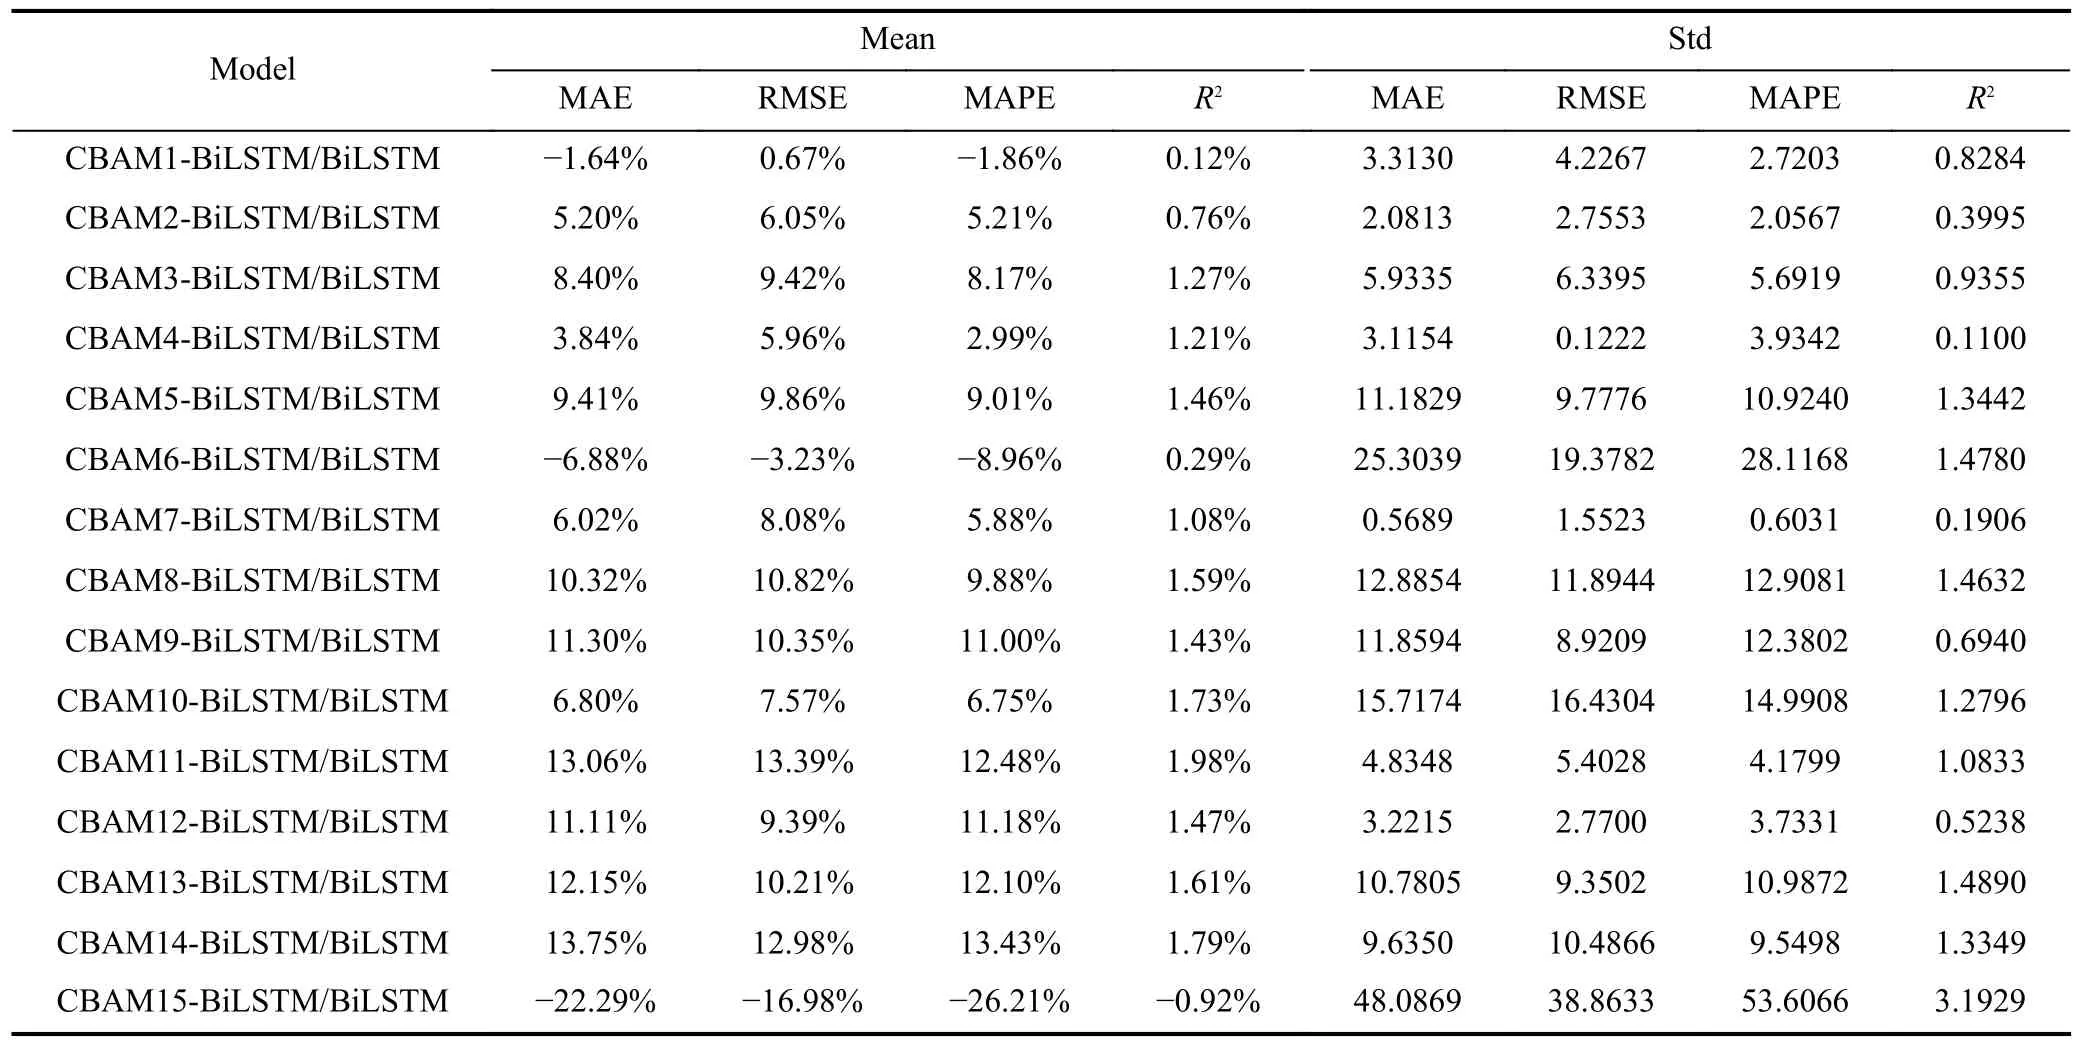
Table 6.Robustness analysis of models with different amounts of CBAM on test sets.
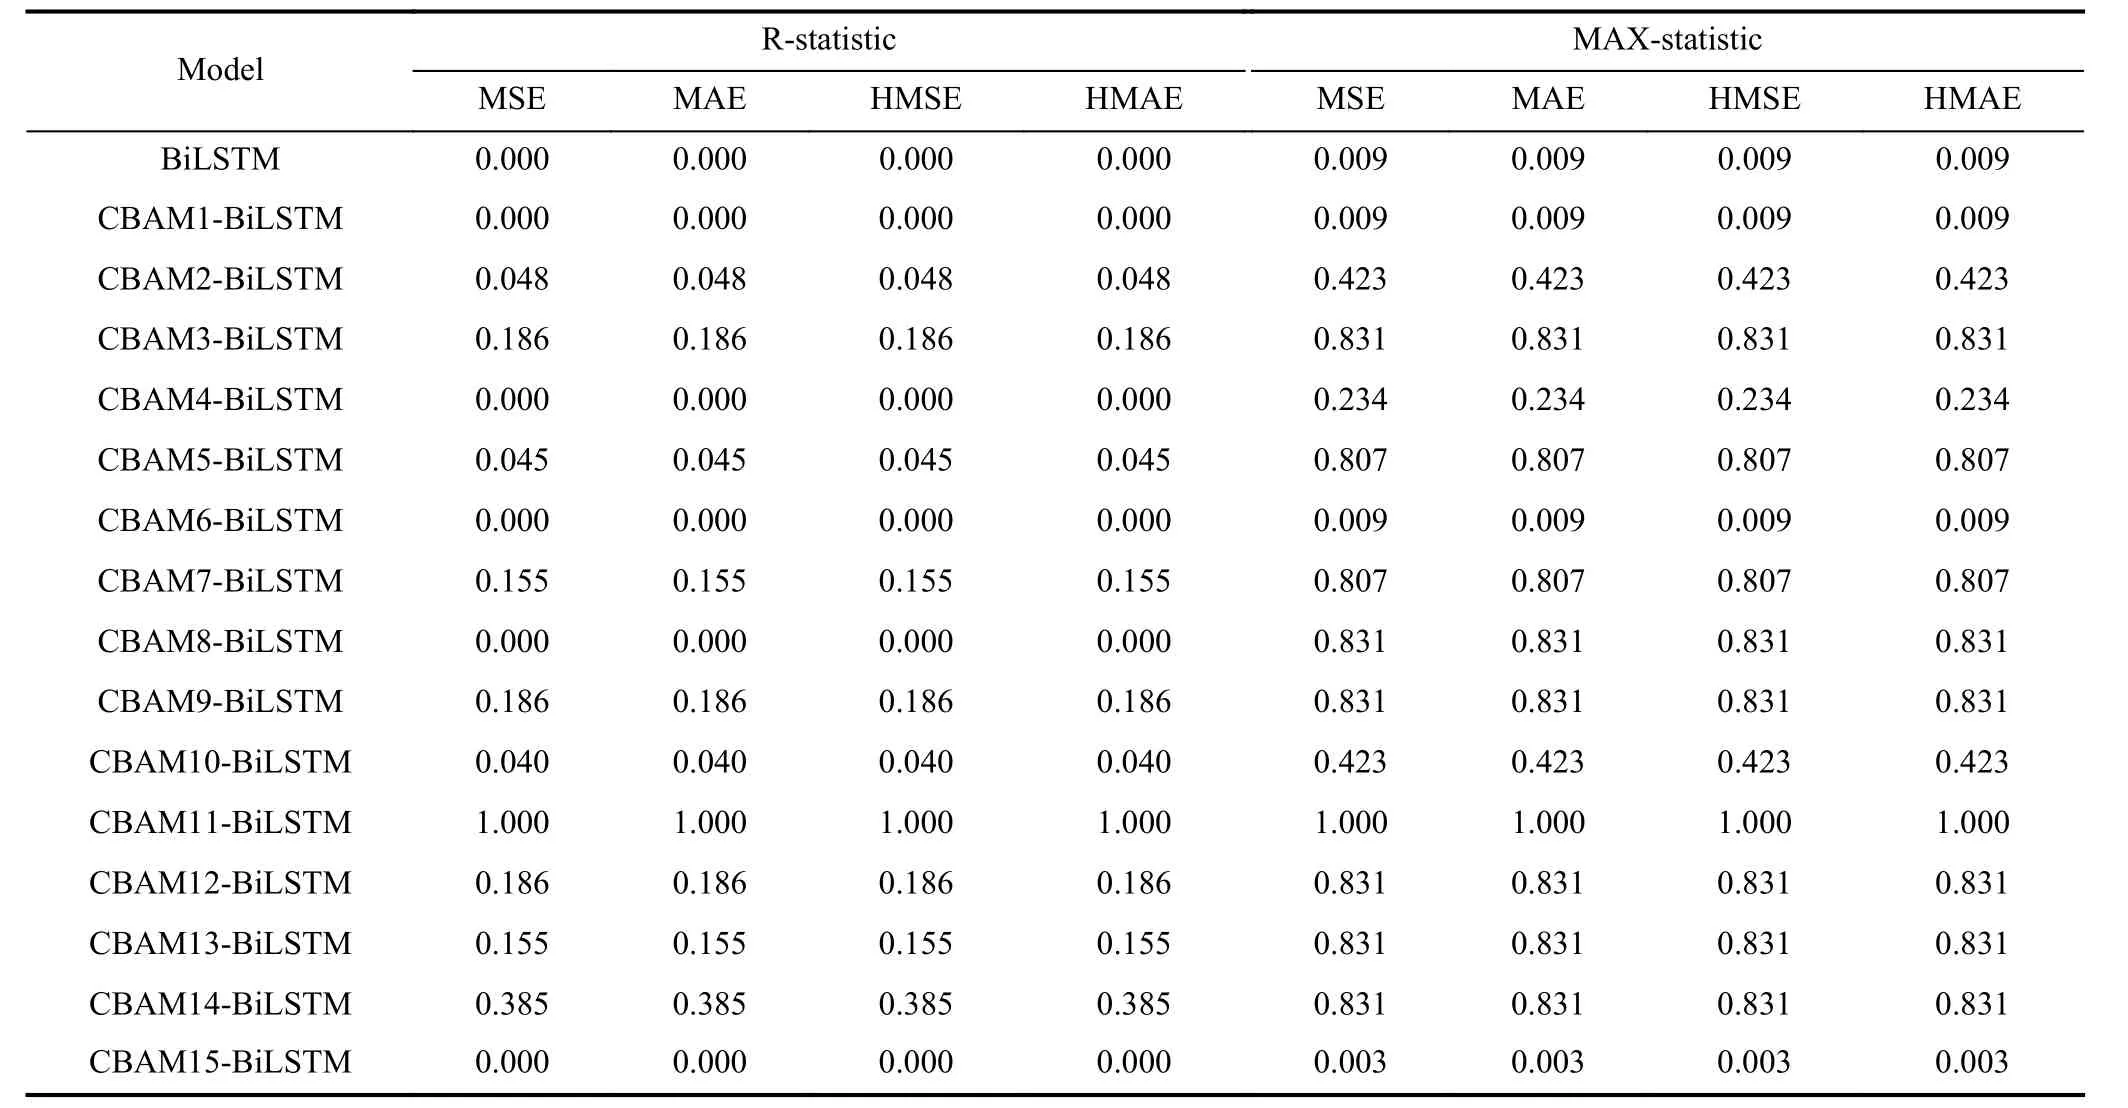
Table 7.MCS p values on test sets.
Fig.8 illustrates the influence of the training set size on the prediction accuracy of CBAM-BiLSTM, withR2selected as the metric.It is observed thatR2remains highly consistent as the size of the training set varies across each data set.This stability reinforces the notion that the proposed model exhibits strong robustness in relation to the size of the training set.
Ideally, a market prediction system can be integrated as a module within a trading system, where improved prediction accuracy is expected to yield higher profits.In this context,we present experiments that utilize the proposed model as the prediction subsystem of a simple trading system.It is important to note that the overall performance of the system depends on how the predictions are utilized for trading.The trading strategy employed in our experiments is as follows: IfFig.8.Impact of the size of the training set on the prediction accuracy of CBAM-BiLSTM.the predicted price for dayt+1 is higher than the true price for dayt, the predicted label for daytis considered “up”; otherwise, it is considered “down”.When the predicted label for the next day is “up”, the trading system fully invests in the corresponding index and holds the shares until a “down”label is encountered, at which point the system closes the position.
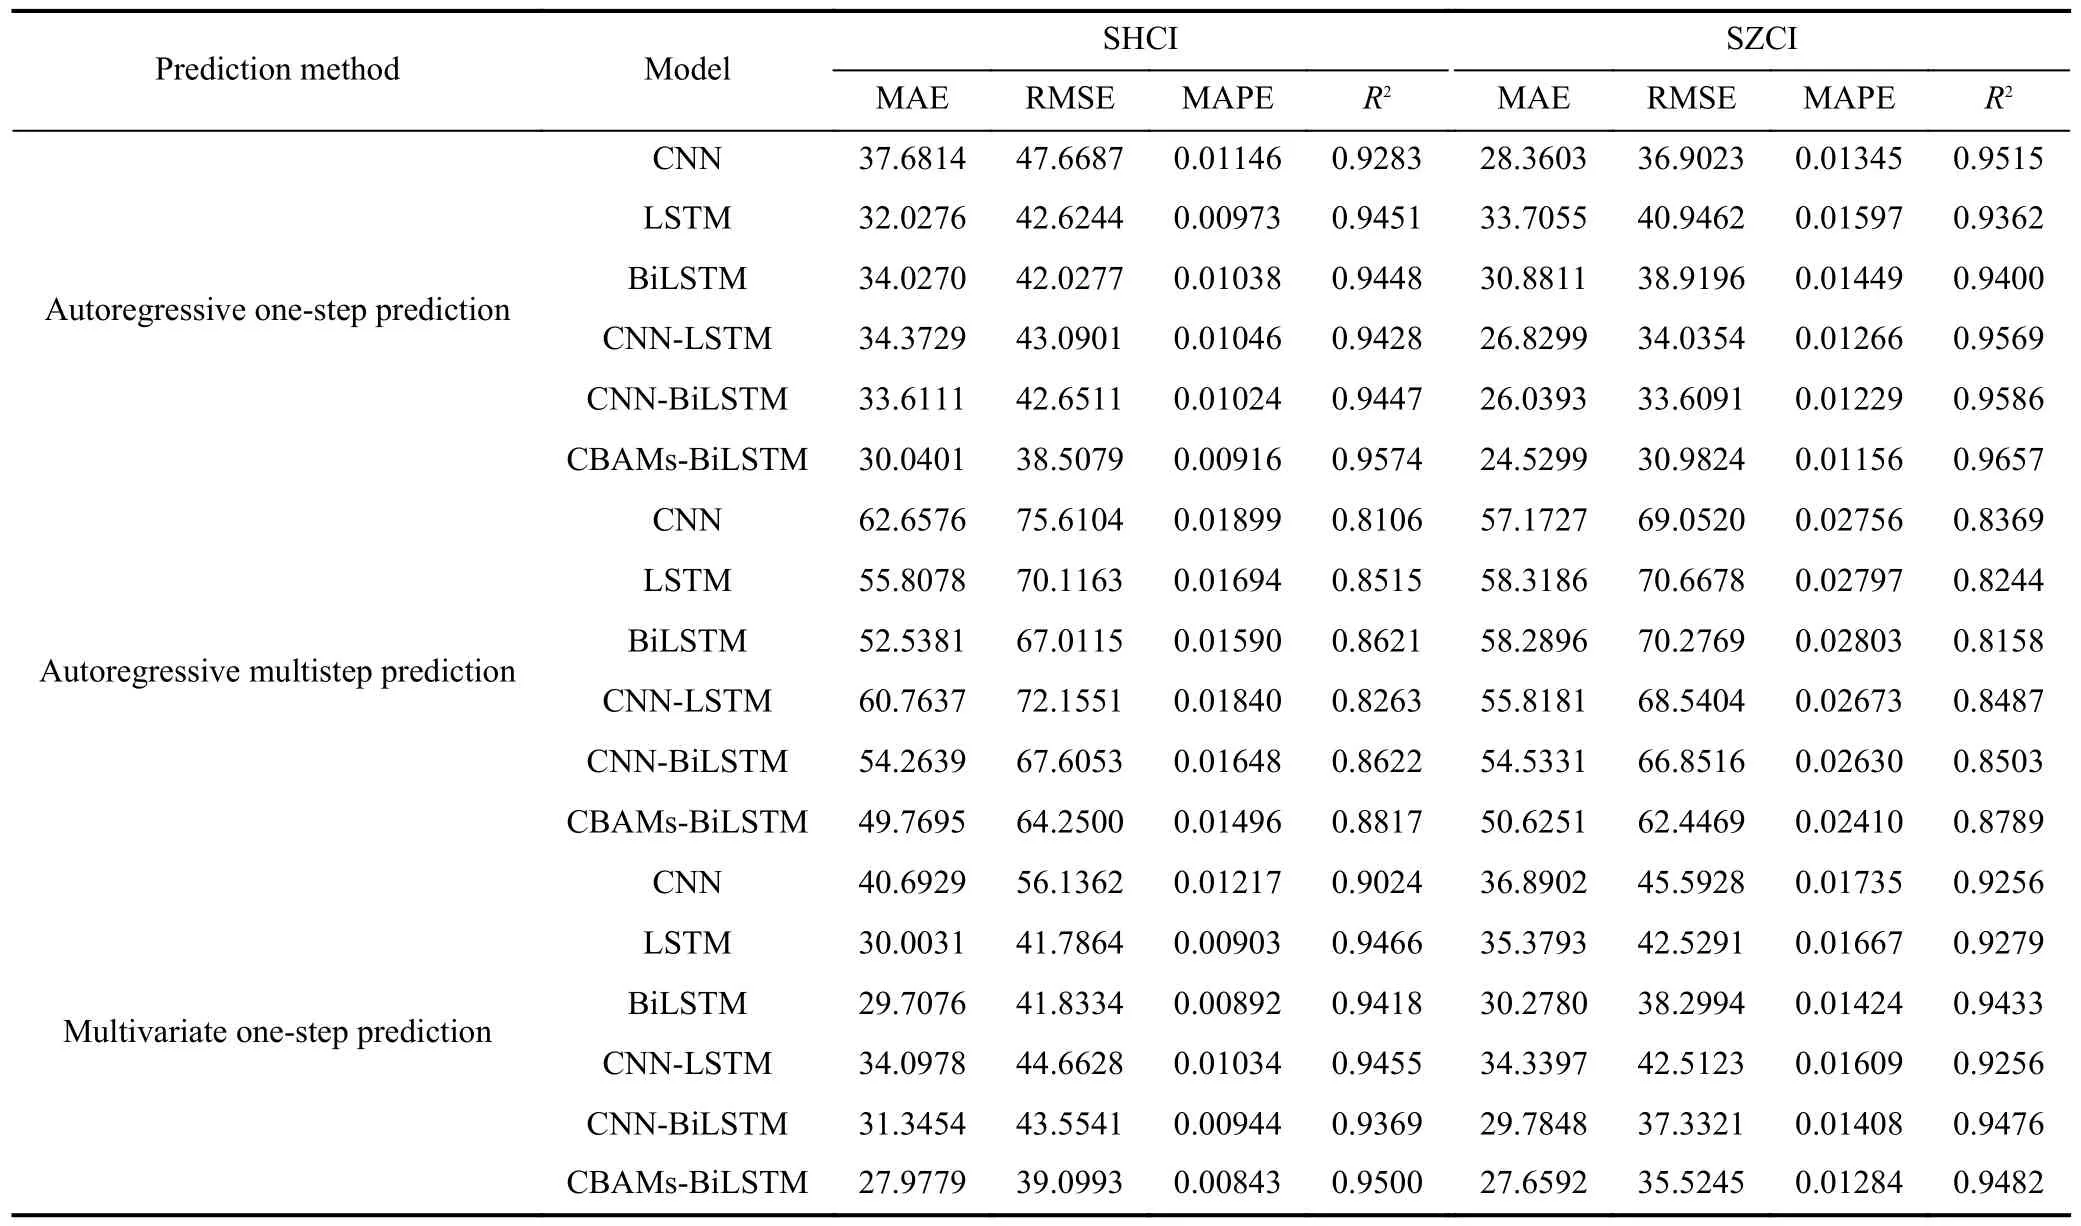
Table 8.SME for different prediction methods on test sets.
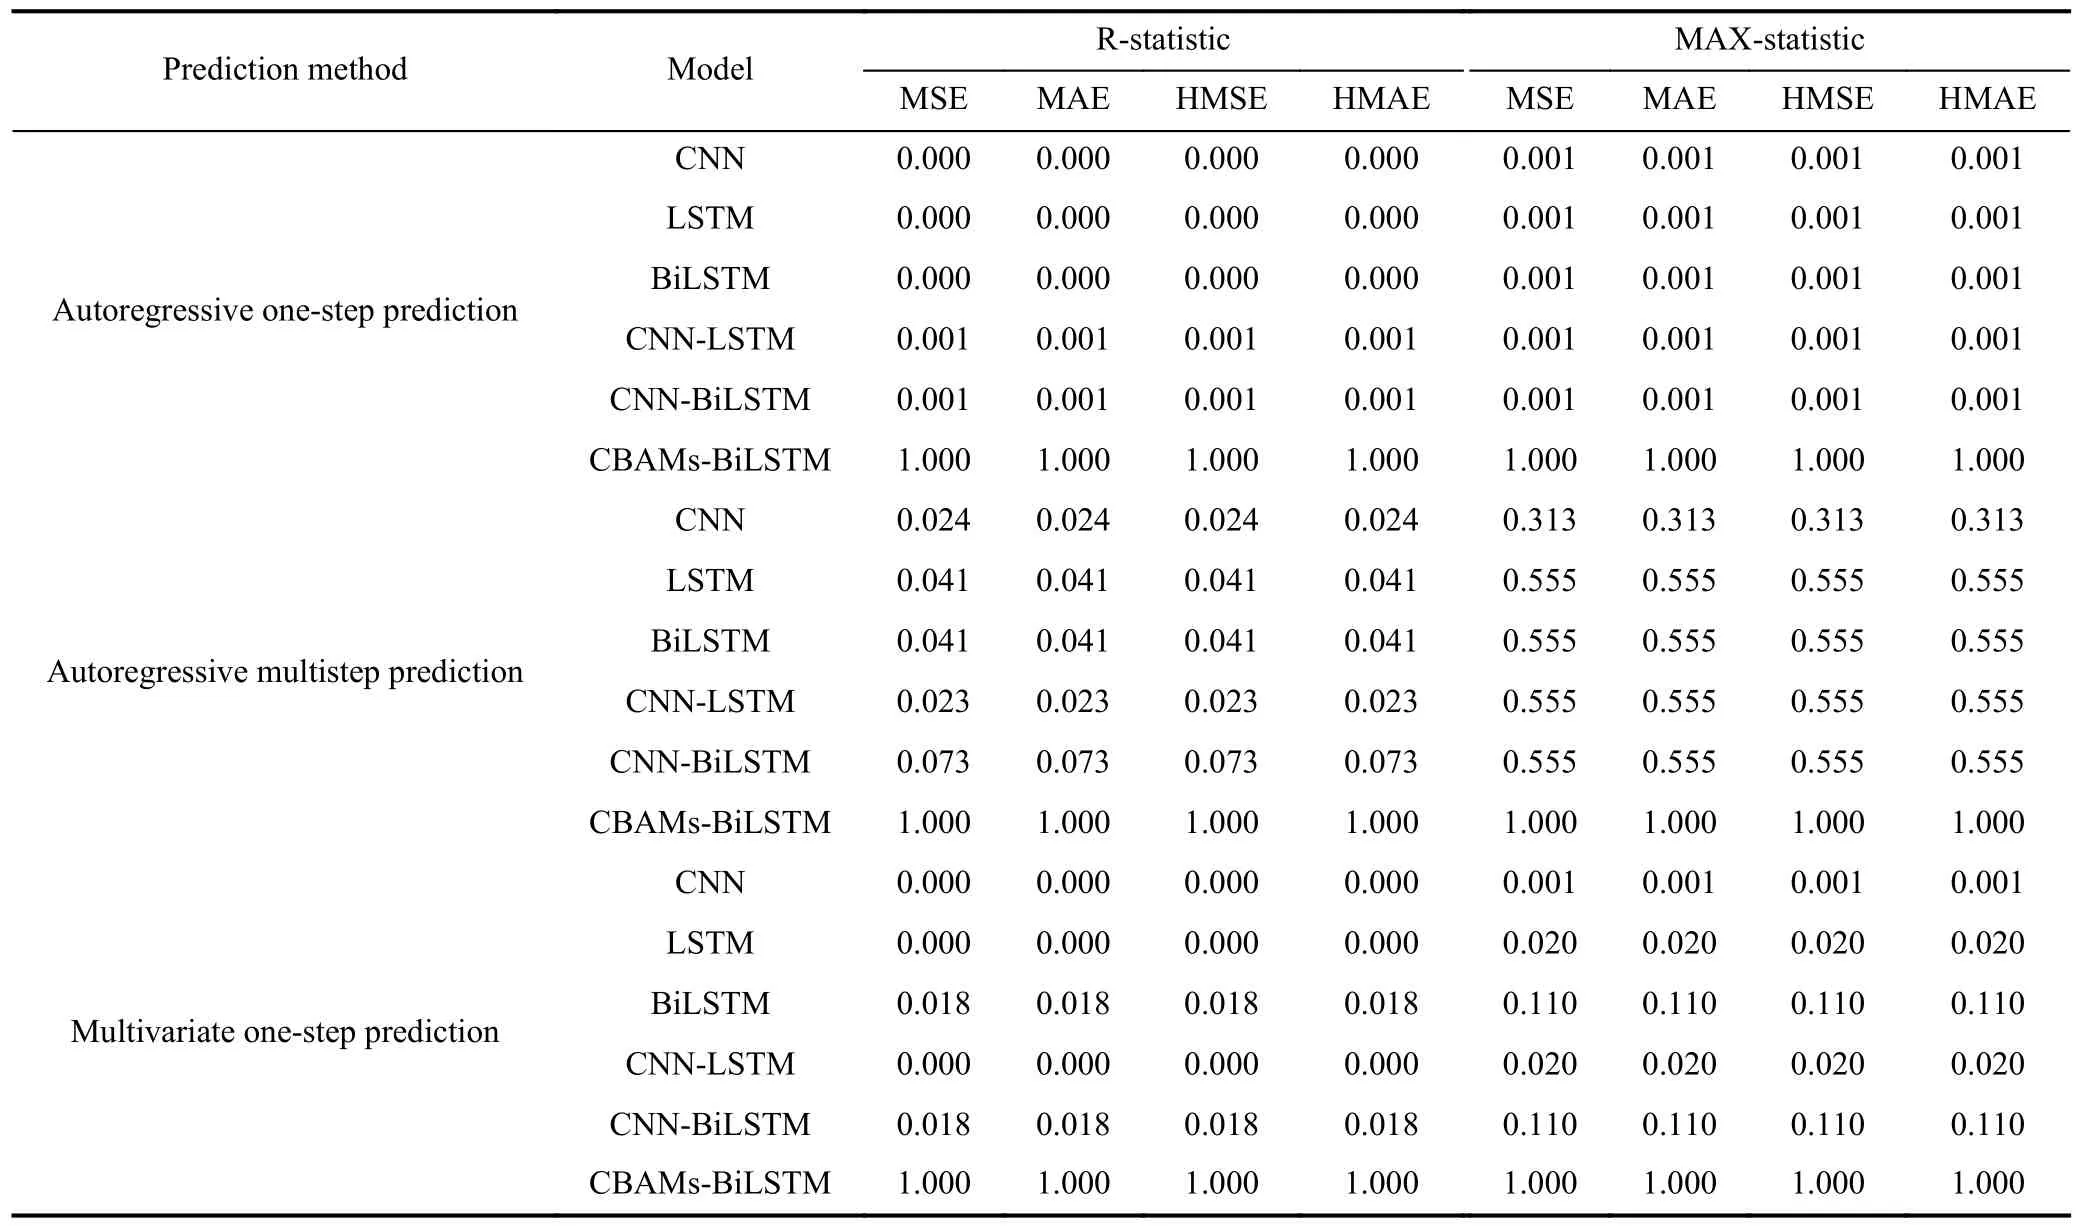
Table 9.MCS p values for different prediction methods on test sets.
In this trading strategy, each individual prediction made by the models influences the trading performance and ultimately impacts the overall profit.To assess the performance of the trading system, we utilize the Sharpe ratio.Table 10 presents the Sharpe ratios of different predictive models on the test sets.In the table,Rprepresents the return sequences of the models,E(Rp) indicates the mean of the models’ return sequences,σprepresents the standard deviation of the models’return sequences, and “Sharpe” denotes the Sharpe ratio of the models.The numerical values in Table 10 demonstrate that employing the predictions of the proposed model as the foundation for the trading strategy leads to satisfactory results.This further confirms that, in terms of investment returns, the proposed model exhibits superiority and robustness when compared to other popular models.
3.6 Findings
In summary, the experiments conducted a detailed analysis on the impact of the position and number of CBAMs on BiLSTM.The results confirmed that CBAM has the ability to enhance the prediction accuracy of BiLSTM, and this improvement exhibits good robustness.Furthermore, the proposed model’s superiority and robustness in terms of prediction accuracy were confirmed through comparisons with other popular models, as well as by varying the prediction method and data sets.Additionally, the experiments demonstrated the model’s robustness in relation to the size of the training set.Finally, the experiments affirmed the model’s superiority and robustness in terms of investment returns.
Overall, the experimental findings provide strong evidence supporting the effectiveness and reliability of the proposed model.The results indicate that integrating CBAM into the BiLSTM architecture enhances prediction accuracy and robustness across various scenarios and data sets.These findings contribute to advancing the understanding and applicability of the proposed model in real-world scenarios involving market prediction and trading systems.
4 Conclusions
4.1 Summary
To address the issue of low accuracy in stock index prediction, this paper introduces a novel model called CBAMBiLSTM, which combines multiple CBAMs with a BiLSTM architecture.The experimental evaluation is conducted using the SSE Composite Index and the SZSE Composite Index as the data sets.The performance of various models is assessed using standard metric evaluation and model confidence set test methods.The final results demonstrate that CBAMBiLSTM exhibits superior performance and robustness in terms of both prediction accuracy and investment returns.Moreover, the experiments include a comprehensive analysis of the impact of CBAM position and amount on the prediction accuracy of the BiLSTM model.
Overall, this research introduces a novel model that effectively addresses the challenge of accurate stock index prediction.Through rigorous evaluation and analysis, the proposed CBAM-BiLSTM model shows its superiority and robustness compared to other models.The findings provide valuable insights into improving prediction accuracy and investment returns in the field of stock market analysis.
4.2 Discussion and outlook
The proposed CBAM-BiLSTM model demonstrates its competence in predicting stock price indexes compared to other hybrid predictive models based on machine learning methods from the literature.In this study, our model achieves a minimum MAPE of 0.0084 (0.84%) and a maximumR2value of 0.9657.In previous studies, Md et al.[37]achieved anR2of0.981 for Samsung stock.Maqbool et al.[38]obtained a MAPE of 1.55% for the HDFC bank stock price data set.Gülmez[39]achievedR2values ranging from 0.814 to 0.975 for various stock data sets.Cui et al.[40]obtained an MAPE of 0.62% for the SSE Composite Index.
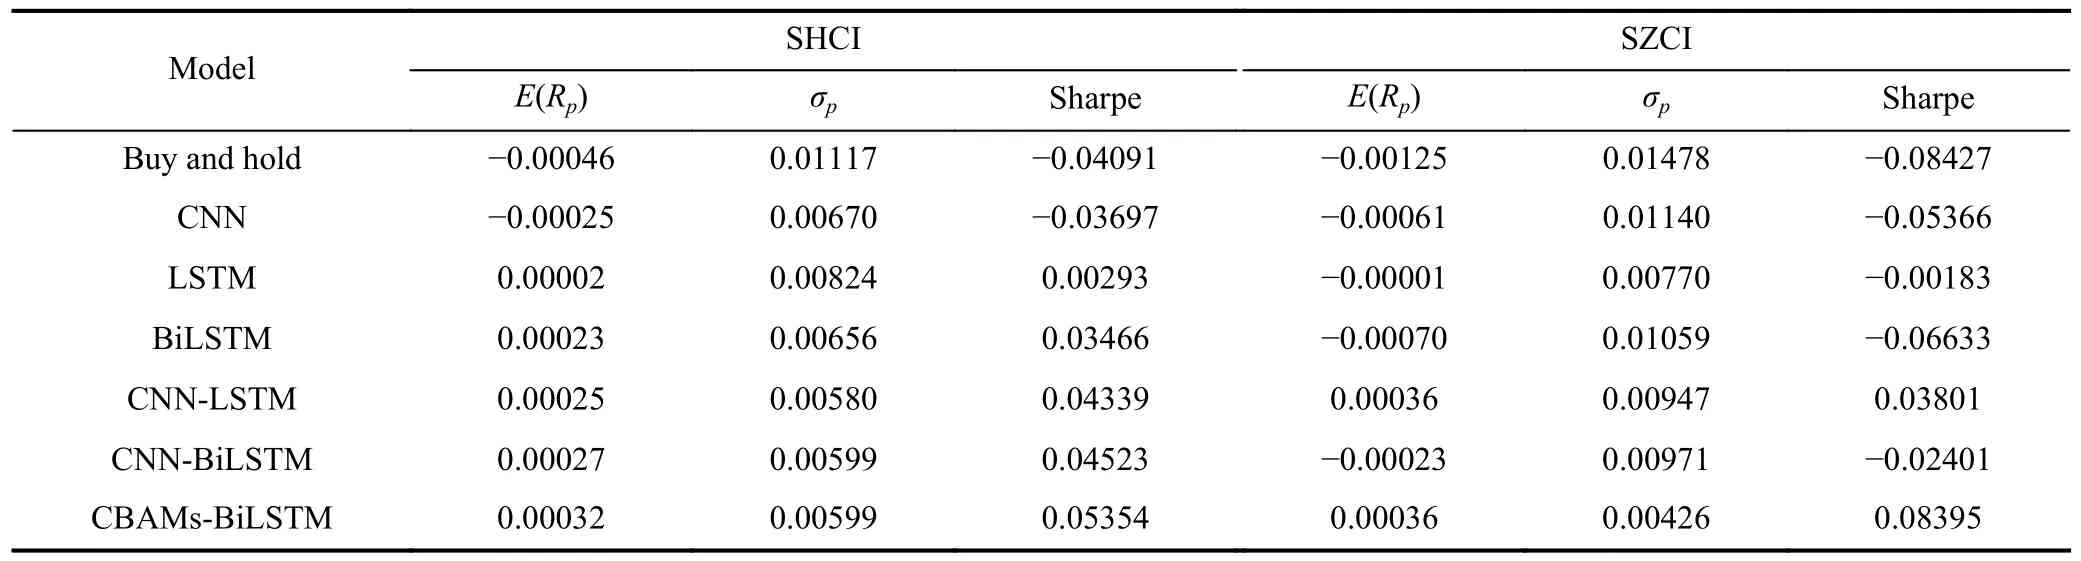
Table 10.Sharpe ratio of models on test sets.
It is acknowledged that the robustness of model forecasting can vary between tranquil and turbulent periods due to the idiosyncratic patterns of the data; however, this issue can be further addressed by considering hyperparameters.For instance, the number of BiLSTM modules and the number of neurons were not extensively explored in this study.Therefore, future research will aim to develop appropriate methods for selecting hyperparameters to further enhance the predictive performance of the proposed model.
Regarding applications, future work will involve incorporating more contributing feature variables to improve the predictive performance of the model.However, it is important to note that the variables used to predict composite stock indexes and individual stock prices differ significantly.Composite stock indexes may require macrolevel variables such as GDP growth rate, inflation rate, interest rate, government fiscal policy, and international trade situation.On the other hand, individual stock prices tend to focus on internal factors of the company and the market’s supply and demand relationship.Therefore, future research plans involve utilizing natural language processing techniques to extract variables that impact stock indexes, thus boosting the prediction performance.Furthermore, since Ref.[32] suggests that solely constructing predictive models in terms of improving the precision may not yield good investment returns, future plans meanwhile cover investment returns as the primary aim to enhance the practical utility of the proposed model.
Acknowledgements
The authors thanks to Dr.Peiwan Wang for organizing the ideas in the discussion section of the article.
Conflict of interest
The authors declare that they have no conflict of interest.
Biographies
Chenhao Cui received his master’s degree from the University of Science and Technology of China in 2023.His research mainly focuses on the application of deep learning in time series prediction.
Yong Li is an Associate Professor at the University of Science and Technology of China (USTC).He received his Ph.D.degree from USTC in 2012.His research mainly focuses on FinTech and data mining.
 中國科學(xué)技術(shù)大學(xué)學(xué)報2024年2期
- 中國科學(xué)技術(shù)大學(xué)學(xué)報的其它文章
- The impact of macroprudential cross-border capital flow management on the linkage of domestic and foreign bond markets
- Typhoons’ effect, stock returns, and firms’ response: Insights from China
- Attention: The impact of media attention on market reaction to corporate violations