
A predictive model for regional zenith tropospheric delay correction
2024-03-04 03:47:24YuLeiDanningZhao
天文研究與技術(shù) 2024年1期
Yu Lei, Danning Zhao
1School of Computer Science & Technology, Xi’an University of Posts & Telecommunications, Xi’an 710121, China
2School of Electrical & Electronic Engineering, Baoji University of Arts and Sciences, Baoji 721016, China
Abstract: The conventional zenith tropospheric delay (ZTD) model (known as the Saastamoinen model) does not consider seasonal variations affecting the delay, giving it low accuracy and stability.This may be improved with adjustments to account for annual and semi-annual variations.This method uses ZTD data provided by the Global Geodetic Observing System to analyze seasonal variations in the bias of the Saastamoinen model in Asia, and then constructs a model with seasonal variation corrections, denoted as SSA.To overcome the dependence of the model on in-situ meteorological parameters, the SSA+GPT3 model is formed by combining the SSA and GPT3 (global pressuretemperature) models.The results show that the introduction of annual and semi-annual variations can substantially improve the Saastamoinen model, yielding small and time-stable variations in bias and root mean square (RMS).In summer and autumn, the bias and RMS are noticeably smaller than those from the Saastamoinen model.In addition,the SSA model performs better in low-latitude and low-altitude areas, and bias and RMS decease with the increase of latitude or altitude.The prediction accuracy of the SSA model is also evaluated for external consistency.The results show that the accuracy of the SSA model (bias: -0.38 cm, RMS: 4.43 cm) is better than that of the Saastamoinen model (bias: 1.45 cm, RMS: 5.16 cm).The proposed method has strong applicability and can therefore be used for predictive ZTD correction across Asia.
Keywords: Zenith tropospheric delay; Saastamoinen model; Seasonal variations; Asian area; Accuracy analysis
1.INTRODUCTION
Tropospheric delay is the main error source for Global Navigation Satellite System (GNSS) positioning,navigation and timing.The effect of the troposphere on the GNSS signals appears as an extra delay in the measurement of the signal traveling from the satellite to receiver.The error caused by the troposphere is about 2 m in the zenith direction and 20 m for lower elevations[1], and this must be corrected in GNSS applications.Unlike ionospheric delay[2], tropospheric delay is not dependent on signal frequency, and consequently cannot be eliminated by combining signals of different frequencies.Therefore, an empirical model of zenith tropospheric delay (ZTD) is usually used to correct it.Accordingly, it is of great practical significance to construct a high-precision ZTD empirical model.At present, the commonly used ZTD empirical models can be divided into the following two categories:
(1) Meteorological parameter models.These models use meteorological parameters such as surface pressure, temperature and water vapor pressure to calculate ZTD.Among these models, the accuracy of the Hopfield model decreases with increasing altitude, while the Saastamoinen model is affected little by altitude, so the latter is more widely applicable.The ZTD correction accuracy of these models can approach centimeter precision with measured meteorological parameters, but the correction accuracy can decrease 2 to 3 times if the standard meteorological parameter model is used, which can limit the applicability of these models in high-precision GNSS positioning,navigation and timing.To remove dependence on measured parameters, Liu et al., Yang et al., Yao et al., and Du et al.use the meteorological parameters provided by the global barometric temperature GPT/GPT2/GPT2w model as the input of the Saastamoinen model[3-6], which effectively improves the applicability of these two models in high-precision GNSS applications.
(2) Non-meteorological parameter models, such as the European Geostationary Navigation Overlay Service(EGNOS)[7,8], which are the ZTD correction model adopted by the European and American wide-area augmentation systems.They only need station location information, without surface meteorological parameters, to calculate ZTD, and the global average ZTD calculation accuracy is comparable to that of Saastamoinen and Hopfield models based on measured parameters.However, the EGNOS and University of New Brunswick (UNB) models divide the earth into 15° latitude intervals, so the spatial resolution is poor and the effect of longitude is ignored, resulting in an inability to capture local variation in ZTD.Furthermore, the ZTD correction calculated by these models is ineffective in areas outside Europe and North America.To meet the demand for ZTD correlation in high-precision GNSS applications, new non-meteorological parametric ZTD models have been successively established.Some of these use atmospheric reanalysis data provided by the European Centre for Medium-Range Weather Forecasts (ECMWF) and National Centers for Environmental Prediction to establish global non-meteorological empirical ZTD models such as SHAO-H and IGGTrop[9,10].Some use the Global Geodetic Observing System (GGOS) Atmosphere data and International GNSS Service (IGS) ZTD data for modeling ZTD directly, such as the GZTD and GGZTD models[11,12].Additionally,regional ZTD models have been developed for China and surrounding areas[13-15].
The above-mentioned ZTD models are fully empirical, established by global atmospheric reanalysis or ZTD data, and their global average accuracy is high.However,the accuracy and applicability of ZTD correction in local areas may still not be sufficient.To improve the accuracy and applicability of the ZTD model in Asia, this paper establishes a seasonal ZTD model, denoted as SSA(Saastamoinen model with seasonal corrections), which takes into account the annual and semi-annual variations based on the widely used Saastamoinen model, using the ZTD grid product with a spatial resolution of 1° × 1° and a temporal resolution of 6 h released by the GGOS Atmosphere.This SSA model is combined with a new version of the global pressure-temperature model, GPT3[16], to form a predictive model for ZTD correlation called SSA+GPT3, which does not require measured meteorological parameters.Using high-precision ZTD data from 66 GNSS tracking stations in the Asian region, provided by GGOS Atmosphere and IGS as references, the ZTD correction accuracy of the SSA model is evaluated for the Asian region, and the spatial and temporal distribution characteristics of the ZTD correction errors are analyzed.
2.DATA AND METHODS
2.1.Data Source
GGOS Atmosphere provides ZTD grid data with a spatial resolution of 1° × 1° and a temporal resolution of 6 h based on the ECMWF atmospheric reanalysis data from 1980 to the present, available from Vienna Mapping Functions Open Access Data[16].The GGOS Atmosphere products not only have a very high spatial resolution, but are also of high quality and therefore can be used as a standard dataset for ZTD research and applications[17].
2.2.Seasonal Effects on the Saastamoinen Model
The high-precision ZTD provided by the GGOS Atmosphere from 2015 to 2017 for 66 IGS GNSS tracking stations distributed in the Asian region is used as a reference value to calculate the daily averaged bias of the Saastamoinen model.Spectral analysis of the bias from 2015 to 2017 is conducted separately, and the daily averaged bias of these IGS stations in each latitude range shows significant annual and semi-annual seasonal variations.These variations and their spectral analysis results for 2015-2017 at the eastern YSSK, southern CUUT, western URUM and northern PETS stations in the Asian region are given in Fig.1.Variations at other stations are similar.As can be seen from Fig.1, the daily bias of the Saastamoinen model has annual and semi-annual seasonal effects, and these can be approximated using the cosine function,
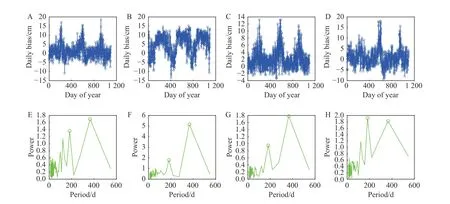
Fig.1.Time-series of the daily averaged bias and frequency spectrum analysis between 2015 and 2017 at four stations.(A) YSSK(47.03°N, 142.717°E, 91.719 m).(B) CUUT (13.736°N, 100.534°E, 74.699 m).(C) URUM (43.808°N, 87.601°E, 859.352 m).(D)PETS (53.023°N, 158.65°E, 102.604 m).(E) YSSK (47.03°N, 142.717°E, 91.719 m).(F) CUUT(13.736°N, 100.534°E, 74.699 m).(G) URUM (43.808°N, 87.601°E, 859.352 m).(H) PETS (53.023°N, 158.65°E, 102.604 m).
in which the bias and day of year (doy) are known quantities;Biasmeanis the annual mean value of bias;A1andA2are the amplitudes of the annual and semi-annual variations, respectively; andd1andd2are the phases of the annual and semi-annual variations, respectively.These amplitudes and phases can be determined with the nonlinear least squares method.The spatial and temporal distribution characteristics of the amplitudes and phases are not discussed or analyzed here, owing to space limitations.
2.3.The SSA Model
Considering the seasonal effects on the Saastamoinen model, this paper proposes a new seasonal ZTD model by adding the annual and semi-annual terms into the Saastamoinen model, referred to as SSA,
in whichP,T,e, φ andhare the surface pressure in hPa, temperature in Kelvin, water vapor pressure in hPa,station latitude in radians and height in km, respectively.
To overcome the dependence of the SSA model on measured meteorological parameters and improve the applicability of the model, the GPT3 model is introduced to provide relatively accurate pressure, temperature and water vapor pressure values.To accomplish this, we construct a refined SSA+GPT3 model using the following process.
Step 1.Calculating the pressure, temperature and water vapor pressure parameters of the four horizontal grid points nearest to the station, using the GPT3 model,based on the station latitude, longitude, altitude and time information, while finding theZTD0of the four points adjacent to the station in the GGOS Atmosphere grid file.
Step 2.Using equation 3 to make altitude corrections to the meteorological parameters of the grid points,we calculate theZTD(h) of each of the four grid points relative to the station altitude according toZTD(h)=ZTD0·eβh, in which β is the height imputation factor,β=-1.3137×10⁻⁴.We then use bilinear interpolation to calculate the meteorological parameters and ZTD at the station, expressed as[18]
in whichP0,T0ande0represent the pressure, temperature and water vapor pressure at the grid point surrounding the sites, respectively.Qis the specific humidity in kg/kg, λ is the water vapor descent factor, dTis the temperature lapse rate in degrees/m, dhis the difference of t he site height and grid height,gmis the mean acceleration due to gravity,gm=9.80665 m/s2,Rgis the gas constant,Rg=8.3143 J/(K·mol),Mtrrepresents the molar mass of dry air,Mtr=0.028965 kg/mol.
Step 3.Calculating the ZTD by substituting the meteorological parameters at the stations obtained in step 2 into the Saastamoinen model and treating them as true values to obtain the bias of the Saastamoinen model.
Step 4.Periodic fitting of the ZTD bias is performed to determine the amplitude and phase of the annual and semi-annual variations.According to the above model construction process, the combined SSA+GPT3 model can perform a ZTD calculation at any position.
3.VALIDATION OF THE MODEL
3.1.Research Area
66 IGS GNSS tracking stations in the Asian region are selected to analyze and evaluate the effectiveness of the model.The range of the research area is 10°N-63°N and 66°E-159°E.The geographical distribution of the 66 IGS stations in the Asian region is shown in Fig.2.The ZTD products from 2015 to 2017 provided by GGOS Atmosphere are used as reference values to analyze the spatial and temporal distribution characteristics of the SSA model errors.Final ZTD data in 2018 from the IGS are used to evaluate the accuracy of the ZTD prediction values of the SSA model, and the bias and RMS error are taken as error measurements.
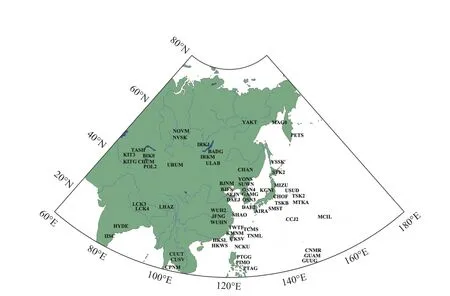
Fig.2.Distribution of the 66 IGS tracking stations across Asia.
3.2.Temporal Distribution of Bias and RMS
3.2.1.Variations of daily averaged bias and RMS
To analyze the day-by-day variation of bias and RMS of SSA and Saastamoinen models, the daily averaged bias and RMS of each IGS station are calculated by day of year.The daily averaged bias and RMS variations in 2015-2017 calculated from SSA+GPT3 and Saastamoinen+GPT3 (abbreviated to SA+GPT3) for the eastern YSSK, southern CUUT, western URUM and northern PETS stations in the Asian region are shown in Fig.3.Variations at other stations are similar and therefore are not given.

Fig.3.Variations of the daily averaged bias and RMS between 2015 and 2017 at four stations.(A) YSSK (47.03°N,142.717°E,91.719 m).(B) CUUT (13.736°N,100.534°E, 74.699 m).(C) URUM (43.808°N,87.601°E, 859.352 m).(D) PETS (53.023°N,158.65°E,102.604 m).(E) YSSK (47.03°N, 142.717°E, 91.719 m).(F) CUUT (13.736°N,100.534°E, 74.699 m).(G) URUM (43.808°N,87.601°E,859.352 m).(H) PETS (53.023°N,158.65°E, 102.604 m).
The daily averaged bias and RMS of the Saastamoinen model for the four IGS stations show clear seasonal variations, i.e., small in winter and large in summer.The reason for these variations is the decrease in wet delay due to dry air in winter, which causes a decrease in the error in ZTD estimates, whereas the wet delay increases because of humid air in summer, and hence the error also increases.The bias and RMS at the western URM station are relatively small compared with those at other stations in Asia, whereas the bias and RMS at the eastern YSSK station are larger in summer, owing to the effect of the marine climate causing drastic variations of water vapor.In contrast to other stations, the bias and RMS change rapidly at the southern CUUT station, which is located at a low latitude and influenced by the tropical climate and marine climate.These results illustrate that Saastamoinen model can be improved if these seasonal variations are taken into account in ZTD estimation.The bias and RMS of the SSA are not only smaller than those of the Saastamoinen model, but also more stable, demonstrating that the introduction of annual and semi-annual terms into ZTD estimates can yield noticeable improvements.
3.2.2.Variations of monthly averaged bias and RMS
To analyze the month-to-month variations of the bias and RMS of the two models, the monthly averaged bias and RMS of 66 IGS stations in the Asian region from 2015 to 2017 are calculated, as shown in Fig.4.The bias of the Saastamoinen model is generally positive, indicating that this model usually underestimates the ZTD in the Asian region and has a systematic bias.By comparison the monthly averaged bias and RMS from the SSA model are relatively small and stable, with no clear periodic variation in bias, while periodic variation in RMS is substantially reduced.The bias and RMS of the SSA do not show significant fluctuations even in summer and autumn when water vapor levels change dramatically, indicating that the SSA model, with seasonal terms, has a higher accuracy than the conventional Saastamoinen model, especially in summer and autumn.
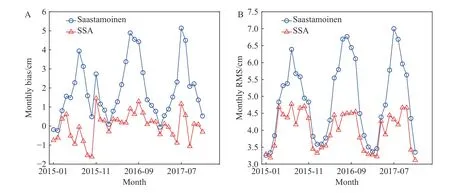
Fig.4.Monthly averaged bias and RMS from the SSA and Saastamoinen models.(A) Monthly averaged bias during 2015-2017.(B) Monthly averaged RMS during 2015-2017.
3.3.Spatial Distributions of Bias and RMS
The 3-year averaged bias and RMS statistics from 2015 to 2017 are calculated and shown for 66 IGS stations in the Asian region in Fig.5.Here, the bias and RMS of the Saastamoinen model are relatively small in the high-latitude region of western and northern Asia, but are larger in the southern low-latitude region characterized by oceanic and tropical climates.The bias and RMS are also relatively large in the eastern coastal region,which is influenced by an oceanic climate with drastic water vapor changes.Furthermore, the bias of the Saastamoinen model is positive at most stations in the Asian region, again indicating that this model often underestimates the actual value of ZTD.The bias and RMS of the SSA model are smaller than those of the Saastamoinen model.Specifically, the bias is close to zero, indicating that the SSA model, with seasonal terms, has little systematic bias.The mean values of the bias and RMS of all 66 IGS stations are 1.91 cm and 5.18 cm, respectively,between 2015 and 2017 for the Saastamoinen model,while the mean value of the RMS is 4.2 cm for the SSA,with an overall reduction of 19% relative to the Saastamoinen.
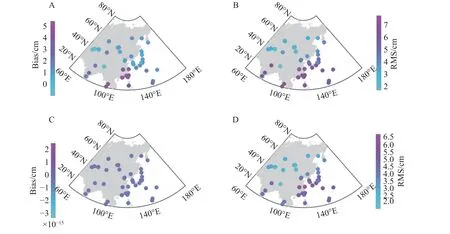
Fig.5.Distribution of the bias and RMS between 2015 and 2017 from the SSA and Saastamoinen models.(A) Bias distribution of Saastamoinen.(B) RMS distribution of Saastamoinen.(C) Bias distribution of SSA.(D) RMS distribution of SSA.
3.3.1.Variations of bias and RMS with height
To analyze the characteristics of height distribution of the bias and RMS of the two models, the altitude of 66 stations was divided into brackets of <500 m, >500-1 000 m,1 500-2 000 m and >2 000 m.The bias and RMS at each height range from 2015 to 2017 are shown in Fig.6,in which the bias from the SSA is small enough to be insignificant, and has been omitted.The RMS of both models shows a noticeable decreasing trend with increasing station height.The RMS of the SSA is smaller than that of the Saastamoinen model in each height range.Also noteworthy is the fact that the bias of the Saastamoinen model is positive from 0 to 2 000 m and becomes larger with increasing height.However, the bias shows a sudden increase when the altitude exceeds 2 000 m.One possible explanation is that there are few IGS stations in this height range.Furthermore, the accuracy of both models is better at high altitudes.This is because the integration interval of tropospheric refractivity is shortened at high altitudes, with drier air causing reduced wet delay at high-altitude stations, such as URUM and LHAZ in China.In all latitude ranges, the accuracy of the SSA is improved to different degrees compared with the Saastamoinen model.Overall,the improvement is most significant in low-altitude regions.Compared with the Saastamoinen model, the RMS of the SSA model is reduced by 20.31%, 11.25%,4.01%, and 11.05% in the height ranges of <500 m,>500-1 000 m, 1 500-2 000 m, and >2 000 m, respectively.
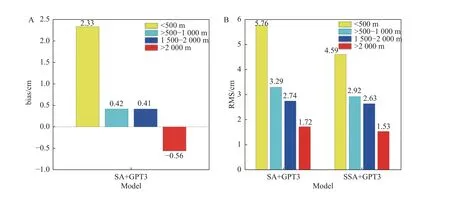
Fig.6.Variations of the bias and RMS between 2015 and 2017 from the SSA and Saastamoinen models with height.(A) Bias during 2015-2017.(B) RMS during 2015-2017.
3.3.2.Variations of bias and RMS with latitude
To analyze the latitude distribution characteristics of the bias and RMS of both models, the latitudes of 66 stations were divided into 16°N-30°N, 30°N-45°N, and 45°N-63°N regions.The averaged bias and RMS of 66 stations in each latitude range from 2015 to 2017 are shown in Fig.7, in which the bias of the SSA is very low and has been omitted.The RMS shows a decreasing trend with increasing latitude, and the accuracy of the SSA is superior to that of the Saastamoinen model in all latitude ranges.The bias of the Saastamoinen model also shows a decreasing trend with increasing station latitude.Additionally, the accuracy of the SSA is substantially better at the high-latitude area above 30°N compared with that of the Saastamoinen.This is because the ZTD estimation error is larger in the lower latitudes of Asia because of the oceanic and tropical climates, where water vapor changes are more complex.The accuracy of the SSA model improves to different degrees in all latitude ranges compared with that of the Saastamoinen model, and this enhancement is more obvious in regions below 30°N.In contrast with the Saastamoinen model, the RMS of the SSA model decreases by 30%, 9.55% and 10.3% in the latitude ranges from 16°N-30°N, 30°N-45°N and 45°N-63°N, respectively.
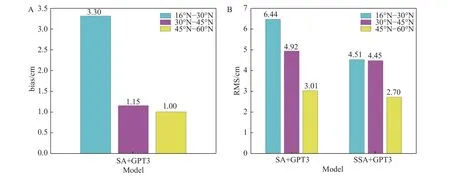
Fig.7.Variations of the bias and RMS between 2015 and 2017 from the SSA and Saastamoinen models with latitude.(A) Bias during 2015-2017.(B) RMS during 2015-2017.
3.4.Prediction Assessment of the SSA
To further assess the accuracy of the SSA model, the model is tested with the ZTD grid products released by GGOS Atmosphere between 2015 and 2017.This SSA model is then employed to predict the ZTD of 66 IGS stations in the Asian region in 2018.The final ZTD data from the IGS are then taken as the real values for model assessment.Fig.8 shows the spatial distribution of the yearly averaged bias and RMS of the ZTD predictions,and the bias and RMS statistical measures are given in Table 1.
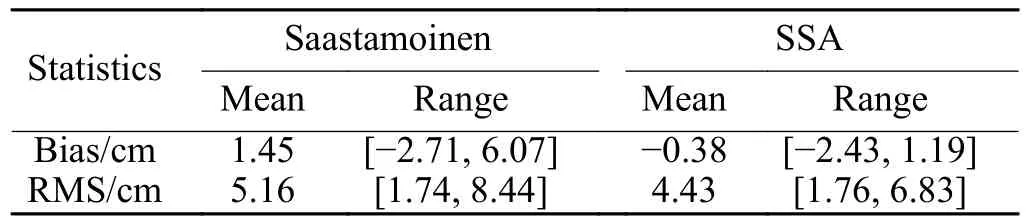
Table 1.Statistics of the yearly bias and RMS of the ZTD predictions over Asia
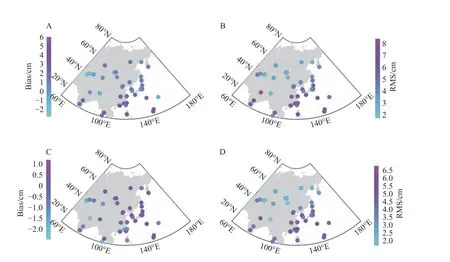
Fig.8.Distribution of the yearly bias and RMS of the ZTD predictions from the SSA and Saastamoinen models.(A) Bias distribution of Saastamoinen.(B) RMS distribution of Saastamoinen.(C) Bias distribution of SSA.(D) RMS distribution of SSA.
The yearly averaged bias and RMS from the Saastamoinen model are smaller in the western region and highlatitude region of Asia, and larger in the eastern and lowlatitude regions, with a maximum bias of 6.07 cm.Compared with the Saastamoinen model, the yearly averaged bias of the SSA is smaller in the whole Asian region with a maximum value of 2.43 cm.The RMS is approximately 5 cm in northwestern Asia and larger in other regions for the Saastamoinen model, whereas the value for the SSA is under 5 cm in regions with latitudes above 40°N and larger in lower latitudes.Additionally, the enhancement of the SSA is most obvious in lower-latitude regions.The RMS of both models becomes smaller with increasing latitude.The SSA model reduces the bias and RMS by 73.79% and 14.15%, respectively, compared with the Saastamoinen model.
To further analyze seasonal variations of the bias and RMS, the monthly averaged bias and RMS of 66 IGS stations in 2018 is shown in Fig.9.The monthly averaged bias and RMS of the Saastamoinen model show obvious seasonal variations, large in summer and small in winter,whereas the RMS of the SSA model changes slowly in each month and does not show large fluctuations even in the summer and autumn.The bias of the SSA, shown in Fig.9A, is significantly smaller than that of the Saastamoinen model except in January, March, and October.This is because the bias of the SSA model has more negative values in these months than the Saastamoinen model,leading to a large calculated monthly averaged bias.However, although the monthly averaged RMS of both models is comparable in spring and winter, the monthly averaged RMS of the SSA in autumn and summer is significantly lower than that of the Saastamoinen model, and the RMS is reduced by 36.36% at maximum.Fig.8, Fig.9 and Table 1 not only show that the ZTD prediction accuracy of the SSA in the Asian region is better than that of the Saastamoinen model, but also verify that the spatial and temporal variation characteristics of the prediction errors are generalized.
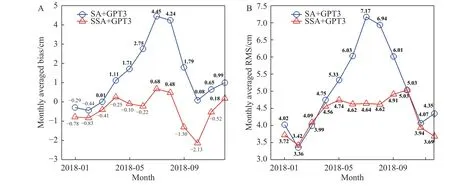
Fig.9.Seasonal variations in the bias and RMS of the ZTD predictions from the SA+GPT3 and SSA+GPT3 models over Asia.(A) Monthly averaged bias in 2018.(B) Monthly averaged RMS in 2018.
4.CONCLUSIONS
The widely used Saastamoinen model requires in-situ meteorological parameters, and it is also affected by seasonal changes in environmental conditions.In this study,the bias of the Saastamoinen model shows clear seasonal variations, and the spectrum analysis indicates that these variations are mainly dominated by annual and semiannual variations.To improve the Saastamoinen model we propose an enhanced model, dubbed the SSA model,to compensate for seasonal annual and semi-annual variations, using meteorological parameters from the empirical GPT3 model.The results demonstrate that the SSA, with annual and semi-annual terms, has a high ZTD prediction accuracy in the Asian region with a yearly averaged RMS of approximately 4.5 cm.Both the bias and RMS of the SSA model are smaller and more stable than those of the Saastamoinen model, even in summer and autumn.The enhancement in summer can reach 36.36% in contrast to the Saastamoinen model.The extent of this improvement is also related to the geographic location; the improvement is very noticeable in the low-latitude and low-altitude areas of Asia.Moreover, the accuracy enhances with an increase in latitude or altitude.Because the SSA model is constructed based on 1° × 1° high-resolution GGOS Atmosphere data products, and the required meteorological parameters can be provided by GPT3, we conclude that the combined SSA+GPT3 model is a potentially very effective method for tropospheric delay corrections in high-precision GNSS applications over Asia, and can be used to predict tropospheric delays in real-time high-precision GNSS positioning, navigation and timing.
ACKNOWLEDGEMENTS
This work was supported by the Basic Science Research Program of Shaanxi Province (2023-JC-YB-057 and 2022JM-031).
AUTHOR CONTRIBUTIONS
Yu Lei conceived the ideas, designed and implemented the study, and wrote the paper.Danning Zhao collected the meteorological tropospheric delay data, performed the statistical analysis, and revised the paper.All authors read and approved the final manuscript.
DECLARATION OF INTERESTS
The authors declare no competing interests.

- 天文研究與技術(shù)的其它文章
- Exploring the Mysteries of the Universe, and Innovation Leading the Future
——Astronomical Techniques and Instruments - Development and application of high-precision multifunction astronomical plate digitizers in China
- Application and prospect of the fluid cooling system of solar arrays for probing the Sun
- Design and analysis of an advanced thermal management system for the solar close observations and proximity experiments spacecraft
- Characteristics and close-range exploration methods of near-Earth asteroid 2016HO3
- End-to-end computational design for an EUV solar corona multispectral imager with stray light suppression