
Land use and cover change and influencing factor analysis in the Shiyang River Basin, China
2024-02-26 09:11:12ZHAOYaxuanCAOBoSHALinweiCHENGJinquanZHAOXuanruGUANWeijinPANBaotian
Journal of Arid Land 2024年2期
ZHAO Yaxuan, CAO Bo,2*, SHA Linwei, CHENG Jinquan, ZHAO Xuanru,GUAN Weijin, PAN Baotian,2
1 Key Laboratory of Western China's Environmental Systems (Ministry of Education), College of Earth and Environmental Sciences, Lanzhou University, Lanzhou 730030, China;
2 Shiyang River Basin Scientific Observing Station, Lanzhou University, Lanzhou 730030, China
Abstract: Land use and cover change (LUCC) is the most direct manifestation of the interaction between anthropological activities and the natural environment on Earth's surface, with significant impacts on the environment and social economy.Rapid economic development and climate change have resulted in significant changes in land use and cover.The Shiyang River Basin, located in the eastern part of the Hexi Corridor in China, has undergone significant climate change and LUCC over the past few decades.In this study, we used the random forest classification to obtain the land use and cover datasets of the Shiyang River Basin in 1991, 1995, 2000, 2005, 2010, 2015, and 2020 based on Landsat images.We validated the land use and cover data in 2015 from the random forest classification results (this study), the high-resolution dataset of annual global land cover from 2000 to 2015 (AGLC-2000-2015), the global 30 m land cover classification with a fine classification system (GLC_FCS30), and the first Landsat-derived annual China Land Cover Dataset (CLCD) against ground-truth classification results to evaluate the accuracy of the classification results in this study.Furthermore, we explored and compared the spatiotemporal patterns of LUCC in the upper, middle, and lower reaches of the Shiyang River Basin over the past 30 years, and employed the random forest importance ranking method to analyze the influencing factors of LUCC based on natural (evapotranspiration, precipitation, temperature, and surface soil moisture) and anthropogenic (nighttime light, gross domestic product (GDP), and population) factors.The results indicated that the random forest classification results for land use and cover in the Shiyang River Basin in 2015 outperformed the AGLC-2000-2015, GLC_FCS30, and CLCD datasets in both overall and partial validations.Moreover, the classification results in this study exhibited a high level of agreement with the ground truth features.From 1991 to 2020, the area of bare land exhibited a decreasing trend, with changes primarily occurring in the middle and lower reaches of the basin.The area of grassland initially decreased and then increased, with changes occurring mainly in the upper and middle reaches of the basin.In contrast, the area of cropland initially increased and then decreased, with changes occurring in the middle and lower reaches.The LUCC was influenced by both natural and anthropogenic factors.Climatic factors and population contributed significantly to LUCC, and the importance values of evapotranspiration, precipitation, temperature, and population were 22.12%, 32.41%, 21.89%, and 19.65%, respectively.Moreover, policy interventions also played an important role.Land use and cover in the Shiyang River Basin exhibited fluctuating changes over the past 30 years, with the ecological environment improving in the last 10 years.This suggests that governance efforts in the study area have had some effects, and the government can continue to move in this direction in the future.The findings can provide crucial insights for related research and regional sustainable development in the Shiyang River Basin and other similar arid and semi-arid areas.
Keywords: land use and cover classification; land use and cover change (LUCC); climate change; random forest;accuracy assessment; three-dimensional sampling method; Shiyang River Basin
1 Introduction
The Sixth Assessment Report of Intergovernmental Panel on Climate Change (IPCC) noted that anthropological activities have caused unprecedented climate warming, and the global surface average temperature has risen by 1.1°C compared to pre-industrial levels (IPCC, 2021).Climate change has resulted in irreversible impacts, such as glacier melting, frequent occurrence of extreme weather, crop yield reduction, shortening of the growing season, wetland degradation,and desertification (Hatfield and Prueger, 2015; Wu et al., 2021b; Zhang et al., 2021a; Alhamid et al., 2022; Kang et al., 2022; Wang et al., 2023; Xian et al., 2023).These impacts have gradually reshaped land use and cover patterns (Wondie et al., 2016), leading to significant effects on the Earth's surface, particularly in terms of biodiversity, surface and underground runoff, carbon cycle and storage, agricultural land use, urban resource availability, soil salinization, and ecological problems related to transportation and pollution (Liu et al., 2021; Ibarrola-Rivas et al., 2022;Wang et al., 2022; Yang et al., 2022; Yu et al., 2022a; Yu et al., 2022b; Ebabu et al., 2023; Gule et al., 2023; Guo et al., 2023a; Guo et al., 2023b).
Current methods for land use and cover classification include visual interpretation, single-band threshold, spectral relationship, object-oriented (Li et al., 2017; Lu et al., 2021; Wei et al., 2023),and machine learning (Hamed Fahmy et al., 2023) methods.Research has indicated that the random forest classification (one method of machine learning) outperforms other classification methods in accuracy and operation (Pal and Mather, 2003; Rodriguez-Galiano et al., 2012).Xu et al.(2021) utilized multi-data fusion, temporal change detection, and random forest to create a high-resolution dataset of annual global land cover from 2000 to 2015 (AGLC-2000-2015).Zhang et al.(2021b) combined high-quality training data from Global Spatial Temporal Spectra Library (GSPECLib) on the Google Earth Engine and employed the random forest to create a global 30 m land cover classification with a fine classification system (GLC_FCS30) from 1985 to 2020 with a temporal resolution of 5 years.Based on the China land use/cover dataset, satellite time-series images, and visual interpretation samples from Google Earth, Yang and Huang (2021)used the random forest on Google Earth Engine to produce the first Landsat-derived annual China Land Cover Dataset (CLCD), which contains 30 m of annual land cover and its dynamics in China from 1990 to 2019.To address ecological problems caused by land use and cover change(LUCC) effectively, further analysis on the influencing factors of LUCC is essential (Wu et al.,2021a).Current research on influencing factors of LUCC is inadequate and primarily relies on qualitative analyses, such as logistic regression, multiple linear regression, and principal component analysis (Serra et al., 2008; Zhao et al., 2013; Wang et al., 2020).However, these methods are relatively simple, rely on linear models, and are less effective in capturing complex driving mechanisms (Wu et al., 2021a).In contrast, as an ensemble machine learning approach,the random forest can effectively handle highly correlated data and multidimensional features,combating overfitting.It can also manage numerous quantitative and qualitative explanatory variables, systematically ranking the importance of input variables to overcome certain shortcomings of traditional methods.Random forest demonstrates strong performance in both classification and regression (Belgiu and Dr?gu?, 2016; Meng et al., 2021; Wu et al., 2021c; Xie et al., 2021).Therefore, the random forest has been widely used in land use and cover analysis(Rodriguez-Galiano et al., 2012; Wu et al., 2021a; Wu et al., 2021c).
The Shiyang River Basin in China is situated in a unique geographical location at the junction of the eastern monsoon, arid northwest, and the Qinghai-Tibet Plateau regions (Zhu et al., 2019).The upper Qilian Mountains serve as important ecological barriers in western China, whereas the lower plains act as river corridors separating the Badain Jaran Desert and Tengger Desert (Tong et al., 2007; Bai et al., 2023).Researchers have analyzed multiple aspects of the Shiyang River Basin and concluded that the basin was in an unhealthy state over the last several decades (Liu,2021; Mi, 2021).Currently, studies of land use and cover classification in the Shiyang River Basin utilize unsupervised and supervised classification methods combined with the visual interpretation, while the analysis of the influencing factors of LUCC employs qualitative,principal component, and logistic regression analyses (Han et al., 2015; Wei et al., 2017; Hu et al.,2018; Chen et al., 2020; Wang et al., 2021).Although numerous studies have been conducted in this region, there are still certain limitations and shortcomings.The time series data for LUCC are not sufficiently long, and different classification methods may yield inconsistent results, thereby,making the accuracy assessment challenging.Furthermore, the analysis of the influencing factors often relies on qualitative analysis or simplistic linear models, which may not adequately capture the complex driving mechanisms underlying the LUCC.
Therefore, the objective of this study was to explore the spatiotemporal patterns and influencing factors of LUCC, along with a comparison of the differences in the upper, middle, and lower reaches of the Shiyang River Basin over the past 30 years.Compared to previous studies,the improvements of our research mainly include: a longer period of time, the adoption of a threedimensional (3D) sampling method to enhance classification accuracy, and the explicit subdivision of the study area into three sub-regions for a more detailed analysis.Analyzing LUCC in the Shiyang River Basin is crucial for regional sustainable development and serves as a theoretical foundation for studies in similar arid and semi-arid areas.
2 Materials and methods
2.1 Study area
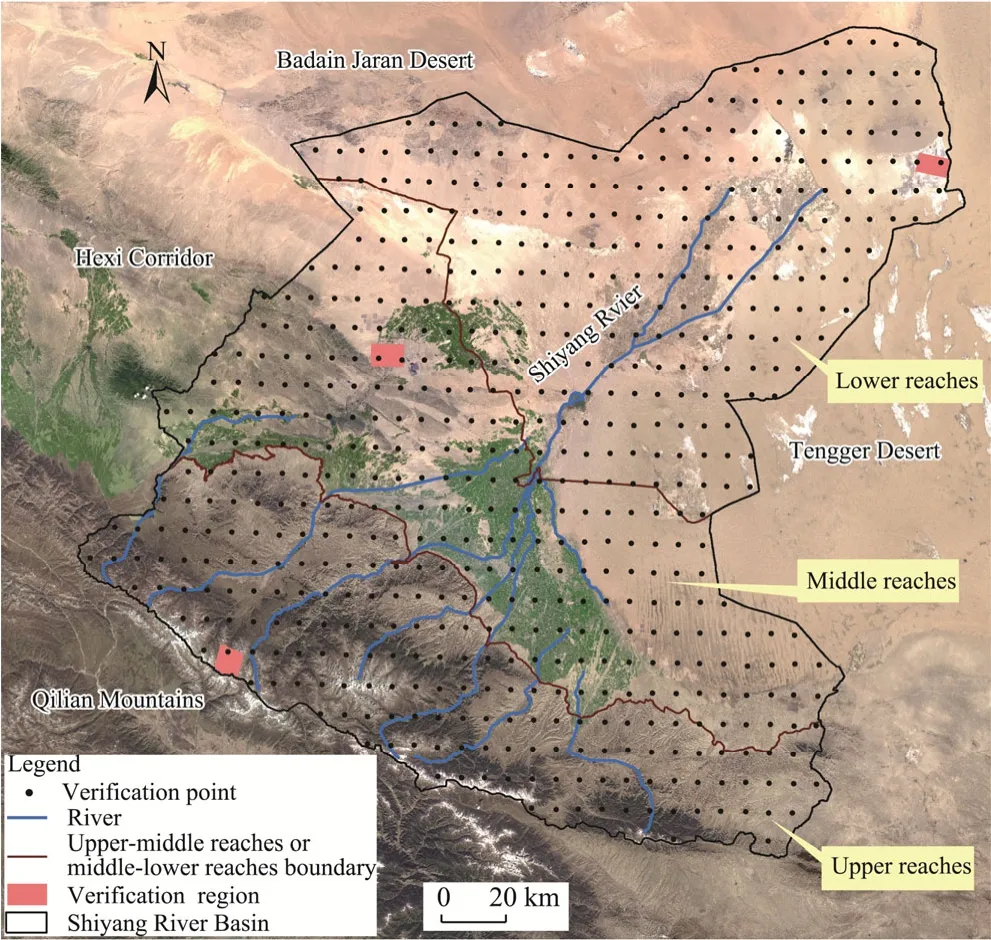
Fig.1 Overview of the upper, middle, and lower reaches of the Shiyang River Basin and the spatial distribution of verification points and regions.The base map is derived from Gaofen-1 (GF-1) satellite images in 2020.
The Shiyang River Basin (101°07′-104°15′E, 37°07′-39°28′N) is located in the eastern portion of the arid area of Northwest China, in the eastern part of the Hexi Corridor, and at the northern foot of the Qilian Mountains (Wang et al., 2019) (Fig.1).It covers an area of 4.1×10⁴km2and consists of eight rivers.The annual average temperature is 6.5°C, the annual precipitation is 50-600 mm,and the potential evaporation is 700-2600 mm (Ma et al., 2008; Gao et al., 2016).The total population was approximately 2.16×10⁶persons (Center for International Earth Science Information Network, Columbia University, 2018), and the total gross domestic product (GDP)was 3.03×10¹⁰USD (Chen et al., 2022).The elevation in the region varies from 1245 to 5214 m,with higher terrain in the south and lower terrain in the north.The upper and middle reaches of the basin are divided based on the 2000 m contour and the integrity of land use and cover, and the dividing line of the middle and lower reaches is the Minqin County borderline.The three sub-regions (upper, middle, and lower reaches) of the basin cover areas of 1.2×10⁴, 1.3×10⁴, and 1.6×10⁴km2, respectively.
2.2 Data sources and preprocessing
More than 40 Landsat images with a spatial resolution of 30 m between 1991 and 2020 were downloaded from the USGS (https://earthexplorer.usgs.gov/).The selected years were 1991,1995, 2000, 2005, 2010, 2015, and 2020, primarily focusing on the months of June-September.Adjacent years were selected as references when the images were of poor quality (Table 1).The images were preprocessed using radiometric calibration and atmospheric correction.The land use and cover classification results were generally validated using three domestically published datasets: AGLC-2000-2015, GLC_FCS30, and CLCD (Xu et al., 2021; Yang and Huang, 2021;Zhang et al., 2021b).To facilitate comparison, these datasets were reclassified to align with the classification system used in this study.The Gaofen-1 (GF-1) images (2015) obtained from the China Center for Resources Satellite Data and Application (https://data.cresda.cn) were used for partial validations.
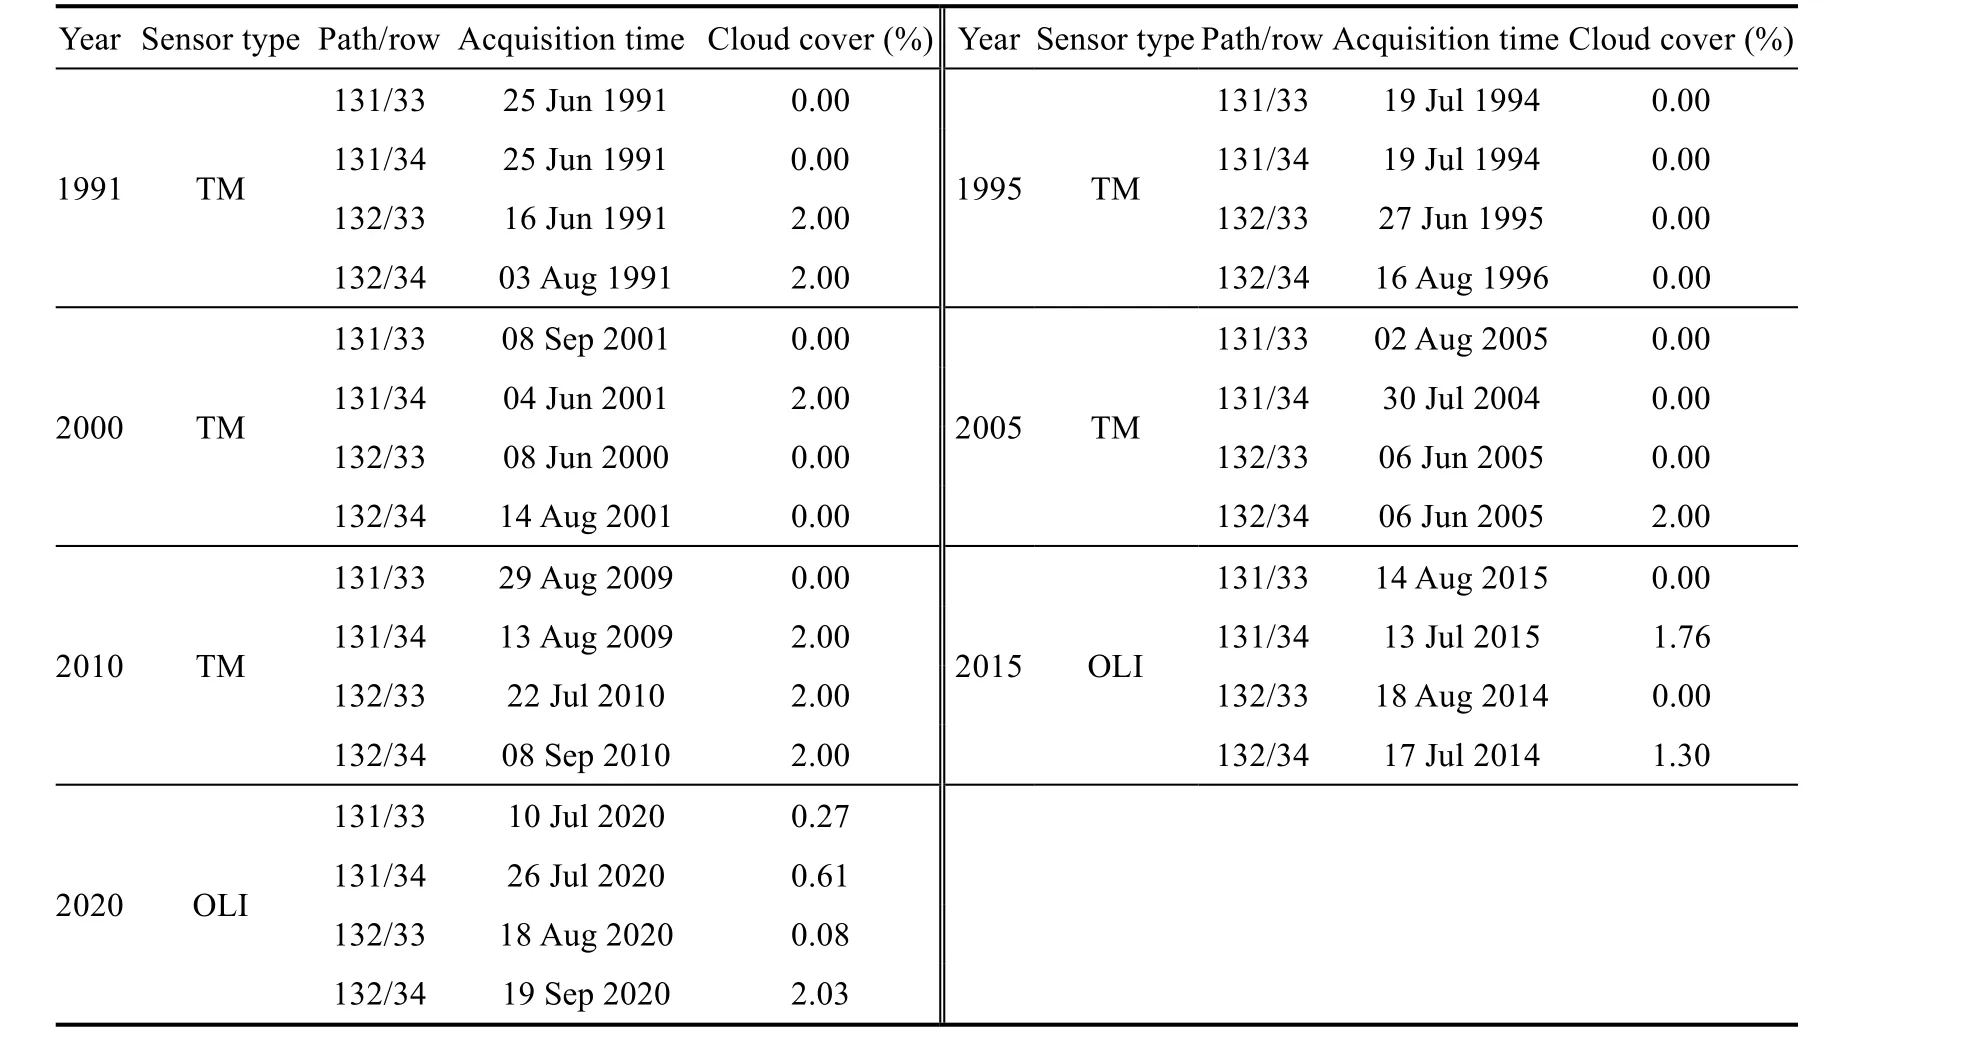
Table 1 Landsat images used in the study
The Normalized Difference Vegetation Index (NDVI) product dataset (1998-2019) was obtained from the Resource and Environment Science and Data Center (https://www.resdc.cn),with an annual temporal resolution and a spatial resolution of 1 km.Evapotranspiration (mm),precipitation (mm), temperature (°C), surface soil moisture (m3/m3), nighttime light, GDP (×106USD), and population (persons/km2) were employed to analyze the influencing factors of LUCC(Table 2).During the analysis, we used annual values for these factors.The original data on evapotranspiration, temperature, and precipitation are all at the monthly scale.We calculated the annual averages for temperature, and annual total for evapotranspiration and precipitation in 1991, 1995, 2000, 2005, 2010, 2015, and 2020.The original data on surface soil moisture are at the daily scale.We conducted format conversion and calculated annual averages by taking daily averages.The original nighttime light, GDP, and population data are all at the annual scale.For GDP, owing to the absence of 2020 data, the 2019 data were utilized in the analysis for GDP in 2020 (Table 2).After obtaining the data for all corresponding years, we adopted a uniform coordinate system and performed cropping preprocessing to ensure data consistency.
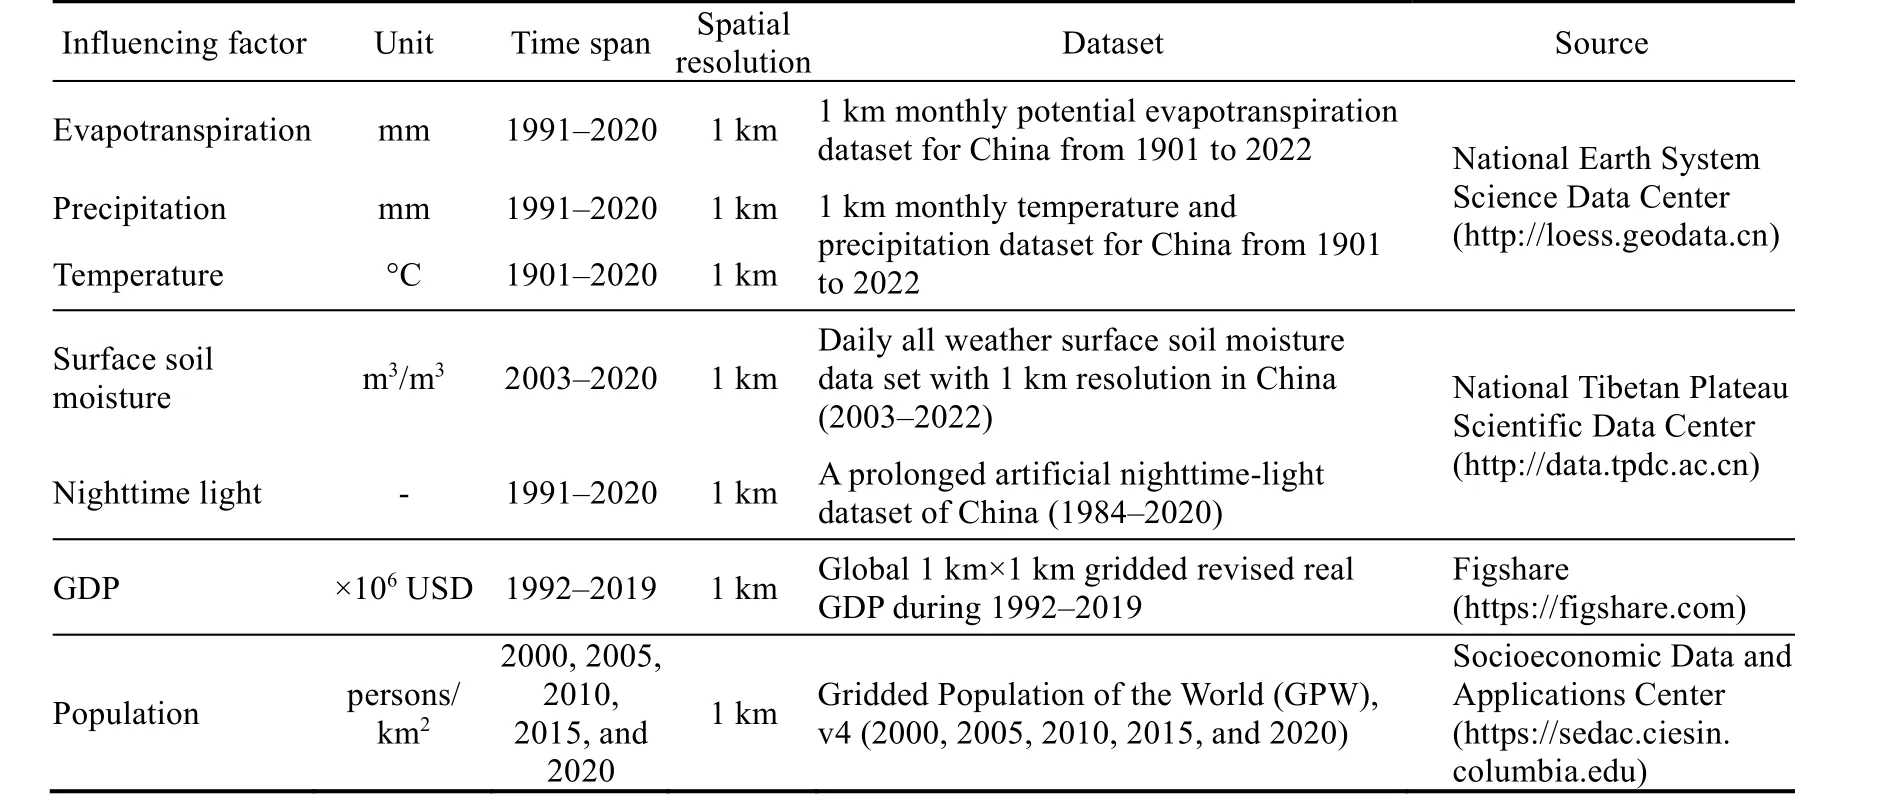
Table 2 Detailed description of influencing factors used in the study
2.3 Methods
2.3.1 Land use and cover classification and accuracy assessment Land use and cover classification was carried out using the random forest classification in ENVI 5.3.Subsequently, the classification results were visually interpreted with the aid of Google Earth.The classification system was based on systems from the Chinese Academy of Sciences, United States Geological Survey, and the FROM-GLC database (Anderson et al., 1976; Liu, 1996; Gong et al., 2013).Considering the unique nature of the Shiyang River Basin, the final classification system consisted of eight land use and cover types: bare land, grassland, cropland, forest,wetland, impervious surface, water body, and glacier (Table 3).A 3D sampling method was used to select the region of interest (ROI) samples according to Yang et al.(2017) (Fig.2).First,different band combinations, vegetation fractional coverage, and Google Earth view were applied to the original images to generate a 3D terrain scene, then 3D samples were created and projected onto the original images, and further adjustments were made to obtain the final samples.The results indicated that the separability of the ROI samples exceeded 1.88.The computation of vegetation fractional coverage was performed in ArcGIS.The process initially utilized Landsat images to calculate the NDVI.Subsequently, a pixel-wise binary model was employed to determine the pixel values corresponding to pure vegetation and pure ground soil.Subsequently,the vegetation fractional coverage was computed using formulas as follows (Zhang et al., 2023b):
where NDVI is the Normalized Difference Vegetation Index; NIR is the reflectance of the near-infrared band; RED is the reflectivity of the red-light band; VFC represents the vegetation fractional coverage; NDVIsoilis the NDVI value of pure bare ground pixel; and NDVIvegis the NDVI value of pure vegetation pixel.The upper and lower thresholds of NDVI were determined by intercepting with a 5% confidence level to obtain NDVIsoiland NDVIveg.
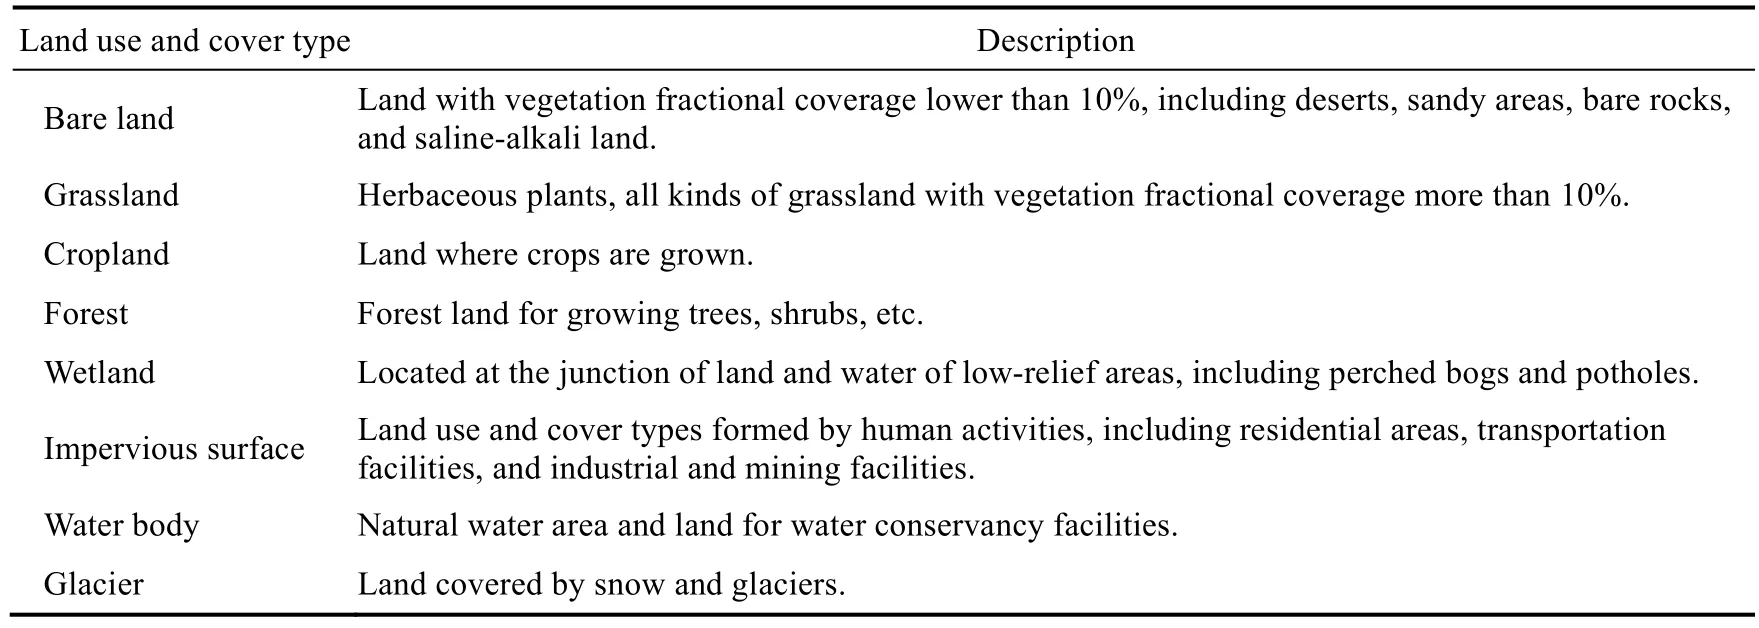
Table 3 Land use and cover classification system used in this study
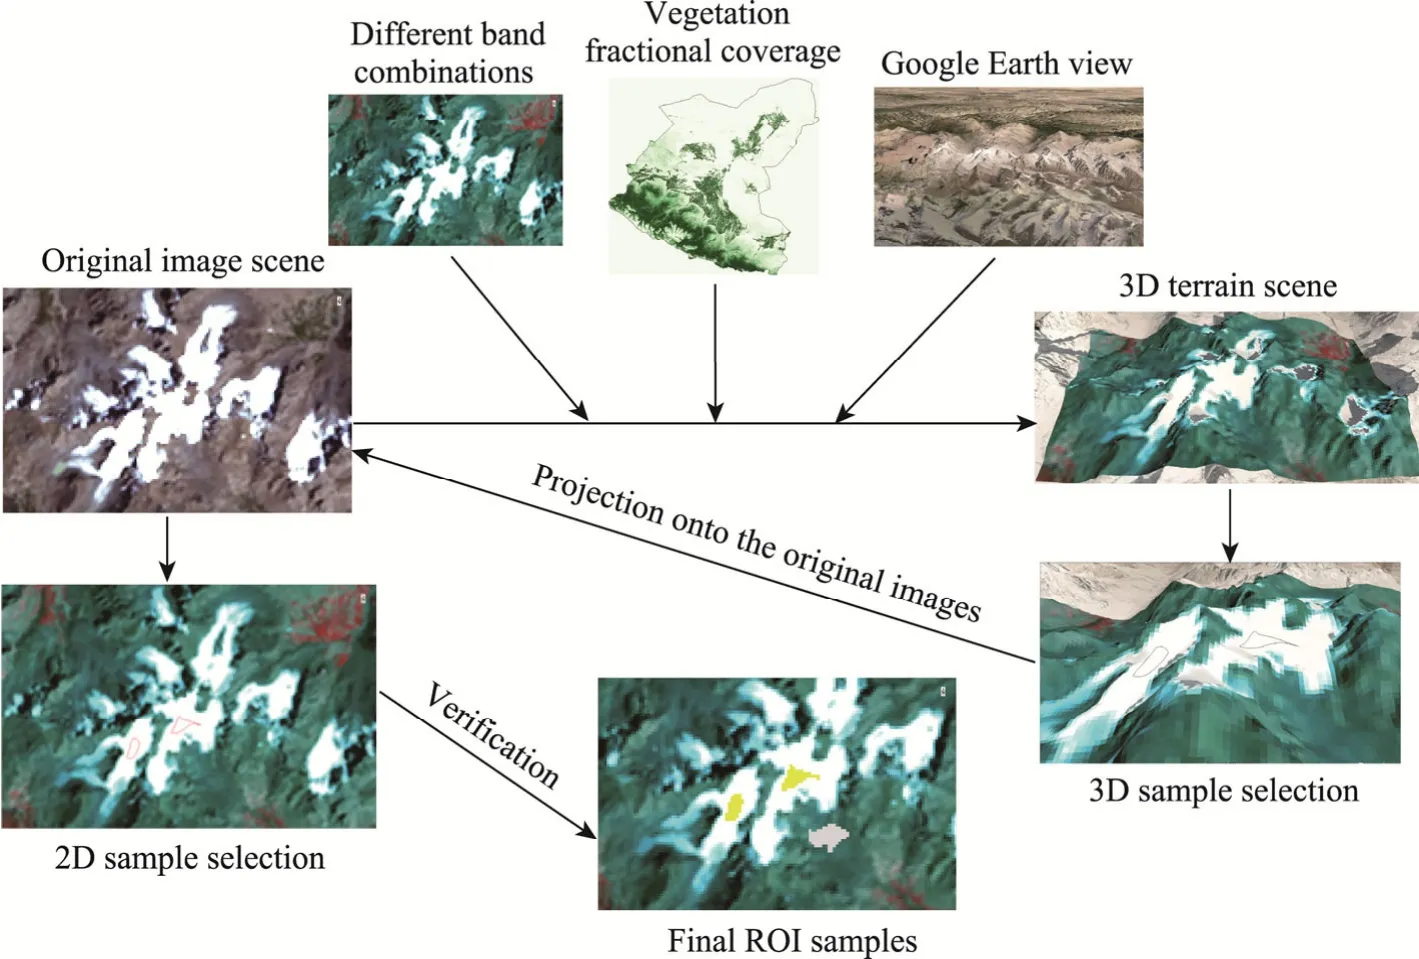
Fig.2 Flowchart for selecting region of interest (ROI) samples using a 3D sampling method by combining different band combinations, vegetation fractional coverage, and Google Earth view.3D, three-dimensional; 2D,two-dimensional.
The accuracy validation of land use and cover data in 2015 from the random forest classification results in this study (named as Landsat_RFC) and other three land use and cover product datasets (AGLC-2000-2015, GLC_FCS30, and CLCD) were evaluated through overall and partial validations.For overall validation, we uniformly selected 601 verification points within the Shiyang River Basin (Fig.1).Visual interpretation and Google Earth were employed to obtain the ground-truth classification results.Afterwards, the classification accuracy rates (Eq.3)of these four datasets were calculated by comparing the classification results with the ground truth at each point.For partial validation, three verification regions each covering 100.0 km2were selected in the upper, middle, and lower reaches of the basin.The ground-truth classification results were obtained by applying the random forest classification to GF-1 images and corrected using Google Earth images (Kappa coefficient was greater than 0.93).Subsequently, the overall accuracy (Eq.4) and Kappa coefficient (Eq.5) of the four datasets were calculated by comparing with the ground-truth classification results using ENVI.
where Ar is the classification accuracy rate (%); andNcis the number of verification points correctly classified.
whereOA represents the overall accuracy (%);nis the number of classes;Niirepresents the number of correctly classified pixels,Nis the total number of samples;kis the Kappa coefficient;andNi+andN+irepresent the sum of the classiin the classified data and validation data,respectively.
Furthermore, field verification was performed for 29 points to evaluate the Landsat_RFC in 2020 (Fig.3).
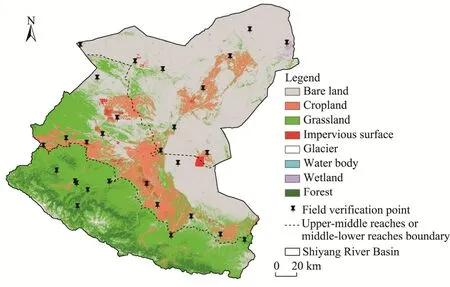
Fig.3 Spatial distribution of land use and cover classification results (2020) in this study and field verification points in the Shiyang River Basin
2.3.2 LUCC analysis
We calculated statistics on the area of each land use and cover type for each year (1991, 1995,2000, 2005, 2010, 2015, and 2020) in ArcGIS.Based on these data, we analyzed the area proportion of each land use and cover type in 2020 and the spatiotemporal change characteristics of land use and cover from 1991 to 2020.
Moreover, we used the land use transition matrix to analyze the conversion between different land use and cover types.The land use transition matrix is a two-dimensional matrix derived from the dynamic conversion relationship of land use and cover in the same region at different times.This reflects the changes in the quantity and direction of land use and cover in the study area(Wang et al., 2021; Jia et al., 2023).The formula is expressed as follows:
whereSmnis the area of land use and cover typemin the previous period converted to the typenin the later period (km2); andkis the number of land use and cover types.
2.3.3 Analysis of influencing factors of LUCC
Random forest is an ensemble learning algorithm proposed by Breiman (2001) that combines multiple trees.The algorithm utilizes bootstrap resampling, where multiple samples are randomly selected with replacements from original training sample set to create a new training sample set,and multiple classification trees are generated based on these bootstrap samples to form a random forest.The classification results for the new data were determined by voting based on the outcomes of the classification trees.This involves observing the contribution of each feature to each tree in the random forest, calculating the average contribution, and comparing the contribution level of each feature to evaluate their importance (Zhang et al., 2019; Wu et al., 2021c).
When analyzing the influencing factors of LUCC, scholars often use the multi-year averages of certain factors as independent variables, including Digital Elevation Model (DEM), precipitation,temperature, population, GDP, evapotranspiration, the distance to rivers and roads, nighttime light, and surface soil moisture (Han et al., 2015; Viedma et al., 2017; Xie et al., 2017; Zhou et al., 2020; Wang et al., 2021).We believe that changes in these factors have driven the LUCC,allowing for a more accurate consideration of the impact of multiple factors on the outcomes.The process of analyzing the influencing factors of LUCC was completed using the Sklearn library from the Python random forest package.We took the difference in each influencing factor between the beginning and end years of a period as the independent variable; for example, the difference between precipitation in 2020 and 2015 was utilized as an independent variable for the analysis of the influencing factors of LUCC during 2015-2020.Furthermore, considering the data limitations, surface soil moisture and population data were included in the analysis starting in 2000.The dependent variable was constructed using the land use and cover classification results in the beginning and end years of a period, following an 'xy' format, where 'x' represents the land use and cover classification result in the beginning year and 'y' represents that in the end year.The importance values of influencing factors of LUCC in 1991-1995, 1995-2000, 2000-2005,2005-2010, 2010-2015, and 2015-2020 were obtained respectively by calculating the average of the results of the seven stages, then the comprehensive results of the influencing factors from 1991 to 2020 can be obtained.
3 Results
3.1 Land use and cover classification and accuracy assessment results
The Landsat_RFC from 1991 to 2020 was generated using the random forest classification and visual interpretation methods following the classification system specified in Table 3.Notable changes in land use and cover occurred during 1991-2020 (Fig.4).The overall accuracy and Kappa coefficient were calculated for all the seven years; the overall accuracy was above 91.10%,and the Kappa coefficient was higher than 0.84.Generally, a Kappa coefficient value greater than 0.75 indicates a high level of model effectiveness and accuracy (Sun, 2021), confirming the reliability of the classification results in this study.
Landsat_RFC in 2015 was compared with the three other land use and cover product datasets,and the overall and partial validation results are presented in Table 4.Landsat_RFC (2015)achieved a classification accuracy rate of 92.01%, outperforming the other three datasets.Moreover, in the upper, middle, and lower reaches of the basin, the partial validation accuracy of Landsat_RFC (2015) was also the highest, with overall accuracy values of 76.05%, 67.66%, and 84.33%, respectively.For field verification, the Landsat_RFC in 2020 exhibited a high level of agreement with the ground truth features, indicating a high level of classification accuracy.
3.2 Land use and cover pattern in 2020
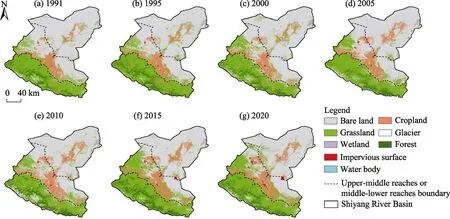
Fig.4 Spatial distribution of land use and cover classification results in the Shiyang River Basin from 1991 to 2020
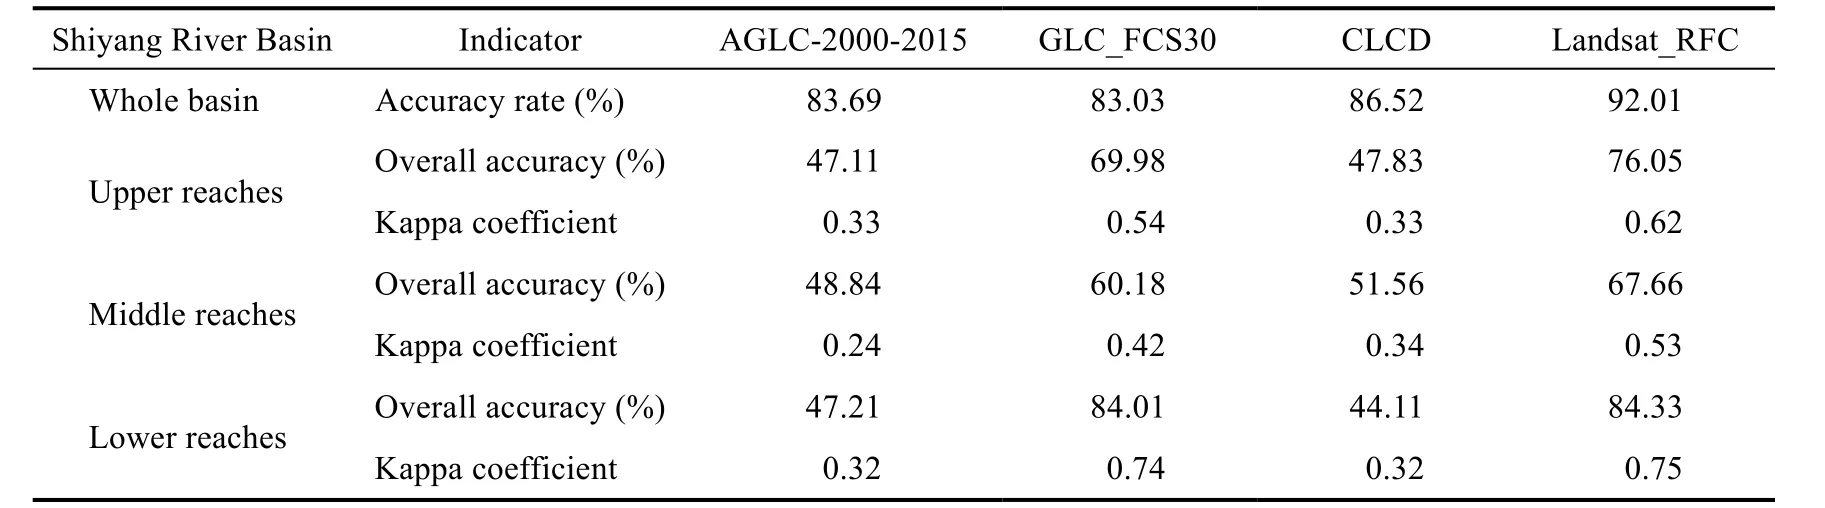
Table 4 Quantitative analysis of the four land use and cover datasets in the whole basin, and in the upper,middle, and lower reaches of the Shiyang River Basin in 2015
In 2020, the dominant land use and cover type in the Shiyang River Basin was bare land, covering 49.05% of the total area, followed by grassland, cropland, and forest, accounting for 33.90%,10.48%, and 5.23%, respectively (Fig.5).In the upper reaches of the basin, grassland, forest, and bare land accounted for 98.21% of the total area, with area proportions of 72.13%, 18.51%, and 7.57%, respectively.In the middle reaches of the basin, bare land, grassland, and cropland accounted for large proportions of the total area, reaching 41.57%, 33.17%, and 22.61%,respectively.In the lower reaches of the basin, bare land dominated the landscape, covering 84.42% of the total area, followed by grassland and cropland, accounting for 7.43% and 7.13%,respectively (Fig.5).As shown in Figures 4 and 6, bare land was primarily distributed in the lower reaches of the Shiyang River Basin in 2020; grassland was mainly distributed in the upper and middle reaches; cropland and impervious surface were mainly distributed in the middle reaches; forest and glacier were mainly distributed in the upper reaches; wetland was primarily found in the lower reaches; and the distribution of water body was relatively balanced across the upper, middle, and lower reaches of the basin.
3.3 Spatiotemporal analysis of LUCC during 1991-2020
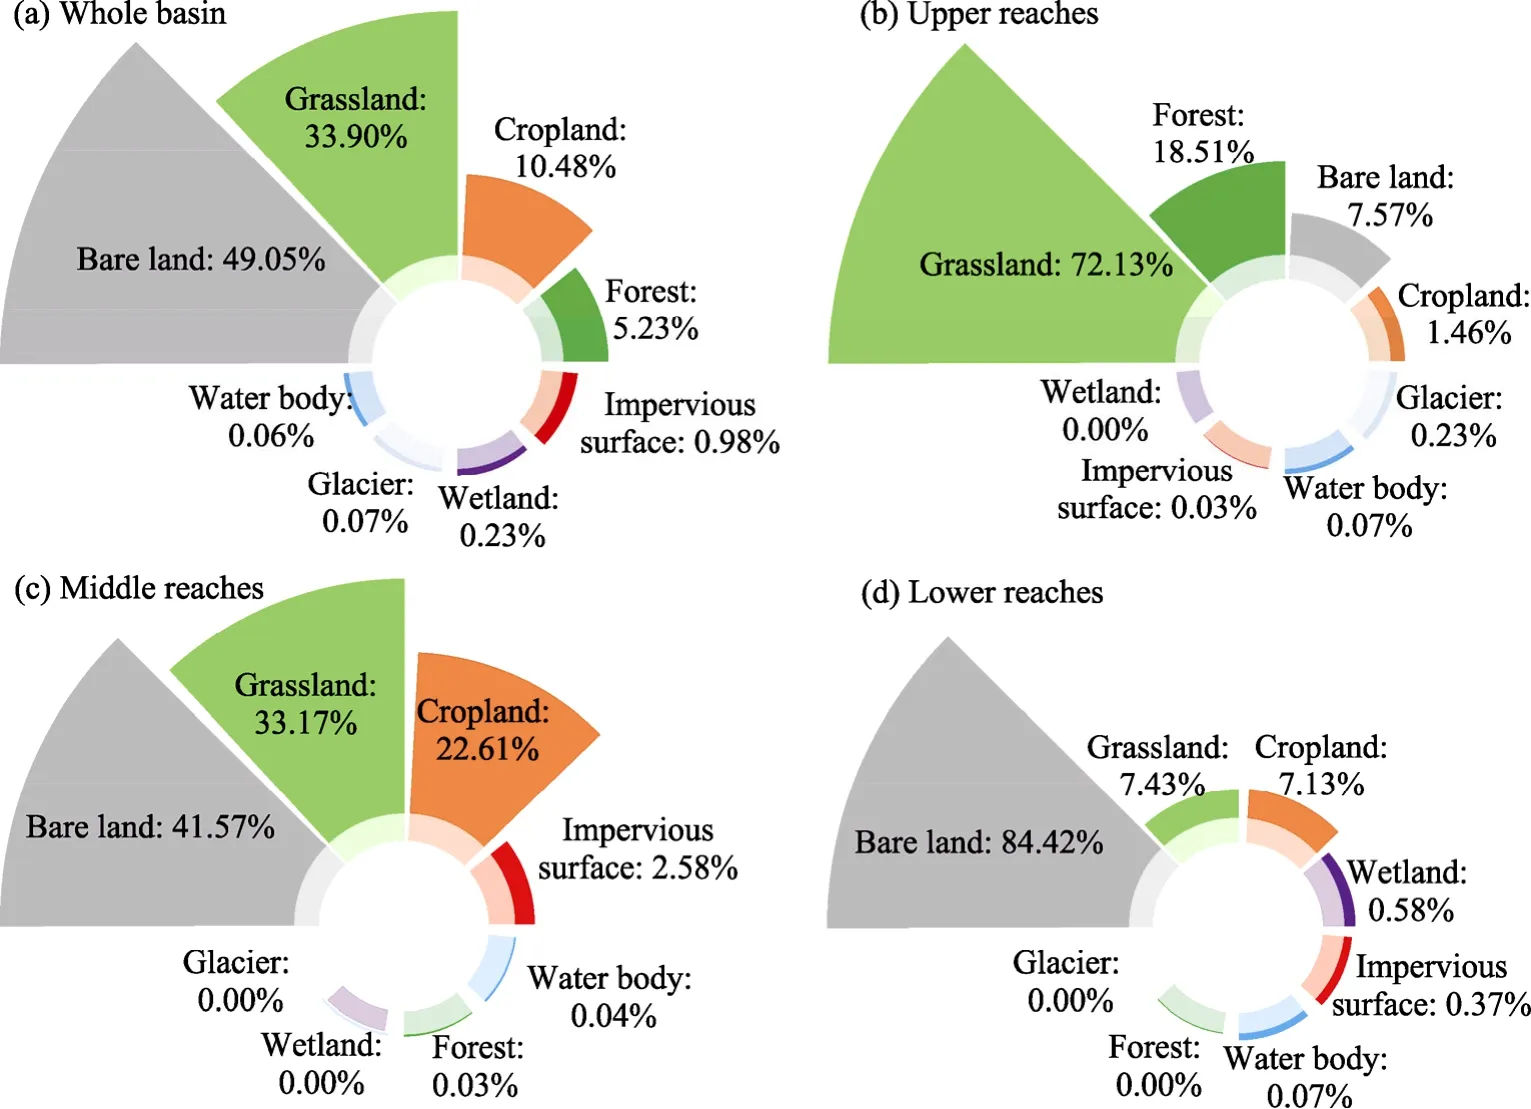
Fig.5 Area proportion of each land use and cover type in the whole basin (a), and in the upper (b), middle (c),and lower (d) reaches of the Shiyang River Basin in 2020
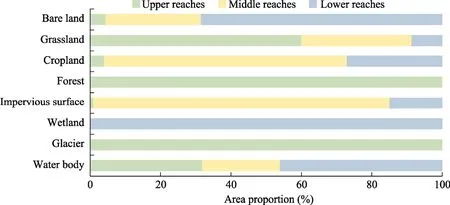
Fig.6 Area distribution of each land use and cover type in the upper, middle, and lower reaches of the Shiyang River Basin in 2020
NDVI, as a crucial indicator in remote sensing applications for vegetation index detection, not only reflects the vegetation conditions but also serves as a significant indicator for assessing land use and cover (Resende Vieira and Christofaro, 2024).Furthermore, understanding the variations in NDVI is of paramount importance in providing targeted guidance for land use and cover restoration and conservation efforts (Liao et al., 2024).Therefore, we analyzed the changes in NDVI to gain a macroscopic understanding of LUCC.From 1998 to 2019, the NDVI in the Shiyang River Basin showed an overall increasing trend (Fig.7), indicating positive development of the ecological environment.Among the three sub-regions, the upper reaches of the basin showed the fastest rate of change, more than twice that of the entire Shiyang River Basin.

Fig.7 Trends of Normalized Difference Vegetation Index (NDVI) in the whole basin (a) and three sub-regions(b) of the Shiyang River Basin from 1998 to 2019
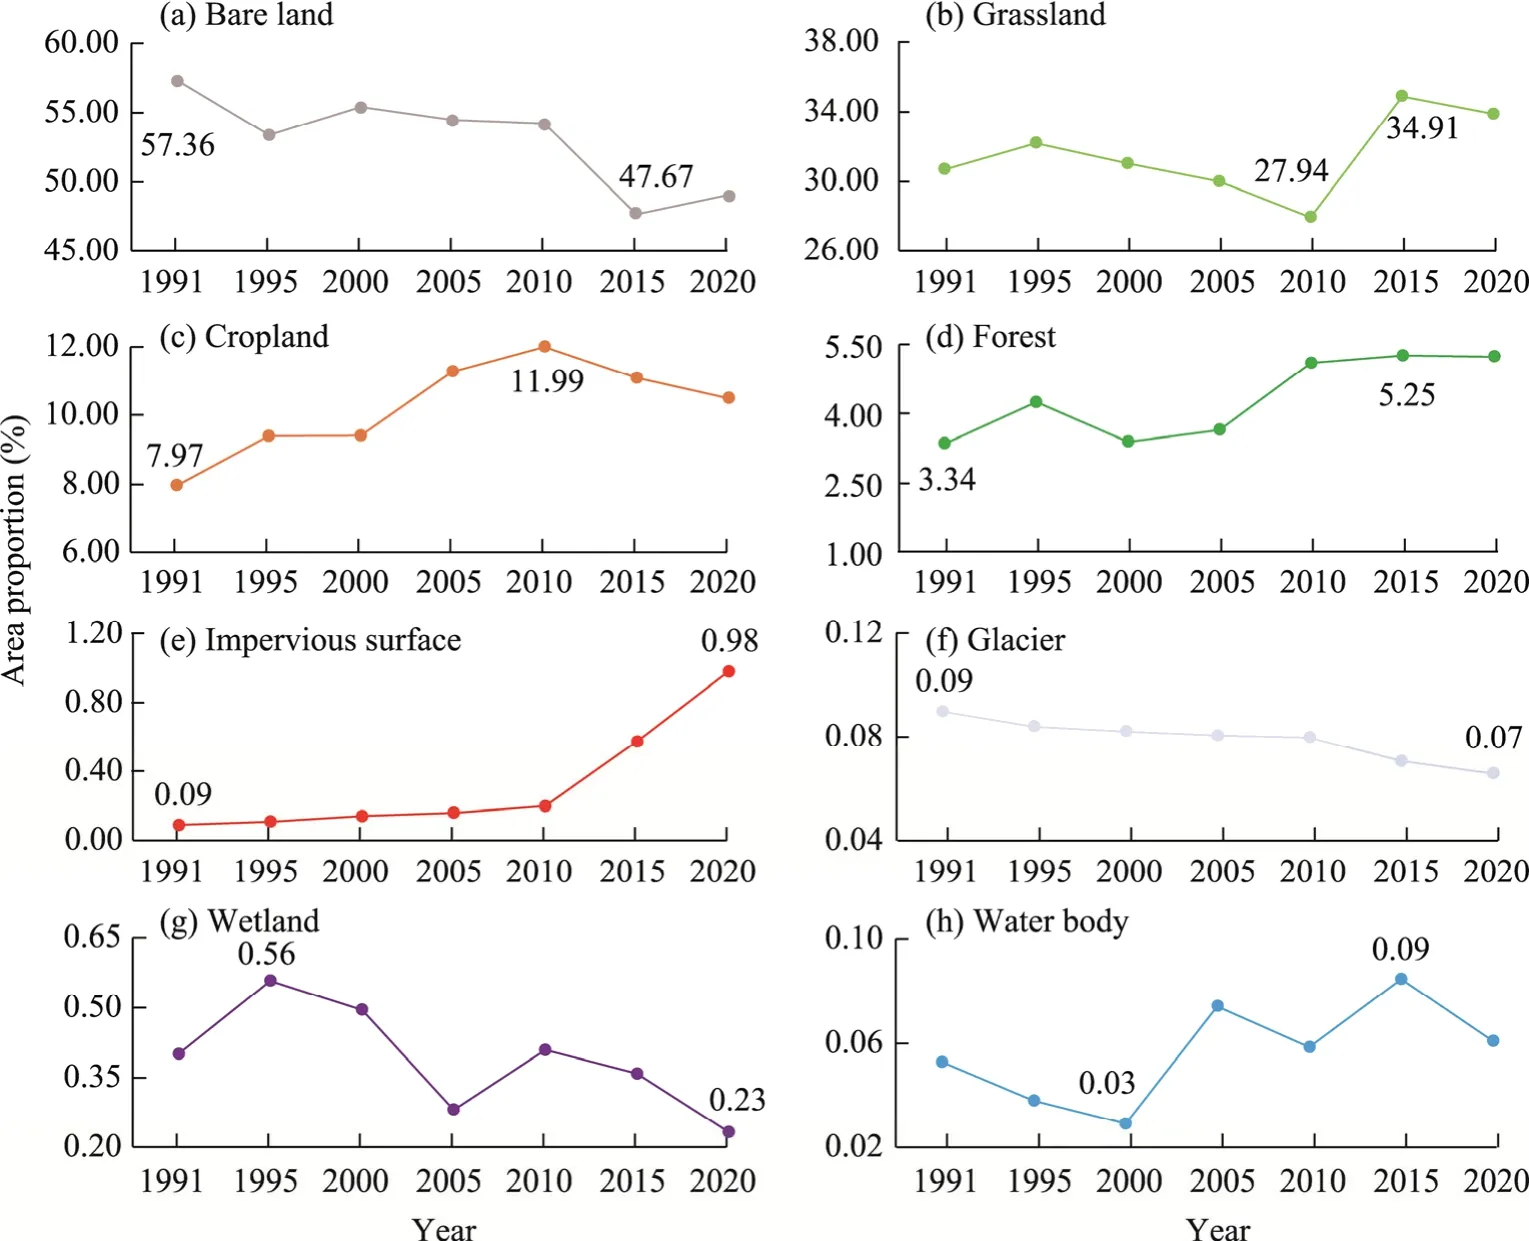
Fig.8 Temporal variations in area proportion of each land use and cover type in the Shiyang River Basin from 1991 to 2020.(a), bare land; (b), grassland; (c), cropland; (d), forest; (e), impervious surface; (f), glacier; (g),wetland; (h), water body.The values represent the maximum and minimum values of the area proportion for each land use and cover type.
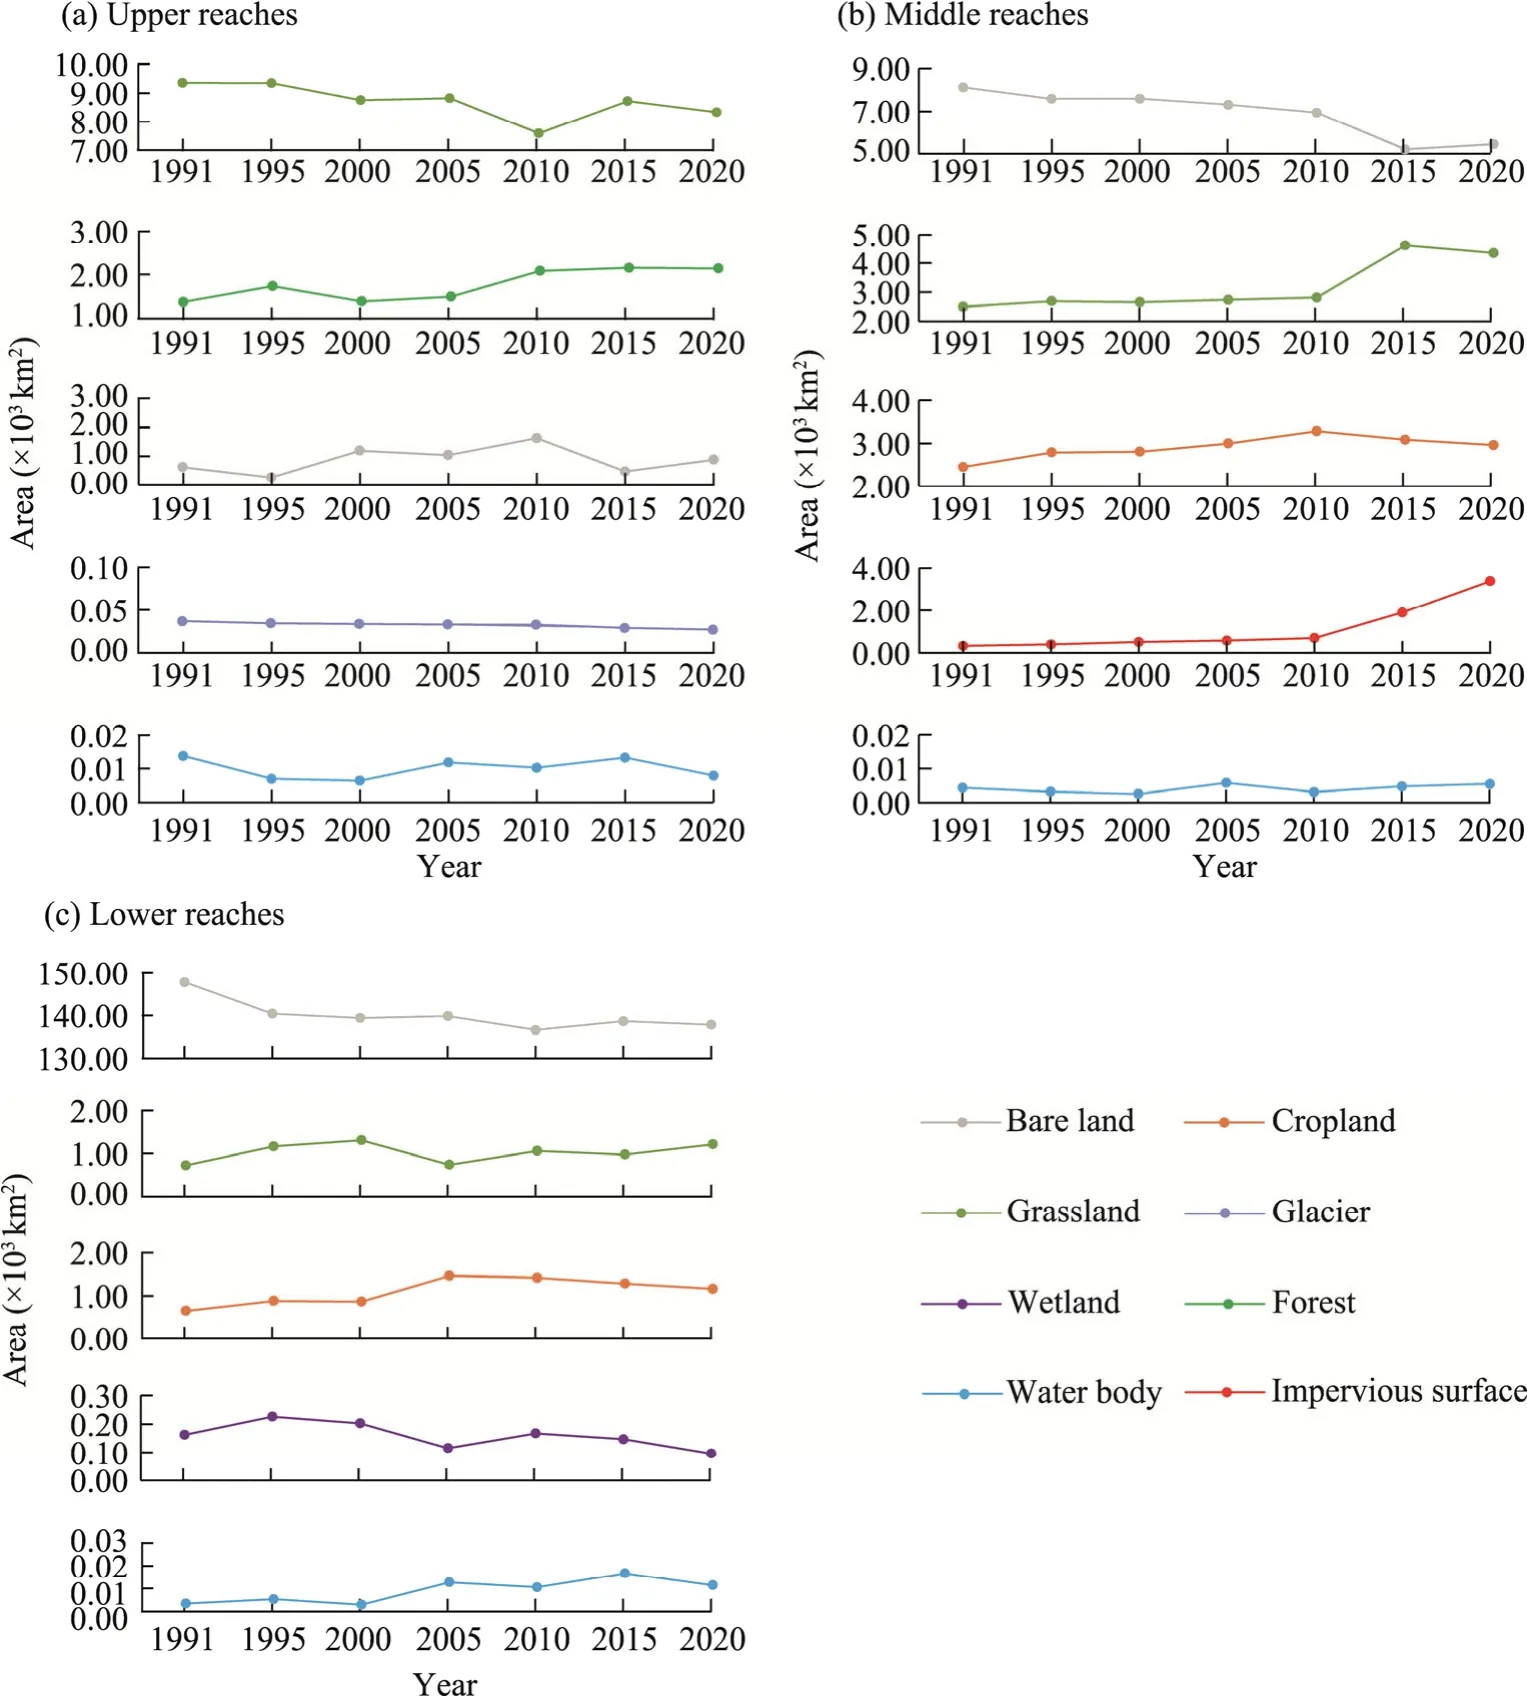
Fig.9 Temporal variations in area of each land use and cover type in the upper (a), middle (b), and lower (c)reaches of the Shiyang River Basin from 1991 to 2020
The LUCC in the Shiyang River Basin are shown in Figures 8 and 9.From 1991 to 2020, the bare land area showed a decreasing trend, with an area reduction of 3408.7 km2, which occurred primarily in the middle and lower reaches of the basin, decreasing by 2672.2 and 998.5 km2,respectively.However, it showed an increasing trend in the upper reaches, increasing by 262.0 km2.Although bare land was primarily distributed in the lower reaches of the basin (Fig.6), the main changes occurred in the middle reaches of the basin.From 1991 to 2010, grassland area decreased by 1122.3 km2, and the reduction mainly occurred in the upper reaches of the basin;thereafter, it increased by 2438.0 km2from 2010 to 2020, with the increase primarily concentrated in the upper and middle reaches of the basin.In contrast to the trend for grassland area, the cropland area increased by 1649.6 km2from 1991 to 2010, but decreased by 618.5 km2from 2010 to 2020, and its change primarily occurred in the middle and lower reaches of the basin.The forest area increased by 769.8 km2from 1991 to 2020, primarily in the upper reaches of the basin.The impervious surface area increased by 365.7 km2from 1991 to 2020, primarily in the middle reaches of the basin.The areas of wetland and glacier showed a decreasing trend from 1991 to 2020, with reductions of 67.1 and 9.9 km2, respectively.The reduction in the area of wetland was mainly observed in the lower reaches, whereas the glacier primarily decreased in the upper reaches of the basin.From 1991 to 2000, the water body area decreased by 9.7 km2, and the reduction mainly occurred in the upper reaches of the basin, decreasing by 7.4 km2; thereafter, it increased by 13.0 km2from 2000 to 2020, with the increase primarily concentrated in the lower reaches of the basin.
The land use and cover transfer diagram (Fig.10) indicates that from 1991 to 2020, the decreased bare land was primarily converted to grassland, followed by cropland.The increase in cropland area was primarily attributed to the conversion from bare land and grassland from 1991 to 2010, and the area reduction after 2010 was attributed to the transfer to bare land and a small amount of impervious surface.Grassland underwent transformation into bare land and cropland from 1991 to 2010, but the increase came from bare land after 2010.The continuous expansion of impervious surface was mainly attributed to the conversion from bare land and cropland.Glacier,the area of which decreased continuously, was primarily transformed into bare land.Changes in water body area were caused by mutual transformation with bare land.Wetland, which exhibited a general decreasing trend, was converted to bare land.The overall increasing trend of forest area can be attributed to the conversion from grassland.
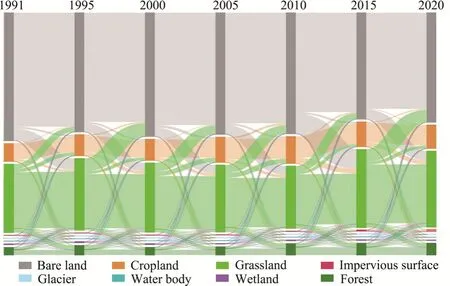
Fig.10 Transfer between different land use and cover types in different periods in the Shiyang River Basin.The width of the curve represents the amount of transfer between different land use and cover types.
3.4 Analysis of the influencing factors of LUCC
The random forest importance ranking method was utilized to assess the importance of the influencing factors in the Shiyang River Basin and the three sub-regions, as shown in Figure 11.In the Shiyang River Basin, LUCC was primarily influenced by precipitation, evapotranspiration,temperature, and population, and the importance values were 32.41%, 22.12%, 21.89%, and 19.65%, respectively.In the upper reaches of the basin, LUCC was influenced by precipitation,population, evapotranspiration, and temperature.In the middle reaches of the basin, population,precipitation, evapotranspiration, and temperature remained crucial.Population was the primary factor, exerting a greater impact than natural factors.In the lower reaches of the basin, LUCC was influenced by surface soil moisture, population, precipitation, and temperature.Surface soil moisture had the greatest influence, with an importance value of 32.96%.In general, among all the factors, precipitation had a greater influence on LUCC than evapotranspiration and temperature.Among the anthropogenic factors, population had a significant impact, with the highest influence in the middle reaches of the basin.
4 Discussion
4.1 Analysis of the influencing factors of LUCC from the aspect of land use and cover types
The land use and cover classification results were obtained using the random forest classification method.We conducted a statistical analysis of the area of each land use and cover type, and obtained the LUCC trends in the Shiyang River Basin from 1991 to 2020.The land use and cover types exhibited distinct differences in their change trends (Fig.8).
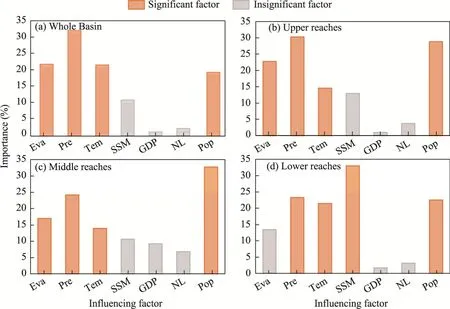
Fig.11 Importance of the influencing factors of LUCC in the whole basin (a), and in the upper (b), middle (c),and lower (d) reaches of the Shiyang River Basin.Eva, evapotranspiration; Pre, precipitation; Tem, temperature;SSM, surface soil moisture; NL, nighttime light; Pop, population.According to the Pearson's correlation coefficients, we identified the first four important factors as significant factors, and the last three as insignificant factors.
Bare land area exhibited a decreasing trend.Grassland area initially decreased and then increased, with 2010 being the turning point.During the whole study period, various crops were cultivated, and urban construction was conducted on bare land to meet human needs and pursue rapid economic development, resulting in a decrease in bare land area (Han et al., 2015).Fluctuating climatic conditions (Fig.12) have resulted in mutual conversion between bare land and grassland, particularly at their boundaries.Compelling evidence indicates that climate change indirectly affects the vegetation cover (Cui et al., 2021).Before the turning point (2010),precipitation and temperature accumulated over a prolonged period, leading to more favorable water and thermal conditions for vegetation, which promoted plant growth, increased evapotranspiration, and improved the conversion of bare land into grassland.
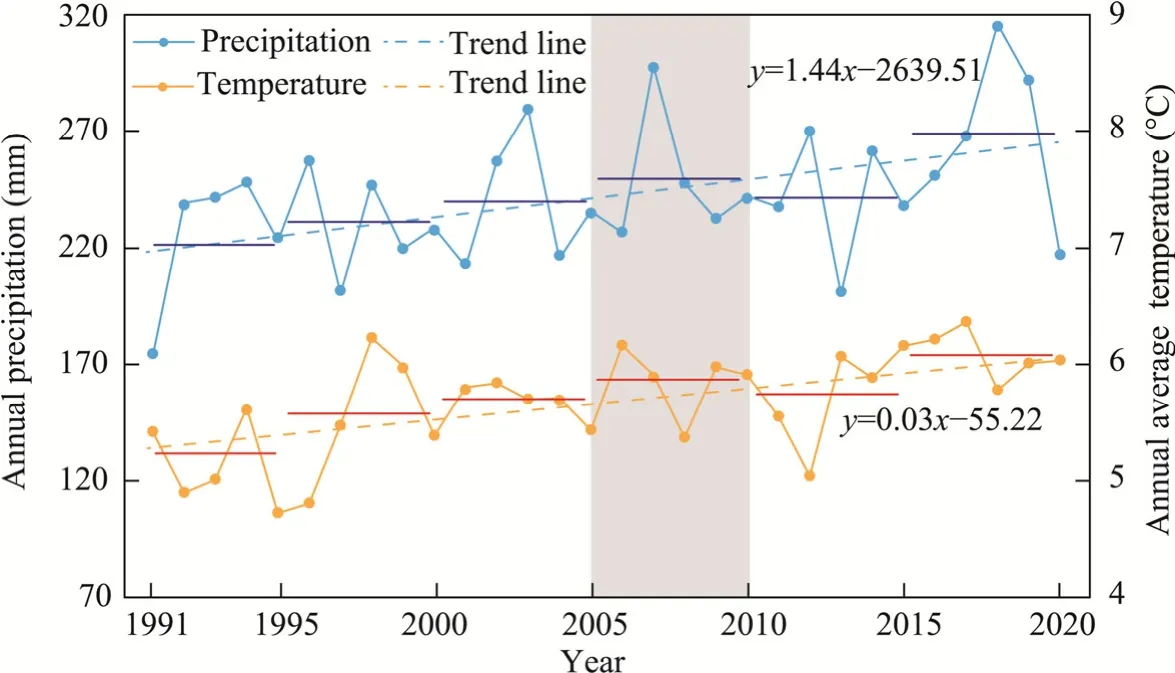
Fig.12 Trends in annual precipitation and annual average temperature from 1991 to 2020 in the Shiyang River Basin.The blue and red segments represent the average values of annual precipitation and annual average temperature over a specific 5-year period, respectively.The grey area indicates the transition period.
Cropland area initially increased and then gradually decreased, with the year of the turning point coinciding with grassland.Forest area was on an upward trend.The proposal of"grain-oriented" ideology in the late 1990s and implementation of rural tax reduction and exemption policies in 2006 promoted the reclamation of abandoned land, resulting in a rapid increase in grain production and the conversion of grassland into cropland, increasing the total cropland area (Wei et al., 2017; Hu et al., 2018).Additionally, starting in 2000, China introduced the Western Development Strategy and initiated the Grain for Green Program, which aimed to transform steep croplands (with slopes exceeding 25°) and bare land into forest and grassland to restore regional ecosystems (Du et al., 2014).
Impervious surface area continued to increase, and these changes were influenced by population and urban development.Particularly in 2015, on-site inspections revealed that numerous photovoltaic panels were installed to meet the growing energy demand of the population (Zhao et al., 2023).
The water body area initially decreased, reaching a minimum in approximately 2000, and then showed an increasing trend, and the wetland area decreased.During the period of rapid economic development, excessive exploitation of water resources has led to a decrease in the water area(Wang et al., 2012).In 2007, the Chinese government approved the "Restoration Plan for the Shiyang River Basin", which aimed to manage and protect water resources (Hao et al., 2017).Consequently, the water area of the Shiyang River Basin has begun to increase.However, human activities became more frequent, and the water body area continued to decrease slowly in the middle reaches of the basin.This decrease in wetland may be attributed to warm climate (Xue et al., 2021).The area of glacier decreased steadily, and the changes were influenced by climate.Cao et al.(2019) confirmed that the Qilian Mountains exhibited a decreasing trend in glacier,which is consistent with our findings.
The trend in land use and cover types in the Shiyang River Basin, excluding forest, are consistent with existing research results (Han et al., 2015; Wei et al., 2017; Hu et al., 2018; Wang et al., 2021).Han et al.(2015) and Hu et al.(2018) found that forest area showed a growing trend,whereas Wang et al.(2021) and Wei et al.(2017) found that forest area showed a declining trend.Our research findings showed that forest area was growing.These discrepancies can be attributed to variations in the classification standards and study areas.Yang and Huang (2021) analyzed the LUCC in China from 1985 to 2019 and found an increasing trend in forest area.This conclusion is consistent with the results of the present study, further validating the accuracy of the classification outcomes.
4.2 Analysis of the influencing factors of LUCC at the sub-regional level
The core influencing factors of LUCC in the whole basin, and in the upper, middle, and lower reaches of the Shiyang River Basin were analyzed using the random forest importance ranking method.The distinguishing feature of this study is the utilization of the difference between two adjacent years of data instead of constants.Among these factors, precipitation, temperature,evapotranspiration, and population were identified as the main influencing factors (Fig.11), and policies had a significant impact.Existing studies on the Shiyang River Basin have identified climate, population, topography, and policy as the main influencing factors of LUCC (Han et al.,2015; Wei et al., 2017; Hu et al., 2018; Chen et al., 2020; Wang et al., 2021).A high degree of similarity between the conclusions suggests a certain level of reliability.
In the whole basin, and in the upper and middle reaches of the Shiyang River Basin, the primary influencing factors of LUCC included precipitation, temperature, evapotranspiration, and population.Climate change affected the interconversion between bare land and grassland, the reduction in glacier area, and changes in water body area.Population influenced the expansion of impervious surface area and changes in cropland area.In addition, these changes were influenced by policies (Wang et al., 2012; Du et al., 2014; Hao et al., 2017; Wei et al., 2017; Hu et al., 2018,Zhao et al., 2023).In the middle reaches of the basin, the areas of cropland and impervious surface accounted for 69.51% and 84.73%, respectively, of their respective total areas.Moreover,the population had a greater impact on LUCC in the middle reaches than in the other sub-regions of the basin.
While in the lower reaches of the basin, LUCC was influenced by surface soil moisture,temperature, precipitation, and population.The area proportions of bare land, grassland, and cropland were high, with bare land accounting for 85.80% of the total area in this sub-region.Owing to the relatively small proportions of grassland and cropland, this sub-region has a limited capacity to retain soil moisture and reduce evaporation (Xu et al., 2023).In recent years, the implementation of ecological governance methods such as "Ant Forest" has contributed to alleviating land degradation and desertification (Wu et al., 2022).Along with climate change, soil moisture retention capacity has been enhanced.When there is an increase in rainfall and a decrease in evaporation, the surface soil moisture increases, leading to the transition from bare land to grassland and cropland (Xu et al., 2023; Zhang et al., 2023a).The expansion of impervious surface and the change in cropland have been constrained by human activities.Furthermore, the promotion of Minqin Liangucheng Nature Reserve to the National Nature Reserve in 2002 played a significant role in enhancing vegetation cover, mitigating desertification, and improving the ecological environment (Chen et al., 2020).As a result, the reduction in bare land and increase in grassland after 2000 can be attributed to the positive impact of this policy.
5 Conclusions
This study considered the Shiyang River Basin as the research area.Based on ArcGIS, ENVI technology, Python programming, and random forest classification, we obtained the land use and cover datasets between 1991 and 2020.The classification process incorporated Google Earth view, band combinations, and vegetation fractional coverage to enhance the accuracy of classification.The spatial distribution of land use and cover in 2020, as well as the changes and transitions of various land use and cover types from 1991 to 2020 were analyzed.The random forest importance ranking method was used to assess the influence of natural and anthropogenic factors on LUCC.
(1) In the Shiyang River Basin, the land use and cover classification results from 1991 to 2020 using the random forest classification exhibited high accuracy.The overall accuracy exceeded 91.10% and the Kappa coefficient was greater than 0.84 for all years.The overall and partial accuracy values of Landsat_RFC were better than those of the three land use and cover product datasets (AGLC-2000-2015, GLC_FCS30, and CLCD).
(2) In the Shiyang River Basin, bare land, grassland, and cropland were the main land use and cover types, accounting for over 90.00% of the total area.In the upper reaches of the basin, the main land use and cover types were grassland, forest, and bare land.The main land use and cover types in the middle and lower reaches of the basin included bare land, grassland, and cropland.The difference between the two lies in the large proportion of bare land in lower reaches of the basin, which accounted for 84.42% of the total area in 2020.
(3) The bare land area exhibited an overall decreasing trend, with changes primarily concentrated in the middle and lower reaches of the basin.The grassland area initially decreased and then increased, while the cropland area initially increased and then decreased.Changes in grassland area mainly occurred in the upper and middle reaches of the basin, whereas changes in cropland primarily occurred in the middle and lower reaches of the basin.The areas of forest and impervious surface increased primarily in the upper and middle reaches of the basin, respectively.The areas of wetland and glacier decreased, mainly occurring in the lower and upper reaches of the basin, respectively.The water body initially decreased and then increased, with changes observed in all three sub-regions.
(4) LUCC was influenced by both natural and anthropogenic factors.The main influencing factors in the upper and middle reaches of the Shiyang River Basin included precipitation,evapotranspiration, temperature, and population.In the lower reaches of the basin, LUCC was influenced by surface soil moisture, population, precipitation, and temperature.Policy factor also played a significant role in the LUCC of the Shiyang River Basin.
The findings in this study contribute to a deeper understanding of the trends and influencing factors of LUCC in the Shiyang River Basin.Simultaneously, this analysis holds significant scientific significance, not only influencing regional sustainable development but also providing a foundation for related research in Shiyang River Basin and other similar arid and semi-arid areas.
Conflict of interest
The authors declare that they have no known competing financial interests or personal relationships that could have appeared to influence the work reported in this paper.
Acknowledgements
This work was financially supported by the Central Government to Guide Local Technological Development(23ZYQH0298), the Science and Technology Project of Gansu Province (20JR10RA656, 22JR5RA416), and the Science and Technology Project of Wuwei City (WW2202YFS006).
Author contributions
Conceptualization: ZHAO Yaxuan, CAO Bo, PAN Baotian; Data curation: ZHAO Yaxuan, CHENG Jinquan;Formal analysis: ZHAO Yaxuan; Funding acquisition: CAO Bo, GUAN Weijin; Investigation: ZHAO Yaxuan,SHA Linwei; Methodology: ZHAO Yaxuan, SHA Linwei, ZHAO Xuanru; Supervision: CAO Bo, PAN Baotian;Validation: ZHAO Yaxuan, GUAN Weijin; Visualization: ZHAO Xuanru, GUAN Weijin; Writing - original draft: ZHAO Yaxuan; Writing - review and editing: CAO Bo, CHENG Jinquan.All authors approved the manuscript.
- Journal of Arid Land的其它文章
- Formation and ecological response of sand patches in the protection system of Shapotou section of the Baotou-Lanzhou railway, China
- Effects of drip and flood irrigation on carbon dioxide exchange and crop growth in the maize ecosystem in the Hetao Irrigation District, China
- Effects of landscape fragmentation of plantation forests on carbon storage in the Loess Plateau, China
- Influence of varied drought types on soil conservation service within the framework of climate change:insights from the Jinghe River Basin, China
- A CMIP6-based assessment of regional climate change in the Chinese Tianshan Mountains
- Runoff change in the Yellow River Basin of China from 1960 to 2020 and its driving factors