
Implication of community-level ecophysiological parameterization to modelling ecosystem productivity: a case study across nine contrasting forest sites in eastern China
2024-01-26 10:30:16MinzheFangChangjinChengNianpengHeGuoxinSiOsbertJianxinSun
Journal of Forestry Research 2024年1期
Minzhe Fang · Changjin Cheng · Nianpeng He ·Guoxin Si · Osbert Jianxin Sun
Abstract Parameterization is a critical step in modelling ecosystem dynamics.However,assigning parameter values can be a technical challenge for structurally complex natural plant communities;uncertainties in model simulations often arise from inappropriate model parameterization.Here we compared five methods for defining community-level specific leaf area (SLA) and leaf C:N across nine contrasting forest sites along the North–South Transect of Eastern China,including biomass-weighted average for the entire plant community (AP_BW) and four simplified selective sampling (biomass-weighted average over five dominant tree species [5DT_BW],basal area weighted average over five dominant tree species [5DT_AW],biomass-weighted average over all tree species [AT_BW] and basal area weighted average over all tree species [AT_AW]).We found that the default values for SLA and leaf C:N embedded in the Biome-BGC v4.2 were higher than the five computational methods produced across the nine sites,with deviations ranging from 28.0 to 73.3%.In addition,there were only slight deviations (<10%) between the whole plant community sampling(AP_BW) predicted NPP and the four simplified selective sampling methods,and no significant difference between the predictions of AT_BW and AP_BW except the Shennongjia site.The findings in this study highlights the critical importance of computational strategies for community-level parameterization in ecosystem process modelling,and will support the choice of parameterization methods.
Keywords Biome-BGC · Community traits · Forest Ecosystems · Model parameterization
Introduction
Modelling provides an ultimate solution to integrate multisource and multi-scale data for projecting spatiotemporal ecosystem dynamics.Apart from critical issues in defining logical algorithms to represent various components of ecosystem processes and their complex interrelationships,one of the major sources of uncertainty in modelling arises from an inadequacy of parameterization for key input variables(Zaehle et al.2005;Scheiter 2013).Generally,a vegetation model requires meteorological data,geophysical information and ecophysiological parameters as inputs to simulate ecosystem processes and dynamics (Running and Hunt 1993).The ecophysiological parameters typically include leaf and root traits as well as physiological variables depicting plant carbon,nutrient and water relations (Running and Hunt 1993;Running et al.1995;Ren et al.2022).With increasing data availability and better understanding of the controls on ecosystem processes,incorporating plant traits beyond the traditional use of simplified plant functional types has become a common practice in vegetation modelling (Van Bodegom et al.2012,2014;Fisher et al.2015;Sakschewski et al.2015;Wang et al.2017;Berzaghi et al.2020).However,for communities with complex plant functional types and life forms and contrasting structural attributes,modulating model runs by considering differential traits of diverse plant groups can be tedious and exhausting tasks,especially at increasing spatial coverage.For modelling across contrasting ecosystems and biomes,integration of individual plant traits to represent community-level values could impose a great challenge in practice.
The plant traits can be characterized across a range of organizational scales from organs to communities,with scale-specific representation of numerical values (He et al.2019).Most vegetation models require data inputs by ecosystem types or plant functional groups,usually with integrated community-level traits as ecophysiological parameters (Golinkoff 2010;Liu et al.2022).However,due to a lack of universally-applicable methods for deriving community-level attributes,integration of plant trait values is often performed arbitrarily with self-perceived feasibility.Most of the recent literature on vegetation models that we compiled either omitted the information on how the ecophysiological parameterization at the forest stand-level was achieved,or gave very vague descriptions of the procedures (Table S1).An inconsistency in value assignment of ecophysiological parameters can contribute to varying degrees of uncertainties in model outputs (White et al.2000;Li and Sun 2018;Ren et al.2022).
Scaling up the plant functional traits from individuals to communities for modelling require not only a prior knowledge of species-dependent trait values,but also the specificity weighting of the given trait types (Violle et al.2007;Borgy et al.2017;He et al.2019).While measurements of plant functional traits can be easily made experimentally,decision on assigning the weighting ratio for contrasting trait specifications is often fraught with unknown degree of biases or subjectivity (Liu et al.2022).The commonly used computation approaches for community-level plant traits in literature included weighting by species mixing-ratio or calculating as arithmetic means of co-dominant plant species.In forest stands,partitioning the total cross-section area at breast height by species could be a useful attribute for quantifying species-mixing ratio as there usually exist stable allometric relationships between the radial growth of trees and the net productivity of forest stands,hence a probable analogy to specificity weighting.However,the relationships between the cross-section-based species mixing ratio and the weighting of contrasting plant functional traits are not easily established.Therefore,the use of computational approaches for community-level traits in ecosystem modelling remain largely a personal choice rather than a scientifically-proven technical procedure.
To date,it remains an open question that how different approaches of parameterization for community-level ecophysiological traits would affect the model simulations of ecosystem processes.In this study,we compared five methods for attaining community values of specific leaf area (SLA) and leaf carbon to nitrogen ratio (C:N ratio) based on either biomass weighted means or basal area weighted means,which are biomass-weighted average for the entire plant community (AP_BW),for only five dominant tree species (5DT_BW),and for all tree species(AT_BW),respectively,and basal area-weighted average for only five dominant tree species (5DT_AW) and for all tree species (AT_AW),respectively.SLA and leaf C:N ratio were selected as the two crucial physiological and ecological parameters characterizing the photosynthetic carbon assimilation in the Biome-BGC model (Golinkoff 2010).The community-level SLA and leaf C:N were determined for nine contrasting natural forest ecosystems (from coldtemperate to tropical forests along a 3,700-km transect in China).This study seeks to address two scientific questions that will inform the choice of model parameterization methods: (1) Could the default values provided by the Biome-BGC be safely adopted without introducing uncertainties,and how far would they deviate from the five parameterization methods? (2) How much bias would occur in the predicted NPP when incorporating trait values from different parameterization approaches in the Biome-BGC model,and which approach would more feasible both economically and scientifically?
Materials and methods
Study sties and sampling
In order to make our study more applicable on a large scale,we selected nine typical forest sites along the North–South Transect of Eastern China for field survey(Fig.1).The transect spanned a latitude ranging from 51.8 to 18.7°N,mean annual temperature from -4 to 23 °C and mean annual precipitation from 470 to 2270 mm respectively.The soil types included podzol,luvisol,ferralsol,greyzem and acrisol (Table S2).These sites represent tropical monsoon forest,subtropical monsoon evergreen broad-leaved forest,subtropical evergreen broad-leaved forest,subtropical mixed deciduous and evergreen forest,warm temperate deciduous broad-leaved forest,temperate mixed coniferous and broad-leaved forest and boreal forest,respectively,covering almost all forest types in the Northern Hemisphere (Wang et al.2016).
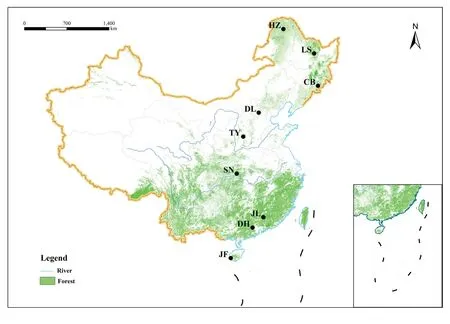
Fig.1 Geographic distributions of the nine forest sites along the North–South Transect of Eastern China included in this study.JF,Jianfeng Mountains;DH,Dinghu Mountains;JL,Jiulian Mountains;SN,Shennongjia;TY,Taiyue Mountains;DL,Dongling Mountains;CB,Changbai Mountains;LS,Liangshui;HZ,Huzhong
Field survey data were obtained from the measurements during an intensive field champion in July and August 2013,in the peak growth season for all forests.Sampling plots were all located within the protected natural forests.Each forest type was characterized by survey of four 30 × 40 m plots for tree layer,with measurements on shrubs within two 5 × 5 m subplots and on herbaceous plants within four 1 × 1 m quadrats (see Fig.S1 for the layout of the various levels of plots).Measurements of height and diameter at breast height (DBH) were made on all woody plants with DBH ≥ 3 cm on each tree plot.Herbaceous plants were measured for aboveground biomass by harvesting and oven-drying.For measurements of specificity leaf traits,twenty healthy and fully expanded leaves were collected from four individuals for each plant species (total of 803 tree,shrub and herb species),as described in detail in Wang et al.(2016) and Zhang et al.(2020).
Computations of community-level ecophysiological traits
Plant functional traits refer to the measurable characteristics of plants after long-term acclimation and evolution under prevailing environmental conditions (He et al.2019).In this study,we used two critical leaf traits required by most ecosystem process models in simulations of canopy photosynthetic capacity,i.e.SLA and leaf C:N ratio,to test the differences and applicability of varying computational methods for community-level ecophysiological parameters (Foley et al.1996;Sacks et al.2006;Beer et al.2007).Modified from He et al.(2019),the community traits were calculated from the specificity values as:
wherenis the number of representative plant species in the community;WIiis the weighting index of theith species;andQiis the measured trait value of theith species.
We tested five methods for computation of the community-level trait values for each of the study sites,based on either biomass weighted means or basal area weighted means.The five computational methods included biomassweighted average for the entire plant community (AP_BW),for only five dominant tree species (5DT_BW),and for all tree species (AT_BW),respectively,and basal area-weighted average for only five dominant tree species (5DT_AW) vs.all tree species (AT_AW),respectively (Table 1).

Table 1 The five computational approaches of ecophysiological parameterization adopted in this study
Biome-BGC modelling
We used Biome-BGC v4.2 (http:// www.ntsg.umt.edu/ proje ct/ biome-bgc.php) to evaluate the effects of varying methods of community parameterization on model simulations.The model requires three types of input data to run: Initialization file,meteorological data,and ecophysiological parameters (Running and Hunt 1993;Thornton et al.2002).The initialization file covers information on geographic location and basic site conditions.The meteorological data comprise key climatic variables such as the maximum,minimum and average air temperatures,precipitation,average water vapor pressure difference,average daytime shortwave radiation flux density and day length,etc.In this study,the daily time-series of the meteorological variables required for running Biome-BGC at the nine study sites were derived through the simulation of MTCLIM v4.3 (http:// www.ntsg.umt.edu/ proje ct/ mt-clim.php) based on the datasets for the nearest meteorological stations for the period 2008–2018,which were obtained from the National Weather Science Data Centre (daily meteorological dataset of basic meteorological elements of China,National Surface Weather Station V3.0;http:// data.cma.cn).These data were corrected for geographic location,elevation and main slope aspect of the given study sites.The Biome-BGC model provides default values of ecophysiological parameters for a variety of vegetation types (ecophysiological files),including deciduous broadleaf forest,evergreen broadleaf forest,evergreen needleleaf forest,shrubs,and grassland (Thornton et al.2002).In this study,we used the default ecophysiological parameters for all but SLA and leaf C:N ratio,on the prevailing forest stand type at each of the nine study sites,with modifications for the mixture of contrasting tree species in the forest canopy.
The simulations with Biome-BGC were performed for the nine study sites using the entire default ecophysiological parameters,substitution with the site-specific values for either SLA or leaf C:N ratio,and substitution with the site-specific values for both SLA and leaf C:N ratio,respectively.The site-specific values for SLA and leaf C:N ratio were distinguished by the computational methods listed in Table 1.
The simulation process of Biome-BGC consists of a spinup mode and a normal mode.The spin-up mode involves the model run to equilibrium based on user input of meteorological,geographical and ecophysiological parameters.This was done for between 891-and 6000-year cycles depending on the specific sites targeted by the simulations.Afterwards,the normal model simulations were performed (Thornton et al.2002).The Biome-BGC model can only be simulated in a single run at each site,and we used batch commands to cycle the model according to established rules (i.e.three parametric modes and six variations of ecophysiological parameters).
Statistics and simulation data evaluation
One-way ANOVA was used to test the effects of different computation methods on community SLA and leaf C:N ratio and model simulation results.Comparison of multiple means was made with LSD post-hoc tests.We used Taylor diagrams to compare the extent to which the model simulation results with other computation methods match with that based on trait computation for the whole plant community (i.e.AP_BW) as a baseline.A Taylor diagram is a method of data analysis that presents the correlation coefficient,root mean square error and standard deviation of multiple sets of data in a single graph.It is often used to compare the closeness of a set of simulated values to a set of baseline values (Taylor 2001).In this study,we arbitrarily used the results of the model simulations under the AP_BW method as the baseline values to determine the closest simulation effect to the AP_BW method of computing community-level traits.The one-way ANOVA and LSD posthoc tests were performed with SPSS 24.0 and Taylor diagrams were drawn in R studio.
Results
Community-level SLA and leaf C:N ratio by different computational methods
Significant deviations are observed between the default values and the five computational methods (P<0.05;Tables 2 and 3).Specifically,the default value for SLA in the Biome-BGC is defined as 16.5;whereas the values derived from the five computational methods for community-level SLA vary from 9.52 to 11.22 across the nine sites,which are markedly lower than the default value.For the leaf C:N ratio,the default value is also consistently higher than that estimated based on the five computational methods across study sites.The results of ANOVA show that the community-level trait values (including SLA and leaf C:N ratio) did not significantly differ among the five computational methods(P>0.05;Tables 2 and 3).
Simulated annual NPP by Biome-BGC based on varying estimates of SLA and leaf C:N ratio
In the mode where SLA and leaf C:N are parameterized at the same time,compared to the NPP predicted by default values,the predicted values by the five parameterization methods were 3.7% to 65.3% lower at the DH and SN sites,but 23.9% to 27.5% higher at the HZ site (P<0.05;Fig.2).For the remaining six sites,there was no significant difference between the NPP predicted based on the default values and that based on values from the five parameterization methods (P>0.05;Fig.2).
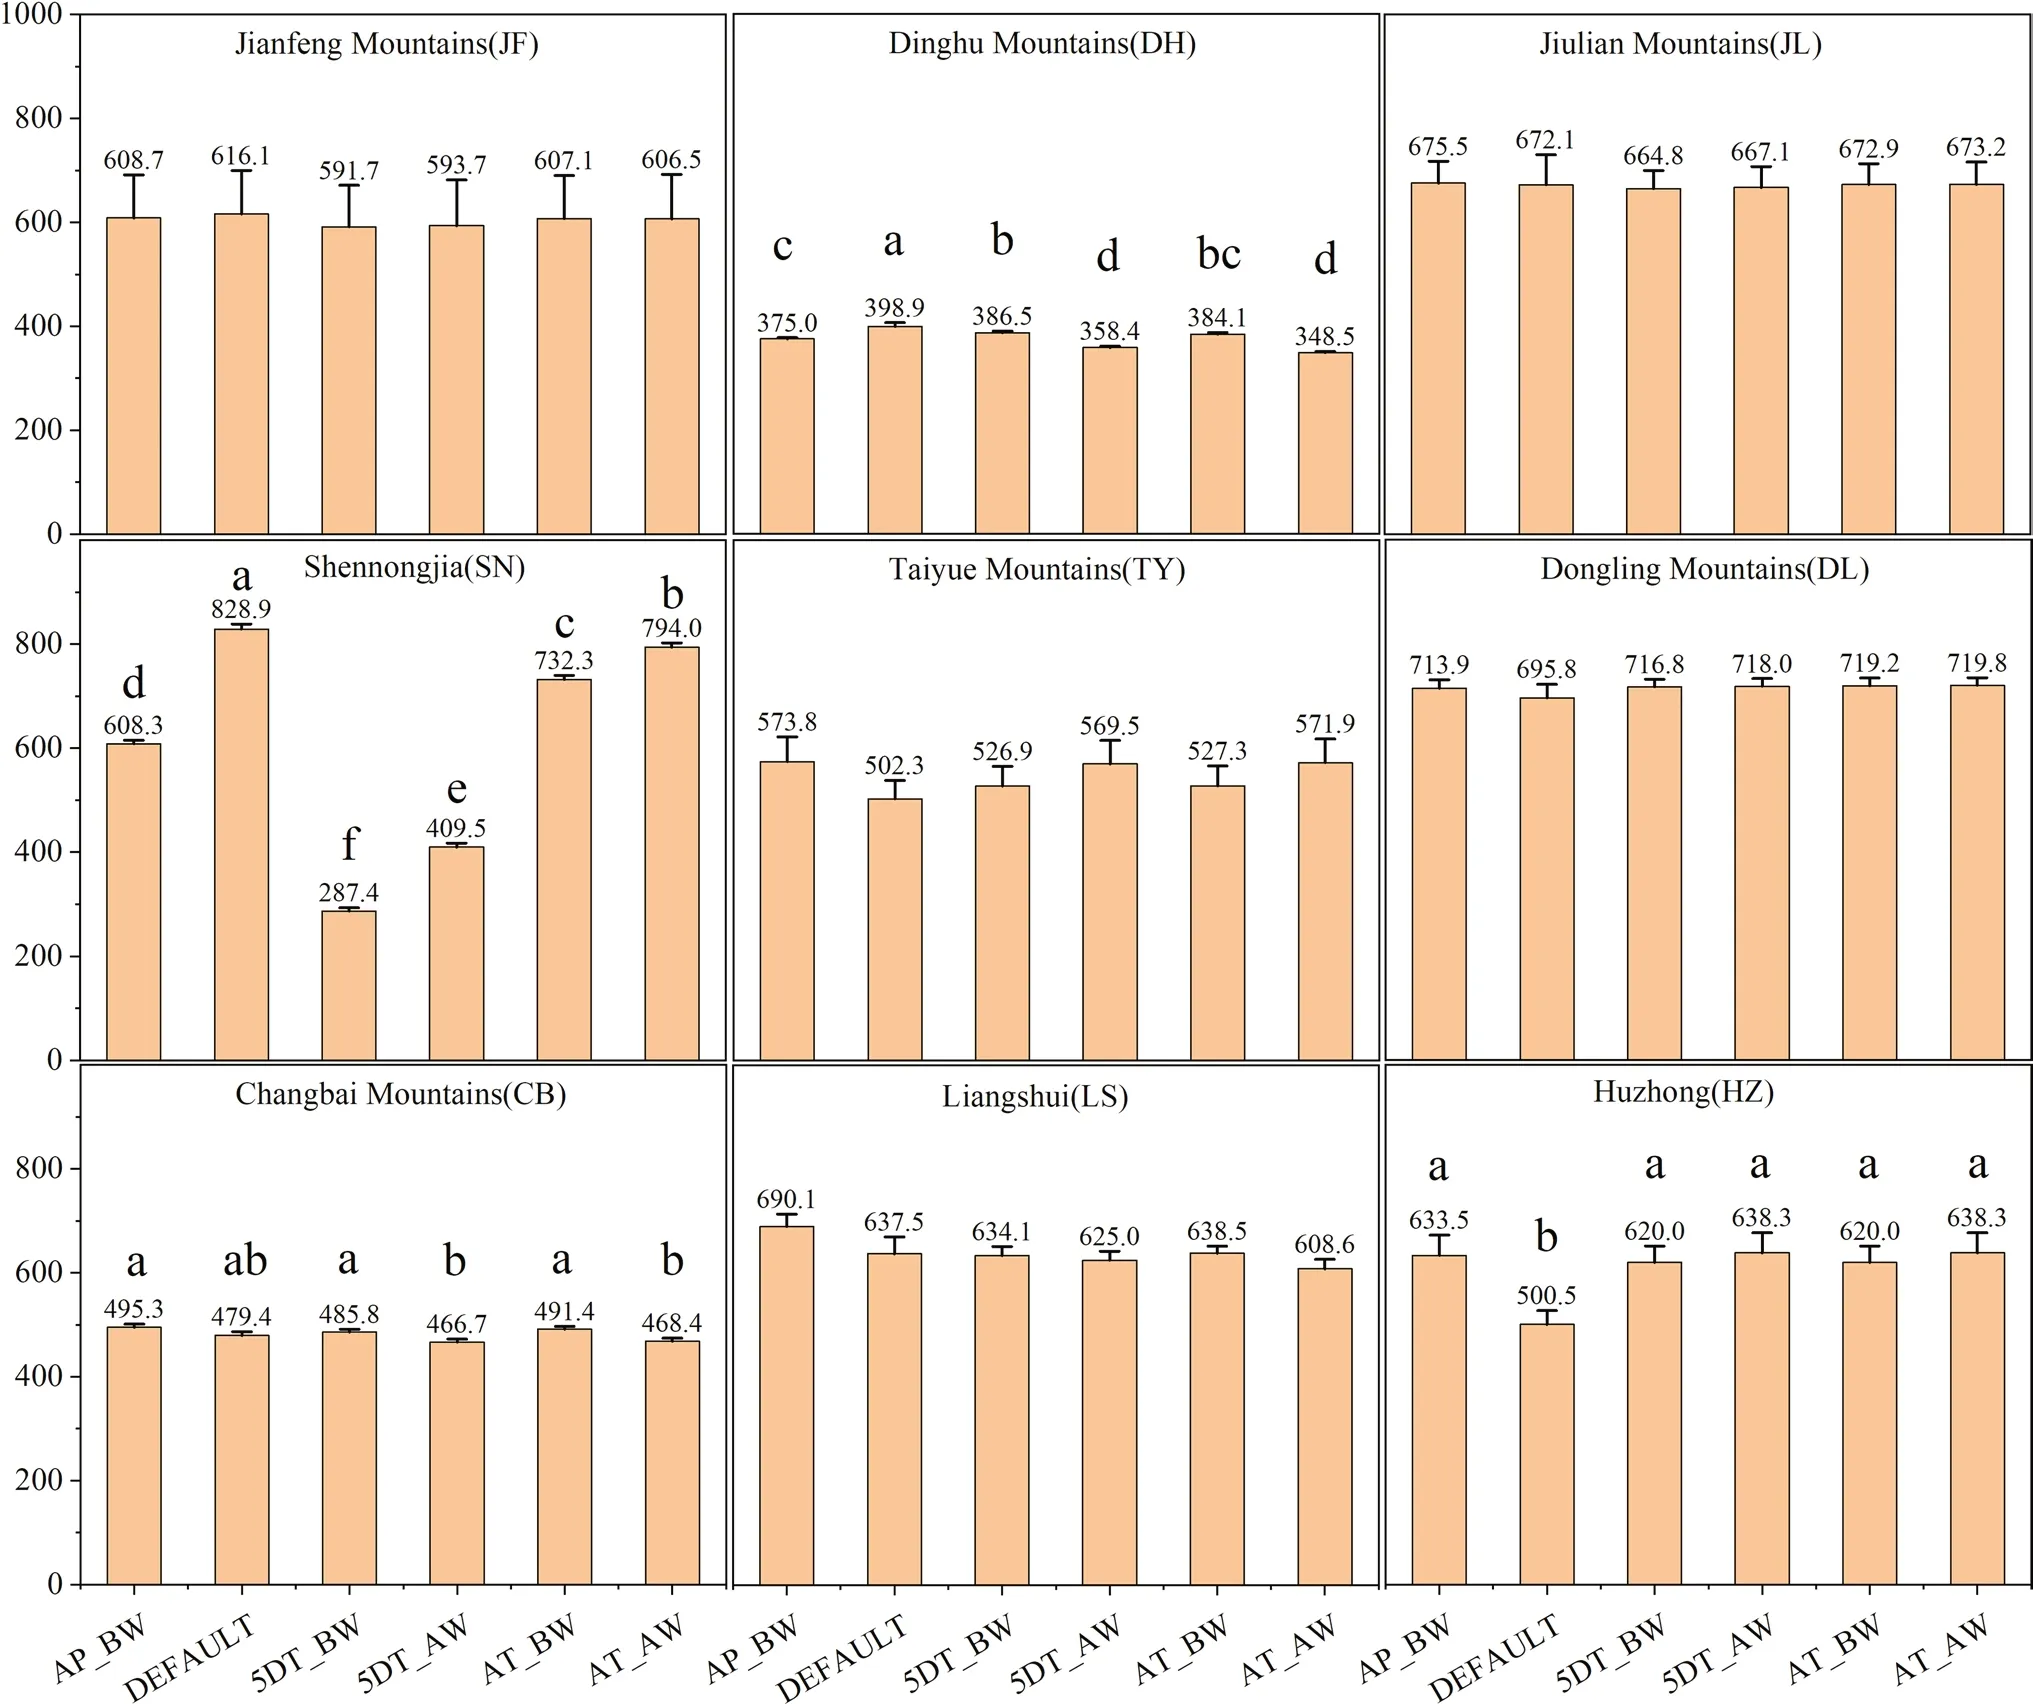
Fig.2 Differences in annual NPP simulated with differential parameterizations of SLA and leaf C:N ratio across nine forest sites.The histogram values are mean annual NPP during 2008–2018 (Fig.S2).Vertical bars show one standard error.Above each bar,the mean is given.Significant differences are denoted using different letters(P <0.05)
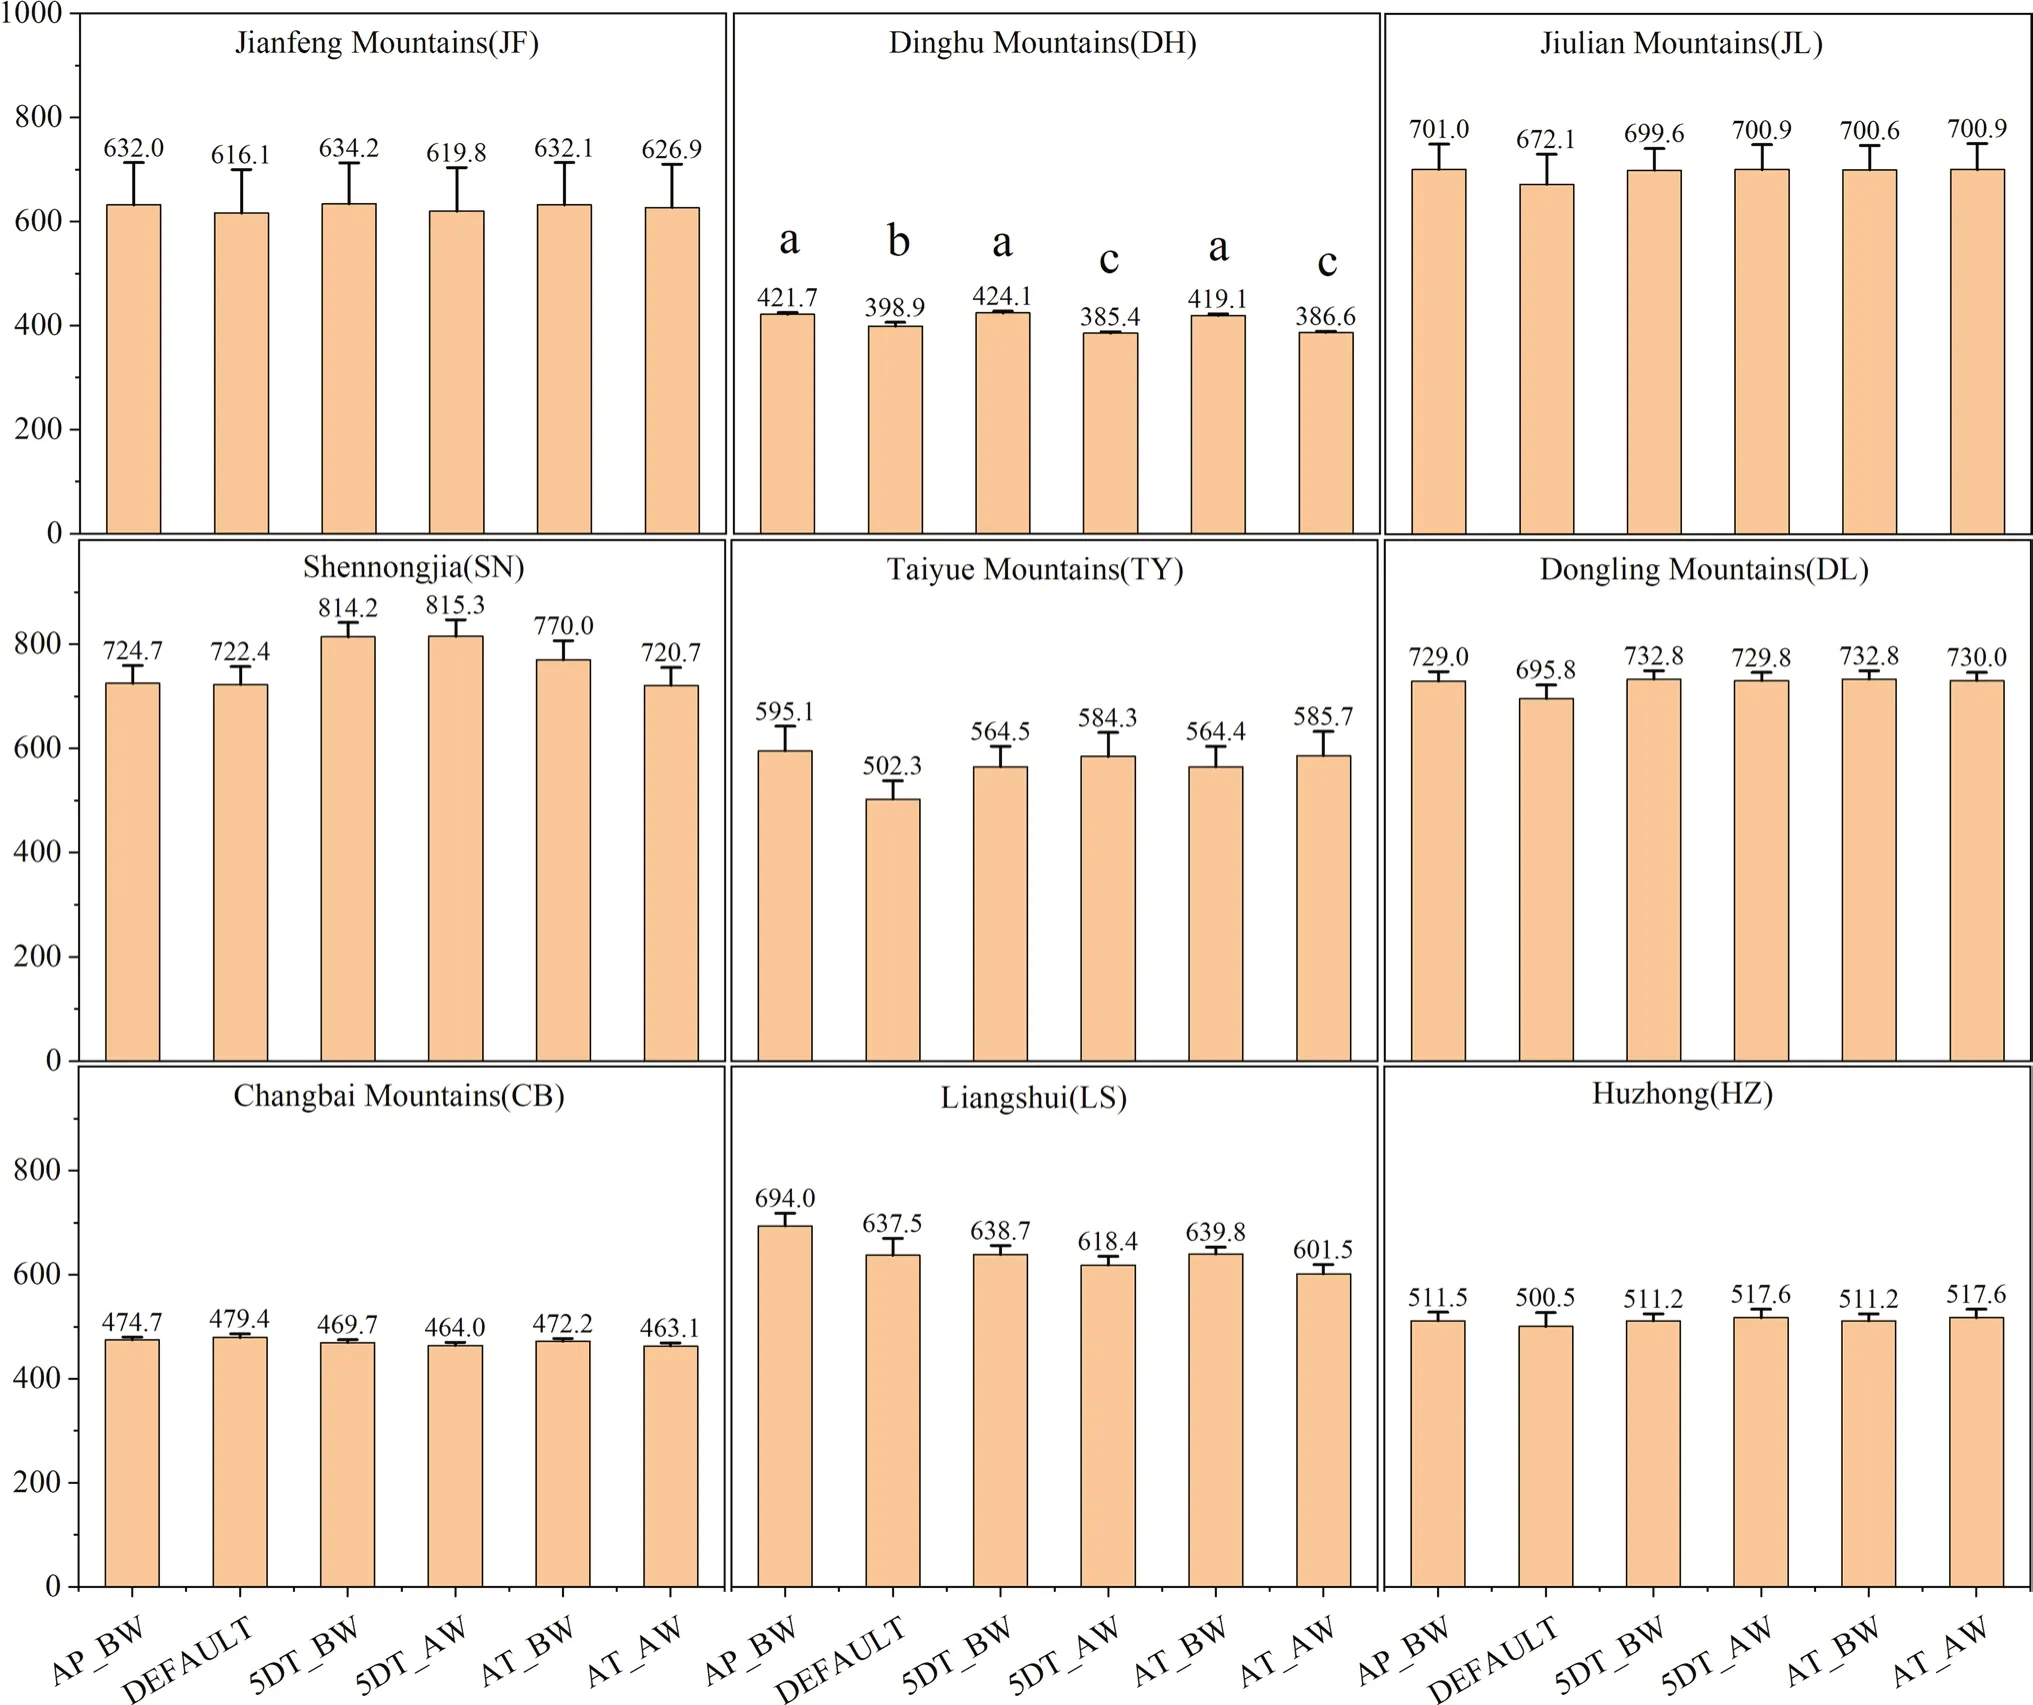
Fig.3 Differences in annual NPP simulated with differential parameterizations of SLA across nine forest sites.The histogram values are mean annual NPP during 2008–2018 (Fig.S2).Vertical bars show one standard error.Above each bar,the mean is given.Significant differences are denoted using different letters (P <0.05)

Fig.4 Differences in annual NPP simulated with differential parameterizations of leaf C:N ratio across nine forest sites.The histogram values are mean annual NPP during 2008–2018 (Fig.S2).Vertical bars show one standard error.Above each bar,the mean is given.Significant differences are denoted using different letters (P <0.05)
When SLA are leaf C:N are parameterized in Biome-BGC independently,only the DH site shows significant variations in the simulated annual NPP (P<0.05) with the use of values from different sources,but the differences are all small (within 7% deviation) (Figs.3 and 4).
Parameterization of community-level SLA and leaf C:N ratio with varying sampling schemes
When parameterized simultaneously with both SLA and Leaf C:N,we found that the NPP based on the AP_BW estimates for the SN site were 111.7% and 48.5% higher than those based on the 5DT_BW and 5DT_AW estimates,but lower by 16.9% and 23.4% than those based on the AT_BW and AT_AW estimates,respectively (P<0.05).In the analyses for the remaining eight sites,there were only slight deviations (<10%) between the simulations based on the AP_BW values and those with other four parameterization methods.In addition,there was no significant difference between the predicted NPP by the AP_BW value and the AT_BW value,regardless of whether SLA and leaf C:N were included in the model at the same time(P>0.05;Figs.2,3 and 4).
Taylor diagram analyses of the four sites with significant differences showed that the NPP predicted by the values of AT_BW and AT_AW were consistently close to that predicted by the AP_BW value (Fig.5).
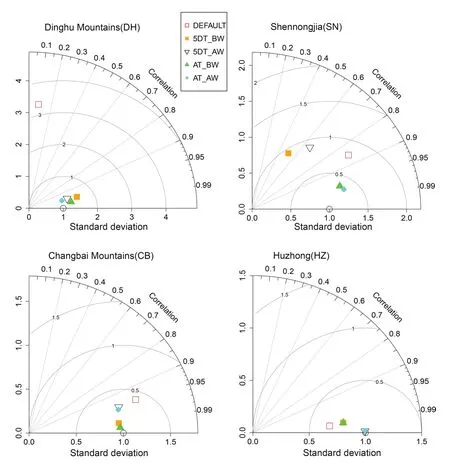
Fig.5 Comparison of the annual NPP simulated with differential parameterizations of SLA and leaf C:N ratio at four representative forest sites along the North–South Transect of Eastern China using Taylor diagram.Parameterization method of AP_BW is arbitrarily treated as baseline with graphic positioning of (x=1,y=0).The closer the dot is to the (1,0)point,the better the fitting effect of the specific method compared with AP_BW.AP_BW,biomass weighted average for entire plant community;5DT_BW,biomass weighted average of five dominant tree species;5DT_AW,basal area weighted average of five dominant tree species;AT_BW,biomass weighted average of all trees;AT_AW,basal area weighted average of all trees
Discussion
Accuracy in the estimation of vegetation productivity based on ecosystem process models is one of the critical challenges faced by ecologists;inadequate parameterization of key input variables has been a significant source of uncertainty in model simulations (Li et al.2018).Default values are widely applied in regional modelling of ecosystem processes where measurements of the input variables are difficulty to attain or not readily available.The default values provided by given models are often based on data compiled from literature (White et al.2000;Thornton and Running 1999).Although the drawbacks of utilizing default values are commonly recognized,there is a lack of knowledge on how much the default values of models deviate from the measured values in different climatic zones and for different vegetation types (White et al.2000;Thornton and Running 1999).This study examines the implications of the computational methods for deriving community-level parameters with measurements for night forest sites across four climatic zones,ranging from tropical to cold temperate,tested using the well-established ecosystem process model Biome-BGC.We found that for all climate zones and forest types,the default values assigned by the Biome-BGC model deviated significantly from the measured values (the deviation greater than 28%)(Tables 2 and 3).On this basis,we call for the inclusion of measured trait-based parameters in large scale modelling forest ecosystem processes.
Although findings from this study and those in literature all confirm the importance of including communitylevel traits in the model,it is not clear what computational approach would be more appropriate to quantify the community-level trait parameters (Scheiter et al.2013;Berzaghi et al.2020).Currently,there are five calculation methods that are often applied in ecosystem modelling studies (Table 2).The biomass-weighted average of all species in a community has been suggested to be a most reliable approach to calculate community-level trait values (AP_BW)because it accounts for the entire forest communities and is considered to have a strong explanatory power for forest ecosystem productivity (Li et al.2018;He et al.2019,2022).However,the disadvantage of using AP_BW is that it must be based on field measurements to obtain large amounts of data,which is labor intensive and impractical for large scale ecosystem studies.In comparison,it would be easier to sample on tree species or the dominant tree species in forest communities.In this context,exploring how much the AP_BW-based prediction of NPP deviates from the simplified weighting approach and default values would help inform our selection of field sampling strategies for purpose of quantifying ecosystem processes and function.We found that the trait values based on the AP_BW approach were not significantly different from the four simplified approaches(P>0.05;Tables 2 and 3).The predicted NPP based on AP_BW for SLA and leaf C:N ratio at five of the study sites (JF,JL,TY,DL and LS) did not significantly differ from the one based on four simplified computational methods (P>0.05;Fig.2).Of the four sites where differences occurred,there was no significant difference between the predicted NPP by AP_BW-derived and AT-BW-derived parameter values for sites DH,CB and HZ,and the deviation of the predictions based on the AT_BW values from that based on the AP_BW values at the SN site is reasonably small (16.9%) (Fig.2).When considering only SLA or leaf C:N independently in the Biome-BGC model parameterization,no significant difference was found between the predicted NPP based on the AT_BW values and that based on the AP_BW values across all sites (Figs.2 and 3).The results indicate that the AP_BW method for community-level parameterization,which requires more investment,does not necessarily provide a significant advantage in predicting NPP.On the other hand,the simplified sampling method of AT_BW appears to be a viable alternative to AP_BW for all climatic zones and forest types included in this study.
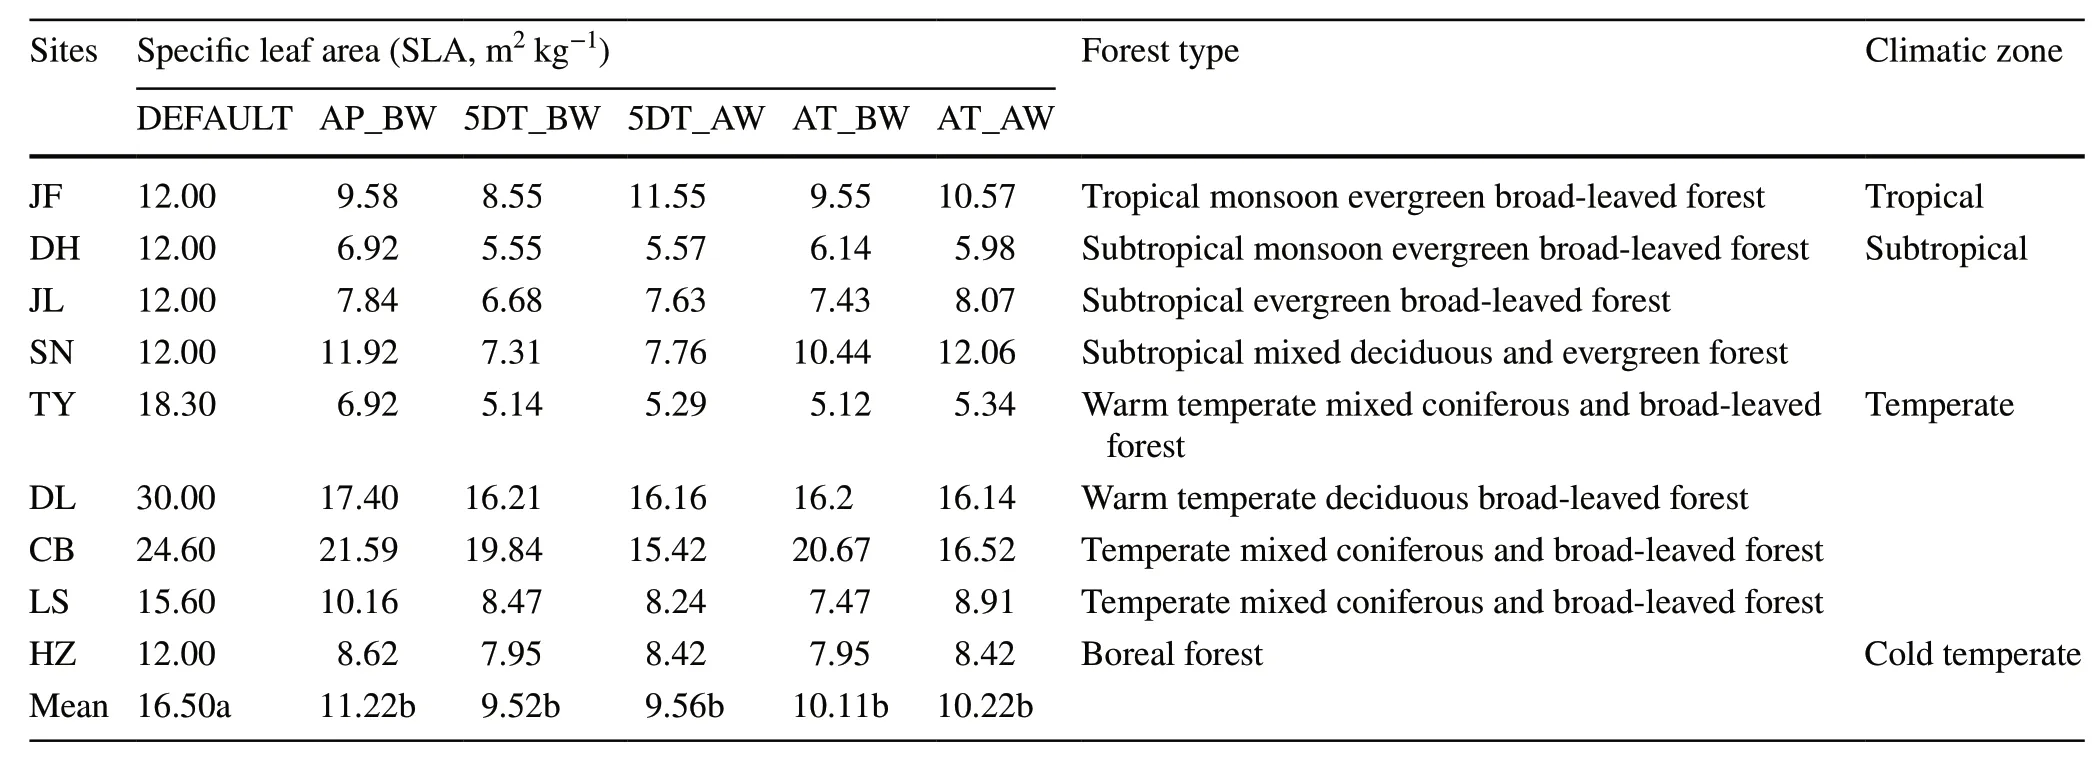
Table 2 Variability in the estimates of community specific leaf area (SLA,m2 kg-1) by different computational methods across nine forest sites along the North–South Transect of Eastern China

Table 3 Variability in the estimates of community leaf C:N ratio by different computational methods across nine forest sites along the North–South Transect of Eastern China
It is also important to emphasize that the composition of species within communities should not be overlooked when discussing the choice of community-level weighting.For example,in this study,only three tree species appeared in the sampling plot of HZ (Fig.S3),so the calculated values of community-level traits using 5DT_BW and AT_BW methods were the same.In addition,for the subtropical monsoon evergreen broad-leaved forest (site DH),temperate forest(sites TY,DL,CB and LS) and cold temperate forest (HZ),due to the relatively simple species composition of the tree layer (Fig.S3),the accuracy of weight values from five dominant tree species (5DT) approach exceeded 80%,hence a result of insignificant difference between the NPP predictions based on 5DT values and the all tree-based approach(Figs.2,3,4 and 5).Therefore,for forest ecosystems in northern China with a simple tree species composition,sampling only the dominant tree species for community trait values would suffice.
Conclusions
The simulation results (annual NPP) of the Biome-BGC model by using different ecophysiological parameterization methods were compared among nine forest sites covering four climatic zones and eight forest types.We found that the default values embedded in the Biome-BGC v4.2 for specific leaf area and leaf C:N ratio were significantly higher than derived from five different computational methods based on measured data,with deviations ranging from 28.0 to 73.3%.In addition,the full community plant weighting (AP_BW),which requires more investment,does not necessarily provide a significant advantage in predicting NPP compared to the simplified selective sampling (especially for biomass weighted average of all trees) for all climatic zones and vegetation types.This study highlights the critical importance of computational strategies for community-level parameterization in ecosystem process modelling.
AcknowledgementsAuthors acknowledge the financial support of the National Natural Science Foundation of China (Grant Nos.31870426).We thank Ying Li,Congcong Liu,Jiahui Zhang,Zhaogang Liu and Jingguo Sun for providing methodological help on plant traits.
Open AccessThis article is licensed under a Creative Commons Attribution 4.0 International License,which permits use,sharing,adaptation,distribution and reproduction in any medium or format,as long as you give appropriate credit to the original author(s) and the source,provide a link to the Creative Commons licence,and indicate if changes were made.The images or other third party material in this article are included in the article’s Creative Commons licence,unless indicated otherwise in a credit line to the material.If material is not included in the article’s Creative Commons licence and your intended use is not permitted by statutory regulation or exceeds the permitted use,you will need to obtain permission directly from the copyright holder.To view a copy of this licence,visit http://creativecommons.org/licenses/by/4.0/.
 Journal of Forestry Research2024年1期
- Journal of Forestry Research的其它文章
- New indices to balance α-diversity against tree size inequality
- Climate-growth relationships of Pinus tabuliformis along an altitudinal gradient on Baiyunshan Mountain,Central China
- Nitrogen mineralization in the oldest climax communities in the eastern Mediterranean region
- Physiological and psychological responses to tended plant communities with varying color characteristics
- Impact of cattle density on the structure and natural regeneration of a turkey oak stand on an agrosilvopastoral farm in central Italy
- Peat properties of a tropical forest reserve adjacent to a fire-break canal