
Effects of the combined application of organic and chemical nitrogen fertilizer on soil aggregate carbon and nitrogen: A 30-year study
2023-11-18 09:34:24BAlJinshunZHANGShuiqingHUANGShaominXUXinpengZHAOShichengQlUShaojunHEPingZHOUWei
Journal of Integrative Agriculture 2023年11期
BAl Jin-shun, ZHANG Shui-qing, HUANG Shao-min, XU Xin-peng, ZHAO Shi-cheng, QlU Shao-jun#, HE Ping, ZHOU Wei
1 State Key Laboratory of Efficient Utilization of Arid and Semi-arid Arable Land in Northern China, Institute of Agricultural Resources and Regional Planning, Chinese Academy of Agricultural Sciences, Beijing 100081, P.R.China
2 Key Laboratory of Plant Nutrition and Fertilizers, Ministry of Agriculture and Rural Affairs/Institute of Agricultural Resources and Regional Planning, Chinese Academy of Agricultural Sciences, Beijing 100081, P.R.China
3 Institute of Plant Nutrition and Resource Environment, Henan Academy of Agricultural Sciences, Zhengzhou 450002, P.R.China
Abstract To understand the long-term effects of combined organic and chemical nitrogen fertilization on soil organic C (SOC)and total N (TN), we conducted a 30-year field experiment with a wheat–maize rotation system on the Huang-Huai-Hai Plain during 1990–2019.The experimental treatments consisted of five fertilizer regimes: no fertilizer (control),chemical fertilizer only (NPK), chemical fertilizer with straw (NPKS), chemical fertilizer with manure (NPKM), and 1.5 times the rate of NPKM (1.5NPKM).The NPK, NPKS, and NPKM treatments had equal N inputs.The crop yields were measured over the whole experimental duration.Soil samples were collected from the topsoil (0–10 and 10–20 cm) and subsoil (20–40 cm) layers for assessing soil aggregates and taking SOC and TN measurements.Compared with the NPK treatment, the SOC and TN contents increased significantly in both the topsoil (24.1–44.4%for SOC and 22.8–47.7% for TN) and subsoil layers (22.0–47.9% for SOC and 19.8–41.8% for TN) for the organically amended treatments (NPKS, NPKM and 1.5NPKM) after 30 years, while no significant differences were found for the average annual crop yields over the 30 years of the experiment.The 0–10 cm layer of the NPKS treatment and the 20–40 cm layer of the NPKM treatment had significantly higher macroaggregate fraction mass proportions (19.8 and 27.0%) than the NPK treatment.However, the 0–10 and 20–40 cm layers of the 1.5NPKM treatment had significantly lower macroaggregate fraction mass proportions (–19.2 and –29.1%) than the control.The analysis showed that the higher SOC and TN in the soil of organically amended treatments compared to the NPK treatment were related to the increases in SOC and TN protected in the stable fractions (i.e., free microaggregates and microaggregates within macroaggregates), in which the contributions of the stable fractions were 81.1–91.7% of the increase in SOC and 83.3–94.0% of the increase in TN, respectively.The relationships between average C inputs and both stable SOC and TN stocks were significantly positive with R2 values of 0.74 and 0.72 (P<0.01) for the whole 40 cm soil profile,which indicates the importance of N for soil C storage.The results of our study provide key evidence that long-term combined organic and chemical nitrogen fertilization, while maintaining reasonable total N inputs, benefited soil C and N storage in both the topsoil and subsoil layers.
Keywords: soil aggregate fractions, soil organic matter, manure application, straw return, C:N ratio
1.lntroduction
Increasing carbon (C) and nitrogen (N) in soil can not only improve soil fertility and crop production but it may also mitigate land degradation and global atmospheric greenhouse gas emissions (e.g., CO2and N2O) (Paustianet al.2016; Wiesmeieret al.2019).However, changes in soil C and N stocks in agricultural systems are difficult to observe in short-term experiments because of the nature and dynamics of soil C and N accumulations (Tripathiet al.2014; Qiuet al.2016).Therefore, long-term agricultural experiments can more effectively investigate how management practices, such as fertilizer application,affect soil C and N stocks as well as the underlying mechanisms.
The direction and magnitude of soil C and N changes depend on a balance between the C and N inputs and outputs (Braret al.2013; Zhaoet al.2018).Fertilization can influence both sides of this balance, and the net effects of fertilization on soil C and N should consider fertilization strategies and soil characteristics (Yanet al.2012; Qiuet al.2016).For example, the effects of chemical fertilizer application on soil C and N are being debated (Robertsonet al.2013), and the reported effects of straw return on soil C and N have been both positive and negative (Soon and Lupwayi 2012; Liuet al.2014).Although manure application has always positively affected soil C and N (Liuet al.2020), the C and N saturation concepts suggest that the soil capacity for storing soil organic matter (SOM) is limited(Castellanoet al.2012).In addition, while many longterm experiments have shown the effects of fertilization on SOM levels (Heet al.2015; Xieet al.2015; Berhaneet al.2020), most have focused only on the topsoil (0–10 or 0–20 cm).The long-term effects of various fertilization regimes on subsoil SOC and TN remain unclear.
Soil aggregates are basic soil structural units in which SOM accumulates and decomposes, and where nutrient translocation and transformation occur (Six and Paustian 2014).According to the classical classification method of soil aggregate size and density, SOM is divided into labile and stable components with different turnover rates and functional characteristics (Sixet al.1998; Castellanoet al.2015).The labile fractions (i.e., coarse particulate organic matter (cPOM) and free particulate organic matter(fPOM)) are not physico-chemically protected (Brownet al.2014), but the stable fractions (i.e., free silt and clay (free-SC), fine intra-aggregate particulate organic matter (fiPOM), interaggregate silt and clay (inter-SC),and intra-aggregate silt and clay (intra-SC)) are relatively resistant to mineralization because they are protected by mineral-association and microaggregation (Lützowet al.2008).Although soil aggregate fractions have different sensitivities to fertilization (Tonget al.2014), the responses of these SOM fractions to various long-term fertilization practices and their relationships with the soil C and N storage and stabilization are still not well known.
Compared to chemical fertilization, organic amendment practices (e.g., crop residue and manures) are generally believed to enhance soil aggregation (Angerset al.1997;Panet al.2015), and their effects on the soil organic carbon (SOC) content of soil aggregates are related to the types of organic amendments (Maillard and Angers 2014).For example, the application of residues improves the SOC by facilitating the labile aggregate fractions,whereas manure application is likely to increase SOC in the stable fractions (Samsonet al.2020).However, there is little information about soil N at the aggregate scale(Yanet al.2012), and aggregate-level C and N have always been studied separately, even though soil C and N dynamics are interlinked (Guenetet al.2020).A better understanding of the interactions between the C and N sequestration under different fertilization practices is critically needed.
The Huang-Huai-Hai (HHH) Plain has produced nearly 33 and 61% of total maize and wheat output in China,respectively (Cuiet al.2008), and winter wheat rotated with summer maize has been that region’s dominant cropping system for many years.The conventional fertilization practices in the HHH Plain have caused serious environmental problems that endanger sustainable crop production (Zhanget al.2019).This area is rich in organic resources such as straw and livestock manure(Songet al.2018a, b), but it has a low recycling rate (Daiet al.2019) even though relevant studies have shown that combined applications of organic materials and chemical fertilizers effectively maintain and improve soil fertility(Wanget al.2013).Since 2015, government policies aimed at increasing chemical fertilizer efficiency while reducing its use have vigorously promoted the recycling of organics to enable sustainable crop production.However,their long-term effects on soil aggregate-level C and N dynamics are still not clear.Such information would enable researchers to prioritize management strategies that sequester the soil C and N.
To examine those long-term effects in the soil of the HHH Plain, we used a long-term winter wheat–summer maize rotation field experiment in which individual plots received different fertilizer substitution practices annually for 30 years.We then evaluated the effects of crop straw and organic manure inputs as chemical N replacements on the crop yields, as well as SOC and total nitrogen (TN)in the topsoil and subsoil layers.We also investigated the SOC and TN dynamics by quantifying different physicochemically protected and unprotected soil aggregate fractions, and we analyzed the coupling relationships between SOC and TN at the bulk and aggregate levels.Our hypotheses are: 1) Long-term organically amended practices will improve SOC and TN contents in both the topsoil and subsoil layers compared with chemical fertilizer application only; and 2) the stabilization of SOC and TN will be improved by increases in the SOM in stable fractions after long-term use of organic amendments.
2.Materials and methods
2.1.Site description
The long-term experiment (35°00′57′′N, 113°42′11′′E)in this study was conducted at an elevation of 59 m with flat topography, and was established in the HHH Plain in 1990 at the Zhengzhou Experimental Station of Henan Academy of Agricultural Sciences, China.The cropping system was the rotation of winter wheat (October to June) with summer maize (June to October).The soil is Calcaric Cambisol (FAO classification system).The region has a temperate continental monsoon climate with a 15.6°C annual mean temperature and 542 mm annual mean precipitation.At the beginning of the experiment,the basic chemical properties of the 0–20 cm soil layer were: pH 8.3 (1:1, soil:water ratio), 6.67 g kg–1SOC,0.67 g kg–1TN, 6.5 mg kg–1available phosphorus, and 74.0 mg kg–1exchangeable potassium (Xuet al.2006).
2.2.Experimental design
The field experiment used a completely randomized block design of five treatments with three replicates:(1) no fertilizer (control, CK), (2) chemical fertilizer only(NPK), (3) chemical fertilizer with straw (NPKS), (4)chemical fertilizer with manure (NPKM), and (5) 1.5 times the application rate of NPKM (1.5NPKM).Each of the 15 plots was 43 m2in size.The total N (chemical plus organic N) and the P2O5and K2O from chemical fertilizers for the NPK, NPKS, and NPKM treatments were applied at the following rates per rotational season:353.0, 176.50 and 176.50 kg ha–1, respectively (Table 1).All the crop straw was removed from the experimental plots except for those in the NPKS treatment, which had all maize straw incorporated into the soil.In the NPKM and 1.5NPKM treatments, the N rates from cattle manure(31.03% C, 2.51% N) were 115.50 and 173.25 kg ha–1,respectively.During the wheat season, the chemical N application as urea (46% N) was split at a 6:4 ratio of basal and topdressing N.The chemical fertilizers for P2O5as triple superphosphate (12.5% P2O5) and K2O as potassium sulphate (50% K2O) were incorporated into the soil along with the manure and maize straw before winter wheat planting.During the maize season, the chemical N application as urea (46% N) was split with a 5:5 ratio of topdressing N at V3 and V10 stages, respectively.The chemical fertilizers for P2O5as triple superphosphate(12.5% P2O5) and K2O as potassium sulphate (50% K2O),along with the first topdressing N, were banded into the soil at the V3 stage.All the management practices otherthan fertilization were the same for all plots.The selected physicochemical properties of the 0–10, 10–20, and 20–40 cm soil layers under different fertilizer treatments for soil sampled in 2019 are given in Table 2.
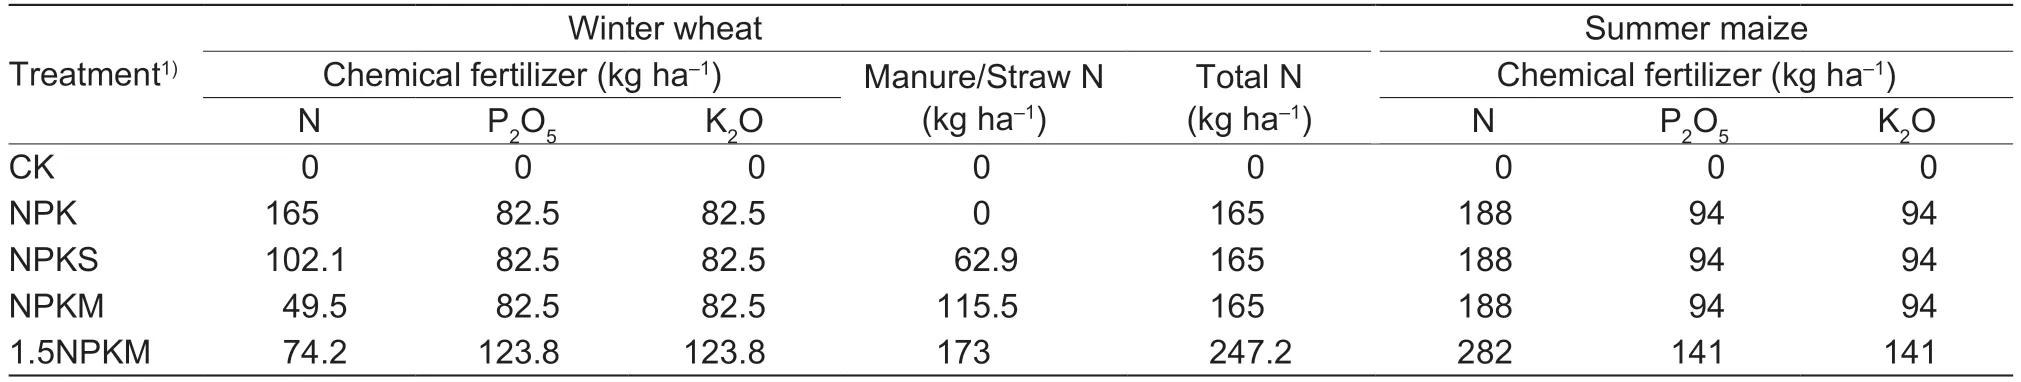
Table 1 Annual inputs of N, P2O5 and K2O under different fertilization treatments in the long-term experiment (1990–2019)
2.3.Soil sampling and preparation
At the 2019 harvest on October 7, intact soil samples were collected from the 0–10, 10–20, and 20–40 cm soil layers of each plot by the ring method to determine the soil bulk densities.Additionally, composite soil samples were taken from the 0–10, 10–20, and 20–40 cm soil layers, and each composite soil sample was made by homogenizing the three soil cores taken from each soil layer in each plot.A total of 45 bulk soil samples(15 plots×3 layers) were immediately passed through a 5 mm sieve and then air-dried to fractionate the soil aggregates and perform further chemical analyses.
2.4.Soil aggregate fractionation
Soil aggregate fractionation according to size and density was performed using wet sieves and heavy liquid following the procedures of Brownet al.(2014),Elliott (1986) and Sixet al.(2000).Three water-stable aggregates (i.e., macroaggregate (M, >250 mm), free microaggregate (free-m, 250–53 mm), and free-SC(<53 mm)) were isolated using the wet sieving method(Elliott 1986).Briefly, an 80.0 g air-dried soil sample was placed on a 250 mm sieve, which was then submerged in deionized water for 5 min, and then the water-stable aggregates were separated by moving the 250 and 53 mm sieves up-and-down over a 3-cm distance for 50 times within 2 min.
According to Sixet al.(2000), the macroaggregate was further fractionated.Briefly, the ≤15.0 g macroaggregate sample was slaked for 15 min, and then the slaked sample was transferred to a 250 mm mesh screen.Fifty glass beads (4 mm in diameter) were added, and then the sieve was shaken in running water.When the water became clear, the <250 mm soil slurry was passed through a 53 mm sieve.Thus, three aggregate fractions were isolated: cPOM+sand, microaggregates within macroaggregates (interm-m), and inter-SC.
The interm-m fraction was composed of three parts:fPOM, fiPOM, and intra-SC (Brownet al.2014).The fPOM was then isolated from the interm-m by using sodium polytungstate (density=1.85 g cm–3) at a ratio of 1:3 (soil:liquid, w/v).The soil particle/sodium polytungstate fractionation was then washed 7–10 times with deionized water on a 20 mm mesh using a vacuum filtration device and the resulting washed particles were fPOM.Then the interm-m sample was dispersed for 12 h using sodium hexametaphosphate (0.5%) with a soil:liquid (w/v) ratio of 1:3, and then passed through a 53 mm sieve.The resulting fractions greater than and less than 53 mm were composed of fiPOM+sand and intra-SC particles, respectively.
Once again following Brownet al.(2014), the sand was removed from the cPOM+sand and fiPOM+sand by using the same procedure that was used for fPOM isolation,except that the sodium polytungstate was at a density of 2.3 g cm–3.
2.5.Soil testing
After the bulk and fractionated soil samples were ovendried at 60°C, passed through a 0.15 mm sieve, and treated with 0.5 mol L–1HCl to remove soil carbonates,the SOC and TN concentrations of the resulting samples were analyzed with a Vario MACRO cube organic elemental analyzer (Elementar, Hanau, Germany).
2.6.Calculations
Carbon input Total C input for each treatment was calculated as the sum of crop residue C (RCI) with or without straw C inputs (SCI) or manure C inputs (MCI),where the crop residues included crop stubble and roots.
The C inputs of maize and wheat residues were calculated as:
RCImaize=[(Ygrain/HI)×(26%/74%)×93%+(Ystraw×Rs)]×(100%–14%)×0.444 (1)
RCIwheat=[(Ygrain/HI)×(30%/70%)×85%+(Ystraw×Rs)]×(100%–14%)×0.399 (2)
where 26%/74% and 30%/70% are the above- and below-ground C allocation ratios for maize and wheat,respectively (Liet al.1994); 93% and 85% are the percentages of root biomass in the 0–40 cm soil layer for maize and wheat, respectively (Penget al.2012;Taghizadeh-Toosi 2014); and Rs is the percentage of post-harvest crop stubble in the total straw biomass.According to the measured results, Rs was 3% for maize,18.3% in CK, and 13.1% in the other treatments for wheat;while 14% was the average moisture content of crop samples; and 0.444 and 0.399 g g–1were the C contents in the maize and wheat dry samples, respectively.
The SCI were calculated as:
SCI=Ystraw×(100%–Rs)×(100%–14%)×0.444 (3)where SCI is the mean straw C input for maize only in the NPKS treatment, and 0.444 g g-1was the C content in maize obtained from eq.(1).
The MCI were calculated as:
MCI=MNI/0.0251×0.3103 (4)
where MNI is the total manure N input, with values of 115.50 and 173.25 kg ha–1in the NPKM and 1.5NPKM treatments, respectively, and 0.0251 and 0.3103 g g-1were the measured N and C contents in the manure,respectively.
SOC and TN contents and stocks The SOC and TN contents of soil aggregate fractions were calculated as:
where CONTCNis the SOC or TN content of different soil aggregate fractions as the percentage of the bulk soil (g kg–1bulk soil), CONCCNis the concentration of different soil aggregate fractions (g kg–1soil fractions), and Mprois the mass proportions of soil aggregate fractions of the bulk soil (% bulk soil).
The SOC and TN stocks in the bulk soil and the physical fractions were calculated as:
where SCNis the SOC or TN stocks, CONTCNis the SOC or TN content of bulk soil or different soil aggregate fractions as the percentage of the bulk soil (g kg–1bulk soil) from eq.(5), BD is soil bulk density (g cm–3) in the measured soil layers, and L is the measured soil layers(cm).
2.7.Data analyses
All statistical analyses were performed in SPSS 16.0 for Windows.The significant differences in water-stable aggregate mass proportions, fiPOM:cPOM ratios, and the SOC or TN measurements and C:N in the bulk soil and the physical fractions among the experimental treatments were analyzed by one-way analysis of variance (ANOVA)with least significant difference tests atP<0.05.Linear regression was used to establish the relationships between C inputs and the C or N stocks and the C:N ratio in the soil fractions.
3.Results
3.1.Crop yield
Compared with CK, the fertilized treatments had significantly (P<0.05) higher yields of wheat and maize(Table 3).The highest crop yields were achieved consistently in the 1.5NPKM treatment during the 30-year period.There were no significant differences in the NPK,NPKS and NPKM treatments for the average 30-year grain yields.
3.2.SOC and TN in the bulk soil
Compared to CK, the SOC for every fertilization treatment in every soil layer, except for NPK treatment in the 20–40 cm layer, increased significantly by 15.5–70.6%(P<0.05) (Fig.1-A).The SOC of the organically amended treatments increased significantly by 22.0–47.9% (P<0.05)compared to the SOC increases of NPK treatment in every measured soil layer.Compared with NPKS, the SOC values were significantly greater (P<0.05) in the 0–10 cm soil layer for NPKM and in the 10–20 and 20–40 cm soil layers for the 1.5NPKM treatment.However, the SOC contents of the NPKM and 1.5NPKM treatments in each soil layer, except for the 10–20 cm layer, were not significantly different from one another.TN mirrored theSOC trend across the 0–40 cm soil profile, except that the manure treatments showed significantly higher TN than the NPKS treatment in each soil layer (Fig.1-B).Relative to CK, fertilization practices significantly(P<0.05) reduced the soil organic C:N ratio by 9.8–12.3%in the 0–10 cm soil layer, and the order of significant differences for the different fertilization practices was CK>NPK=NPKS=1.5NPKM>NPKM (Fig.1-C).
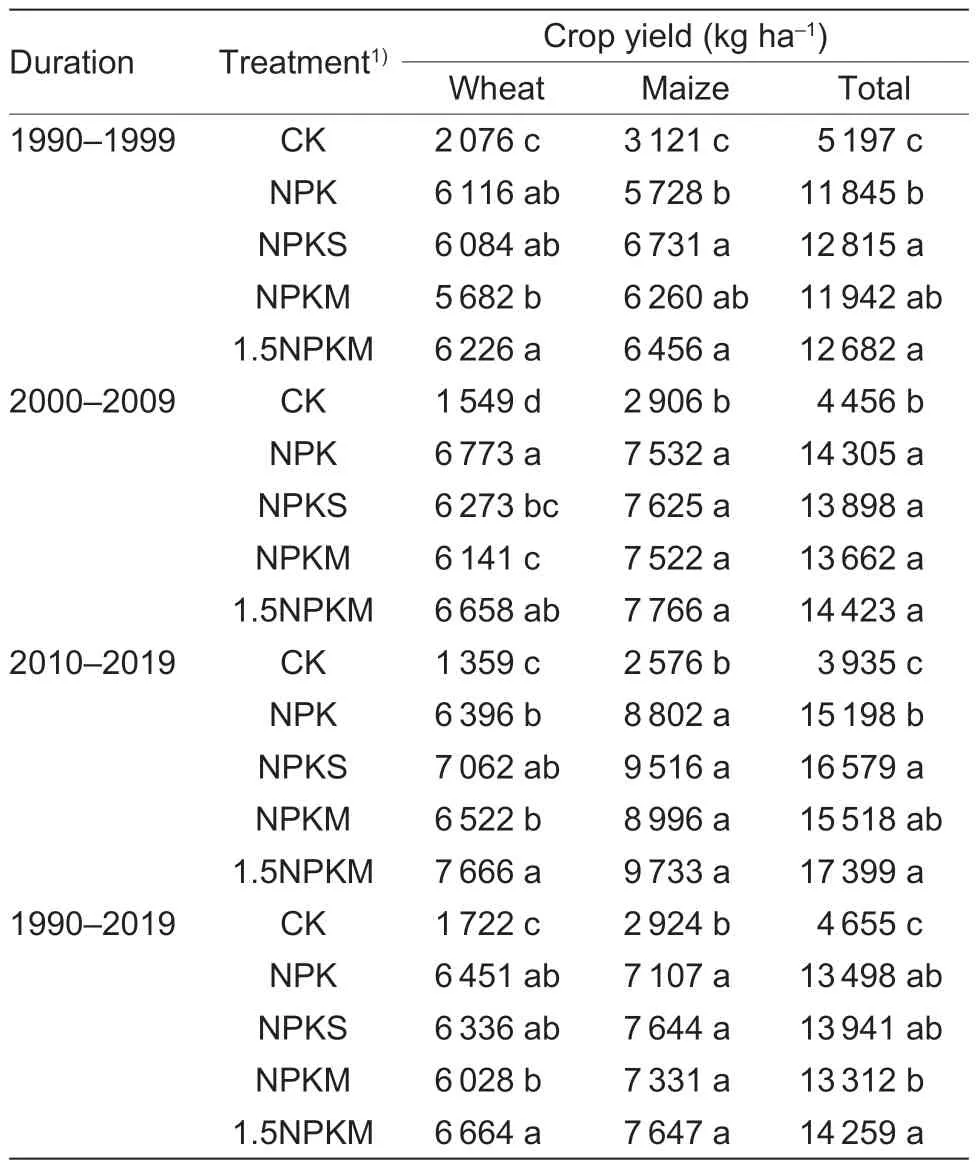
Table 3 Crop yields under different fertilization treatments during the 30-year experimental period
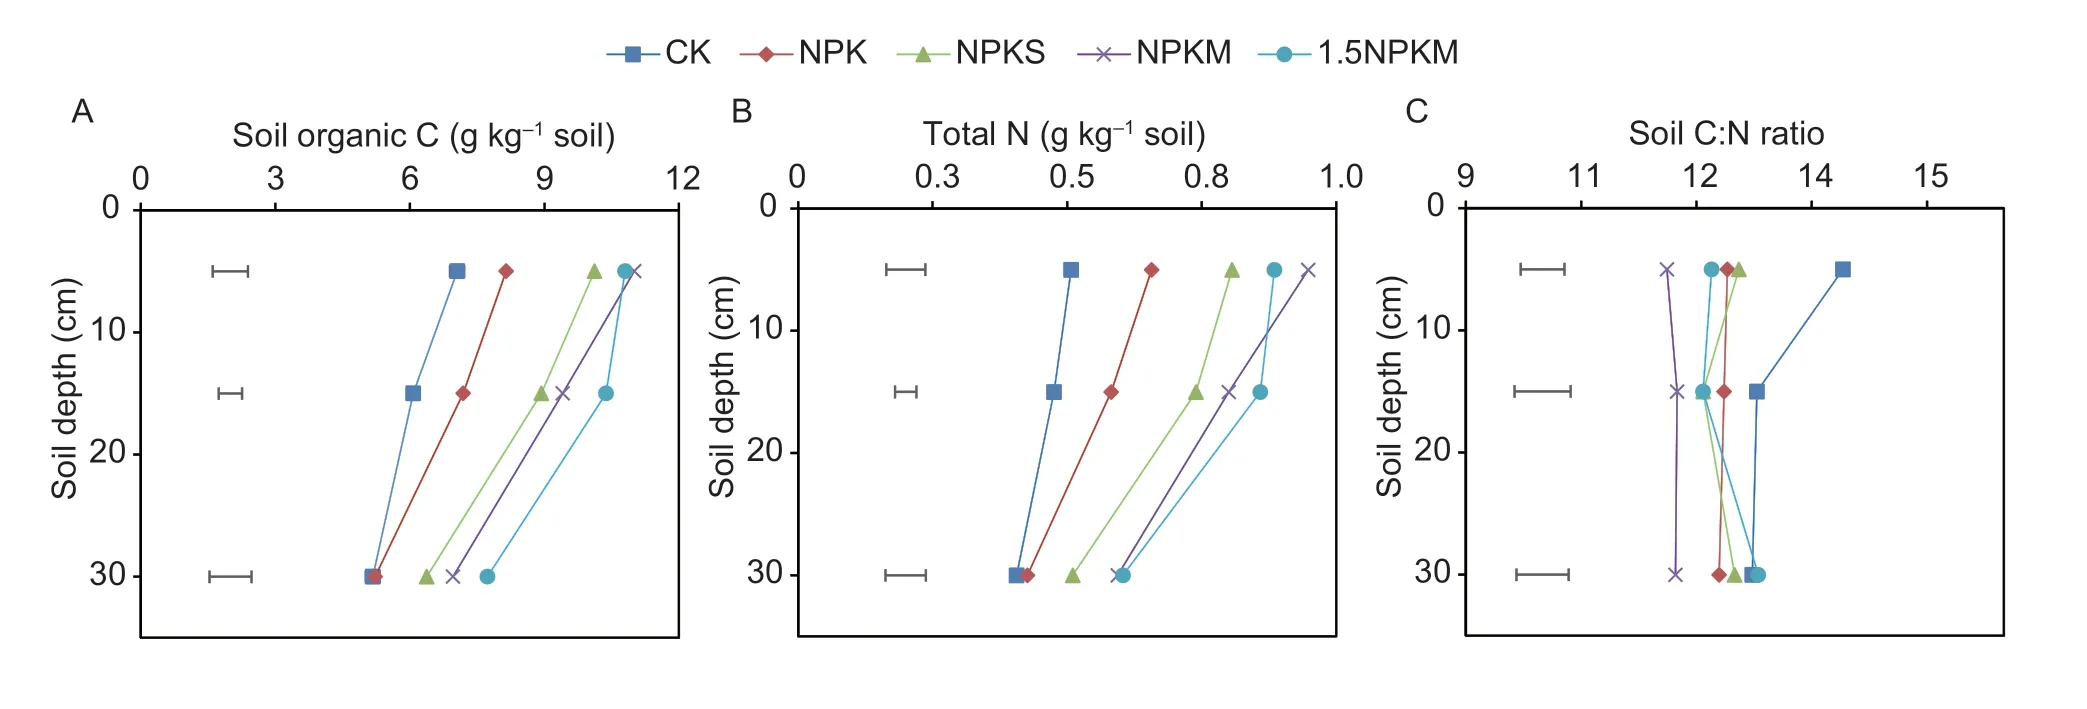
Fig.1 The soil organic C (A) and total N (B) contents and C:N ratios (C) in the 0–10, 10–20, and 20–40 cm soil layers under different fertilization treatments.CK, control, no fertilizer; NPK, chemical fertilizer only; NPKS, chemical fertilizer with straw; NPKM,chemical fertilizer with manure; 1.5NPKM, 1.5 times the application rate of NPKM.Data are the means (n=3).The horizontal lines represent LSD0.05 values.
3.3.Distribution of soil water-stable aggregates
Compared with the CK, significantly (P<0.05) lower M fraction proportions were found in the 20–40 cm layer for NPK and NPKS, and in the 0–10 and 20–40 cm soil layers for 1.5NPKM (Table 4).However, there were no significant differences between the NPKM and CK across the 0–40 cm soil profile.Additionally, compared with the CK, fertilization significantly (P<0.05) increased the mass proportion of free-m except for NPKS and NPKM in the 0–10 cm layer, and it significantly (P<0.05)reduced that of free-SC, except for the NPKS, in the 20–40 cm layer.
3.4.SOC and TN in the aggregate fractions
SOC and TN in the water-stable aggregate fractions Compared with the CK, organic amendments significantly (P<0.05) increased the SOC by 19.7–113.0%in both the M and free-m fractions in every soil layer,except in the M fraction of the 20–40 cm layers of the NPKS and 1.5NPKM treatments (Fig.2-A and B).In addition, the NPK treatment significantly (P<0.05)increased the SOC contents by 59.6 and 48.5% in the free-m fractions of the 0–10 and 10–20 cm soil layers, respectively (Fig.2-B).Except for the 1.5NPKM treatment, fertilization practices led to significantly lower SOC contents by 28.5–48.2% in the free-SC fractions of the 20–40 cm soil layer relative to that layer in CK(Fig.2-C).Similar trends were observed for the TN andSOC contents in the water aggregates for every treatment in every soil layer (Fig.2-D–F).However, the C:N ratio of the M fraction was significantly lower (P<0.05) in the 0–10 cm soil layer for NPK and in the 0–10 and 10–20 cm soil layers for the organic amendment treatments compared with the CK (Fig.2-G).
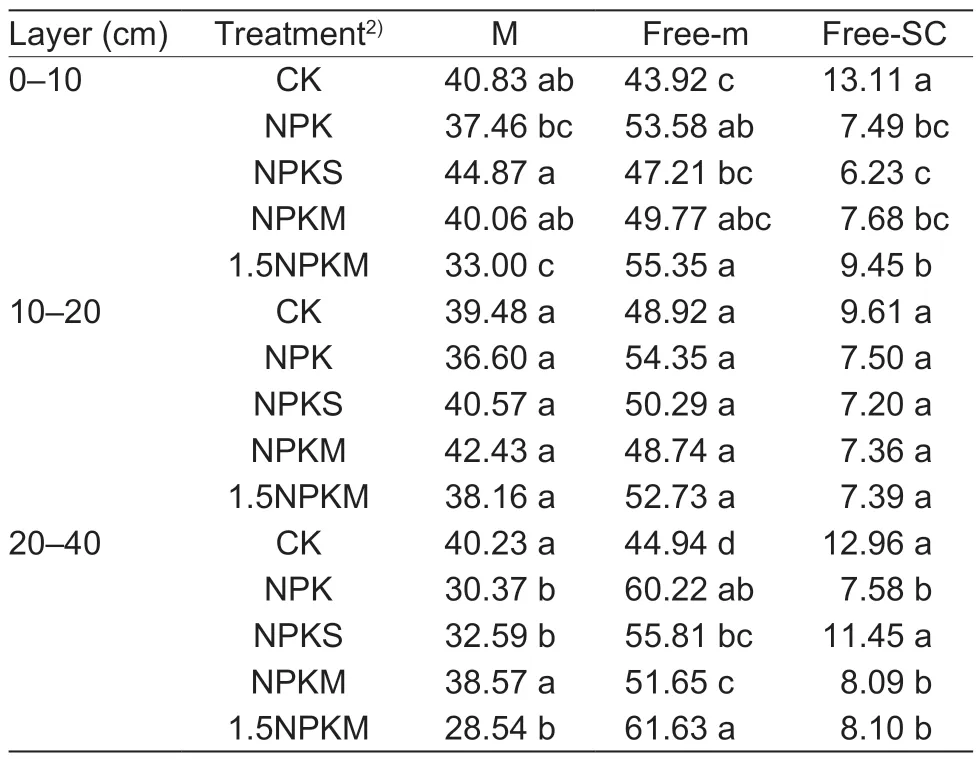
Table 4 The mass proportions of soil water-stable aggregate fractions in the 0–10, 10–20, and 20–40 cm soil layers under different fertilization treatments1)
SOC and TN within the M fraction The interm-m fraction of the 0–10 cm soil layer (Fig.3-B) of the NPK treatment had a significantly higher SOC content by 61.9% than in CK.However, the organically amended treatments had significantly higher differences by 45.9–152.1% than CK in the interm-m in every soil layer.The SOC content in the NPK treatment’s inter-SC fraction was significantly lower than that of the same fraction in CK (Fig.3-C).
In the cPOM fractions (Fig.3-D), the TN contents in the manure-amended treatments (i.e., NPKM and 1.5NPKM) in the 0–10 and 10–20 cm layers, and in the 20–40 cm soil layer of the NPKM treatment, increased significantly compared to those of CK.The TN contents of the interm-m (Fig.3-E) and inter-SC (Fig.3-F) fractions followed similar trends to those of the SOC contents in every soil layer of all treatments.
The cPOM fraction C:N ratios in the 0–10 cm soil layers in the NPKS and NPKM treatments were significantly(P<0.05) lower than in CK (Fig.3-G), and they were significantly lower in the NPKM than in the NPKS treatment in that soil layer.However, the cPOM fraction C:N ratios of the 1.5NPKM treatment were significantly (P<0.05) lower than those of CK in every soil layer.The C:N ratios of both the interm-m (Fig.3-H) and inter-SC fractions (Fig.3-I)of the 1.5NPKM treatment in the 0–10 cm soil layer were significantly (P<0.05) lower than those of CK.
SOC and TN within interm-m fractions Compared to CK, the NPKS treatment displayed a significantly greater influence on the SOC content for the fPOM fraction in the 0–10 cm soil layer (Fig.4-A).The fiPOM fractions in the 0–10 cm layers of NPK and NPKS had significantly higher SOC contents than those of the CK (Fig.4-B), but the SOC contents of the manure amended treatments(i.e., NPKM, and 1.5NPKM) were significantly higher than those of the CK in the 0–20 cm soil layers.Compared to CK (Fig.4-C), all fertilization practices significantly increased the C contents in the intra-SC fractions in all soil layers, except in the 10–20 cm layer of the NPK treatment.Furthermore, the NPKM and NPKS treatments showed significantly higher C contents in the intra-SC fraction than the NPK treatment in every soil layer, except in the 20–40 cm layer of the NPKS treatment.
Generally, the TN contents in the fPOM (Fig.4-D),fiPOM (Fig.4-E), and intra-SC fractions (Fig.4-F) followed similar trends to the SOC contents for each treatment in every soil layer.Compared to CK, the fertilization practices significantly increased the C:N ratios of the fPOM fractions in the 10–20 and 20–40 cm soil layers (Fig.4-G),but reduced them in the fiPOM fractions in every soil layer except for the 20–40 cm soil layer of the NPKS treatment(Fig.4-H).The C:N ratios of the intra-SC fractions of the NPKS and NPKM treatments were significantly lower than those of CK, but only in the 0–10 cm soil layer (Fig.4-I).SOC and TN in labile and stable fractions Compared with CK, the fertilization practices affected the SOC of the labile fractions less significantly in every soil layer,except for that of the 1.5NPKM treatment in the 20–40 cm soil layer (Fig.5-A).However, the NPKM and 1.5NPKM treatments showed significantly increased labile TN by 8.6–44.0% in each soil layer, except for the 20–40 cm layer of the NPKM treatment (Fig.5-B).Compared with the CK (Fig.5-C), the fertilization practices significantly reduced the C:N ratio of labile fractions in the 0–10 cm soil layer, with a significantly decreasing sequence of CK>NPK>NPKS>NPKM=1.5NPKM, and in the 10–20 cm layer only for the 1.5NPKM treatment.

Fig.2 The soil organic C (A, B and C) and total N (D, E and F) contents and C:N ratios (G, H and I) for the macroaggregate(M), free microaggregate (free-m), and free silt and clay (free-SC) fractions in the 0–10, 10–20, and 20–40 cm soil layers under different fertilization treatments.CK, control, no fertilizer; NPK, chemical fertilizer only; NPKS, chemical fertilizer with straw; NPKM,chemical fertilizer with manure; 1.5NPKM, 1.5 times the application rate of NPKM.Data are the means (n=3).The horizontal lines represent LSD0.05 values.
In contrast to the labile fraction, the fertilization practices significantly increased the stable SOC by 20.0–71.3%in every soil layer, compared to those of CK, except for NPK in the 20–40 cm soil layer (Fig.5-D).The organically amended treatments showed significantly higher stable SOC by 21.5–45.7% than the NPK treatment, except for NPKS in the 20–40 cm soil layer.The 1.5NPKM treatment had significantly higher stable SOC by 17.5–21.8% than the NPKS treatment in each soil layer below 10 cm.As with stable SOC, every soil layer of the fertilized treatments had significantly higher stable TN by 21.9–84.0%compared to CK, except for the NPK treatment in the 20–40 cm soil layer (Fig.5-E).In every soil layer, the stable TN in the organically amended treatments increased significantly by 21.6–44.2% compared to those of the NPK treatment.Compared with the NPKS treatment,the stable TN in the NPKM treatment was 17.3% higher in the 0–10 cm layer and 13.3% higher in 10–20 cm soil layer, and the 1.5NPKM treatment had significantly higher stable TN in every soil layer (with increases of 10.9–17.0%).Significant differences among the stable fraction C:N ratios of the fertilization treatments occurred only in the 0–10 cm layer, with a significant sequence of CK>NPK=NPKS=1.5NPKM>NPKM (Fig.5-F).
3.5.Soil macroaggregate turnovers
Compared to CK, the fiPOM:cPOM ratio for M in the 0–10 and 10–20 cm soil layers increased significantly with fertilization, except for the 10–20 cm soil layer of the NPKS treatment (Fig.6).However, except for the 20–40 cm soil layer of the 1.5NPKM treatment, there were no significant differences among the fiPOM:cPOM ratios of the different fertilization practices.
3.6.Annual C inputs and C and N stocks in soil aggregates
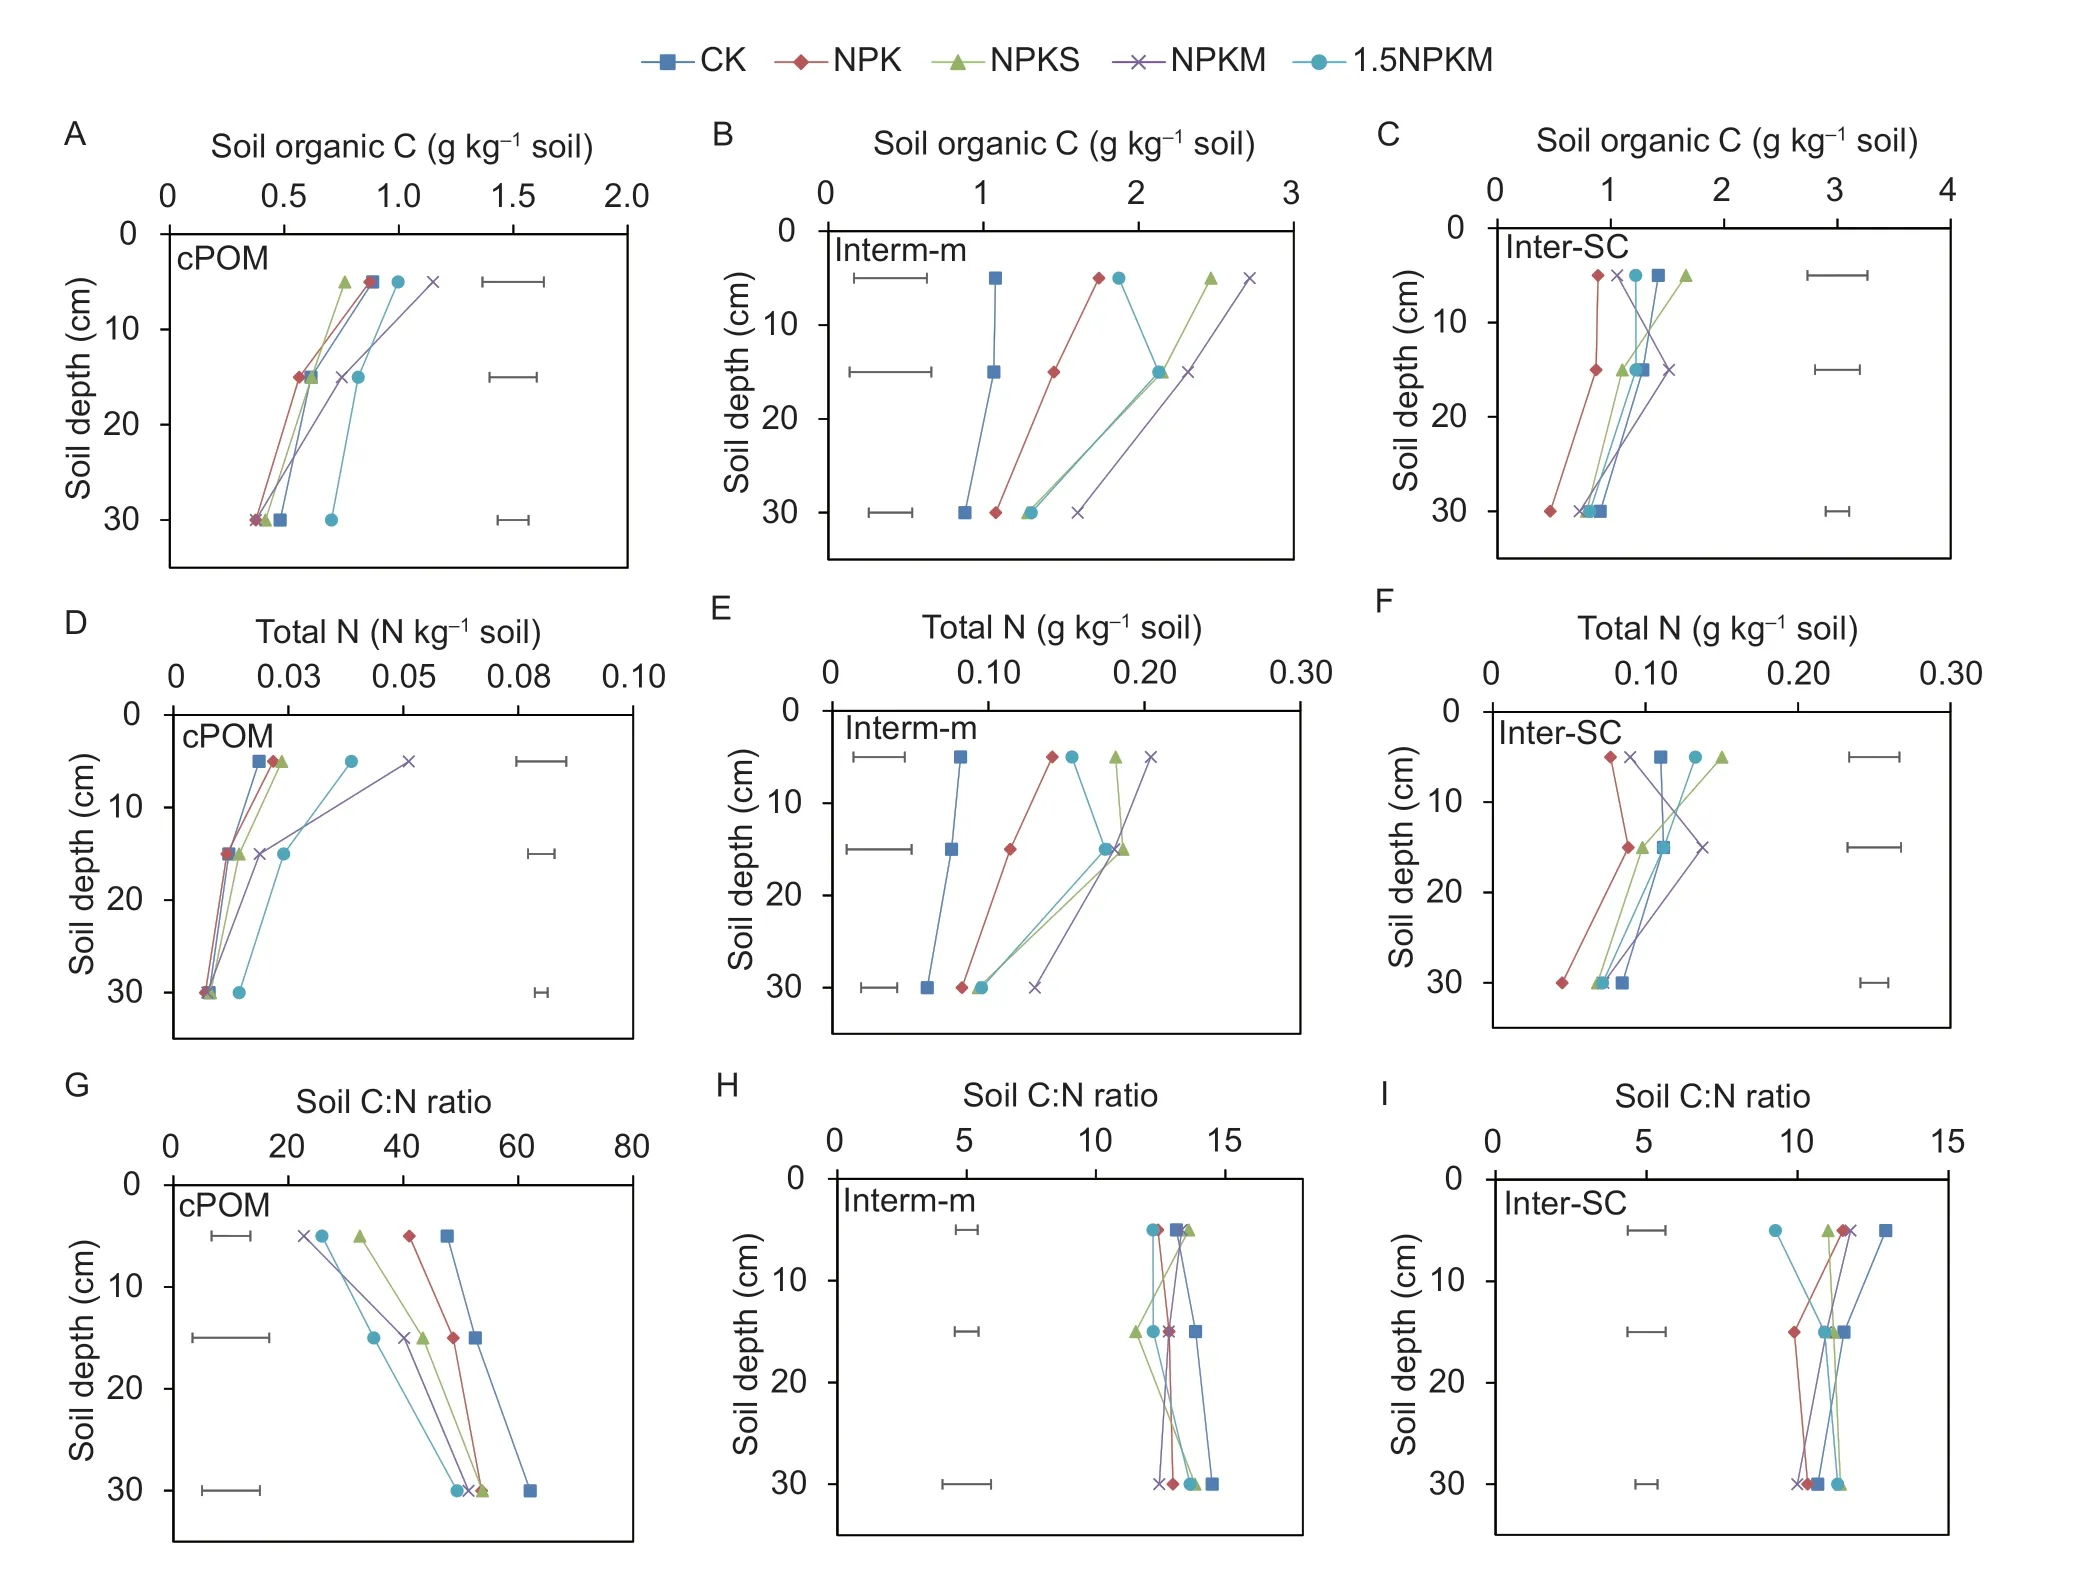
Fig.3 The soil organic C (A, B and C) and total N (D, E and F) contents and C:N ratios (G, H and I) for the coarse particulate organic matter (cPOM), microaggregates within macroaggregates (interm-m) and inter silt and clay (inter-SC) fractions in the 0–10,10–20, and 20–40 cm soil layers under different fertilization treatments.CK, control, no fertilizer; NPK, chemical fertilizer only;NPKS, chemical fertilizer with straw; NPKM, chemical fertilizer with manure; 1.5NPKM, 1.5 times the application rate of NPKM.Data are the means (n=3).The horizontal lines represent LSD0.05 values.
Compared with CK, the fertilized treatments had significantly (P<0.05) greater C inputs from wheat and maize residues (Table 5).The organically amended treatments (NPKS, NPKM, and 1.5NPKM) received 1 428 to 2 947 kg C ha–1yr–1from manure or straw.The total C inputs for the experimental treatments ranged from 1 374 to 7 041 kg ha–1yr–1, with an increasing order of NPKS>1.5NPKM>NPKM>NPK>CK.
The contributions from the C and N stocks of the stable soil fraction to the SOC and TN stocks in the bulk soil in the 0–40 cm soil profile ranged from 88.1 to 91.9% and from 94.4 to 95.6%, respectively (Table 6).Compared with CK, the fertilized treatments had significantly (P<0.05)higher C stocks of the free-m (increases of 20.5–33.6%)and intra-SC fraction (increases of 43.1–61.0%), except for the free-m fraction of the NPKS treatment and the intra-SC fraction of the 1.5NPKM treatment.The contributions from the C stock of the fiPOM fractions in the manure amended treatments (NPKM and 1.5NPKM) were significantly higher than those of the other treatments(CK, NPK and NPKS).Compared with CK, the fertilized treatments had significantly (P<0.05) higher N stocks in the free-m (increases of 13.3–25.8%), fiPOM (increases of 21.8–69.3%) and intra-SC fraction (increases of 37.1–48.6%), except for the fiPOM fraction of the NPKS treatment and the intra-SC fraction of the 1.5NPKM treatment.
The C and N stocks of the stable soil fraction and some of its fractions (free-m, fiPOM, and intra-SC) in the 0–40 cm soil profile increased simultaneously with increasing annual C inputs (Fig.7-A and B).However,the C and N stocks of the labile soil fraction and its fractions (cPOM and fPOM) did not change (Fig.7-D and E).Additionally, there were no significant changes in the C:N ratios of the stable, free-m and intra-SC fractions(Fig.7-C), while the C:N ratios of the fiPOM and labile fractions, except for fPOM, in the 0–40 cm soil profile declined significantly with increasing annual C inputs(Fig.7-C and F).
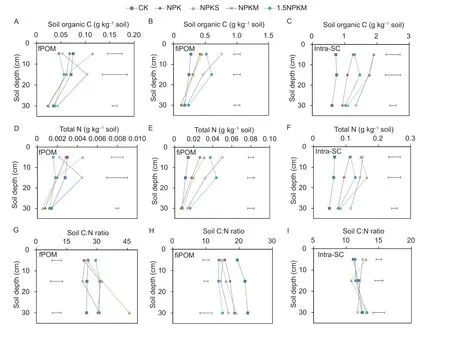
Fig.4 The soil organic C (A, B and C) and total N (D, E and F) contents and C:N ratios (G, H and I) for the fine particulate organic matter (fPOM), fine intra-aggregate POM (fiPOM), and intra silt and clay (intra-SC) fractions in the 0–10, 10–20, and 20–40 cm soil layers under different fertilization treatments.CK, control, no fertilizer; NPK, chemical fertilizer only; NPKS, chemical fertilizer with straw; NPKM, chemical fertilizer with manure; 1.5NPKM, 1.5 times the application rate of NPKM.Data are the means (n=3).The horizontal lines represent LSD0.05 values.
4.Discussion
4.1.lncreased SOC and TN in bulk soil under longterm fertilization
After 30 years of production, the SOC and TN contents in our fertilized plots improved significantly (15.5–70.6 and 22.4–87.0%, respectively) compared to the plots with no fertilizer in every soil layer, except for NPK in the 20–40 cm layer (Fig.1-A and B).Those results were consistent with several other long-term fertilization studies in agricultural systems (Heet al.2015; Xieet al.2015;Qiuet al.2016; Berhaneet al.2020).Generally, more exogenous C and N inputs can contribute to the higher SOC and TN contents directly (Liuet al.2014; Maillard and Angers 2014).In our study, significantly higher C and N inputs were received in the fertilized soil compared to the control (Tables 1 and 5).In addition, more residue C(i.e., root biomass) resulting from better crop growth also indirectly facilitated the SOM improvement (Guo Zet al.2019).This was shown by significantly higher crop yields(Table 3) and residue C input (Table 5) in the fertilized soils than the control.Therefore, long-term fertilization is beneficial for the improvement of SOC and TN in our tested soil.
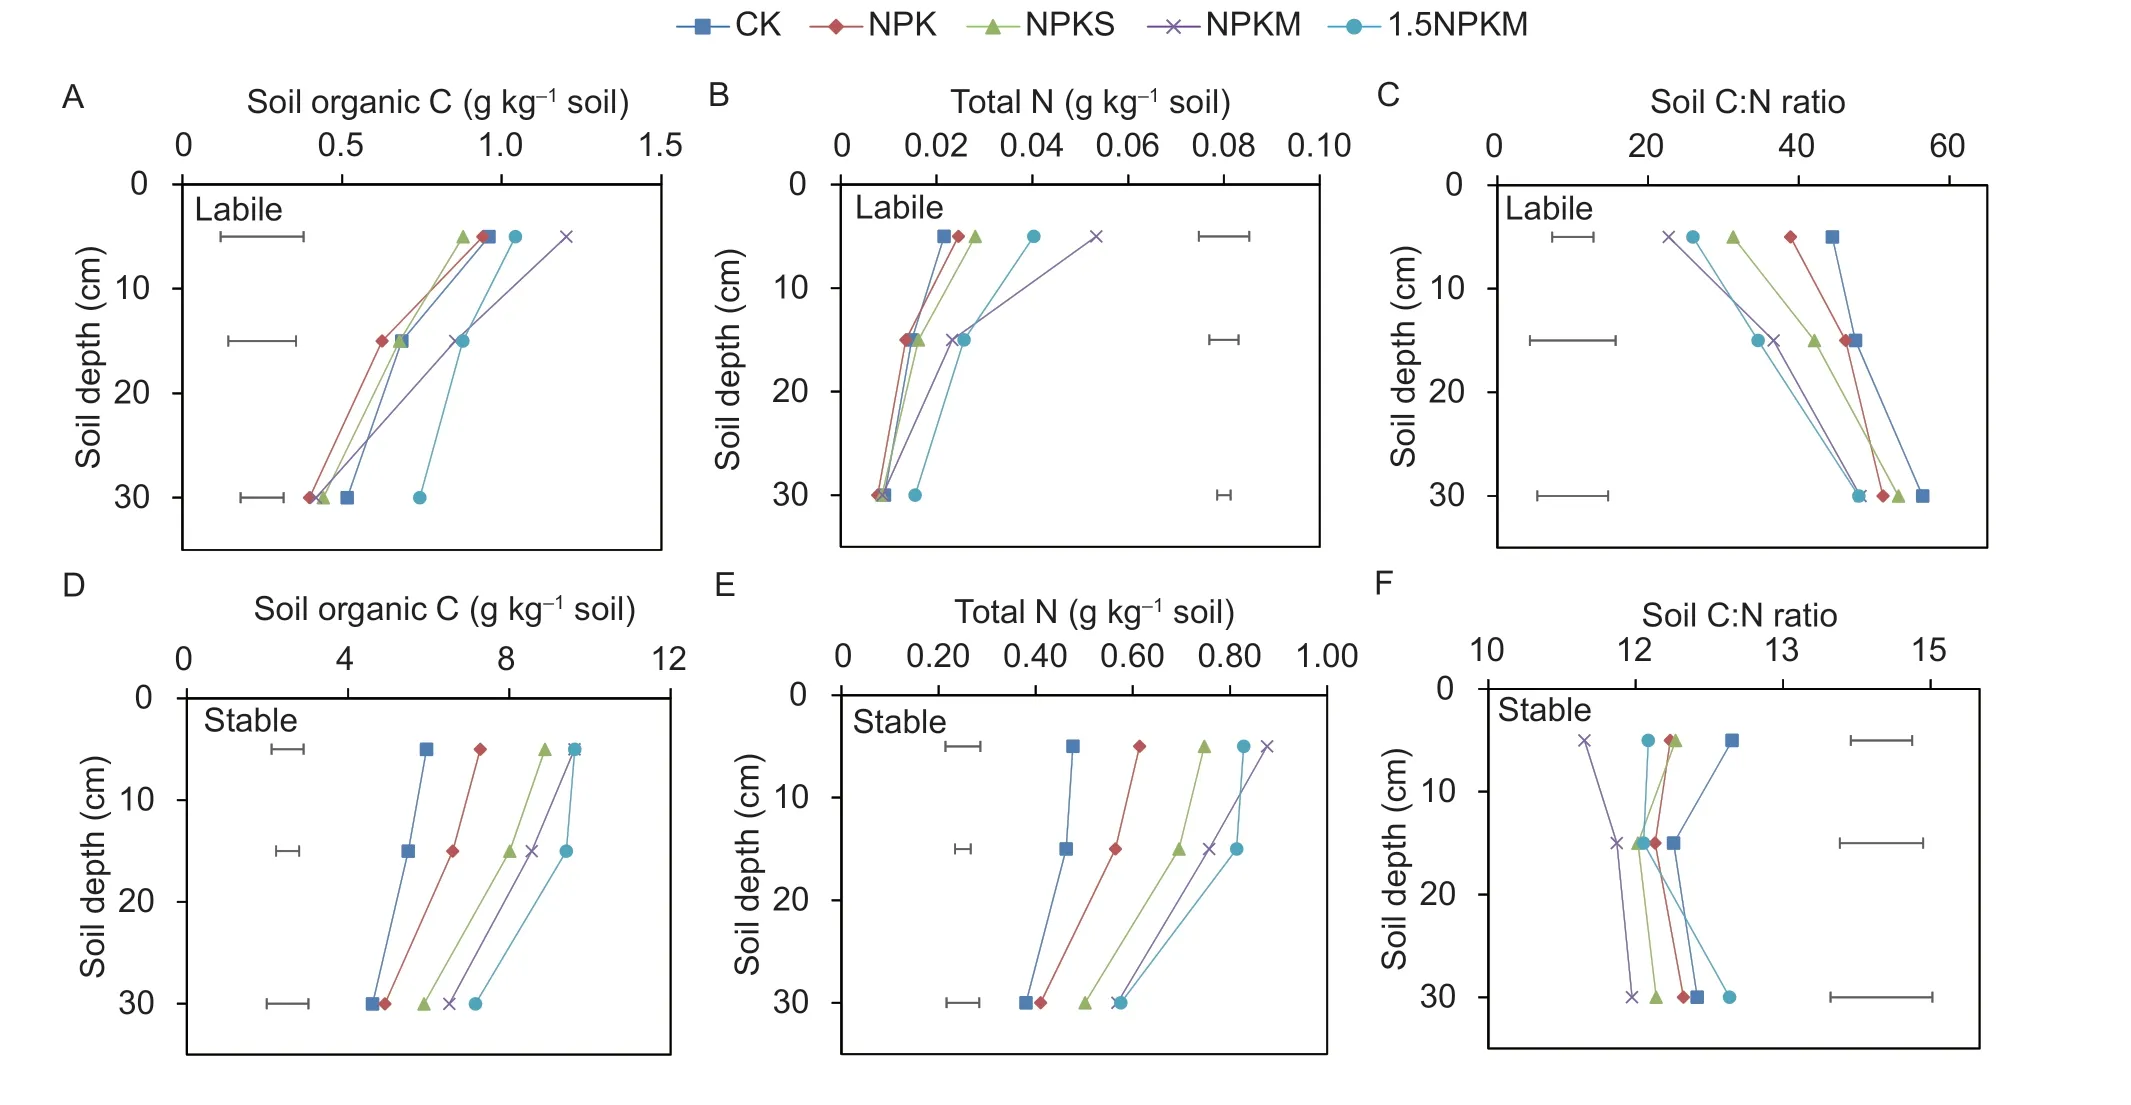
Fig.5 The soil organic C and total N contents and C:N ratios for the labile (A, B and C) and stable (D, E and F) soil fractions in the 0–10, 10–20, and 20–40 cm soil layers under different fertilization treatments.CK, control, no fertilizer; NPK, chemical fertilizer only; NPKS, chemical fertilizer with straw; NPKM, chemical fertilizer with manure; 1.5NPKM, 1.5 times the application rate of NPKM.The labile organic matter fraction is the sum of C from the coarse particulate organic matter (cPOM) and fine particulate organic matter (fPOM).The soil stable organic matter fraction is the sum of C from the free microaggregate (free-m), free silt and clay(free-SC), fine intra-aggregate POM (fiPOM), inter silt and clay (inter-SC), and intra silt and clay (intra-SC).Data are the means(n=3).The horizontal lines represent LSD0.05 values.
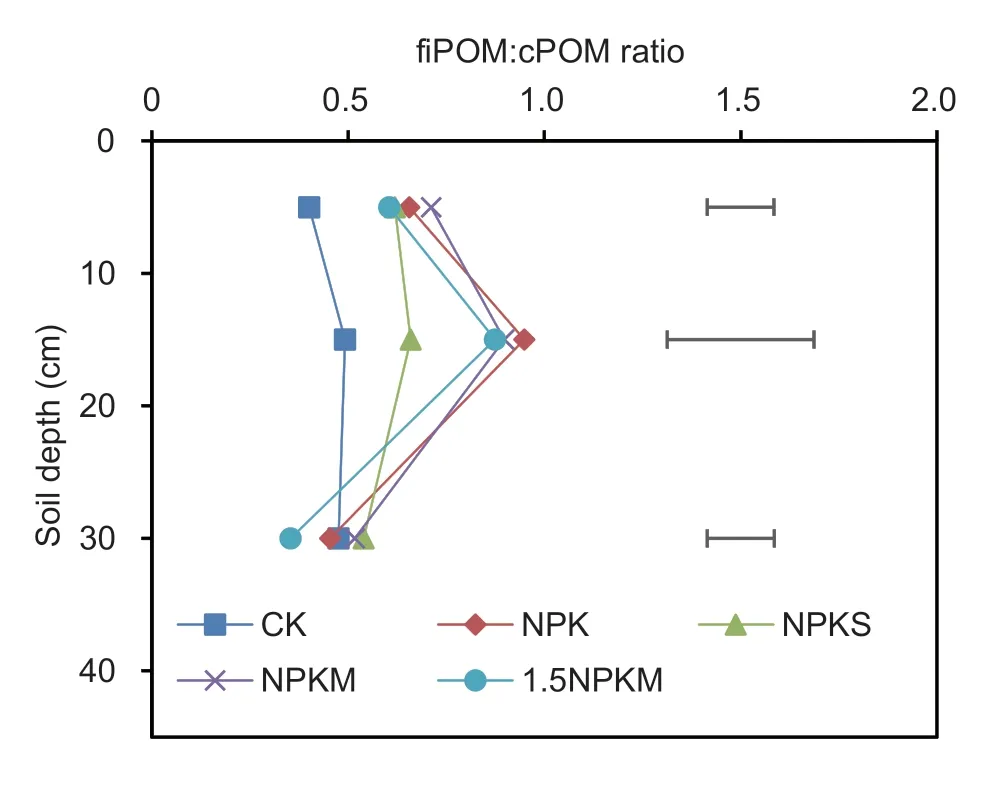
Fig.6 The fiPOM:cPOM ratios in the 0–10, 10–20, and 20–40 cm soil layers under different fertilization treatments.CK, control, no fertilizer; NPK, chemical fertilizer only; NPKS,chemical fertilizer with straw; NPKM, chemical fertilizer with manure; 1.5NPKM, 1.5 times the application rate of NPKM.fiPOM, fine intra-aggregate POM; cPOM, the coarse particulate organic matter.Data are the means (n=3).The horizontal lines represent LSD0.05 values.
We found that chemical fertilization increased the SOC and TN contents by 15.5–18.2 and 22.4–29.6% in the topsoil (0–10 and 10–20 cm) layer compared to the control in our 30-year field experiment (Fig.1-A).However,inconsistent effects of chemical fertilization alone on SOM have been reported in previous studies (Robertsonet al.2013; Brownet al.2014).These different findings were likely related to differences in the chemical N application rates in the studies.Our chemical N application rate,353 kg ha–1, was within the recommended range (330 to 390 kg ha–1) for the winter wheat and summer maize rotation system in our study site’s region (Zhanget al.2009).Recent research has also suggested that an optimal N application rate is the key to improving SOM(Panet al.2019).In addition, the SOC and TN contents across the 0–40 cm soil profile were improved by the application of chemical fertilizer with straw compared to the chemical fertilizer alone (Fig.1-A and B).The effects of straw return on SOM are highly dependent on the initial SOM content, duration period, cropping system, and soil type (Berhaneet al.2020).In our 30-year study, the low initial SOM (6.67 g kg-1) and long experimental duration together with straw return contributed to a higher SOM content compared to soils receiving chemical fertilization alone (Berhaneet al.2020).As expected, the manure application built up considerable SOM in our tested soil(SOC increased from 34.7 to 70.6% and TN from 46.7 to 87.0%; Fig.1-A and B), just as it had in another longterm study in the upland of China (Heet al.2015).Thus,partial fertilizer substitution with organics has more advantages in SOC and TN improvement than the use of chemical fertilizer alone.
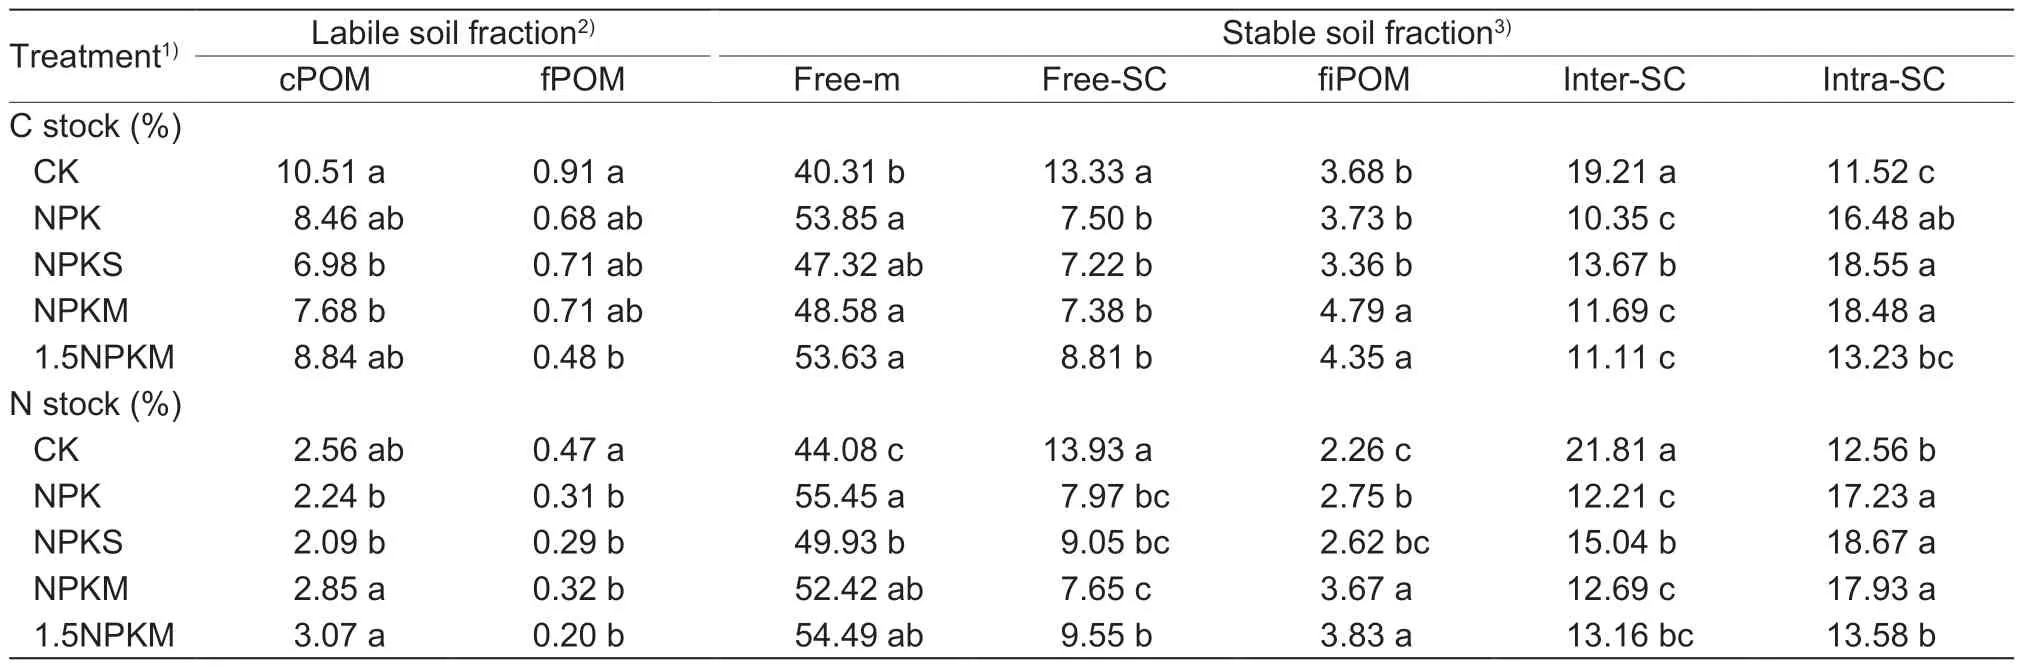
Table 6 The contribution rate of soil aggregate fractions to soil organic C and total N stocks of the bulk soil across the 0–40 cm soil profile under different fertilization treatments
In our study, we revealed the effects of different fertilization schemes on the SOC and TN of vertical soil profiles that included subsoil (0–10, 10–20, and 20–40 cm) (Fig.1-A and B).This experimental design was different from previous long-term fertilization studies (Heet al.2015; Xieet al.2015; Berhaneet al.2020), which primarily focused on the topsoil (0–10 or 0–20 cm).We found that chemical fertilization increased the SOC and TN contents only in the topsoil (0–10 and 10–20 cm),while organic amendment (NPKS, NPKM, and 1.5NPKM)enhanced those quantities in both the topsoil (0–10 and 10–20 cm) and subsoil (20–40 cm).These results were consistent with the findings of Chaiet al.(2015).One possible reason should be that more OM inputs of roots,dissolved organic carbon, and root exudates in the soils under organic amendment entered the subsoil, because it is generally accepted that those kinds of OM inputs are the main sources of subsoil SOM (Michalziket al.2001;Abraret al.2020).For example, previous field studies reported root proliferation in subsoil under fertilized and organically amended soil compared with soil that had received only chemical fertilization (Bandyopadhyayet al.2010; Zhanget al.2018).Compared to our NPKS plot,the SOC in the 1.5NPKM plot and the TN in the subsoil(20–40 cm) of the NPKM and 1.5NPKM plots were significantly higher, thus suggesting that long-term organic amendment helps to improve the SOM of both topsoil and subsoil layers, and manure does that better than straw.
4.2.lmproved macroaggregates under partial substitution of chemical fertilizer with manure while maintaining reasonable total N inputs
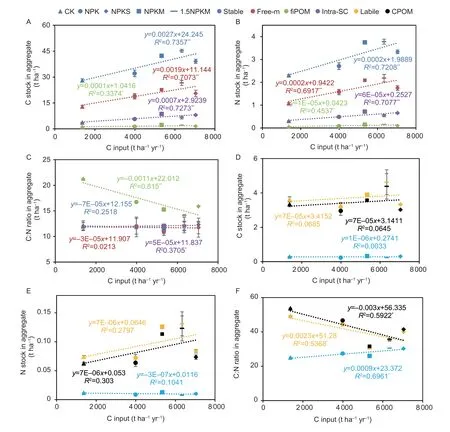
Fig.7 Relationships between annual C inputs and annual C stocks, N stocks, and C:N ratios for labile (A, B and C) and stable (D,E and F) soil fractions and their fractions in the 0–40 cm soil layer under different fertilization treatments.CK, control, no fertilizer;NPK, chemical fertilizer only; NPKS, chemical fertilizer with straw; NPKM, chemical fertilizer with manure; 1.5NPKM, 1.5 times the application rate of NPKM.The labile organic matter fraction is the sum of C from the coarse particulate organic matter (cPOM)and fine particulate organic matter (fPOM).The soil stable organic matter fraction is the sum of C from the free microaggregate(free-m), free silt and clay (free-SC), fine intra-aggregate POM (fiPOM), inter silt and clay (inter-SC), and intra silt and clay (intra-SC).Data are the means (n=3).The regression equations and their regression coefficients are shown together with dashed regression lines.*, P<0.05; **, P<0.01.
Compared to the NPKS treatment, the NPKM treatment had a significantly higher macroaggregate fraction proportion in the 20–40 cm soil layer (Table 4).Those results were consistent with another 9-year field experiment under a similar soil type and cropping system(Liet al., 2020).This could be attributed to differences in the biochemical properties between crop straw and manure.In our study, the C/N ratios of manure and crop straw were 12.4 and 54.9, respectively.Additionally,the manure had more stable organic compounds than crop straw (Sarkeret al.2022).This would result in more stable SOM inputs directly and higher microbial use efficiency indirectly (Samsonet al.2020) for manure compared to crop straw.Thus, both effects together facilitated the production of soil aggregate binding agents for macroaggregate formation.However, different findings were reported by Daiet al.(2019) from a 3-year field experiment on the HHH Plain, in which a straw amendment was more conducive to soil aggregation than manure.This difference in results most likely occurred because their manure application (half of crop straw C)was lower and their N input (chemical fertilizer with 600–966 kg ha–1) was higher than ours.In addition, compared with the control, the macroaggregate proportions in the 0–10 and 20–40 cm layers of the 1.5NPKM treatment were significantly reduced (Table 4), possibly because the higher manure application may have caused an accumulation of dispersing agents (e.g., Na+) (Guo Z Cet al.2019).Alternatively, the large increase in available nutrients in the soil caused by the application regimes could have affected a reduction in the fungal production of biological binding agents (Brownet al.2014).Therefore,the substitution of chemical N fertilizer with manure,but without the over-use of N inputs, is conducive to macroaggregate formation and stability.
4.3.Enhanced SOC and TN stabilization of soil aggregates under long-term fertilization
We found that the increased C inputs from long-term fertilization significantly increased the stable SOC fractions (Fig.7-A), thus suggesting that fertilization helps improve SOC stabilization over the long term.The free-m, fiPOM, and intra-SC fractions contributed the most to the stable SOC fraction increase (Figs.2-D,4-D and G and 7-A).Sixet al.(2002, 2014) previously found that microaggregate formation was both a robust indicator for management induced SOC changes over the long term and a mechanism for SOC accumulation.In agreement with those findings, we showed that a slower macroaggregate turnover, represented by a higher ratio of cPOM to fiPOM under long-term fertilization (Fig.6),may facilitate microaggregate formation.In our study,the free-m fraction had the highest contribution rates to soil organic C and total N stocks, ranging from 40.31 to 55.45% for the different fertilization treatments (Table 6).One explanation is that microaggregates can be released as free-m when the macroaggregates are disrupted by the frequent tillage of intensive agriculture (Sixet al.2002).Furthermore, we found that fertilization increased the C and N stocks of the free-m fraction compared with the CK (Table 6).This was also partly supported by a field experiment using labeled C and N conducted by Angerset al.(1997), which showed that wheat-derived C was stored mainly in free-m.In addition, free-m was shown to have a slower turnover time and greater C stabilization than the macroaggregates (Jastrowet al.1996; Sixet al.2002).Thus, the stabilization of SOC and TN were improved by the increase in SOM in the stable fractions after long-term fertilization.
Additionally, the interm-m in our study was composed mostly of fiPOM and intra-SC (Fig.4), and their increases under fertilization consistently followed the higher fiPOM:cPOM ratio (Fig.6).Since the fiPOM:cPOM ratio indicates the turnover rate of soil aggregates (Sixet al.2000), the higher fiPOM:cPOM ratio under fertilization suggested slower macroaggregate turnover and greater microaggregate formation.We also found that intra-SC contributed more to the SOC increases under fertilization than fiPOM (Figs.4-B and C and 7-A), a finding that agrees with that of Courtier-Muriaset al.(2013).This suggests that because the SOC in the intra-SC came mainly from microbial products, fertilization increased the microbial activity that leads to SOM formation (Cotrufoet al.2019).Furthermore, our results showed that the SOC stocks throughout the 0–40 cm profile increased linearly as C inputs increased (Figs.1-A, 7-A and D).Among the different fertilization treatments, manure amendment was more beneficial to SOC accruals in both the fiPOM and intra-SC fractions of the 0–40 cm soil profile than the other treatments (Figs.4-B and C and 7-A).This was most likely because high quality organic amendments are usually processed by enhanced microbial activities, and the resulting microbial products may contribute to SOC formation in the fiPOM and intra-SC fractions (Cotrufoet al.2015).The enhanced fiPOM and intra-SC thus lead to a relatively greater formation and stability of interm-m with manure amendment than with other fertilization practices.Overall, we showed that over the long-term, microaggregate-protected and mineral-associated organic C is the key physicochemical stabilization mechanism of SOC in a typical Cambisol soil.
Like SOC, stable N stocks increased as C inputs increased after fertilization, but labile N stocks did not(Fig.7-A and D).As microaggregates were strong indicators of SOC storage in our study, free-m, fiPOM,and intra-SC were also key players in the N retention of fertilized soils (Figs.2-B, 4-B and C and 7-A).However,unlike the SOC, which originated mainly from organic matter inputs, the TN in soil after fertilization was from both organic and inorganic N sources.Organic N can enter soil aggregate fractions as decomposed organic matter, transformed SOM, or N-containing compounds adsorbed directly onto a silt and clay fraction (Castellanoet al.2012).Inorganic N can be assimilated by soil microbes and then enter soil aggregate fractions (e.g.,intra-SC and fiPOM) that have microbial sources (Cotrufoet al.2015).In a long-term experiment using labeled N,Konget al.(2007) observed that a large amount of N from chemical fertilizer was stabilized in the silt-clay fraction.In our study, microbial activities may have increased as C inputs increased because C availability is more likely to limit microbial activity in intensive agriculture(Drinkwateret al.2007).Baiet al.(2020) found that in the early stage of an incubation experiment, the15N-labeled chemical fertilizer was assimilated by microbes and then transferred to silt and clay.Thus, we showed that TN has a stabilization mechanism similar to SOC in our tested soil after long-term fertilization.
4.4.Coupled relationships between SOC and TN dynamics under long-term fertilization
Our study showed that in fertilized treatments, both TN and SOC contents and storage increased in bulk soil and in its main aggregate fractions (i.e., free-m, fiPOM,and intra-SC) (Figs.1–5 and 7).Generally, the C and N contents in SOM are tightly linked stoichiometrically(Cleveland and Liptzin 2007; Guenetet al.2020);however, compared to C, the dynamics of aggregate N have been studied less intensively (Konget al.2007).The relationships between C and N in different aggregate fractions are not clear, although Yanet al.(2012) found soil C and N decoupling in aggregate fractions of cereal fields after they had been converted to vegetable production in the HHH Plain.This suggests that the directions and locations of SOC and TN changes were coupled in our tested soil, and highlights the importance of N for soil C storage.
However, the magnitudes of SOC and TN increases after fertilization were not synchronous.The soil C:N ratios decreased significantly throughout the 0–40 cm soil layers of the NPKM treatment and in the 0–10 cm soil layer of all fertilizer application treatments (Fig.1-C).This indicates that the N increase was faster than the C increase in the bulk soil after fertilization.The effect of fertilization reducing the C:N ratio has been found in other ecosystems (Sunet al.2020), but it is interesting that the NPKM treatment reduced the C:N ratio more than the NPK and NPKS treatments, even though they all had equal chemical N applications (Figs.1-C, 7-C and F).There are three possible explanations for those results.First,compared to the other treatments, manure application increased the stable fractions the most (Figs.2-B and C,4-B and C, 5-D and 7-A), and those fractions had lower C:N ratios than the labile fractions (Figs.2-H and I, 4-H and I, 5-F and 7-C).Second, manure application reduced the C:N ratios of labile (8.98–13.29) fractions more than those of stable (0.44–0.59 units) fractions (Fig.5-C and F) due to the quick responses of the C:N ratios of labile fractions to fertilization (Samsonet al.2020).Third, the SOC is mineralized as CO2, while soil N mineralization is partially offset by microbial N immobilization (Castellanoet al.2012).Compared with other treatments, manure treatment could increase microbial N immobilizaiton because the higher carbon input from manure application enhanced the N requriements of microbes.This implies that the substitution of chemical fertilizer N with manure has superiority in SOC and TN storage and stabilization simultaneously in the tested Cambisol soil.
4.5.lmplications for SOM simulation and management
This study on the effects of different fertilization methods on SOC and TN in both topsoil and subsoil layers of bulk soil and its aggregates provides information about SOC and TN storage and stabilization mechanisms, all of which bear importantly on the modeling and management of SOM in agroecosystems.For example, the Microbial Efficiency-Matrix Stabilization (MEMS) model, one of a new generation of SOM simulations, involves the recent understanding of SOM formation and persistence,and it is structured around measurable biophysical SOM fractions (Robertsonet al.2019).However, that model has only been validated in forest and grasslands systems, and its soil N simulation was less accurate than those for soil C (Zhanget al.2021).Thus, our results provide the necessary data on SOC and TN, distributed in different measured SOM pools across various soil layers under long-term fertilization, which can allow the parameterization of that model for use with agricultural systems.
Previous studies have indicated that optimal N application is the best for SOM improvement (Brownet al.2014; Panet al.2019).Our research showed that organic N substitution practices that yield an optimal N rate can improve SOM while both maintaining crop production and potentially reducing N losses due to the increase of TN in the stable soil fractions.However, the overapplication of N, even when part of the N came from manure (i.e., 1.5NPKM), did not further increase the SOC and TN storage in the 0–40 cm soil profile, and it led to lower macroaggregate formation.Therefore, we propose that organic N substitution should be combined with an N optimization practice (e.g., control total N inputs) to maximize SOM storage and improve soil aggregation.
5.Conclusion
This study of a 30-year fertilization field experiment provides evidence that long-term chemical N fertilizer with straw or manure improves the SOC and TN contents and storage better than chemical-only fertilization,especially in the 10–20 and 20–40 cm soil layers.Most of this improvement occurred in the stable SOM fractions,including free-m and the main fractions of interm-m (i.e.,fiPOM and intra-SC).Manure performed better than straw for chemical N substitution as it was better at increasing both labile and stable SOM formation.However, the 1.5NPKM treatment did not facilitate greater formation of macroaggregates.While SOC and TN increased simultaneously in bulk soil and in various soil aggregates,the lower C:N ratio indicated that the magnitude of the TN increase was higher than that of SOC, thus suggesting that the C increase from fertilization immobilized more N and/or reduced the potential N losses.Therefore, more attention must be paid to subsoil (20–40 cm) C and N storage after long-term fertilization, and both the quantity and quality of organic amendments are key to maximizing soil C and N storage and stabilization.
Acknowledgements
This study was supported by the Agricultural Science and Technology Innovation Program (ASTIP) of Chinese Academy of Agricultural Sciences (CAAS-CSAL-202302 and GY2023-12-7), the Fundamental Research Funds for Central Non-Profit Scientific Institutions, China(1610132019014) and the National Key Research and Development Program of China (2016YFD0200101 and 2018YFD0200804).
Declaration of competing interest
The authors declare that they have no conflict of interest.
 Journal of Integrative Agriculture2023年11期
- Journal of Integrative Agriculture的其它文章
- Germplasm and molecular breeding in horticultural crops
- Development and application of KASP marker for high throughput detection of the seedless trait in grapevine
- QTL analysis of early flowering of female flowers in zucchini(Cucurbita pepo L.)
- A novel mutation in ACS11 leads to androecy in cucumber
- Comprehensive analysis of the full-length transcripts and alternative splicing involved in clubroot resistance in Chinese cabbage
- Virucidal activity of MICRO-CHEM PLUS against African swine fever virus