
Modelling the crop yield gap with a remote sensing-based process model: A case study of winter wheat in the North China Plain
2023-10-16 01:32:40YANGXuZHANGJiahuaYANGShanshanWANGJingwenBAIYunZHANGSha
Journal of Integrative Agriculture 2023年10期
YANG Xu ,ZHANG Jia-hua # ,YANG Shan-shan ,WANG Jing-wen ,BAI YunZHANG Sha#
1 Research Center for Remote Sensing and Digital Earth,College of Computer Science and Technology,Qingdao University,Qingdao 266071,P.R.China
2 Aerospace Information Research Institute,Chinese Academy of Sciences,Beijing 100094,P.R.China
Abstract Understanding the spatial distribution of the crop yield gap (YG) is essential for improving crop yields. Recent studies have typically focused on the site scale,which may lead to considerable uncertainties when scaled to the regional scale.To mitigate this issue,this study used a process-based and remote sensing driven crop yield model for winter wheat(PRYM-Wheat),which was derived from the boreal ecosystem productivity simulator (BEPS),to simulate the YG of winter wheat in the North China Plain from 2015 to 2019. Yield validation based on statistical yield data revealed good performance of the PRYM-Wheat Model in simulating winter wheat actual yield (Ya). The distribution of Ya across the North China Plain showed great heterogeneity,decreasing from southeast to northwest. The remote sensing-estimated results show that the average YG of the study area was 6 400.6 kg ha–1. The YG of Jiangsu Province was the largest,at 7 307.4 kg ha–1,while the YG of Anhui Province was the smallest,at 5 842.1 kg ha–1. An analysis of the responses of YG to environmental factors showed no obvious correlation between YG and precipitation,but there was a weak negative correlation between YG and accumulated temperature. In addition,the YG was positively correlated with elevation. In general,studying the specific features of the YG can provide directions for increasing crop yields in the future.
Keywords: remote sensing,PRYM-Wheat Model,yield gap,environmental factors,North China Plain
1.Introduction
The rapid growth of the world population is increasing the global demand for food (Wartet al.2013),and the agricultural system is an important guarantee of food security (Tilmanet al.2011;Zhang 2018). The North China Plain is one of the main winter wheat producing areas in China,and its yield accounts for more than 50% of the total winter wheat yield in China (Menget al.2012;Wanget al.2022). Both the expansion of cropland and increased crop yields can guarantee food security.As urbanization has accelerated,competition between cropland and other land uses has grown,making it difficult to boost crop yields by increasing the cropland area. Therefore,it is essential to achieve a sustainable increase in yield on the existing arable land. The yield gap (YG) is the difference between the actual yield (Ya)that farmers get from their efforts and the potential yield(Yp) (Evans and Fisher 1999),which represents the magnitude of the possible crop yield increase (Lobellet al.2009;Neumannet al.2010;Liu 2012). Therefore,the accurate estimations of crop yield and the YG are of great significance for the improvement of crop yields.
An important issue in YG analysis is the simulation of the crop Ya. The use of remote sensing models to simulate Ya is still in the exploratory stage. The most basic approach is establishing empirical relationships between time-series remotely sensed vegetation indices and historical statistical yields (Zhang and Zhang 2016;Burke and Lobell 2017). This approach can monitor crop growth,but it lacks well-established ecological mechanisms and may produce uncertainties when extended to regional scales (Wang Jet al.2019). In addition,the light-use efficiency models can also be used to simulate Ya,represented by Carnegie Ames Stanford Approach (CASA) (Potteret al.1993). The parameters of this model are few and easy to obtain,but there are some uncertainties in obtaining the maximum light-use efficiency (Guanet al.2016;Yuanet al.2016). Based on the principles of plant physiology and ecology,process models can simulate the key processes of plant growth,such as transpiration,evaporation,photosynthesis and respiration. Thus,these models can realize the estimation of crop yield. In addition,the spatial distribution of yield can be accurately simulated at multiple scales and obtained. Therefore,such models are also often used to simulate the crop Ya (Wanget al.2011;Zhang 2018).The process-based and remote sensing driven crop yield model for winter wheat (PRYM-Wheat) was constructed according to the BEPS Model,which can simulate the Ya at the regional scale. This model adds the simulation of irrigation by modifying the soil water content in the soil water balance module (Zhanget al.2021a,b). The model determines the irrigation time by calculating the development stage (DVS). In the soil water balance module,the water cycle process is changed according to the DVS of the crops,and the irrigation information is simulated by modifying the soil water content. Only spring irrigation is considered,and irrigation is set for three times after overwintering. The irrigation strategy applies irrigation when the DVS of the winter wheat crop is 0.2,0.5 and 0.8,in order to make the soil water content reach the saturated water content (Zhang 2018).
Another important issue in YG analysis is to simulate the Yp of the crop. Yp in this study is defined as the yield of a crop under good growing conditions with only light and temperature limitations,but without water limitation(Lobellet al.2009). Studies on Yp mainly use crop growth models,such as WOFOST (Jianget al.2017),APSIM(Liu 2012) and Hybrid-Maize (Yanget al.2004),which can describe the growth and development processes of the crops. These models can simulate the Yp at the site scale by setting different parameters to represent the crop without water limitations. However,when the distribution of Yp is represented at the regional scale,the interpolation method may introduce some uncertainties.With the development of remote sensing technology,the introduction of remote sensing data into crop models can provide quantitative data for the transformation from the site scale to the regional scale (Zhao 2015). Satellite remote sensing data can provide long time series data for vegetation parameters over a large area scale,including leaf area index and vegetation index data (Curnelet al.2011;Huanget al.2015;Wanget al.2022). Remote sensing-based process models using remote sensing data as the input data of the model can realize the expansion from the site scale to the regional scale and provide the potential to obtain the distribution of YG at the regional scale.
This study used the improved PRYM-Wheat Model based on the BEPS Model to simulate the YG of winter wheat at the regional scale. The main objectives of this study are to (1) simulate the Ya of winter wheat in the North China Plain using the PRYM-Wheat Model and evaluate the performance of the model;(2) estimate the Yp and YG for the study area;(3) use the Ya and Yp of each province and municipality to calculate their respective priorities,in order to identify the areas with the greatest potential for yield increases in winter wheat;and(4) analyze the effects of environmental factors,such as temperature,precipitation and elevation,on yield.
2.Materials and methods
2.1.Study area
The study area is the North China Plain (Fig.1),located in eastern China (32°–40°N,114°–121°E),which is characterized by large spatial scales,large topographicclimatic disparities,and diverse vegetation and soil types.There are seven provinces and municipalities,i.e.,Beijing municipality,Tianjin municipality,Hebei Province,Henan Province,Shandong Province,and some cities in Anhui and Jiangsu provinces are covered. The study area has a temperate and subtropical monsoon climate with an average annual precipitation of 500–600 mm (Zhanget al.2017;Wuet al.2019). The main food crops in this region are winter wheat and summer maize. The main growth period of winter wheat is from early March to late May,including the green-up,jointing,heading-filling and milk maturity stages (Tianet al.2021).
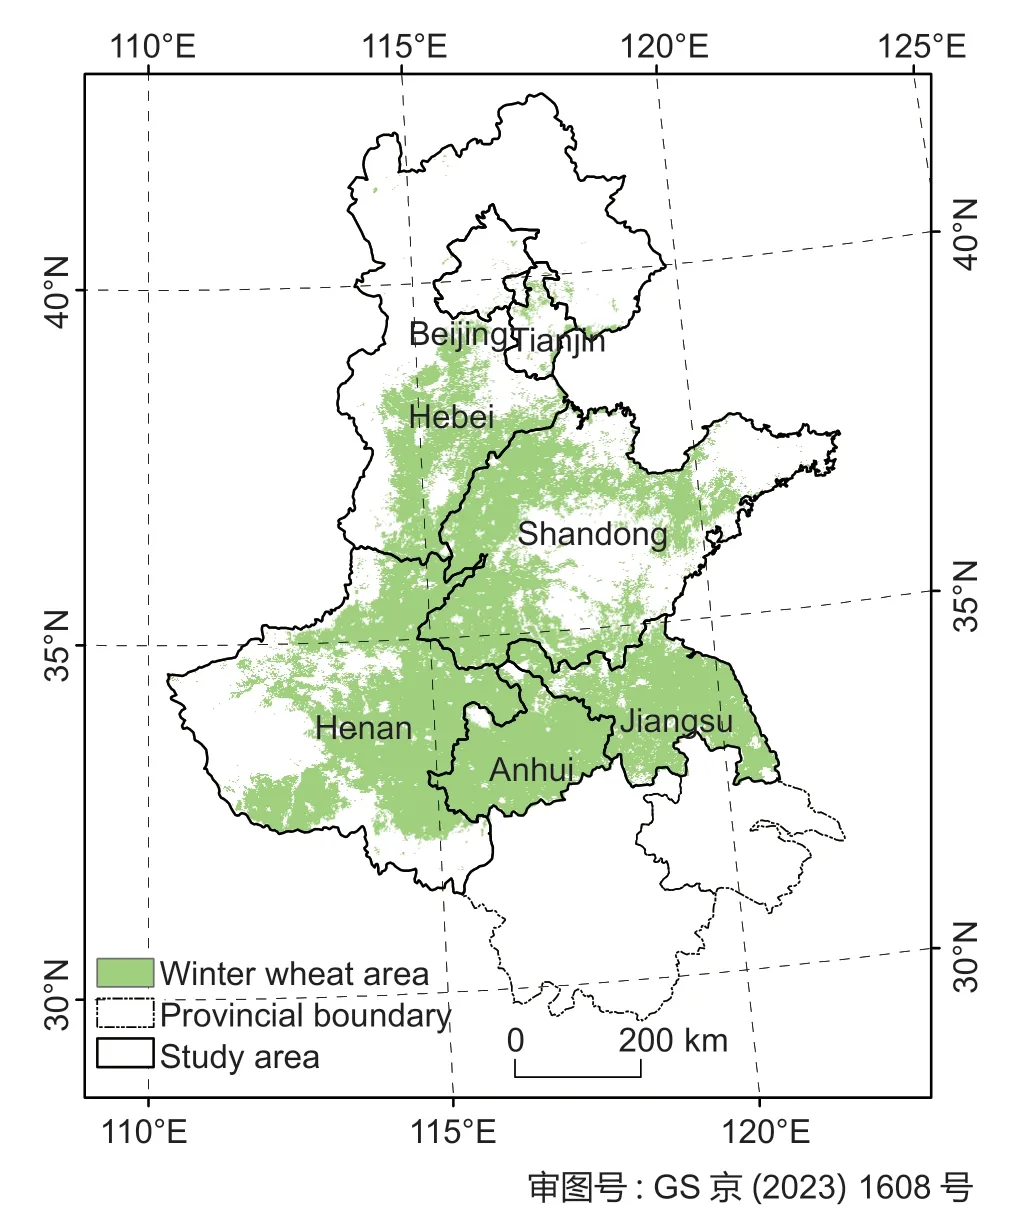
Fig.1 Winter wheat planting area and geographic location of the North China Plain (Zhang 2018).
2.2.Data and processing
The data used in this study include input data for model simulations and data of statistical yearbooks (Anhui Provincial Bureau of Statistics 2019;Hebei Provincial Bureau of Statistics 2019;Henan Provincial Bureau of Statistics 2019;Jiangsu Provincial Bureau of Statistics 2019;National Bureau of Statistics 2019;Shandong Provincial Bureau of Statistics 2019) for validation,and all data represent the period of 2015–2019 (Table 1).
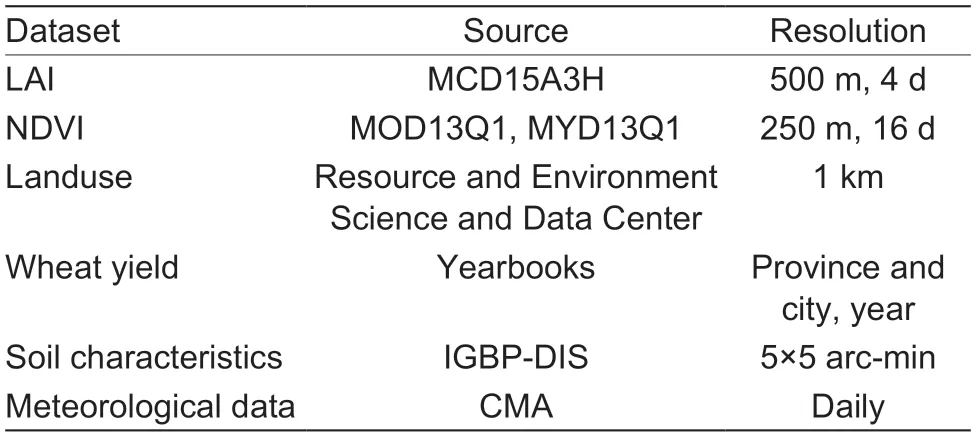
Table 1 Datasets used in this study
The resolution of the input data determines the spatial resolution of the model. The temporal resolution of the model is a mixed temporal resolution,with a time scale of days in the simulation of water cycle processes,photosynthesis and respiration,but a time scale of years in the simulation of processes of ecological quantities.
The LAI and NDVI vegetation indices were used in this study. The LAI data used were from the MCD15A3H product,and the spatial resolution of the data is 500 m and the temporal resolution is 4 d. The NDVI data were a composite of two products from MOD13Q1 (16 d,250 m) and MYD13Q1 (16 d,250 m). All products were downloaded from LAADS DAAC (https://ladsweb.modaps.eosdis.nasa.gov).
The model inputs include daily mean temperature(Ta,°C),total surface solar radiation (RSG,J m–2),vapor pressure deficit (VPD,Pa),wind speed (Ws,m s–1),and precipitation (PR,mm). The Ta,VPD,Ws,and PR data were obtained from the ERA-Interim meteorological reanalysis dataset (https://apps.ecmwf.int/datasets/data/interim-full-daily/levtype=sfc/),and interpolated to 500 m resolution using the spline function method. The RSG data were downloaded from the China Meteorological Administration (CMA;http://data.cma.cn) and resampled to the same 500 m resolution.
The soil property data were obtained from the International Geosphere-Biosphere Program Data and Information System (IGBP-DIS) soil property database(https://daac.ornl.gov/cgi-bin/),with a resolution of 5×5 arc-min.
The statistical yearbooks (Anhui Provincial Bureau of Statistics 2019;Hebei Provincial Bureau of Statistics 2019;Henan Provincial Bureau of Statistics 2019;Jiangsu Provincial Bureau of Statistics 2019;National Bureau of Statistics 2019;Shandong Provincial Bureau of Statistics 2019) systematically compiles the statistical data of provinces and cities from 2015 to 2019,including administrative divisions,industry and agriculture. The statistical yield data for winter wheat in the study area were obtained from the statistical yearbooks (Anhui Provincial Bureau of Statistics 2019;Hebei Provincial Bureau of Statistics 2019;Henan Provincial Bureau of Statistics 2019;Jiangsu Provincial Bureau of Statistics 2019;National Bureau of Statistics 2019;Shandong Provincial Bureau of Statistics 2019) published by the National Bureau of Statistics (http://www.stats.gov.cn/tjsj/ndsj/#) and the statistical yearbooks of the relevant provinces and municipalities.
2.3.Yield gap estimation
Actual yield simulationIn this study,the PRYM-Wheat Model based on the boreal ecosystem productivity simulator (BEPS) was used to simulate the Ya of the study area at the regional scale (Liuet al.1997;Wanget al.2009;Wang Jet al.2019). The PRYM-Wheat Model is a remote sensing process model that can simulate the processes of crop growth,such as photosynthesis,respiration,carbon allocation,water balance and energy balance relationships. The model is driven by data on time-series vegetation parameters (LAI and NDVI),timeseries meteorological drivers (mean daily temperature,total surface solar radiation,wind speed,precipitation,etc.),soil parameters,and land cover maps,with 1 d as the time step of the model simulation (Liuet al.2003;Wanget al.2011). The core modules for the photosynthesis simulation and the evapotranspiration simulation of the water cycle are based on the corresponding modules of BEPS. The core formulas of the model are derived and given in eqs.(1)–(23).
(1) Calculation of LAI by separating shaded and sun leaves
As a two large-leaf model,the model separates the shaded leaves and the sun leaves (light-receiving leaves)to calculate the net radiation absorbed by the canopy.The following equations calculateLAIsunandLAIshade:
whereLAIsunandLAIshadeare the leaf area indexes of sun leaves and shaded leaves,respectively;LAI is the canopy total leaf area index;? is the canopy clumping index;and θ is the mean solar zenith angle.
(2) Calculation of photosynthetic assimilation efficiency
The model mainly simulates the two basic processes of photosynthesis,i.e.,carboxylation and electron transfer.The photosynthetic net assimilation rate is:
where A is the net photosynthetic assimilation efficiency of leaves;Wcis the rate of photosynthesis limited by Rubisco activity;Wjis the light-limited rate of photosynthesis;Rdis the daytime leaf respiration;Vmis the maximum rate of carboxylation;Ciis the intercellular CO2concentration;Γ is the dark respiration compensation point for CO2;K is the enzymatic reaction constant;and J is the electron transfer rate.
Γ,K,Vmand J are calculated as follows:
whereTais the air temperature;Kcis the Michaelis-Meten coefficient of CO2;Kois the Michaelis-Meten coefficient of O2;O2is the intercellular O2concentration;Vm,25is the maximum carboxylation rate at 25°C;f(N) denotes the restrictive function of nitrogen supply;Jmaxis the saturation electron conduction rate;PPFD is the photoelectron flux density;andRgasis the molar gas constant.
According to fluid physics,A can also be described by the following eq.:
whereCais the concentration of CO2in the air;g is the stomatal conductance of CO2from leaf pulp cells to air;gsis the stomatal conductance of CO2;gsmaxis the maximum stomatal conductance of CO2;and the items of f(PPFD),f(VPD) and f(w) are the constraining factors of PPFD,VPD and water stress,respectively.
The water stress parameters are calculated as follows:
where l is the serial number of the soil layer;SWSF stands for water stress parameters;w andθwrepresent the weight of the soil layer and wilt point,respectively;SWC is the soil water content,which represents the soil water balance;the proportion of Y is for root biomass in the soil layer;d is the lower boundary of the soil layer;and β is denoted as the root attenuation coefficient (Baiet al.2017;Zhang 2018).
The model calculated the photosynthetic assimilation efficiency of shaded leaves (Ashade) and sun leaves (Asun),and then the total photosynthesis of shaded and sun leaves were calculated separately. Finally,the total photosynthesis of the canopy was obtained (Acanopy):
(3) Calculation of yield
The following equations were used to calculate the yield:
where GPP is total primary productivity;FactorGPPis the GPP unit conversion factor;NPP is net primary productivity;RmandRgare maintenance respiration and growth respiration,respectively;yield is the yield per unit area of wheat;Tcis the coefficient of conversion of carbon to dry matter,and for winter wheat this value is 2.22 (Juet al.2010);HI is the harvest index,which is 0.5 when simulating the Ya of winter wheat (Pan and Deng 2007);ω is the moisture content coefficient of winter wheat in storage after harvest,which is 12.5% (Pan and Deng 2007;Liu 2016);and unit_factor is the yield unit conversion factor.
The selection of parameters is a crucial part of the process model,and some of the parameters used in the PRYM-Wheat Model in this study are shown in Table 2.
Estimation of potential yield and yield gapThe PRYM-Wheat Model simulated the Yp of winter wheat in the study area. In simulating the Yp,the growth and development of winter wheat are not considered to be limited by water,so the water stress parameter in the model is set as 1. The HI is 0.6 when simulating the Yp ofwinter wheat (Pan and Deng 2007). Some studies have found that crops have a maximum leaf area index (LAImax)(Wanget al.2003;Fanget al.2015). However,the relationship between the maximum LAI and yield shows a parabolic relationship with a downward opening,the symmetric axis is the optimal maximum leaf area index,and the value ofLAIopt_maxis taken as 7.27 (Zhang 2018).In this study,the LAI of the simulated Yp was defined as the potential LAI,denoted by LAIp. LAIp was obtained by correcting the obtained LAI using theLAIopt_max,and the corrected LAIp was then fed into the model to simulate the Yp.
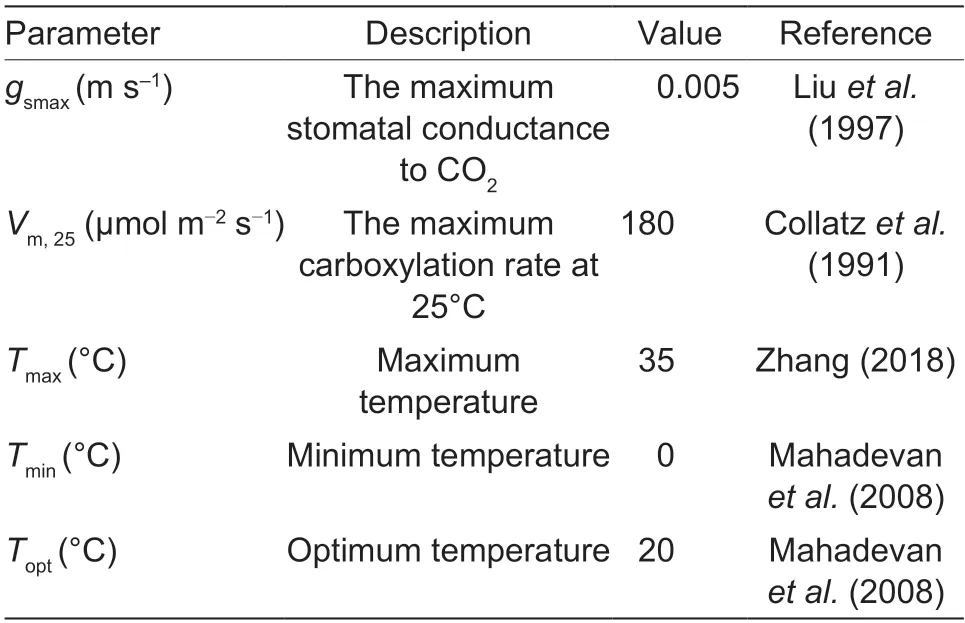
Table 2 The parameters in the PRYM-Wheat Model for this study
This study used the LAI obtained using remote sensing to simulate the LAIp (Zhang 2018;Zhanget al.2021b):
(1) Simulation of a curve of LAI with date (Cs).
whereLAISdenotes the simulated LAI value;j denotes the number of days from seedling emergence;andJMTandJSKdenote the numbers of days from seedling emergence at the maturity and gestation stages,respectively. The simulated curve is:
(2) The relationship between Cs and LAI obtained through remote sensing was analyzed using the least squares method. LAI was corrected using the regression coefficientsaLAIpandbLAIp.
YG is the difference between Yp and Ya,and reflects the space for Yp improvement in the study area. A larger YG indicates a higher potential for yield increase. The calculation formula is as follows:
Identification of the regional priority for increasing yieldThe analysis of crop YG enables the prioritization of research and policy for provinces with a YG for improving their crop yields. We compared the 2015–2019 Yp and YG averages for each location with the Yp and YG averages for the whole North China Plain to prioritize the provinces into four classes (Wang Jet al.2019). The calculation formula is as follows:
wherer1andr2are judgment factors;Ypavgis the average Yp for the entire study area;andYGavgis the average YG for the entire study area.
3.Results
3.1.Evaluation of simulated yield
The simulated yields at the city level for each year in the statistical study area were verified by comparing them with the municipal statistical yield data obtained from the statistical yearbooks(Anhui Provincial Bureau of Statistics 2019;Hebei Provincial Bureau of Statistics 2019;Henan Provincial Bureau of Statistics 2019;Jiangsu Provincial Bureau of Statistics 2019;National Bureau of Statistics 2019;Shandong Provincial Bureau of Statistics 2019),and the results showed that there was a significant correlation between the simulated Ya and the statistical yields of the municipal units (Fig.2). Thervalues ranged from 0.56 to 0.66,indicating that the actual winter wheat yield results simulated by the model at the regional scale were much more accurate.
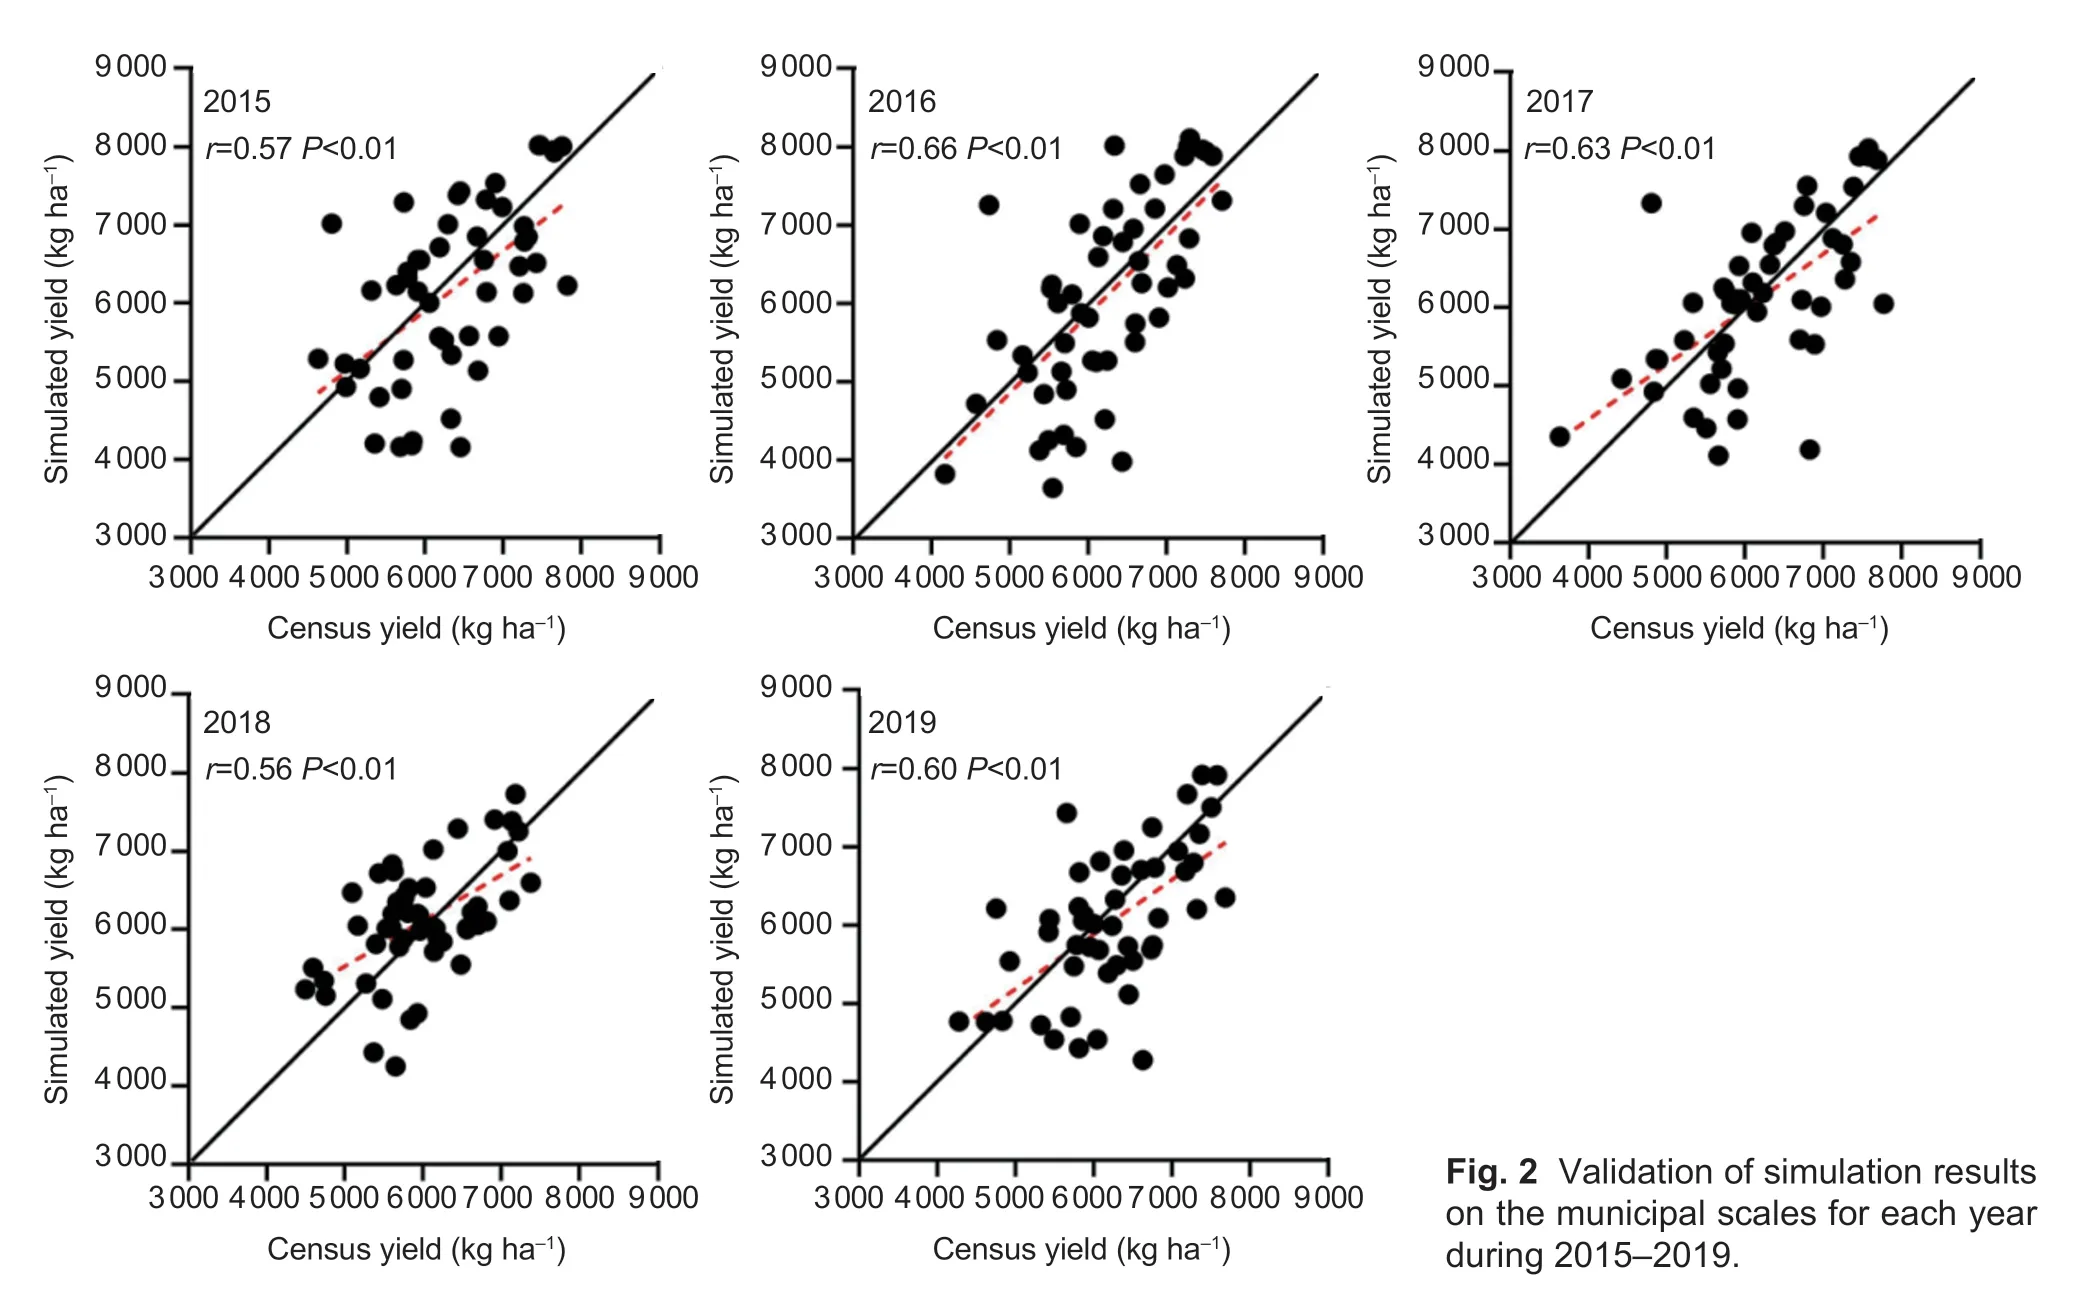
Fig.2 Validation of simulation results on the municipal scales for each year during 2015–2019.
The simulated Ya and statistical yield five-year averages for each province are shown in Table 3. The location with the lowest Ya was Beijing at 4 050.6 kg ha–1,and the highest was Anhui Province at 7 265.9 kg ha–1.The location with the lowest statistical yield was Beijing at 5 420.5 kg ha–1,and the highest location was Anhui at 6 591.5 kg ha–1.
The simulated actual winter wheat yields in the North China Plain from 2015 to 2019 are shown in Fig.3.The mean actual winter wheat yield simulated in the study area from 2015 to 2019 was 5 532.2 kg ha–1. The distribution characteristics of Ya in different years are consistent. The spatial pattern is also consistent with the average distribution rule of simulated Ya in five years,generally decreasing from southeast to northwest. The high Ya was mainly distributed in the east and south,and the low Ya was mainly distributed in the north and west of the study area.
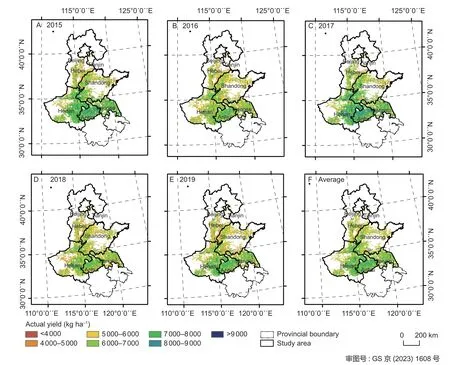
Fig.3 Spatial distributions of actual winter wheat yield by year and five-year average actual yields in the North China Plain for each year from 2015 to 2019.
3.2.Yield potential and yield gap
The distributions of the average Yp and average YG of winter wheat in the North China Plain from 2015 to 2019 are shown in Fig.4. The distribution of Yp showed great spatialheterogeneity,decreasing from southeast to northwest.Low YG regions are mainly distributed in the central and southern portions of the study area,while high YG values are mainly distributed in the southeastern region.
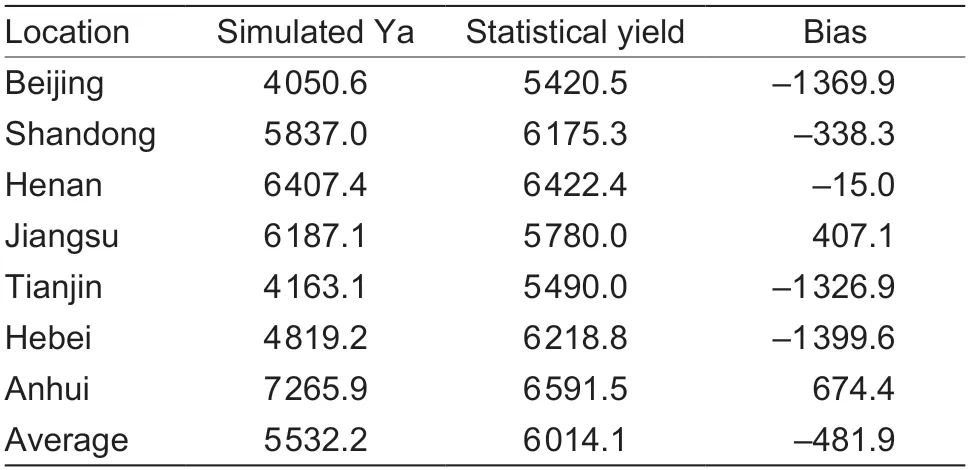
Table 3 Simulated actual yields (Ya) by province and the statistical yield 5-year averages (kg ha–1)
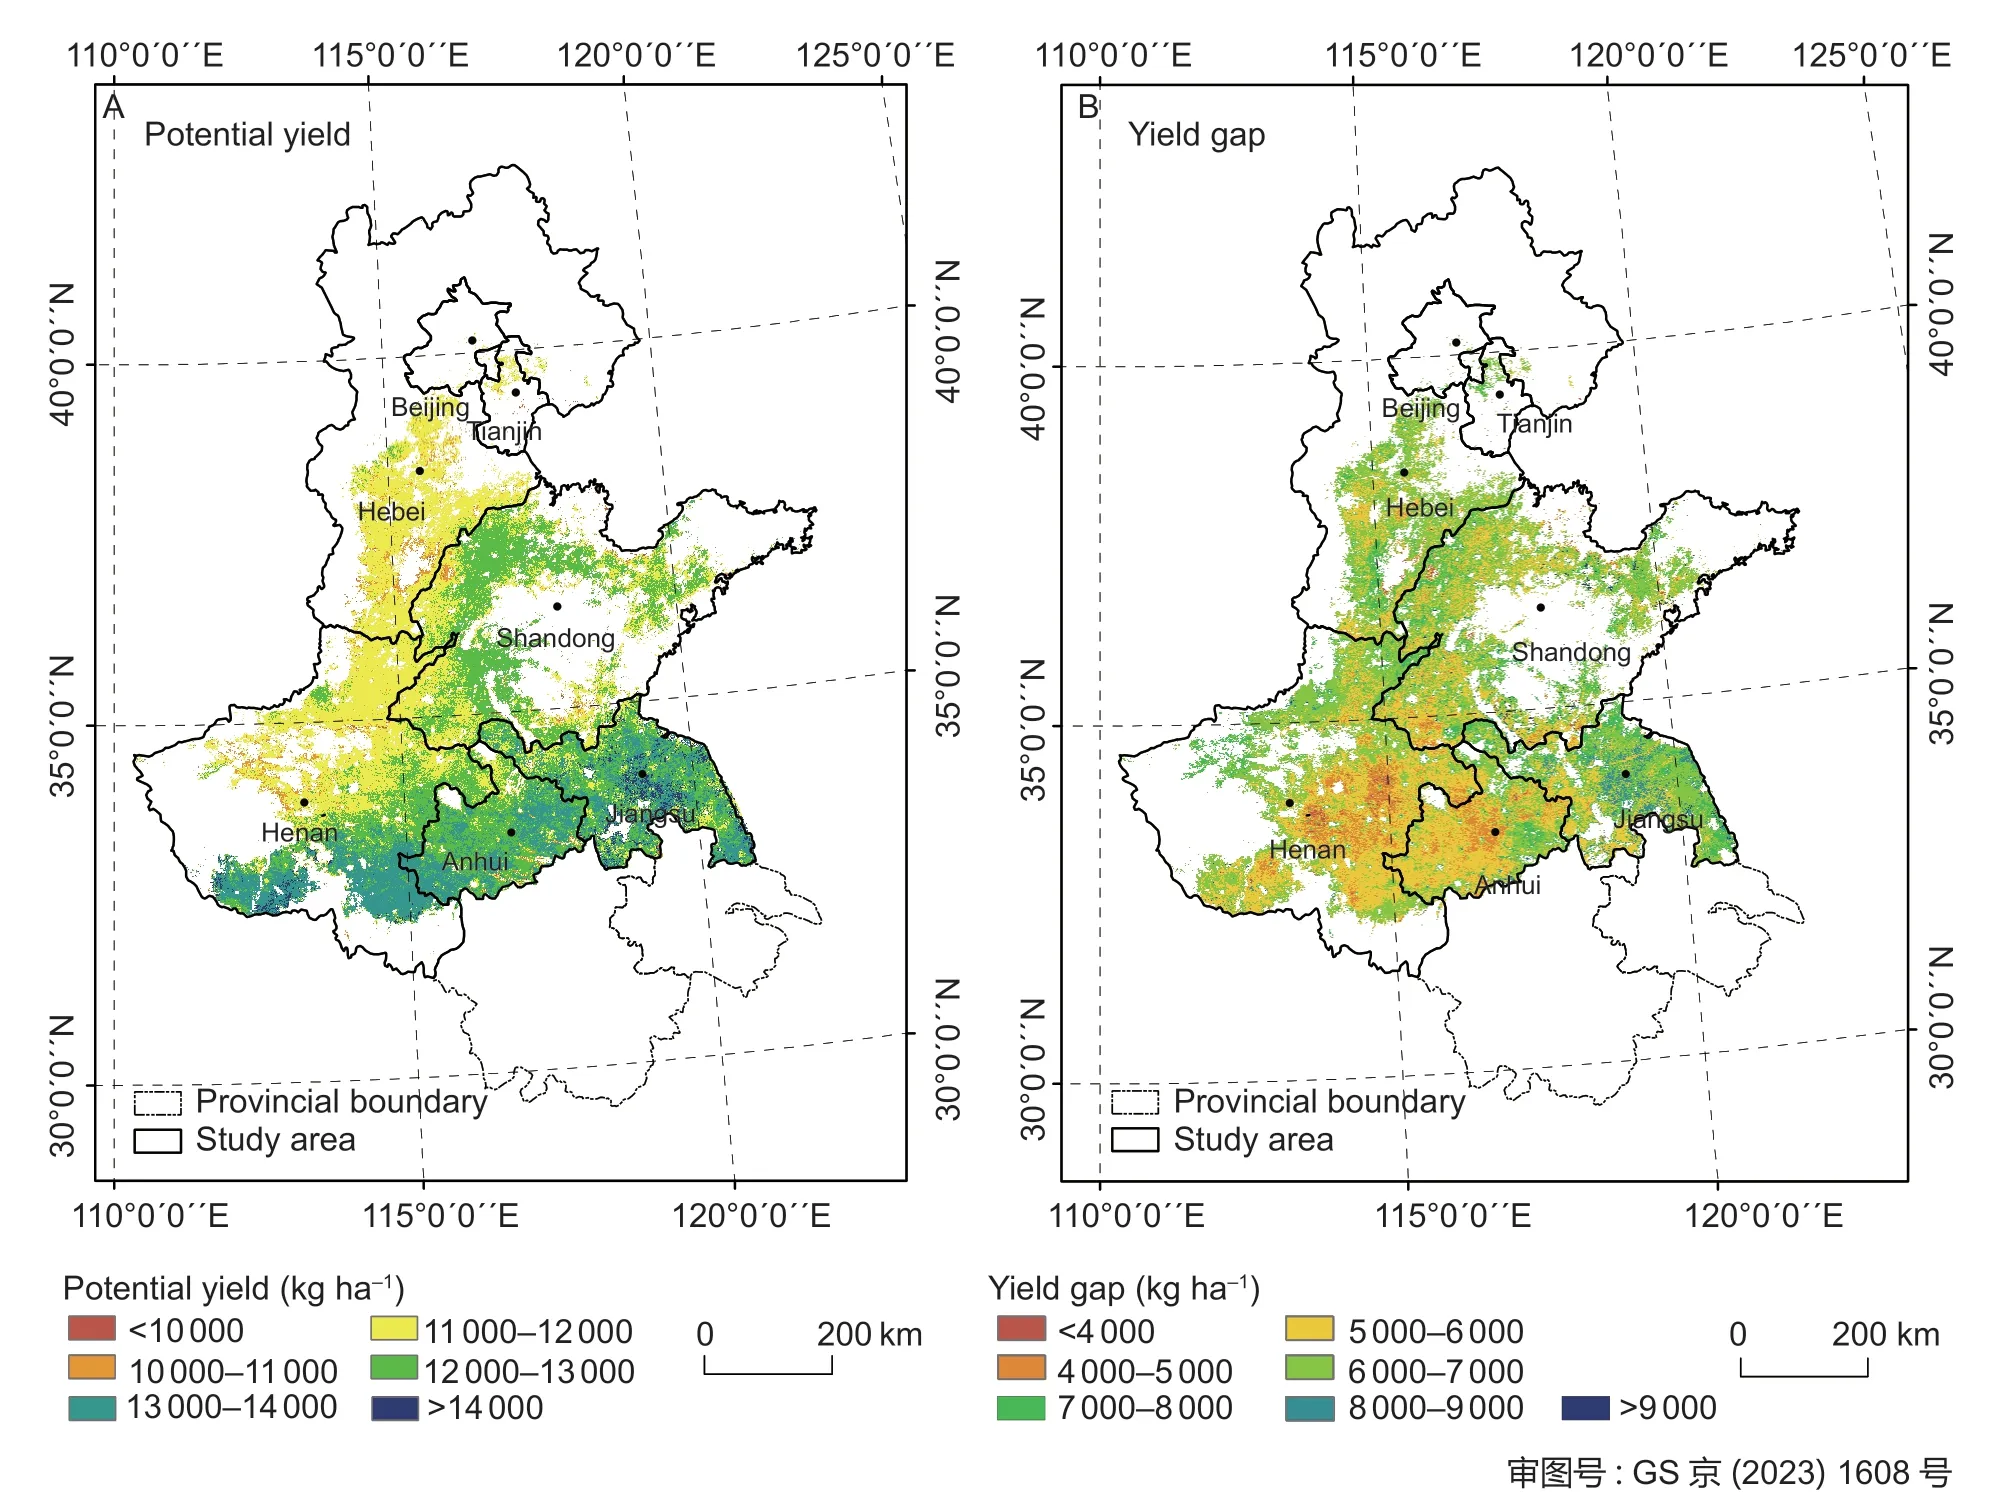
Fig.4 Spatial distribution of average potential yield and average yield gap for 2015–2019.
The simulated Yp and YG values of the five-year averages of each province are shown in Table 4. The average Yp in the whole study area was 11 933.5 kg ha–1and the average YG was 6 400.6 kg ha–1. Taking locations as the statistical units,the location with the lowest Yp was Tianjin at 10 317.4 kg ha–1and the highest location was Jiangsu at 13 494.5 kg ha–1. The location with the lowest YG was Anhui Province at 5 842.1 kg ha–1and the highest was Jiangsu Province at 7 307.4 kg ha–1. Note that all provinces and cities still had much space for yield improvement. The 5-yr averages of simulated Ya,Yp,and YG for each city are listed in Appendix A.
3.3.Regional priorities for closing the yield gap
Using the location as the statistical unit,the Yp and YG values obtained from the statistical simulation were used to calculate each location’s yield enhancement priority,as shown in Table 5,and the spatial distribution is shown in Fig.5.
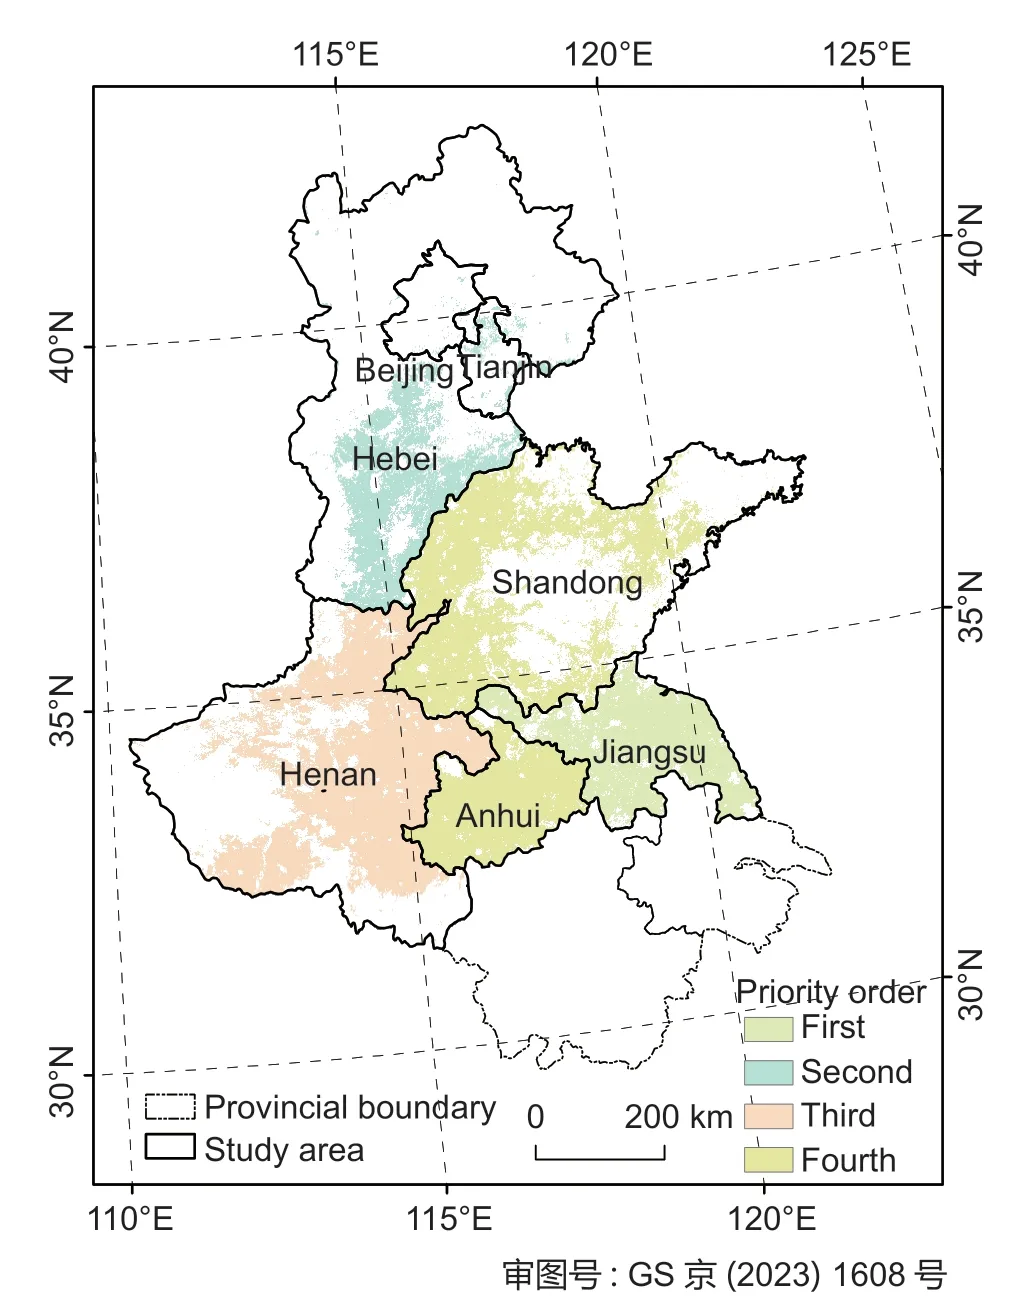
Fig.5 Distribution of priority order in North China Plain.
In Table 5,the first priority refers to areas with high Yp and a relatively large YG. In these areas,closing the existing gap can produce a large amount of Ya. The second priority refers to those with relatively high YG but low Yp values. This means that the upper limit of Ya is relatively low,although there is still a lot of space for Ya improvement.The third priority indicates that both Yp and YG are lower than their regional average levels. Because YG is relatively low,Ya can only be improved by improving the deficiency in Yp. The last (fourth) priority is high Yp paired with low YG,where there is limited space for yield increase.
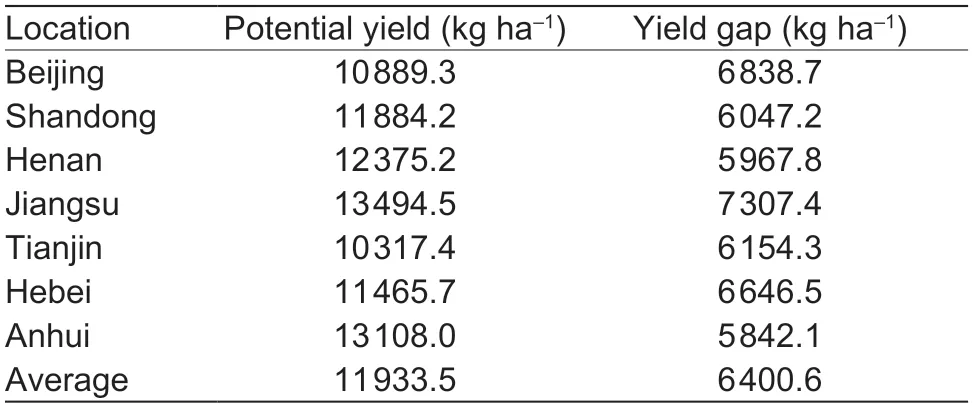
Table 4 Five-year averages of simulated potential yield and yield gap by location
3.4.Responses of the yield gap to environmental factors
Variations in crop yields can be explained by a complex interplay of factors,with temperature,precipitation and elevation playing a crucial role in the growing season (Klijnet al.1994;Franchet al.2019;Schwalbertet al.2020;Caoet al.2022). The distribution of environmental factors in the study area was analyzed by calculating the average annual accumulation temperature (AT) of >0°C,precipitation (PR)and elevation during the main winter wheat growth period.The distribution characteristics of these environmental factors in the North China Plain are shown in Fig.6,which clearly shows the obvious spatial variations of AT,PR and elevation in the study area. The winter wheat AT in the study area shows a decreasing distribution pattern from south to north and from the middle to both sides. The PR decreases gradually from (east) south to (west) north,and the low values are mainly distributed in Hebei,Beijing and Tianjin. High elevations are mainly distributed in the northern and western portions of the study area.
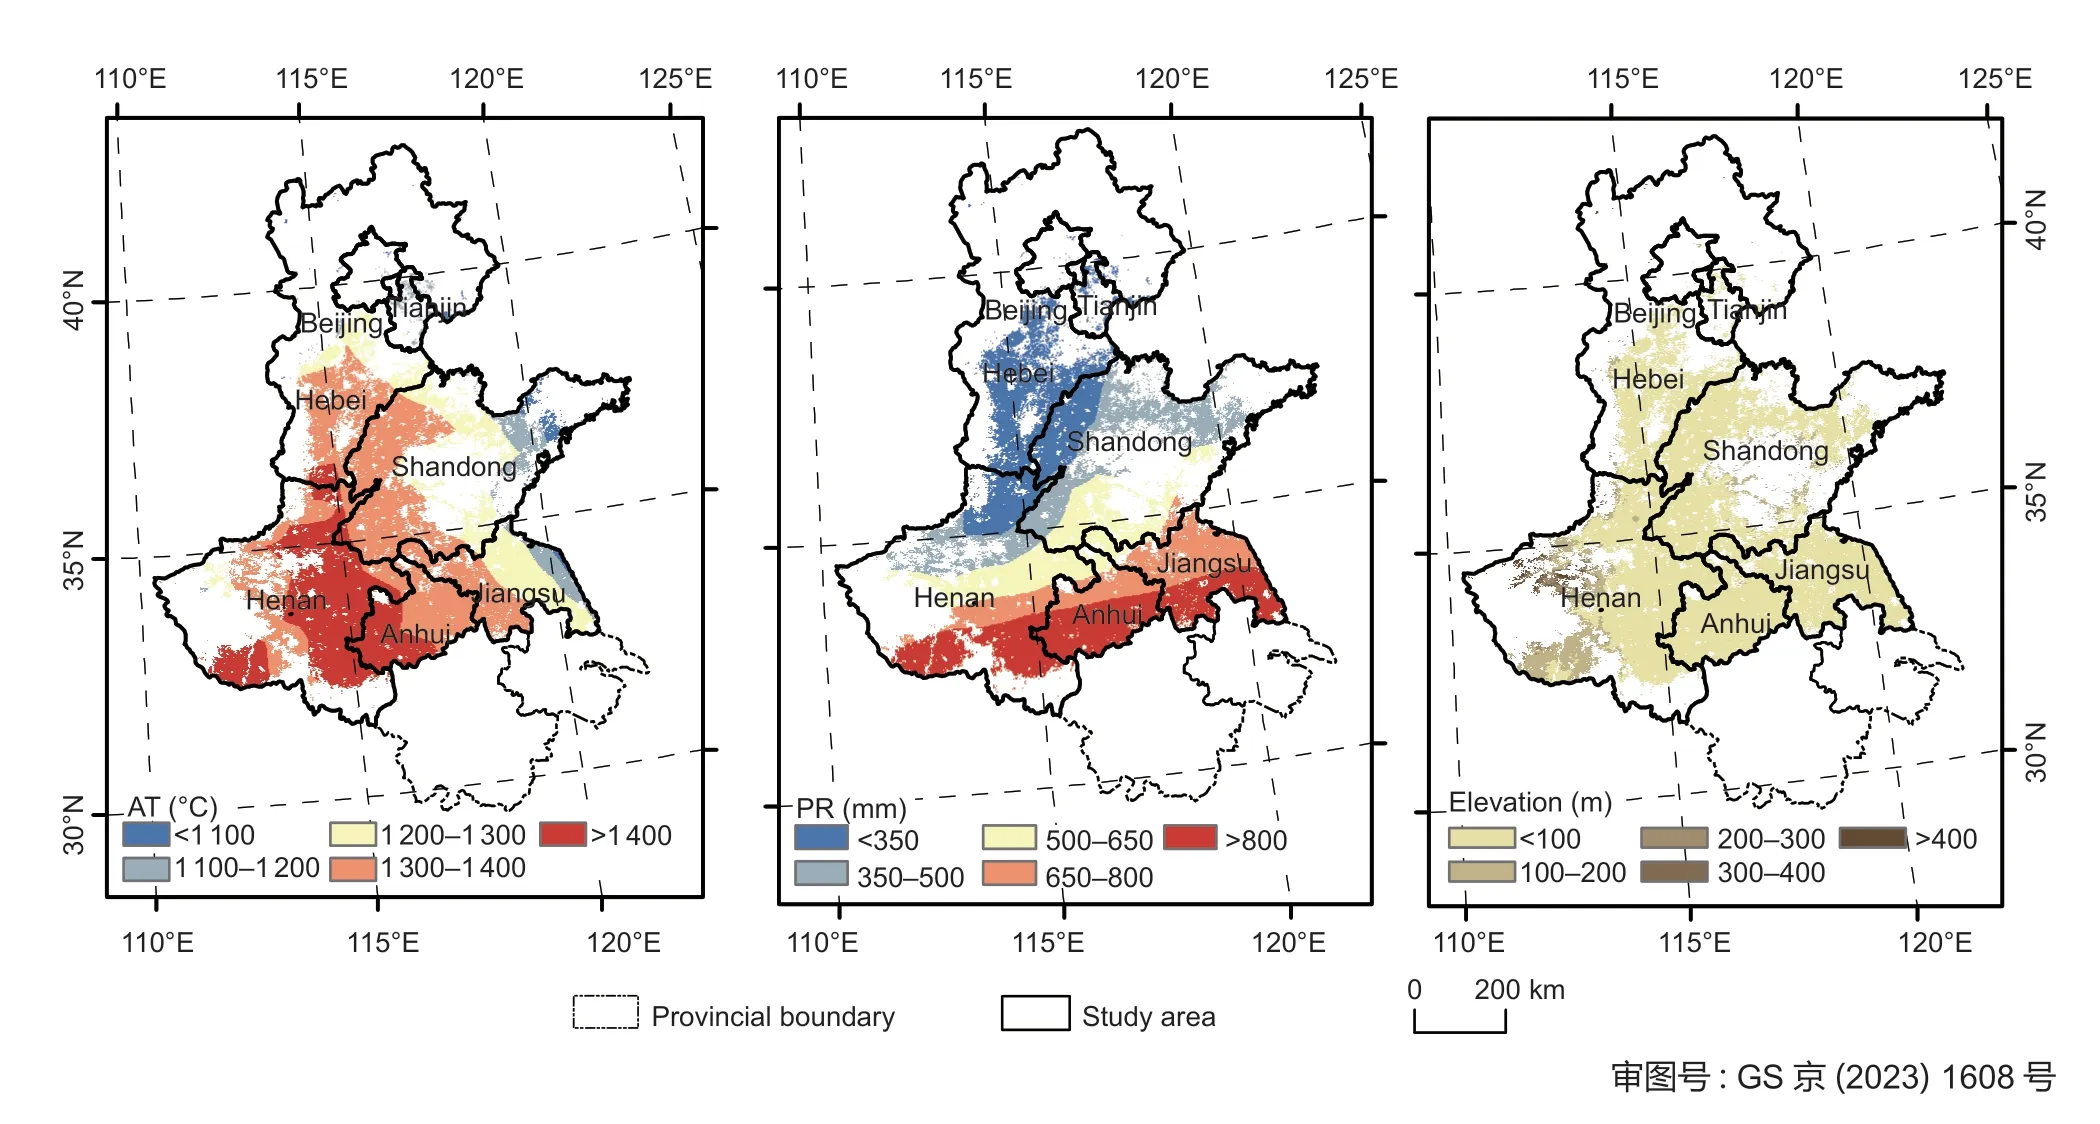
Fig.6 Spatial distributions of environmental factors (accumulation temperature (AT),precipitation (PR) and elevation) in the North China Plain from 2015–2019.
The correlations between the YG and these three environmental factors at the city level for 2015–2019 are shown in Fig.7. There is a weak negative correlation between AT and YG. For every 1°C increase in AT,the YG decreases by about 2.57 kg ha–1. In addition,there is no significant correlation between PR and YG,but there is a clear positive correlation between YG and elevation.
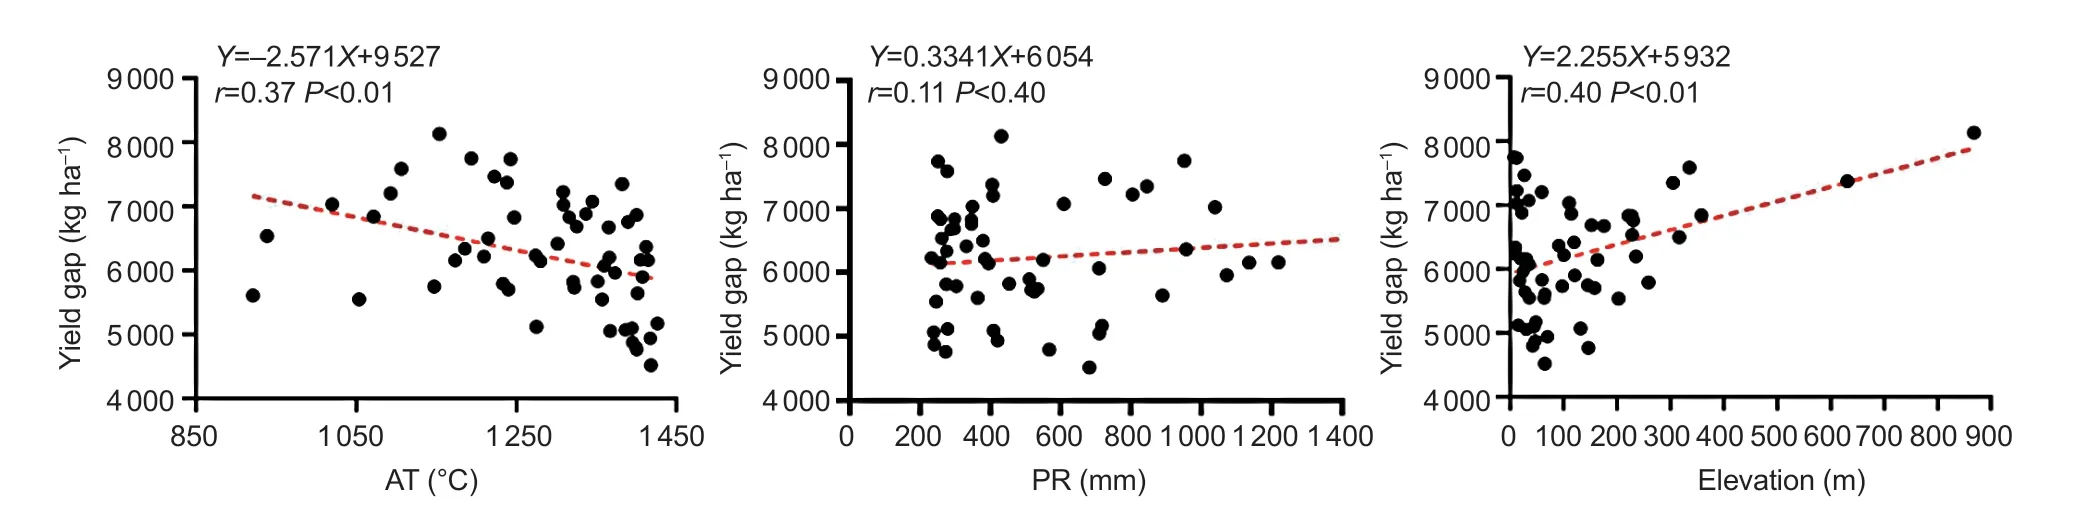
Fig.7 Correlations of yield gap (YG) with the environmental factors of accumulation temperature (AT),precipitation (PR) and elevation.
4.Discussion
4.1.Uncertainties in yield estimation
There are a few of uncertainties in the yield estimates,including the model structure and the uncertainties in the input data. In the yield estimation,we used an HI based linear model to derive yield based on NPP. The HI was set to 0.5 when simulating the Ya and 0.6 when simulating the Yp in the study area. Previous studies have found that the HI of the same crop shows differences under different environmental conditions (Yaoet al.2015),and in the case of a long time series,the HI of the same crop shows a gradual increase (Pan and Deng 2007). However,in the actual simulation situation,HI is usually set as a constant because of the lack of accurate data. Some additional uncertainties could also be introduced due to the quality of satellite-retrieved vegetation input data (Wang Jet al.2019). Meteorological data are interpolated from site values to regional values,and a series of uncertain factors are introduced in the process of interpolation. Therefore,there is uncertainty in the simulation of yield.
4.2.Factors affecting yield
This study simulated the Ya of winter wheat in the North China Plain on a regional scale using a remote sensingbased model. Over the period of 2015–2019,the simulated Ya was relatively stable and the distribution characteristics of Ya in different years were consistent.However,the priority for upgrading yield varies between locations (Table 5). The location with the highest yield improvement priority was Jiangsu Province,located in the southeastern part of the North China Plain. The Yp there is the highest,and the YG is also the highest. This indicates that the environmental conditions in this region are quite favorable for the growth and development process of winter wheat. However,due to the imperfect input decisionmaking of farmers,the level of production and cultivation management,and other social factors,the provincial environmental conditions have not been fully utilized,so there is still great potential for increasing production (Wang Y Let al.2019). Narrowing the YG by suitable agricultural management practices is very essential for improving current winter wheat yields (Yang and Liu 2014;Yaoet al.2021). Proper knowledge of agriculture and improved crop cultivation techniques by farmers may significantly increase the Ya of winter wheat cultivation (Tittonell and Giller 2013;Stuartet al.2016). The renewal of highly productive seed varieties by adjusting the growth period and genetic characteristics can provide better adaptation to climate change and improve the Ya (Liuet al.2010).In addition,improved field management practices,such as proper fertilization and irrigation,proper plant density and insect pest control,can improve Ya and narrow the YG (Egli 2008). In this study,due to the uncertainty of the model and the complexity of the actual situation,the effects of diseases and insect pests,precipitation and farmers’irrigation decisions were not taken into account regarding their potential effects on the yield of winter wheat,and this is an area where the model needs further improvement. In the future,this approach should be combined with many field experiments and simulation results to analyze the effects of cultivation management measures on winter wheat yield at the regional scale.
Environmental factors are the key factors affecting wheat yields (Javedet al.2021;Yanget al.2022). By analyzing the correlations between YG and three key environmental factors,we found a weak correlation between YG and AT but no significant correlation with PR,indicating that AT and PR have only small effects on YG. However,crop cultivation is closely related to environmental factors,so this study further analysed the response correlations of Ya and Yp with AT,PR and elevation (Fig.8). There are clear positive correlations between Ya and Yp and AT and PR: for every 1°C increase in temperature,Ya increases by about 6.0 kg ha–1and Yp by about 3.4 kg ha–1;for every 1 mm increase in precipitation,Ya increases by about 1.8 kg ha–1and Yp by about 2.2 kg ha–1. In addition,Ya is negatively correlated with elevation,but there is no significant correlation between Yp and elevation. This difference may be due to the flat terrain in most areas,which is not the main factor affecting Yp. Therefore,there is a clear positive correlation between YG and elevation. Some studies have shown that the North China Plain has become more heat-rich in the context of global warming,with an overall trend of increasing cumulative temperatures (Maet al.2010). Thus,while the current wheat yield is relatively stable,it may change due to future climate change.
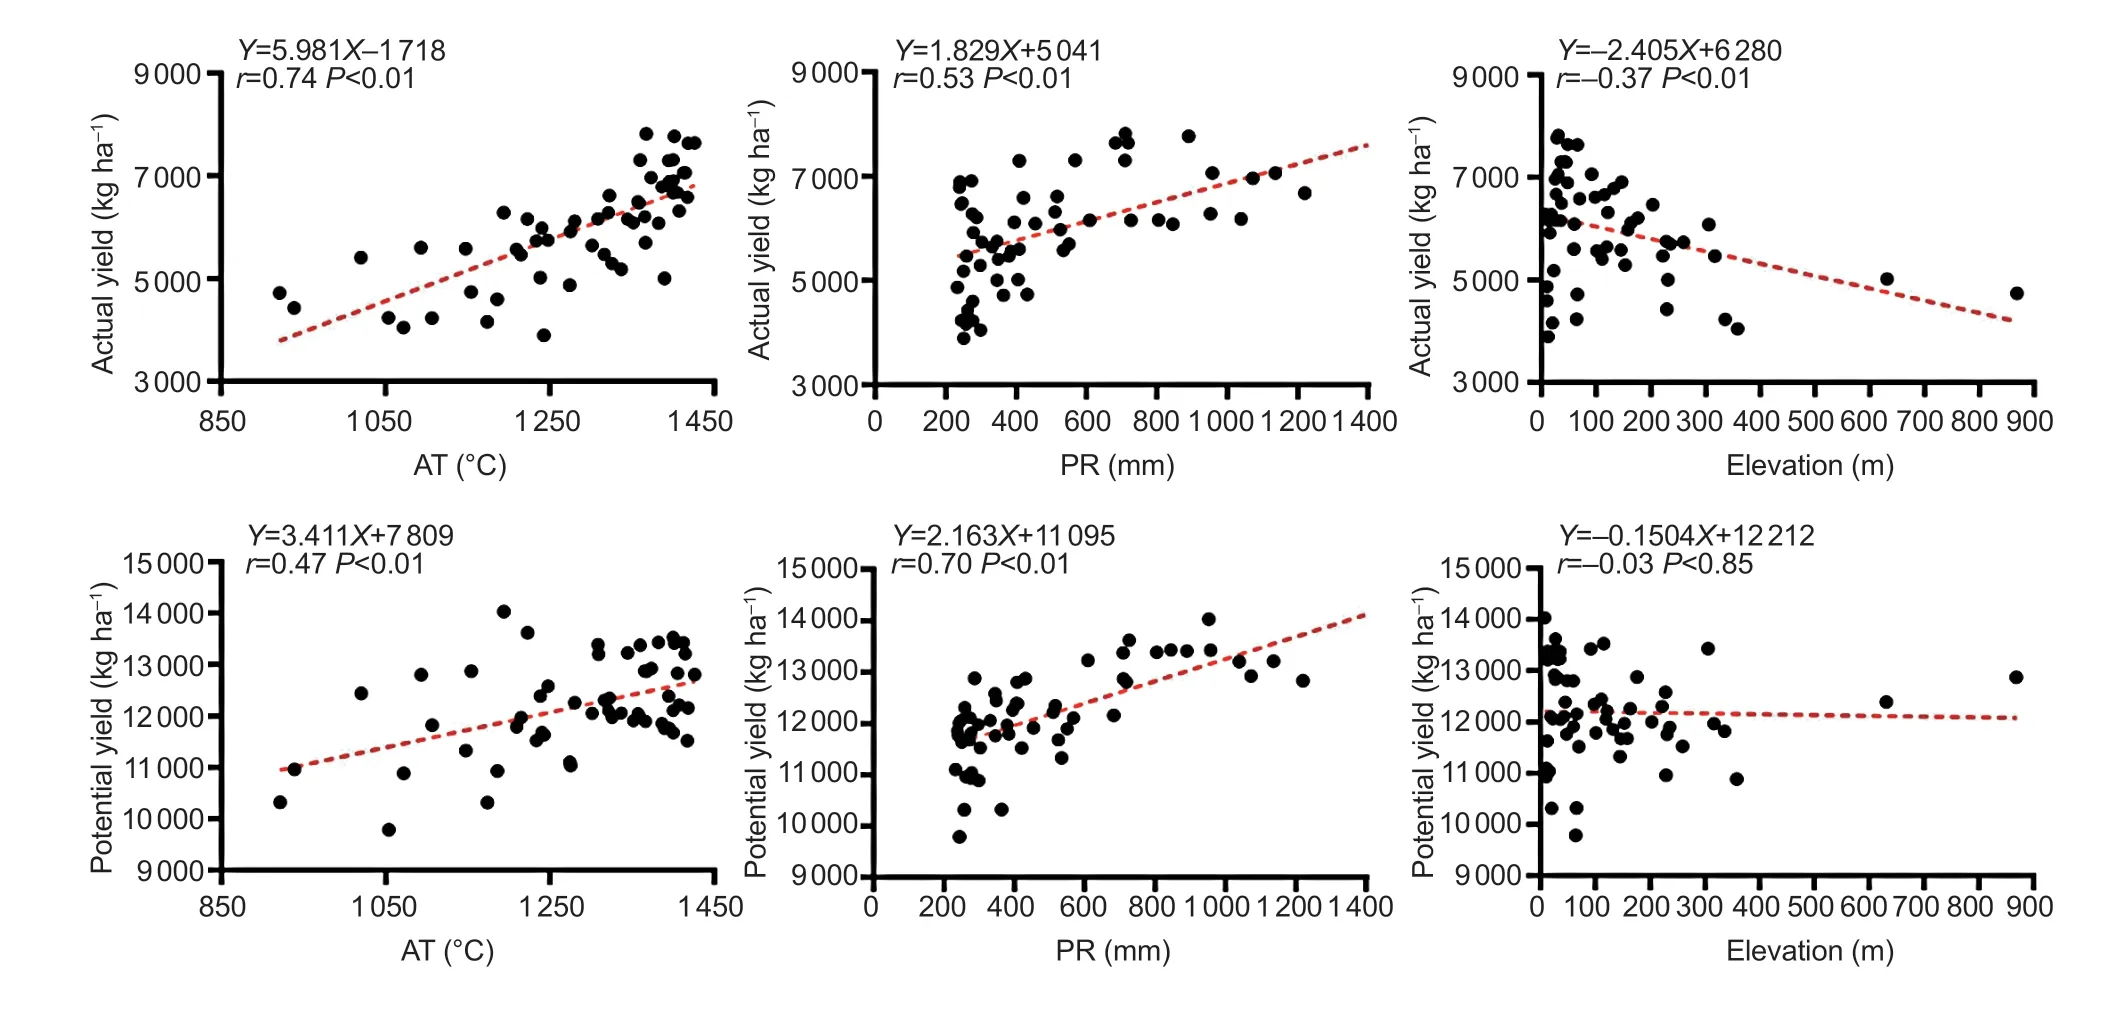
Fig.8 Correlations of actual yield (Ya) and potential yield (Yp) with the environmental factors of accumulation temperature (AT),precipitation (PR) and elevation.
5.Conclusion
This study used the PRYM-Wheat Model to simulate the Ya and Yp of winter wheat in the North China Plain from 2015 to 2019. The comparison and validation of the simulation results with the statistical yield data of winter wheat at the city level showed that the model is reliable and applicable for simulating winter wheat yield in the North China Plain.The distributions of both Ya and Yp show decreasing trends from southeast to northwest. In addition,we analyzed the spatial distribution of the winter wheat YG and identified priorities for yield improvement in each location. The high priority locations in the North China Plain are Jiangsu Province,Beijing,Tianjin and Hebei Province,where the main way to increase yield is to narrow the existing YG. In areas such as Henan,Anhui and Shandong provinces,the YG is relatively small,so increasing the upper limit of Yp is necessary to further increase the yield. We also analyzed the responses of yield to meteorological factors. For every 1°C increase in AT,the Ya increases by about 6.0 kg ha–1and the Yp increases by about 3.4 kg ha–1,but the YG decreases by about 2.57 kg ha–1. For every 1 mm increase in PR,the Ya increases by about 1.8 kg ha–1and the Yp increases by about 2.2 kg ha–1,but there is no significant correlation between PR and YG. For elevation,there is a clear positive correlation between YG and elevation.
Acknowledgements
This work was jointly supported by the Shandong Key Research and Development Project,China (2018GN C110025),the National Natural Science Foundation of China (41871253),the Central Guiding Local Science and Technology Development Fund of Shandong —Yellow River Basin Collaborative Science and Technology Innovation Special Project,China (YDZX2023019),the Natural Science Foundation of Shandong Province,China(ZR2020QD016),and the “Taishan Scholar” Project of Shandong Province,China (TSXZ201712).
Declaration of competing interest
The authors declare that they have no conflict of interest.
Appendixassociated with this paper is available on https://doi.org/10.1016/j.jia.2023.02.003
 Journal of Integrative Agriculture2023年10期
- Journal of Integrative Agriculture的其它文章
- The association between the risk of diabetes and white rice consumption in China: Existing knowledge and new research directions from the crop perspective
- Linking atmospheric emission and deposition to accumulation of soil cadmium in the Middle-Lower Yangtze Plain,China
- Genome-wide association study for numbers of vertebrae in Dezhou donkey population reveals new candidate genes
- Are vulnerable farmers more easily influenced? Heterogeneous effects of lnternet use on the adoption of integrated pest management
- lnfluences of large-scale farming on carbon emissions from cropping:Evidence from China
- Spatio-temporal variations in trends of vegetation and drought changes in relation to climate variability from 1982 to 2019 based on remote sensing data from East Asia