
Global patterns of taxonomic and phylogenetic diversity of flowering plants: Biodiversity hotspots and coldspots
2023-07-11 08:20:24HongQianJianZhangMeichenJiang
植物多樣性 2023年3期
Hong Qian , Jian Zhang , Meichen Jiang
a Research and Collections Center, Illinois State Museum,1011 East Ash Street, Springfield, IL 62703, USA
b Center for Global Change and Complex Ecosystems, Zhejiang Tiantong Forest Ecosystem National Observation and Research Station, School of Ecological and Environmental Sciences, East China Normal University, Shanghai 200241, China
c Shanghai Institute of Pollution Control and Ecological Security, Shanghai 200092, China
Keywords:Angiosperm Biodiversity hotspot Phylogenetic diversity Phylogenetic structure Species richness
A B S T R A C T Species diversity of angiosperms(flowering plants)varies greatly among regions.Geographic patterns of variation in species diversity are shaped by the interplay of ecological and evolutionary processes.Here,using a comprehensive data set for regional angiosperm floras across the world, we show geographic patterns of taxonomic (species) diversity, phylogenetic diversity, phylogenetic dispersion, and phylogenetic deviation (i.e., phylogenetic diversity after accounting for taxonomic diversity) across the world.Phylogenetic diversity is strongly and positively correlated with taxonomic diversity; as a result,geographic patterns of taxonomic and phylogenetic diversity across the world are highly similar.Areas with high taxonomic and phylogenetic diversity are located in tropical regions whereas areas with low taxonomic and phylogenetic diversity are located in temperate regions, particularly in Eurasia and North America,and in northern Africa.Similarly,phylogenetic dispersion is,in general,higher in tropical regions and lower in temperate regions.However, the geographic pattern of phylogenetic deviation differs substantially from those of taxonomic and phylogenetic diversity and phylogenetic dispersion.As a result,hotspots and coldspots of angiosperm diversity identified based on taxonomic and phylogenetic diversity and phylogenetic dispersion are incongruent with those identified based on phylogenetic deviations.Each of these metrics may be considered when selecting areas to be protected for their biodiversity.
1.Introduction
Vascular plants, which include ~369,000 species (Qian et al.,2022b), are important not only in themselves but also in determining the diversity of many other groups of organisms(Pimm and Joppa, 2015).They are crucial components of nearly all terrestrial and many aquatic habitats.Species diversity of plants varies greatly among regions (Rosenzweig, 1995).Geographic patterns of variation in species diversity are shaped by the interplay of ecological and evolutionary processes (Ricklefs, 1987).Thus, knowledge of geographic patterns of taxonomic and phylogenetic diversity for major groups of organisms,such as plants,across the world,and of the relationship between these two dimensions of biodiversity(i.e.,taxonomic diversity and phylogenetic diversity), is important to understanding the formation and maintenance of biodiversity in a particular region and its spatial variation among regions.
Species richness(i.e.,the number of species in an area)has been commonly used as a measure of taxonomic diversity at the species level.Much of variation in species richness can be explained by contemporary climate (Currie, 1991; Qian et al., 2019), and substantial amounts of the variation in species richness that are not explained by contemporary factors have been attributed to the effects of evolutionary history (Ricklefs, 1987), which include the differential effects of processes of diversification and dispersal between regions (Rahbek and Graves, 2001; Currie et al., 2004;Rahbek et al.,2007;Fritz and Rahbek,2012).Phylogenetic diversity,or ‘phylodiversity’in short, measures the length of evolutionary pathways that connect a given set of taxa (i.e., the acumination of evolutionary histories of the taxa) (Faith, 1992), and is an evolutionary measure of biodiversity (Faith, 1992; Miller et al., 2018).Although species richness in areas across a broad spatial extent is often positively correlated with phylogenetic diversity (Voskamp et al., 2017; Qian et al., 2019), areas of high species richness may not always match areas of high phylogenetic diversity(Zupan et al.,2014; Qian and Deng, 2021).Two areas with the same number of species may substantially differ in phylogenetic diversity if one area harbors closely related species and the other area harbors distantly related species.For example,when species richness and climate are statistically controlled for, eastern Asia has a significantly higher phylogenetic diversity than does eastern North America for angiosperms (Qian et al., 2017).Thus, it is possible that an area with higher species richness may have substantially lower phylogenetic diversity than an area with lower species richness.Knowledge of higher or lower phylogenetic diversity of an area with respect to taxonomic diversity of the area can shed light on evolutionary processes generating biodiversity patterns across areas.
Many major clades originated and diversified when the Earth's climate was warm and wet (Wiens and Donoghue, 2004;Donoghue, 2008).Because traits that confer cold or drought tolerance are often slow to evolve (Latham and Ricklefs, 1993; Wiens and Donoghue, 2004; Kellermann et al., 2012; Zanne et al., 2014),many clades tend to be constrained to tropical conditions,with only occasional evolutionary breakthroughs into temperate conditions.Species in colder or drier climates are expected to be, on average,more closely related to each other(more phylogenetic clustering or less phylogenetic dispersion) (Latham and Ricklefs, 1993; Wiens and Donoghue, 2004).Although previous studies have tested this prediction for continental or regional floras,geographic patterns of phylogenetic dispersion for plants at the global extent have not been investigated.
Angiosperms (i.e.flowering plants), which include ~354,000 species,account for 94%of vascular plant species in the world(Qian et al., 2022b).Here, we investigate geographic patterns of species richness, phylogenetic diversity, phylogenetic deviation, and phylogenetic dispersion for angiosperms in regional floras across the world; we identify biodiversity hotspots (i.e., areas with unusually high levels of biodiversity) and biodiversity coldspots (i.e.,areas with unusually low levels of biodiversity) (Kareiva and Marvier, 2003; Schr¨oter et al., 2017) across the globe based on taxonomic and phylogenetic diversity as well as phylogenetic deviation (i.e., the deviation between taxonomic and phylogenetic diversity).We exclude non-angiosperms (e.g., pteridophytes and gymnosperms) from this study because geographic patterns of phylogenetic diversity and dispersion of non-angiosperms are very different from, and sometime opposing to, those of angiosperms(Letcher,2010;Coyle et al.,2014;Feng et al.,2014;Qian et al.,2019;Omer et al.,2022),and simultaneously including both angiosperms and non-angiosperms in a phylogeny-based analysis might mask patterns evident in each group separately.As a result,many studies suggest that it is inappropriate to simultaneously include angiosperms and non-angiosperms in an analysis of phylogenetic diversity and dispersion(e.g.,Letcher,2010;Coyle et al.,2014;Omer et al.,2022).
2.Materials and methods
2.1.Regional floras across the world
The globe was divided into geographic regions based on Brummitt (2001) and Zhang et al.(2018).Small oceanic islands were excluded from this study.As a result,a total of 391 geographic regions were used in this study (Fig.S1); each region has, on average, 342,669 km2.Species lists of native angiosperms for the regions were compiled based on World Plants (https://www.worldplants.de) and Plants of the World online (http://www.plantsoftheworldonline.org), which were supplemented with botanical data from other sources (e.g., Charkevicz, 1985-1996;Krasnoborov et al., 1988-1997).We standardized the botanical nomenclature according to World Plants (https://www.worldplants.de), using the package U.Taxonstand (Zhang and Qian, 2023), and combined infraspecific taxa with their respective species.A total of 341,846 species of angiosperms were included in this study.
2.2.Phylogenetic tree
We used the package U.PhyloMaker (Jin and Qian, 2023) to generate a phylogenetic tree for the angiosperm species included in this study.Specifically, we used the megatree GBOTB.extended.WP.tre (Jin and Qian, 2022), which was derived from the megatrees reported in Smith and Brown (2018) and Zanne et al.(2014), as a phylogenetic backbone, the functions build.nodes.1 and Scenario 3 (Jin and Qian, 2022, 2023) to generate the phylogenetic tree.Because over three quarters of the angiosperm genera in the world were included in the megatree GBOTB.extended.WP.tre, the phylogenetic tree that we generated was well resolved at the genus level.Previous studies(e.g.,Fritz and Rahbek,2012; Lehtonen et al., 2015; Qian and Jin, 2021) showed that patterns of phylogenetic diversity and structure are similar regardless of whether the phylogeny used is resolved at the genus or species level.Thus,the phylogenetic tree that we generated would result in reliable values of phylogenetic metrics used in this study(see below for details).Phylogenetic trees generated by U.PhyloMaker or its sister packages(Qian and Jin,2016;Jin and Qian,2019,2022)have been commonly used in studies on phylogenetic diversity and structure in regional and global floras (e.g.Qian et al., 2017, 2019;Yue and Li, 2021; Zhang et al., 2021; Cai et al., 2022; Qian, 2023;Zhou et al., 2023).
2.3.Taxonomic and phylogenetic diversity
Species richness is often linearly correlated with logtransformed sampling area (Rosenzweig, 1995; r = 0.414 for the data set analyzed in this study).To account for the effect of area variation on species richness in our study, we divided the number of species in each region by the log10-transformed area (in square kilometer) of the region, a method commonly used in previous studies to account for variation in sampling area(e.g.,Fridley et al.,2006; Qian et al., 2019; Guo et al., 2021).Area-corrected species richness in each region was considered as a measure of taxonomic diversity(TD)in the region.Species richness that was not corrected for area was shown in Fig.S2.
Faith's phylogenetic diversity (Faith,1992) is a commonly used metric for quantifying phylogenetic diversity.It is the sum of all phylogenetic branch lengths that connect species in an assemblage.Because phylogenetic diversity increases with species richness,which increases with sampling area, we divided Faith's phylogenetic diversity in each region by the log10-transformed area (in square kilometer)of the region to account for variation in sampling area, as we did for species richness.Area-corrected Faith's phylogenetic diversity in each region was considered as a measure of phylogenetic diversity (PD) in the region.Phylogenetic diversity that was not corrected for area was shown in Fig.S2.
When analyzing the data set of the 391 regions across the world,to determine whether PD of each region is higher or lower relative to TD of the region,we assess the deviation between normalized PD and normalized TD (i.e., mean = 0 and SD = 1 for both PD and TD after normalization;Pio et al.,2011;Scherson et al.,2014;Qian and Deng, 2021).Specifically, PD and TD in each of the 391 regions across the globe are normalized separately by subtracting each value from the mean of the values for all the regions and then dividing it by the standard deviation.The deviation between normalized PD and normalized TD (hereafter, PDdev) results from normalized PD being subtracted by normalized TD (i.e.,PDdev=normalized PD-normalized TD).Because deviation of PD for a region is determined by comparing PD with TD of the region,the approach is akin to using the relationship between taxonomic diversity and phylogenetic diversity as a simple null model to account for sampling effects of different levels of taxonomic diversity among regions (Fritz and Rahbek, 2012; Qian and Deng, 2021).PDdevrepresents phylogenetic diversity after accounting for taxonomic diversity.A positive PDdevfor a region indicates that PD is higher than TD for the region whereas a negative PDdevrepresents that PD is lower than TD (see Discussion for possible causes of PDdev).
We identified regions with the highest 10%of TD and PD values as hotspots of taxonomic and phylogenetic diversity, respectively,and regions with the lowest 10%of TD and PD values as coldspots of taxonomic and phylogenetic diversity, respectively, as in Qian and Deng (2021).Similarly, we identified regions with the highest 10%of all PDdevvalues as hotspots of phylogenetic diversity and regions with the lowest 10%of all PDdevvalues as coldspots of phylogenetic diversity for angiosperms in the world, after accounting for taxonomic diversity.
2.4.Phylogenetic dispersion
In addition to calculating Faith's (1992) phylogenetic diversity for each region, we also calculated mean phylogenetic distance for each geographic region (Webb, 2000).When they are standardized to account for species richness, the resulting values (i.e., standardized effect sizes) become comparable between different regions, and can be used to quantify phylogenetic dispersion (Webb, 2000; Qian et al., 2019, 2021).Accordingly, we calculated standardized effect size for both Faith's phylogenetic diversity and mean phylogenetic distance for each geographic region.The standardized effect size of Faith's phylogenetic diversity (PDses) and the standardized effect size of mean phylogenetic distance (MPDses) were calculated using the following formula: Xses= (Xobs- mean (Xnull))/sd(Xnull), where Xobsis the observed value, Xnullis the average expected value for randomized assemblages, and sd (Xnull) is the standard deviation of expected values among randomized assemblages.PDsesand MPDsesmeasure the phylogenetic dispersion of species assemblages at different evolutionary depths,and thus represent the legacy of evolutionary histories at different phylogenetic depths: MPDsesmeasures the more basal structure of the phylogenetic tree, whereas PDsesmeasures the more terminal structure of the phylogenetic tree (Mazel et al., 2016;Qian et al., 2019).A negative value of PDsesor MPDsesreflects relative phylogenetic clustering of species while a positive value of PDsesor MPDsesreflects relative phylogenetic overdispersion of species.PDsesand MPDseswere calculated using the software PhyloMeasures (Tsirogiannis and Sandel, 2016).
We used the package SYSTAT(Wilkinson et al.,1992)to calculate the Pearson's correlation coefficient to assess the relationships between pairwise variables.We considered a correlation to be strong for|r|>0.66,moderate for 0.66 ≥|r|>0.33,or weak for|r|≤0.33 (Qian et al., 2019).
3.Results
Area-corrected phylogenetic diversity (PD) was strongly and positively correlated with area-corrected taxonomic diversity(TD)(r=0.981).As a result,geographic patterns of PD and TD across the world were similar between the two metrics (Fig.1).PD and TD were moderately and negatively correlated with latitude(r = -0.620 and -0.532 for PD and TD, respectively).PDsesand MPDseswere moderately correlated with each other (r = 0.557),and were weakly and negatively correlated with latitude(r = -0.306 and -0.224, respectively).In general, areas with high TD and PD were located in tropical regions whereas areas with low TD and PD were located in temperate regions, particularly in Eurasia and North America,and in northern Africa(Fig.1).Geographic patterns of PDsesand MPDsestended to be more similar to each other than to those of PD and TD (Fig.1; r = -0.169 and 0.001 for PDsesversus TD and PD,respectively;r=0.046 and 0.139 for MPDsesversus TD and PD,respectively).Areas of the highest values of PDsesand MPDseswere also located in tropical regions (Fig.1c and d).However, unlike PD and TD for which areas of the lowest values were located in high latitudes in the Northern Hemisphere,areas at high latitudes in the Northern Hemisphere tended to have relatively large values of PDsesand MPDses(Fig.1).
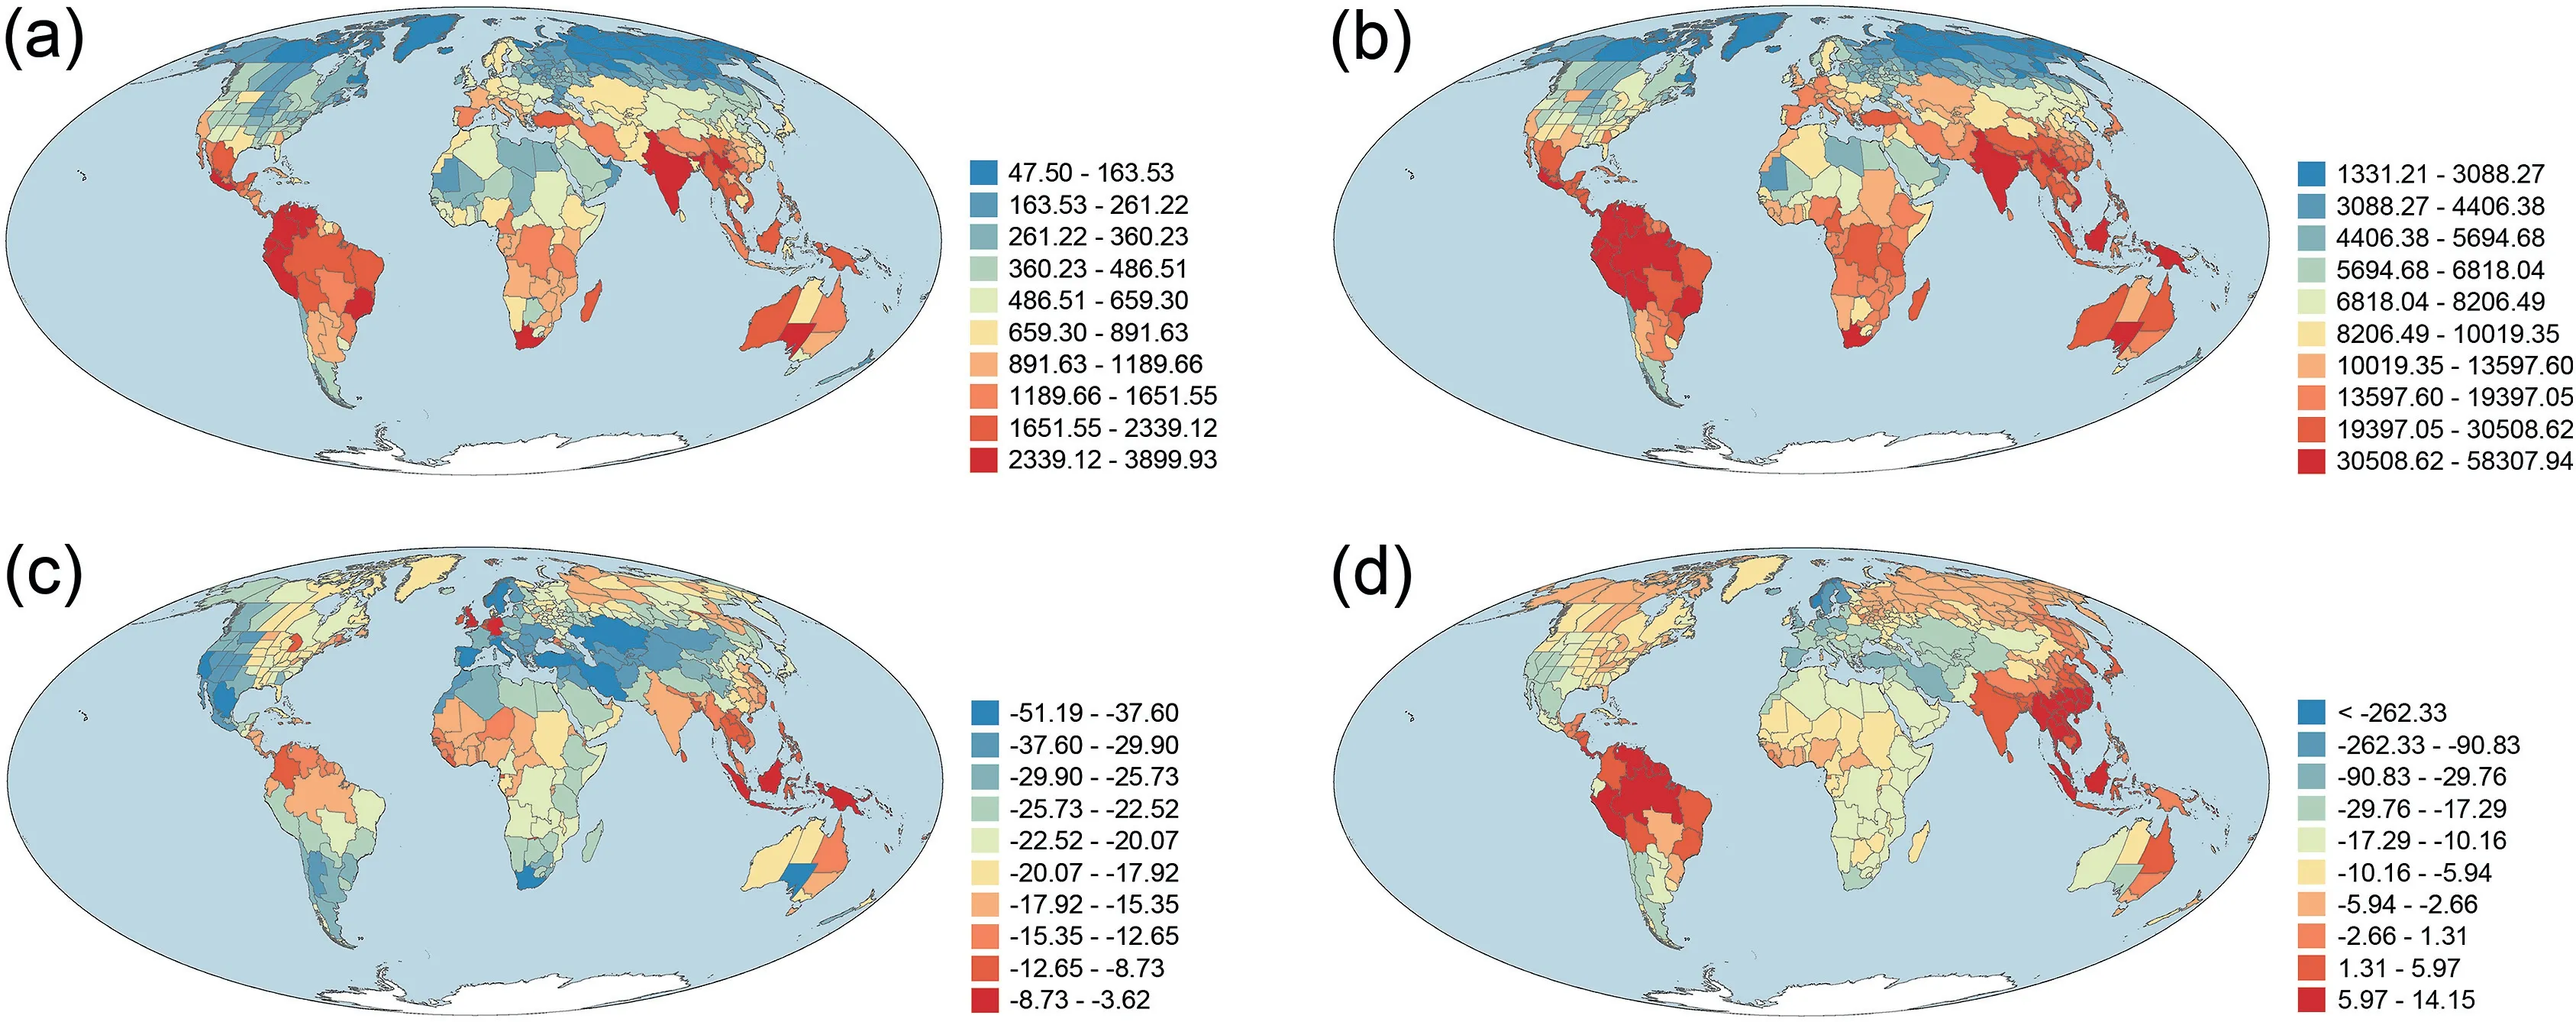
Fig.1.Geographic patterns of(a)taxonomic diversity(TD),(b)phylogenetic diversity(PD),(c)the standardized effect size of phylogenetic diversity(PDses),and(d)the standardized effect size of mean phylogenetic distance(MPDses)for angiosperm species assemblages across the world.TD and PD were area-corrected species richness and Faith's phylogenetic diversity, respectively [i.e.species richness and Faith's phylogenetic diversity (in millions of years) were divided by log10-transformed area (in square kilometer)].

Fig.2.Deviation of phylogenetic diversity (PDdev) with respect to taxonomic diversity derived from normalized phylogenetic diversity minus normalized taxonomic diversity for angiosperm species assemblages across the world.The three warm colors indicate areas with phylogenetic diversity being higher than taxonomic diversity(i.e.,PDdev >0)whereas the three cold colors indicate the opposite pattern (i.e., PDdev <0).
Of the 391 geographic regions across the world,167 (43%) had normalized phylogenetic diversity being greater than normalized taxonomic diversity.Geographic regions with the largest deviation between normalized phylogenetic and taxonomic diversity (i.e.,PDdev) were primarily located in tropical and subtropical regions whereas geographic regions with the lowest PDdevwere primarily located in Central Asia, Europe,and western Americas (Fig.2).
Hotspots and coldspots of angiosperm diversity identified based on taxonomic and phylogenetic diversity (i.e., the top 10% and bottom 10% of the 391 geographic regions, respectively, ranked based on taxonomic or phylogenetic diversity from the largest to the smallest values) were generally consistent between these two metrics of diversity (compare Fig.3a with b).However, to a large degree, their geographic locations did not match the geographic locations of hotspots and coldspots identified based on PDdev(compare Fig.3a and b with c).For example,Mexico and Peru were identified as hotspots of both TD and PD but as coldspots of PDdev.Southeast Asia and Panama are among few regions where all the three metrics identified their geographic regions as biodiversity hotspots (Fig.3).
4.Discussion
4.1.Species diversity
Several studies have investigated geographic patterns of species richness of plants across the globe but they either did not include angiosperms or did not include all major botanical regions.For example, Wang et al.(2017), Suissa et al.(2021) and Qian et al.(2022a) investigated global patterns of species richness of nonangiosperm plants, whereas Kreft and Jetz's (2007) study on global patterns of species richness for vascular plants did not include some botanically important regions(e.g.,Brazil and Japan).To the best of our knowledge, the present study is the first to investigate geographic patterns of species richness of angiosperm plants covering the entire globe, except for small oceanic islands,based on complete or nearly complete species lists of regional floras covering the entire study area.
Within vascular plants, global geographic patterns of species richness for angiosperms observed in this study(Fig.1a)are similar to those of ferns (Fig.1b of Qian et al., 2022a), for both of which species richness is much higher in tropical regions than in temperate regions.We noticed that discrepancy in species richness occurs in some regions between angiosperms and ferns.For example,Japan is among the richest regions for fern species(Fig.1b of Qian et al.,2022a)but this is not the case for angiosperm species(Fig.1a).The global geographic pattern of angiosperm richness is highly congruent with those of terrestrial vertebrates as a whole(Chase, 2012), as well as their individual classes (e.g., Davies et al.,2008 for mammals; Fritz and Rahbek, 2012 for amphibians;Voskamp et al., 2017 for birds).
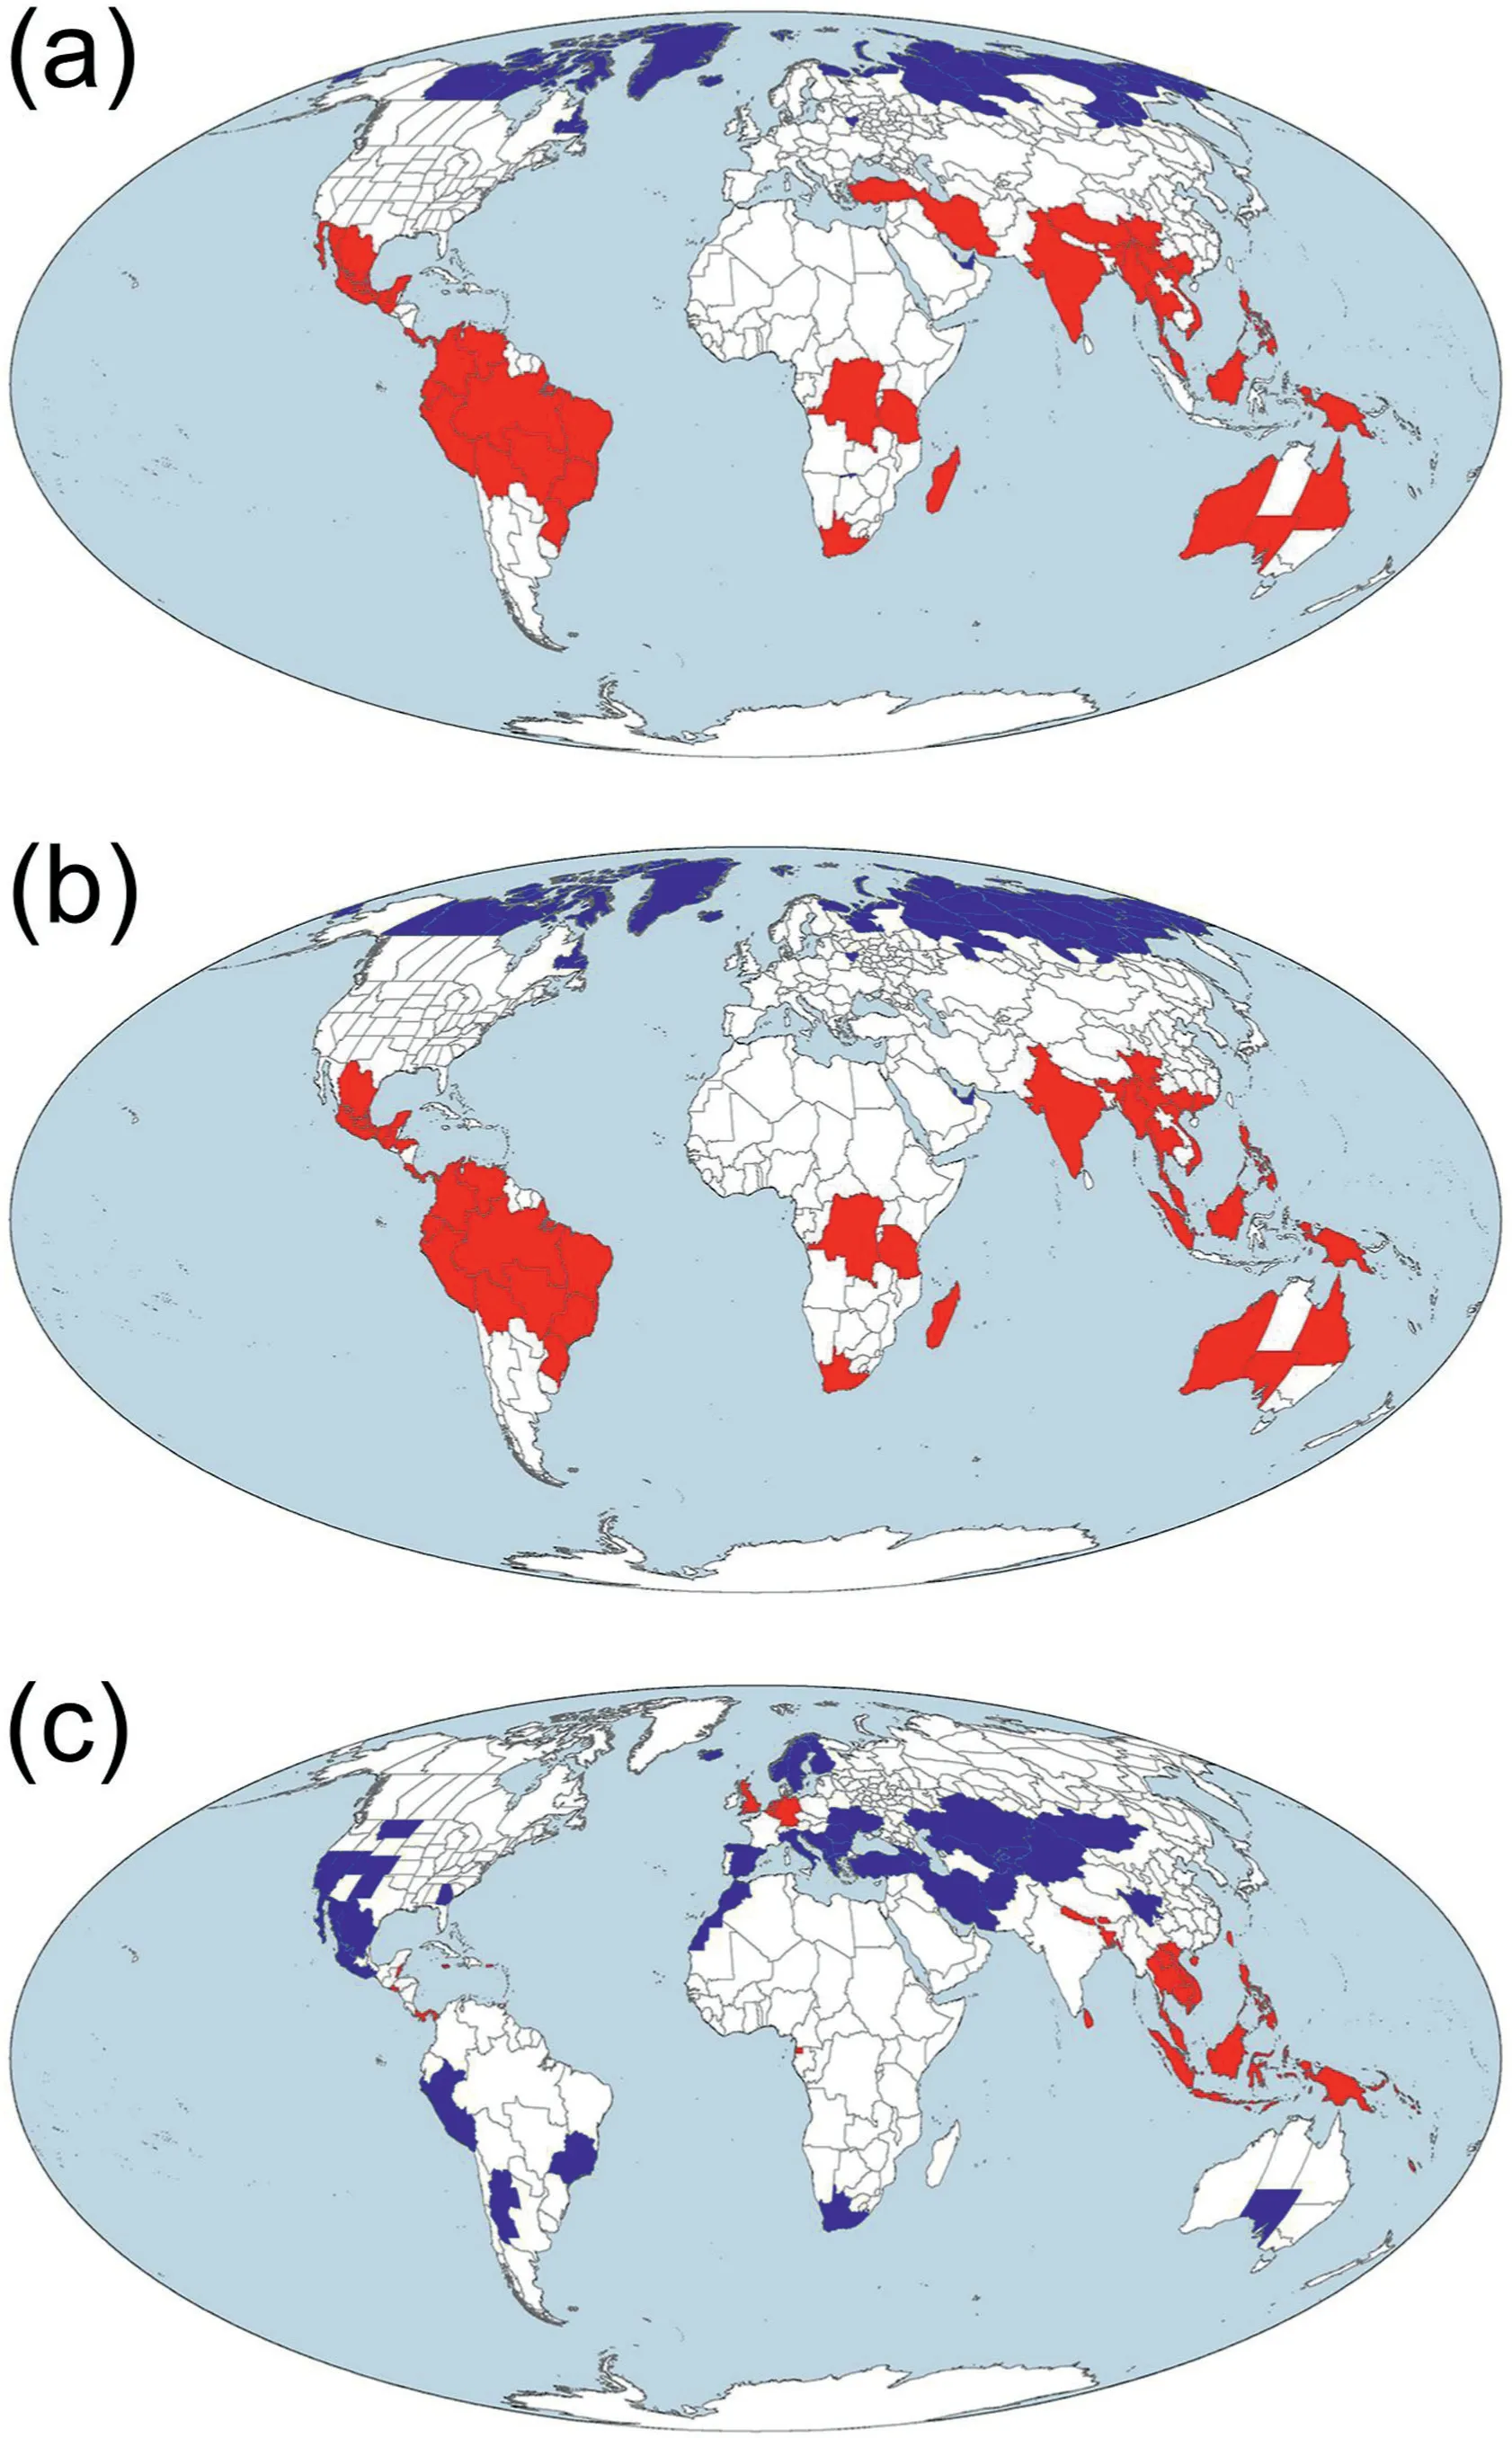
Fig.3.Hotspots(red)and coldspots(blue)of angiosperm diversity identified based on(a)taxonomic diversity(TD),(b)phylogenetic diversity(PD),and(c)deviation between normalized phylogenetic and taxonomic diversity (PDdev) for angiosperm species assemblages across the world.TD and PD were area-corrected species richness and Faith's phylogenetic diversity, respectively [i.e.species richness and Faith's phylogenetic diversity(in millions of years)were divided by log10-transformed area(in square kilometer)].
4.2.Phylogenetic diversity and dispersion
Sandel et al.(2020) showed the geographic pattern of a phylogenetic metric (endemism) for tree species across the world;however, their study included less than 20% of the angiosperm species worldwide.To our knowledge,the present study is the first to investigate global patterns of phylogenetic diversity and dispersion and to compare taxonomic diversity with phylogenetic diversity for regional angiosperm assemblages at a global extent.Our study showed that taxonomic diversity is strongly correlated with phylogenetic diversity.This finding for regional angiosperm assemblages worldwide is consistent with those for angiosperm assemblages at a smaller geographic extent (e.g., China; Qian and Deng, 2021).Our finding for angiosperms is also consistent with those for other groups of organisms at a global extent(e.g.,Fritz and Rahbek, 2012 for amphibians; Voskamp et al., 2017 for birds).Our study showed that phylogenetic dispersion of angiosperms is higher at lower latitudes than at higher latitudes(i.e.,phylogenetic relatedness is lower at lower latitudes than at higher latitudes),resulting in increase in phylogenetic clustering toward high latitudes.However, the strength of this latitudinal trend varies across longitudes, and between the two metrics used in this study (i.e.,PDsesand MPDses) (Fig.1).
4.3.Deviation between taxonomic and phylogenetic diversity
When analyzing a set of sampling areas within a data set, two approaches may be used to determine whether phylogenetic diversity(PD) of an area is higher or lower relative to taxonomic diversity (TD) of the area (i.e., PD after accounting for TD).One approach was used in the present study, which was also used in previous studies (e.g., Pio et al., 2011; Scherson et al., 2014; Qian and Deng, 2021).The other approach is to regress PD against TD and to use the residual of the regression for a given sampling area as a measure the deviation between PD and TD for the area (i.e.,PDdev) (e.g., Forest et al., 2007; Fritz and Rahbek, 2012; Scherson et al., 2014; Costion et al., 2015).In both approaches, a positive PDdevfor a sampling area indicates that PD is higher than TD for the area whereas a negative PDdevrepresents a lower PD relative to TD for the area.Qian and Deng (2021) showed that values of PDdevderived from these two approaches are nearly perfectly correlated(r = 0.996 at the species level).Thus, the results derived from the two approaches are highly comparable.
Our study showed that there are strong geographic patterns of mismatches between PD and TD.Angiosperm assemblages with the largest values of PDdevwere primarily located in tropical and subtropical regions whereas those with the lowest values of PDdevwere primarily located in Central Asia, Europe, and western Americas(Fig.2).Mismatches between PD and TD have been also observed in previous studies for vertebrates[e.g.,Davies and Buckley(2011)for mammals;Fritz and Rahbek(2012)for amphibians;Voskamp et al.(2017) for birds].However, areas with unusually high (or low)values of PDdevare not consistent among different groups of organisms.For example, for amphibians, Fritz and Rahbek (2012)found that areas with unusually low values of PDdevwere mostly on islands and archipelagos, as well as in regions that have been long isolated, such as Madagascar and Australia, whereas areas with unusually high values of PDdevwere located around biogeographic contact zones in Central America and southern China.They consider low PDdevin islands as a result of large radiations of few lineages that have successfully colonized the islands and high PDdevin Central America and southern China as a result of high immigration or in situ diversification rates and local persistence of old lineages in these regions.For mammals,Davies et al.(2008)found that areas of unusually high values of PDdevare generally located in Sub-Saharan Africa and parts of the Indian subcontinent, representing areas with relatively old evolutionary histories of mammals,whereas areas of unusually low values of PDdevare primarily located in the Andes in South America and the Rocky Mountains in North America, representing areas with relatively young evolutionary histories of mammals.For birds, Voskamp et al.(2017)found that extensive areas of high values of PDdevoccur on isolated tropical islands, including Madagascar and Sri Lanka, and in dry land areas fringing the subtropics whereas areas of low values of PDdevinclude areas of high relief, such as the Himalayas and Andes, and areas of historical glaciation.The fact that species richness patterns are broadly congruent among different groups of organisms across the world but patterns of PDdevdiffer strongly among different major taxonomic groups suggests that the mechanisms and processes that generate patterns of phylogenetic diversity, and PDdevin particular, may differ among taxonomic groups.
Regions of high PDdevare thought to have experienced high diversification rates of multiple lineages or immigration of multiple lineages that radiated successfully(Fritz and Rahbek,2012;Saladin et al., 2019).Thus, an unusually high PDdevmay result from phylogenetic overdispersion of the species of a region and the existence of old lineages carrying unique and deep-time evolutionary histories in the region(Voskamp et al.,2017).By contrast,regions of low PDdevmight have experienced large radiations of few closelyrelated lineages (Fritz and Rahbek, 2012; Saladin et al., 2019).Thus, unusually low PDdevare more likely to occur in areas with species being phylogenetically clustered due to more recent speciation events (Davies et al., 2008; Voskamp et al., 2017).Voskamp et al.(2017)hypothesize that high PDdevmight arise from opportunities for biotic interchanges, such as those at boundaries between realms, or by relative isolations that promote the persistence of ancient lineages,whereas lower PDdevis expected to occur on more recently formed landmasses.Some regions with high or low values of PDdevfound in this study for angiosperms may be explained by this hypothesis.
For example, a cluster of regions including Nepal and Bhutan have much higher PDdev, compared with regions around them(Fig.2).These regions,which are part of the Himalayan biodiversity hotspot (Wambulwa et al., 2021) and are located at the boundary between the Eurasian plate and the Indian plate, include plant lineages from Laurasia and Gondwana supercontinents(Raven and Axelrod,1974).After the Indian plate was collided with the Eurasian plate, Gondwanan plants carried by the Indian plate mixed with Laurasian plants evolved on the Eurasian plate(Raven and Axelrod,1974).Because the two tectonic plates were separated for tens of millions of years before the India-Asia collision (Briggs, 1987),evolutionary histories of angiosperms on the two plates differed substantially and each plate had a unique set of clades(Raven and Axelrod,1974).Regions with mixed clades of angiosperms from the two plates would result in high values of PDdev,as hypothesized by Voskamp et al.(2017).In contrast,the Hengduan Mountains region in Southwest China is one of the richest temperate regions in the world in terms of angiosperm species, as shown in our study(Fig.1), but the region has a relatively low value of PDdev(Fig.2).This may have resulted from abundant recent speciation events of some lineages in the region, caused by the uplift of many high mountains as a result of the collision of the Indian plate with the Eurasian plate (Sun et al., 2017).Areas with abundant recent speciation events primarily restricted to few clades would result in low PDdevin the areas, as hypothesized by Voskamp et al.(2017;also see Davies and Buckley, 2011; Zupan et al., 2014).
4.4.Hotspots and coldspots of taxonomic and phylogenetic diversity of angiosperms
Hotspots of angiosperm species diversity identified in this study include the vast majority of the biodiversity hotspots identified in previous studies including more groups of organisms and using different criteria (Myers et al., 2000; Fu et al., 2022).Our study showed that angiosperm hotspots and coldspots identified based on PD are highly congruent with those identified based on TD(Fig.3).However, angiosperm hotspots and coldspots identified based on PDdevgenerally do not overlap with those identified based on PD or TD (compare Fig.3a and b with c).This suggests that selecting nature reserves should consider not only areas of high TD and PD but also areas of relatively low TD and PD but high PDdev(Qian and Deng,2021).Areas of high PDdevlikely carry more unique deep-time evolutionary histories than other areas and have likely high evolutionary potential, compared to areas with similar taxonomic diversity but low PDdev(Voskamp et al.,2017);thus they are of particular interest for conservation planning.Furthermore,areas of low PDdevbut high TD and PD (such as those in the Hengduan Mountains) could also be of interest for conservation planning because they might carry abundant recent evolutionary histories(Qian and Deng, 2021).
Author contributions
H.Q.designed research,analyzed data,and wrote the paper;J.Z.prepared data; M.J.generated maps; all authors participated in revising the paper.
Data availability statement
The data used in this study have been published and cited.
Declaration of competing interest
The authors have no competing interest to declare.
Acknowledgements
We thank anonymous reviewers for their constructive comments.This research was partly supported by the Shanghai Municipal Natural Science Foundation (Grant No.20ZR1418100)and National Natural Science Foundation of China (Grant No.32030068) to J.Z.
Appendix A.Supplementary data
Supplementary data to this article can be found online at https://doi.org/10.1016/j.pld.2023.01.009.
- 植物多樣性的其它文章
- A method for quantifying relative competitive advantage and the combined effect of co-invasion for two invasive plants
- Does regional species diversity resist biotic invasions?
- U.PhyloMaker: An R package that can generate large phylogenetic trees for plants and animals
- GhWRKY33 negatively regulates jasmonate-mediated plant defense to Verticillium dahliae
- Metabolic and transcriptomic analyses elucidate a novel insight into the network for biosynthesis of carbohydrate and secondary metabolites in the stems of a medicinal orchid Dendrobium nobile
- Floral trait variation across individual plants within a population enhances defense capability to nectar robbing