
Millet/peanut intercropping at a moderate N rate increases crop productivity and N use efficiency,as well as economic benefits,under rain-fed conditions
2023-03-11 06:46:40LIUZhuNANZhenwuLlNSongmingYUHaiqiuXlELiyongMENGWeiweiZHANGZhengWANShubo
LIU Zhu ,NAN Zhen-wu ,LlN Song-ming ,YU Hai-qiu ,XlE Li-yong ,MENG Wei-wei#,ZHANG Zheng,WAN Shu-bo
1 Shandong Academy of Agricultural Sciences,Jinan 250100,P.R.China
2 Agronomy College,Shenyang Agricultural University,Shenyang 110866,P.R.China
3 College of Life Sciences,Shandong Normal University,Jinan 250014,P.R.China
Abstract Cereal and legume intercropping has been widely adopted to increase crop productivity in sustainable farming systems worldwide. Among different intercropping combinations,millet and peanut intercropping can be adapted to most waterlimited areas. However,there are few studies on the differences in yield characteristics and nitrogen use efficiency between millet/peanut intercropping and monocultures under different nitrogen (N) application rates. The objective of this study was to determine the yield advantages and economic benefits,as well as the appropriate N application rate,of millet/peanut intercropping. A two-year field experiment was conducted with three cropping patterns (monoculture millet,monoculture peanut and millet/peanut intercropping) and four N rates (0,75,150 and 225 kg ha-1). The results showed that the land equivalent ratio (LER) and net effect (NE) of the intercropping system reached their highest levels at the N input of 150 kg ha-1 in 2018 and 2019 (1.04 for LER,0.347 Mg ha-1 for NE,averaged across two years). Millet was the dominant crop in the intercropping system (aggressivity of millet and peanut (Amp)>0,competitive ratio of millet and peanut (CRmp)>1),and millet yields achieved their highest values at N inputs of 225 kg ha-1 for monoculture and 150 kg ha-1 for intercropping. NUE reached its highest levels with N inputs of 150 kg ha-1 for all planting patterns over the two years. Intercropping combined with an N input of 150 kg ha-1 achieved the highest net income of 2 791 USD ha-1,with a benefit-cost ratio of 1.56,averaged over the two years. From the perspective of economics and agricultural sustainable development,millet/peanut intercropping at 150 kg N ha-1 seems to be a promising alternative to millet or peanut monoculture.
Keywords: millet,peanut,intercropping,N input,yield,economics
1.Introduction
Crop yields must be improved to support the rapid expansion of the world’s population (Gerlandet al.2014).N fertilizer use contributes to increases in crop yield under conditions of limited arable land (Zhu and Chen 2002).However,more than 50% of the N fertilizer applied to the soil enters the atmosphere and water through N loss,causing serious ecological and environmental problems,such as the greenhouse effect and water eutrophication(Guo Jet al.2010). China is the largest consumer of N fertilizer in the world,but the utilization level of N fertilizer is far lower than those of developed countries (Zhanget al.2008). Therefore,now is the time to realize high productivity using more sustainable methods based on reduced chemical inputs with minimum negative environmental effects.
Intercropping is a widely used agroecological practice of cultivating two or more crops simultaneously in the same field (Vandermeer 1989;Liet al.2001;Yuet al.2017),and it can make efficient use of light (Liu Xet al.2018),water (Maoet al.2012),nutrients (Fanet al.2020),and land (Liet al.2020c). Intercropping has many benefits over sole cropping,such as the ability to better control diseases and pests (Trenbath 1993;Alainet al.2012;Heet al.2019),greater adaptability under stress and the possibility of maintaining yield stability (Anilet al.1998;Hauggaard-Nielsenet al.2009). Many studies have shown that intercropping can efficiently improve system productivity through intensive planting in time and space(Hauggaard-Nielsenet al.2003;Rusinamhodziet al.2012;Zhanget al.2020). The demand of intercropping crops for chemical inputs (e.g.,N fertilizer and pesticides)is often lower than that of monoculture crops (Xuet al.2020). Therefore,intercropping provides a pathway for building more sustainable agroecosystems (Yanget al.2021).
Cereal and legume intercropping in sustainable arable farming systems is of increasing interest utilizing different intercropping combinations (Neugschwandtner and Kaul 2015). The reasonable regulation of a cereal and legume intercropping system can make full use of the advantages of biological N fixation,consequently reducing the input of fertilizer and improving the production efficiency (Corre-Hellouet al.2006;Hauggaard-Nielsenet al.2009;Bedoussac and Justes 2010). One of the key benefits of legumes is improving soil fertility by increasing the available N in soil through biological N fixation,thereby reducing N input requirements (Salvagiottiet al.2008).When intercropped with legumes,cereals may perform better than they do as sole crops,especially at a low N supply,since the legumes are not strong competitors for soil N (Hauggaard-Nielsena and Jensena 2001;Fenget al.2021). Furthermore,the competition of cereals for soil N results in more N fixation from the atmosphere by the intercropped legumes compared with monoculture(Cowdenet al.2020;Rodriguezet al.2020). Numerous studies have been conducted to better understand the underlying mechanisms of N use in cereal/legume intercropping systems. A meta-analysis quantified the effect of legume/cereal intercropping on the use of N resources in temperate agroecosystems,confirming and highlighting that intercropping consistently stimulates complementary N use between legumes and cereals by increasing N2fixation by the legumes and increasing the soil N acquisition by the cereals (Rodriguezet al.2020). As reported by Gonget al.(2021b),intercropping broomcorn millet and mung bean with high N fertilizer inputs significantly reduced the intercropping advantages and land use efficiency. In pea/barley intercropping systems,the input of symbiotically fixed N2into temperate agricultural ecosystems increased without compromising the yield level or stability either with or without a low rate of fertilizer N supply (Jensen 1996). Sorghum and pearl millet intercropped with soybean reduced the N fertilizer requirements by 25 and 50%,respectively (Layeket al.2014). Similarly,sugarcane/soybean intercropping with a reduced nitrogen input improves crop productivity and reduces the carbon footprint in China. In contrast,a high N level caused negative effects in terms of increasing the crop productivity and reducing the carbon footprint of a soybean/sugarcane intercropping pattern (Wanget al.2020). Obviously,there are differences in N management between intercropping and the corresponding monoculture,and the optimal N management practices for crop productivity and N requirements in cereal/legume intercropping systems still need more study (Gonget al.2021a;Xiaoet al.2021).
Peanut is an important oil crop that has attracted more and more interest due to its nutritional value. The North China Plain contains around 60% of China’s farmlands that produce peanuts (Guo Het al.2010). However,a continuous monocropping system is commonly adopted in the growing and harvesting of peanut,resulting in the decline of biodiversity and reductions in the yield and quality. An increase in biodiversity has positive impacts on ecosystem functions which are related to biomass production and nutrient cycling (Delaquiset al.2018). Actually,in the maize/soybean strip intercropping systems,annually alternating the rotation between maize and soybean strips has been used to prevent continuous cropping soil problems,which is of great significance for ensuring the sustainability of crop production (Duet al.2018). Similarly,millet/peanut strip intercropping can also realize an annual alternating rotation pattern since the millet and peanut strips are of the same width.Meanwhile,the intercropping system of millet and peanut is suitable for Chinese small range-operating households because of its narrow strip width. This mode is also welcomed by farmers since millet and peanut have almost the same sowing and harvesting times (Fenget al.2013).Previous studies mainly focused on the interspecific interactions between intercropped millet and peanut,as well as biomass and nutrient acquisition by crops under different planting patterns (Zouet al.2019). The yield advantages and economic benefits of a millet and peanut strip intercropping system with different N application levels await further study.
Therefore,we compared different N levels with various planting modes,and evaluated the effect of N level on grain yield and economic benefits based on a two-year field experiment. We hypothesized that intercropping combined with a reasonable N input would maintain yield stability and resource use efficiency. In this study,we aimed to determine how N input would affect the responses of both the monoculture crops and the intercrops. The objectives of this experiment were threefold: (i) to examine the effects of different N treatments on yield advantages and economic benefits of millet and peanut,(ii) to assess the impacts of different N treatments on N accumulation and utilization in the monoculture crops and the intercrop,and (iii) to recommend an appropriate N level which can impart the most efficient N utilization in millet/peanut intercropping.
2.Materials and methods
2.1.Site description
Field experiments were conducted in 2018 and 2019 at the experimental station of Shandong Academy of Agricultural Sciences in Jiyang City (116°58′E,36°58′N),Shandong Province,China. This area has a temperate continental monsoon climate with an average annual sunlight of 2 618 h. The annual average temperature,rainfall and frost-free period were 12.8°C,580 mm,and 195 d,respectively. The meteorological data during the crop growing season of this experiment are presented in Fig.1. The soil at the experimental site is a fluvo-aquic soil,developed from the alluvial parent material of the Yellow River,and the texture of the topsoil is sandy loam.The soil had an organic matter content of 12.43 g kg-1,total N of 0.53 g kg-1,alkaline hydrolytic N of 54.74 mg kg-1,available P of 10.58 mg kg-1and available K of 96.45 mg kg-1in the 0-20 cm soil layer.
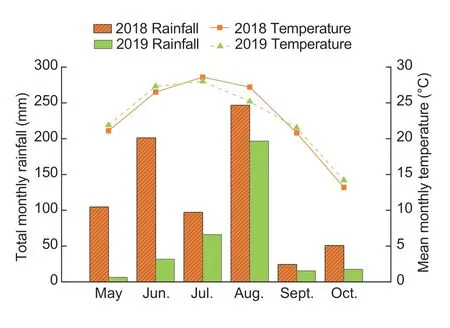
Fig.1 Monthly precipitation and mean air temperature at the research station during the growing seasons in 2018 and 2019.
2.2.Experimental design and crop management
A randomized complete block design with two factors of N input (four N levels) and cropping system (three cropping patterns) was used for the field experiment. Three cropping patterns were arranged,including monoculture millet (Setariaitalica,Jigu 20),labeled MM;monoculture peanut (Arachishypogaea,Huayu 25),labeled MP;and millet/peanut intercropping,labeled IMP. Based on the treatments,N input was set at four levels of 0 (N0),75(N1),150 (N2) and 225 (N3) kg ha-1. Crossing the factors of N input and cropping system resulted in 12 treatments,each with three replicates.
Monoculture millet was planted in the furrow with a row distance of 40 cm,and a plant distance of 3.5 cm was maintained within each row of millet. Monoculture peanut was planted on the ridge with a bottom width of 80 cm,a surface width of 50 cm,and a height of 15 cm. Two rows of peanuts were planted on each ridge,and the peanut row distance on the ridge was 25 cm with a plant distance in the row of 10 cm. The same distances were used between crop rows and plants in the intercrop millet and peanut strips,while the distance between neighboring maize and peanut rows was 47.5 cm. The ratio of millet to peanut in intercropping was 2:2 (Fig.2),and the strip widths of millet and peanut were identical. The total strip width was 160 cm. The planting densities of 7.1×10⁵and 3.55×10⁵plants ha-1for millet were used in monoculture and intercropping,and densities of 2.5×10⁵and 1.25×10⁵plants ha-1for peanut were maintained in the monoculture and intercropping,respectively. The row direction was south to north.
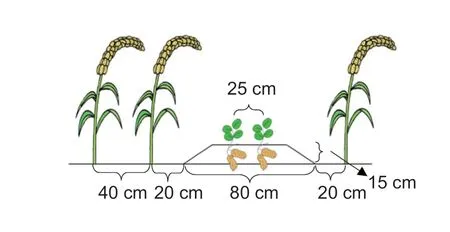
Fig.2 Field schematic diagram of the millet and peanut 2:2 intercropping mode.
The millet crop was sown on 18 and 21 June and harvested on 21 and 28 September in 2018 and 2019,respectively. The peanut crop was sown on 18 and 21 June and harvested on 7 and 10 November in 2018 and 2019,respectively. Basal fertilizers including P2O5at 120 kg ha-1and K2O at 120 kg ha-1were applied to all the plots before sowing. In all treatments,N fertilizer for millet and peanut was applied as basal fertilizer in the form of urea.The crops in our experiment were rain-fed. Weeds,pests,and diseases were controlled according to the standard farmers’ practices.
2.3.Sampling and measurements
At maturity,grain yield was determined by harvesting 8 m2(4 rows×5 m) for monoculture millet,3.2 m2(2 ridges×2 m) for monoculture peanut,and 8 m2(1 strip×5 m) for the intercropping system. All collected samples were airdried under a platform shelter until the moisture content was 14%,and then the samples were threshed for seeds.
The land equivalent ratio (LER) was used to determine the yield advantage of intercropping in response to the different N levels (Mead and Willey 1980):
wherepLERMandpLERPindicate the partial LER for millet and peanut,YIMandYMMare the grain yields of millet under intercropping and monoculture,andYIPandYMPare the grain yields of peanut under intercropping and monoculture,respectively. An LER greater than one indicates that intercropping saves land.
We calculated the net (NE),complementarity (CE) and selection (SE) effects according to the method of Loreau and Hector (2001). The NE was used to determine the difference between the observed yield and the expected yield:
whereOMandOPare the percentage of occupation area by millet and peanut in the intercropping system,respectively (Liet al.2020a). Since the strip widths of millet and peanut are identical in this experiment,OMandOPhave the same value equal to 0.5.
The NE can be divided into two components of CE and SE (Loreau and Hector 2001):
The CE is calculated as follows:
where ΔRYis the deviation from expected relative yield of a crop species in the intercrop,M is the yield of monoculture,and N is the number of species in the intercrop.
The ΔRYvalue is calculated as the difference between observed (RYO) and expected relative yields (RYE):
whereYinterandYmonoare the intercropping and monoculture yields,respectively;O is the fraction of area occupied by a crop in intercropping.
The SE value is measured by the covariance between the monoculture yield of species (M) and its change in relative yield in the intercropping (Loreau and Hector 2001):
The aggressivity (Amp) and the competitive ratio (CRmp)were used to evaluate the relative competitive ability and competitive ratio among the species in millet and peanut intercropping (Mead and Willey 1980). Aggressivity (Amp)was calculated as:
The competitive ratio (CRmp) was calculated as:
When Amp is greater than zero,the competitive ability of millet exceeds that of peanut in intercropping. A CRmp value greater than one indicates that the competitiveness of millet is higher than peanut.
The plant samples of millet and peanut were crushed and passed through a 1-mm sieve,and the screened samples were digested with H2SO4and H2O2. The total N was determined by a continuous flow analyzer(Auto Analyzer 3,SEAL Analytical GmbH,Norderstedt,Germany).
The N harvest index was calculated as given by Desai and Bhatia (1978):
whereNgrainis the amount of N accumulation in seed,andNtotalis the amount of N accumulation in the total plant.
The N use efficiently (NUE) was calculated as follows(Duanet al.2014):
whereUNis total N accumulation with N fertilizer application,U0is total N accumulation without N fertilizer application,and F is the amount of N fertilizer supplied during the growing season. It is important to note that the N use efficiency is “apparent” because there are other potential N sources in the system,such as mineralization from organic matter,atmospheric N deposition,and biological N fixation by legumes (Gaoet al.2020). If biological N fixation is not considered,then the N use efficiency will be lower than that observed when biological nitrogen fixation does not occur.
The N agronomic efficiency (NAE) was calculated by the following formula (Fixenet al.2015):
whereYandY0represent the yields in the area with N fertilizer application and without N fertilizer application,respectively,and F is the amount of N fertilizer.
The net income for each cropping system was calculated to determine the economic feasibility of the intercropping systems. The total inputs including seeds,fertilizers,machinery and labor were recorded. The economic output was calculated according to the yearly average market prices. To estimate the total input and output,the unit price derived from the farm gate prices in the area are presented in Table 1. Then,the economic efficiency was calculated as (Yanget al.2018):
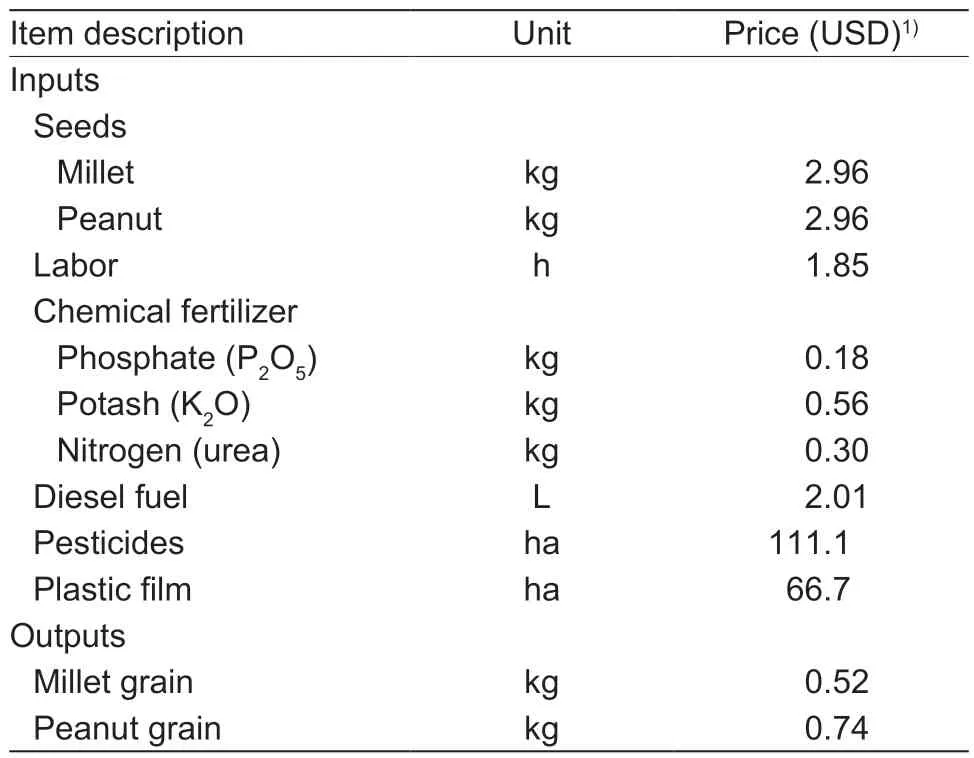
Table 1 Unit prices used in the economic analysis
2.4.Data analysis
The data were analyzed using SPSS 23 (IBM,USA). A three-way analysis of variance (ANOVA) was performed to analyze the grain yield,N accumulation,NAE and NUE with N level,cropping system and year as fixed factors and replication as a random factor. The variances of LER,Amp,Cmp and NE were analyzed using two-way ANOVA with the N level and year as fixed factors and replication as a random factor. The means among treatments for each trait were compared using Duncan’s multiple rangetests. All differences were considered as significant at the 5% probability level (P<0.05).
3.Results
3.1.Grain yield
With an increase in N input,the millet yields in monoculture and intercropping showed different trends.The monoculture millet yield showed a monotonous increase as N input increased and tended to be stable at the N2 level. Compared with the N2 level,the yield at the N3 level increased slightly,an increase of only 0.65%occurred averaged over the two years. The intercropping millet yield reached the highest value at the N2 level,and declined slightly as the N input increased further.The millet yield in intercropping was higher than that in monoculture under the same N level. Compared with the corresponding monoculture,intercropping increased the grain yield of millet by 21.4%,averaged across years and N levels. The peanut yield in different cropping systems showed a similar trend as N input increased. The peanut yield reached a peak at the N2 level and decreased when the N level increased to N3. Intercropping decreased the peanut yield compared with monoculture. Compared with N0,total grain yield of the intercropping system increased by 10.9,20.7 and 16.6% at the N1,N2 and N3 levels,respectively,averaged over the two years (Table 2).
The relationships between N input and yield were fitted by nonlinear equations (Fig.3). According to the quadratic functions,the N application rates for the highest theoretical yields were 237.2 kg ha-1in monoculture millet and 201.1 kg ha-1in intercropping millet in 2018,and 214.0 kg ha-1and 177.4 kg ha-1in 2019,respectively.The highest theoretical yields were obtained at application rates of 165.6 kg ha-1for monoculture peanut and 158.8 kg ha-1for intercropping peanut in 2018,and at 155.1 kg ha-1and 153.4 kg ha-1in 2019,respectively.
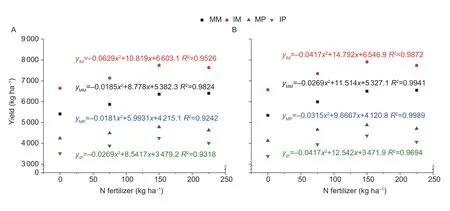
Fig.3 Relationships between nitrogen (N) input and yields of millet and peanut in 2018 (A) and 2019 (B). The acronyms MM,IM,MP and IP represent the monoculture millet,intercropping millet,monoculture peanut and intercropping peanut,respectively.Formulas represent fitted quadratic regression equations.
3.2.LER,interspecific competitiveness and biodiversity effects
Overall,the LER values of all the N levels were greater than one under the intercropping system (Table 3). The highest LER value was obtained at the N2 level,with an average for two years of 1.055,which was significantly higher than at the other N levels (P<0.05). The interspecific competitiveness of millet was stronger than that of peanut (Amp>0,CRmp>1;Table 3),and with the increase in N input,the competitiveness declined. For NE,the N2 level reached the highest values in both two years,and the values were significantly higher than theother three N levels (P<0.05). CE and SE significantly increased with the N application rate from the N0 to N2 levels (P<0.05),but this temporal trend was absent at the N3 level (Fig.4). The relative contributions of CE to grain yield increased with an increase in the N application rate,from 52% at the N0 level to 70% at the N2 level(on average for the two years) (Fig.5). However,this temporal trend was absent in the N3 level. In contrast to CE,SE showed the opposite trend. Moreover,the relative contributions of CE were higher than those of SE at the levels of N1 and N2,while they were almost the same as SE at the levels of N0 and N3 (Fig.5).
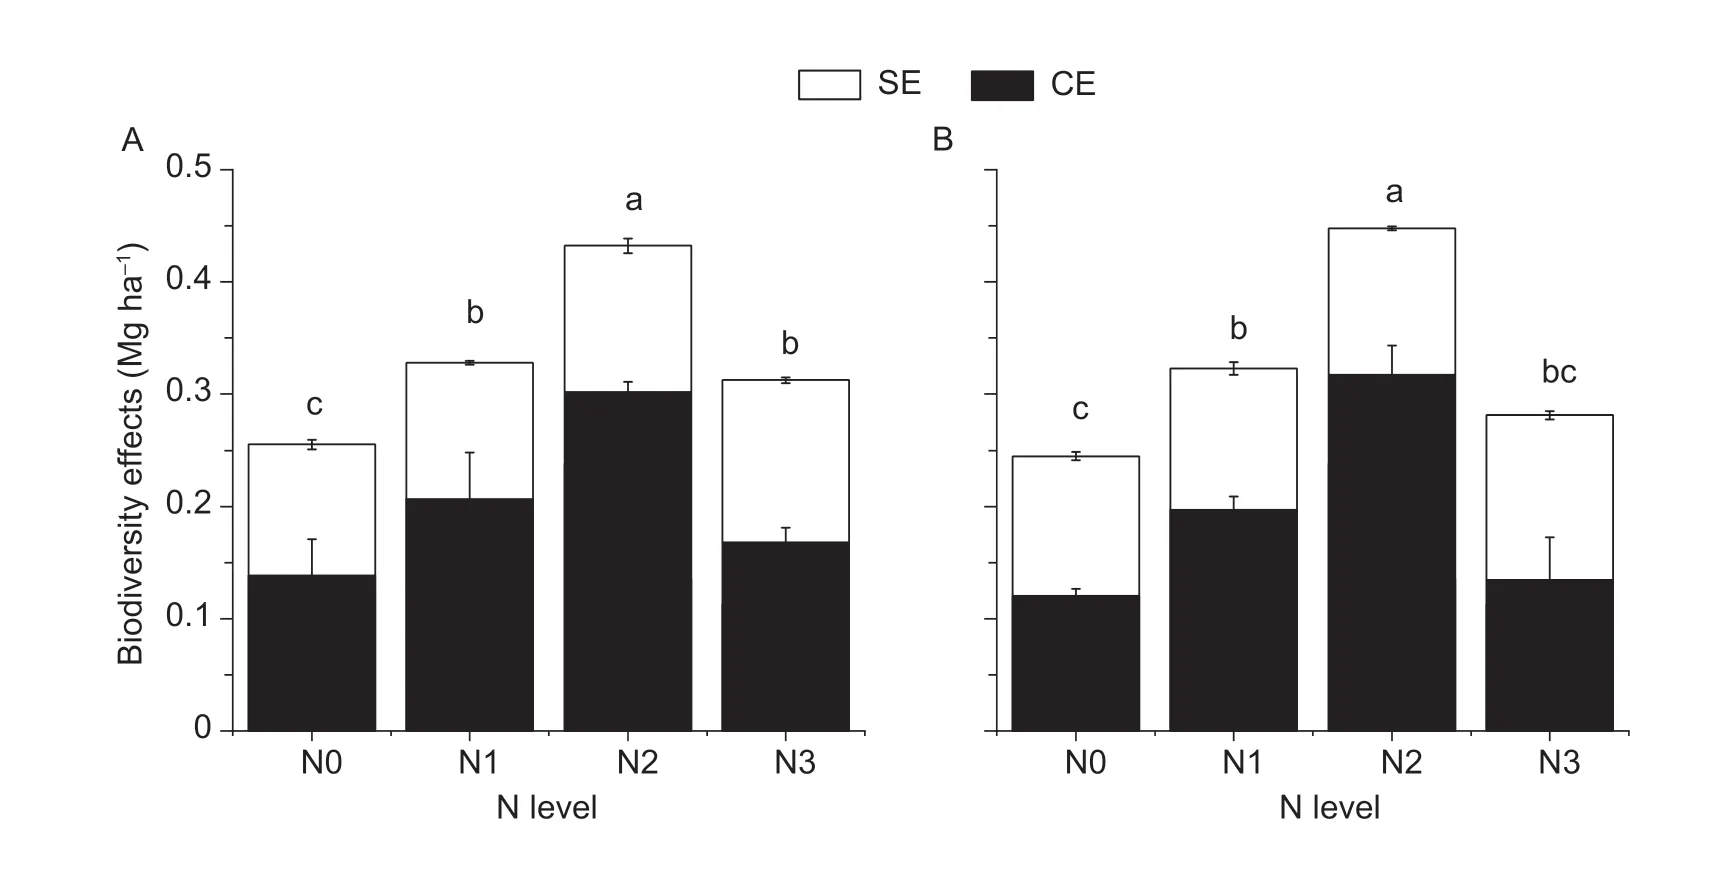
Fig.4 Complementarity (CE) and selection effects (SE) of millet/peanut intercropping,under different nitrogen (N) fertilization treatments in 2018 (A) and 2019 (B). N0-N3,0,75,150 and 225 kg ha-1,respectively. Bars mean SD (n=3). Different letters indicate significant differences between N input levels in one year (P<0.05).
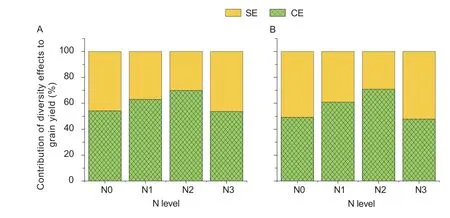
Fig.5 Contributions of complementarity (CE) and selection effects (SE) (%) to the effect of intercropping on grain yield as affected by nitrogen (N) application rates in the millet/peanut intercropping system in 2018 (A) and 2019 (B). N0-N3,0,75,150 and 225 kg ha-1,respectively.
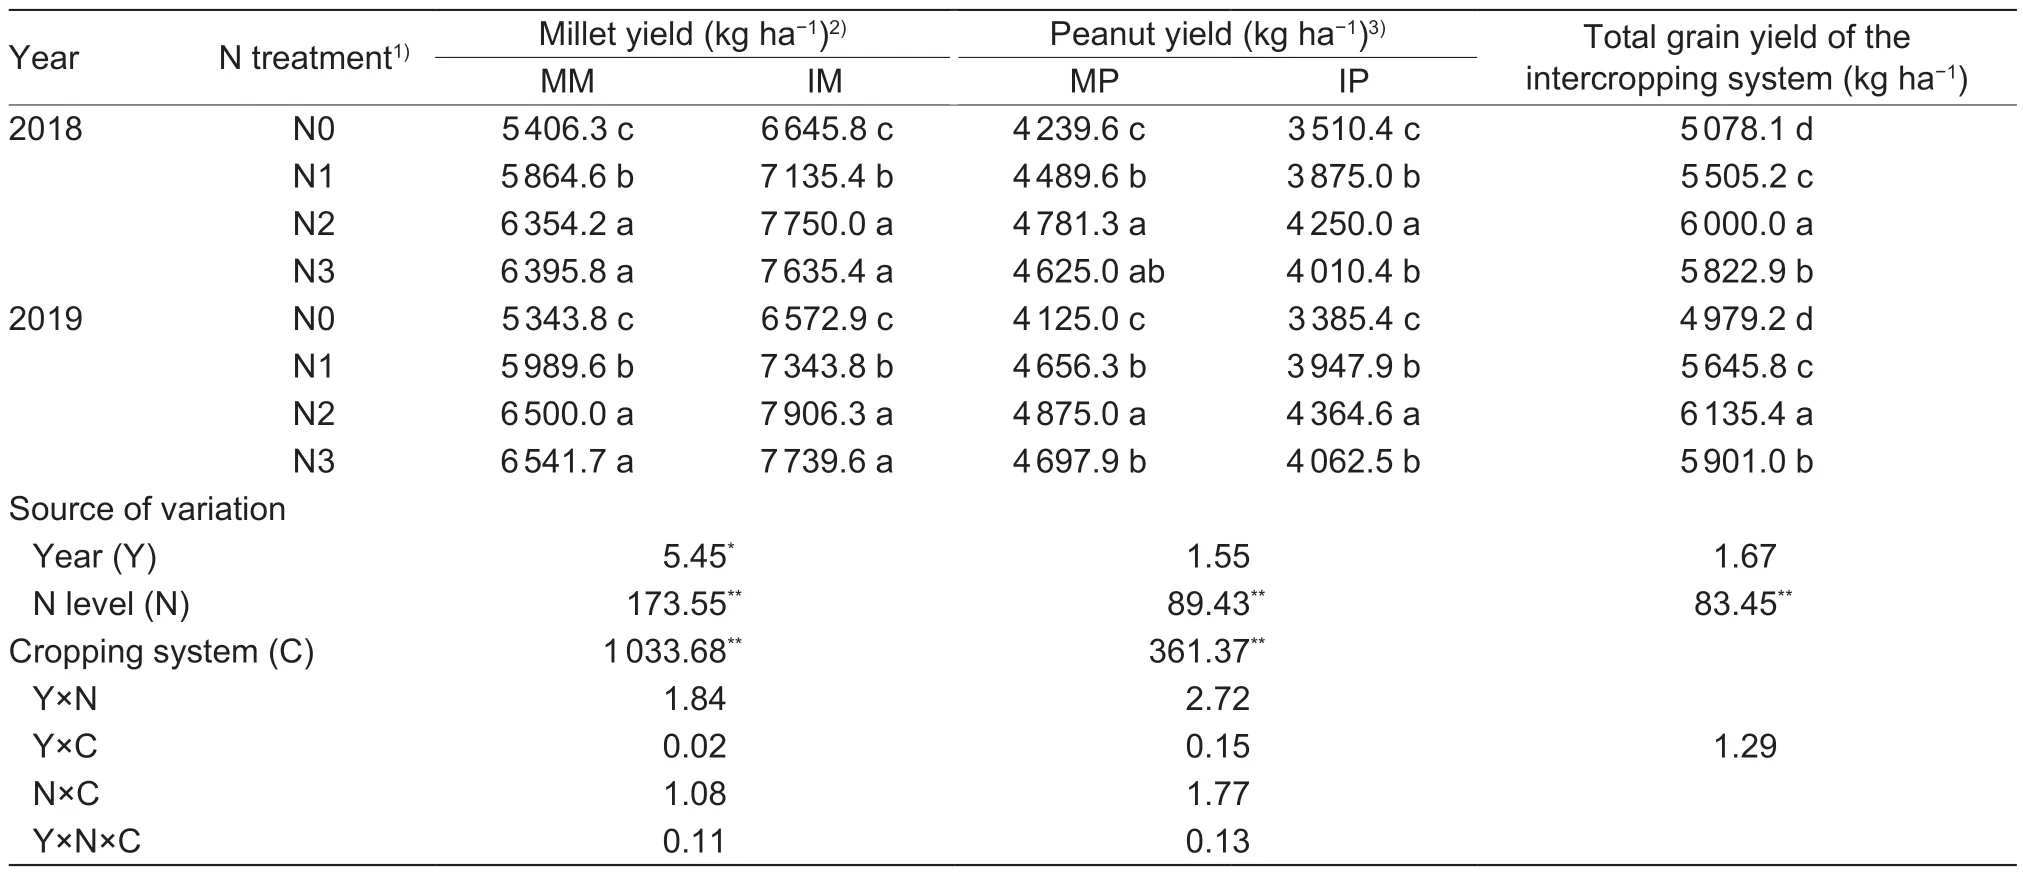
Table 2 Grain yield of millet and peanut as affected by nitrogen (N) input
3.3.N accumulation
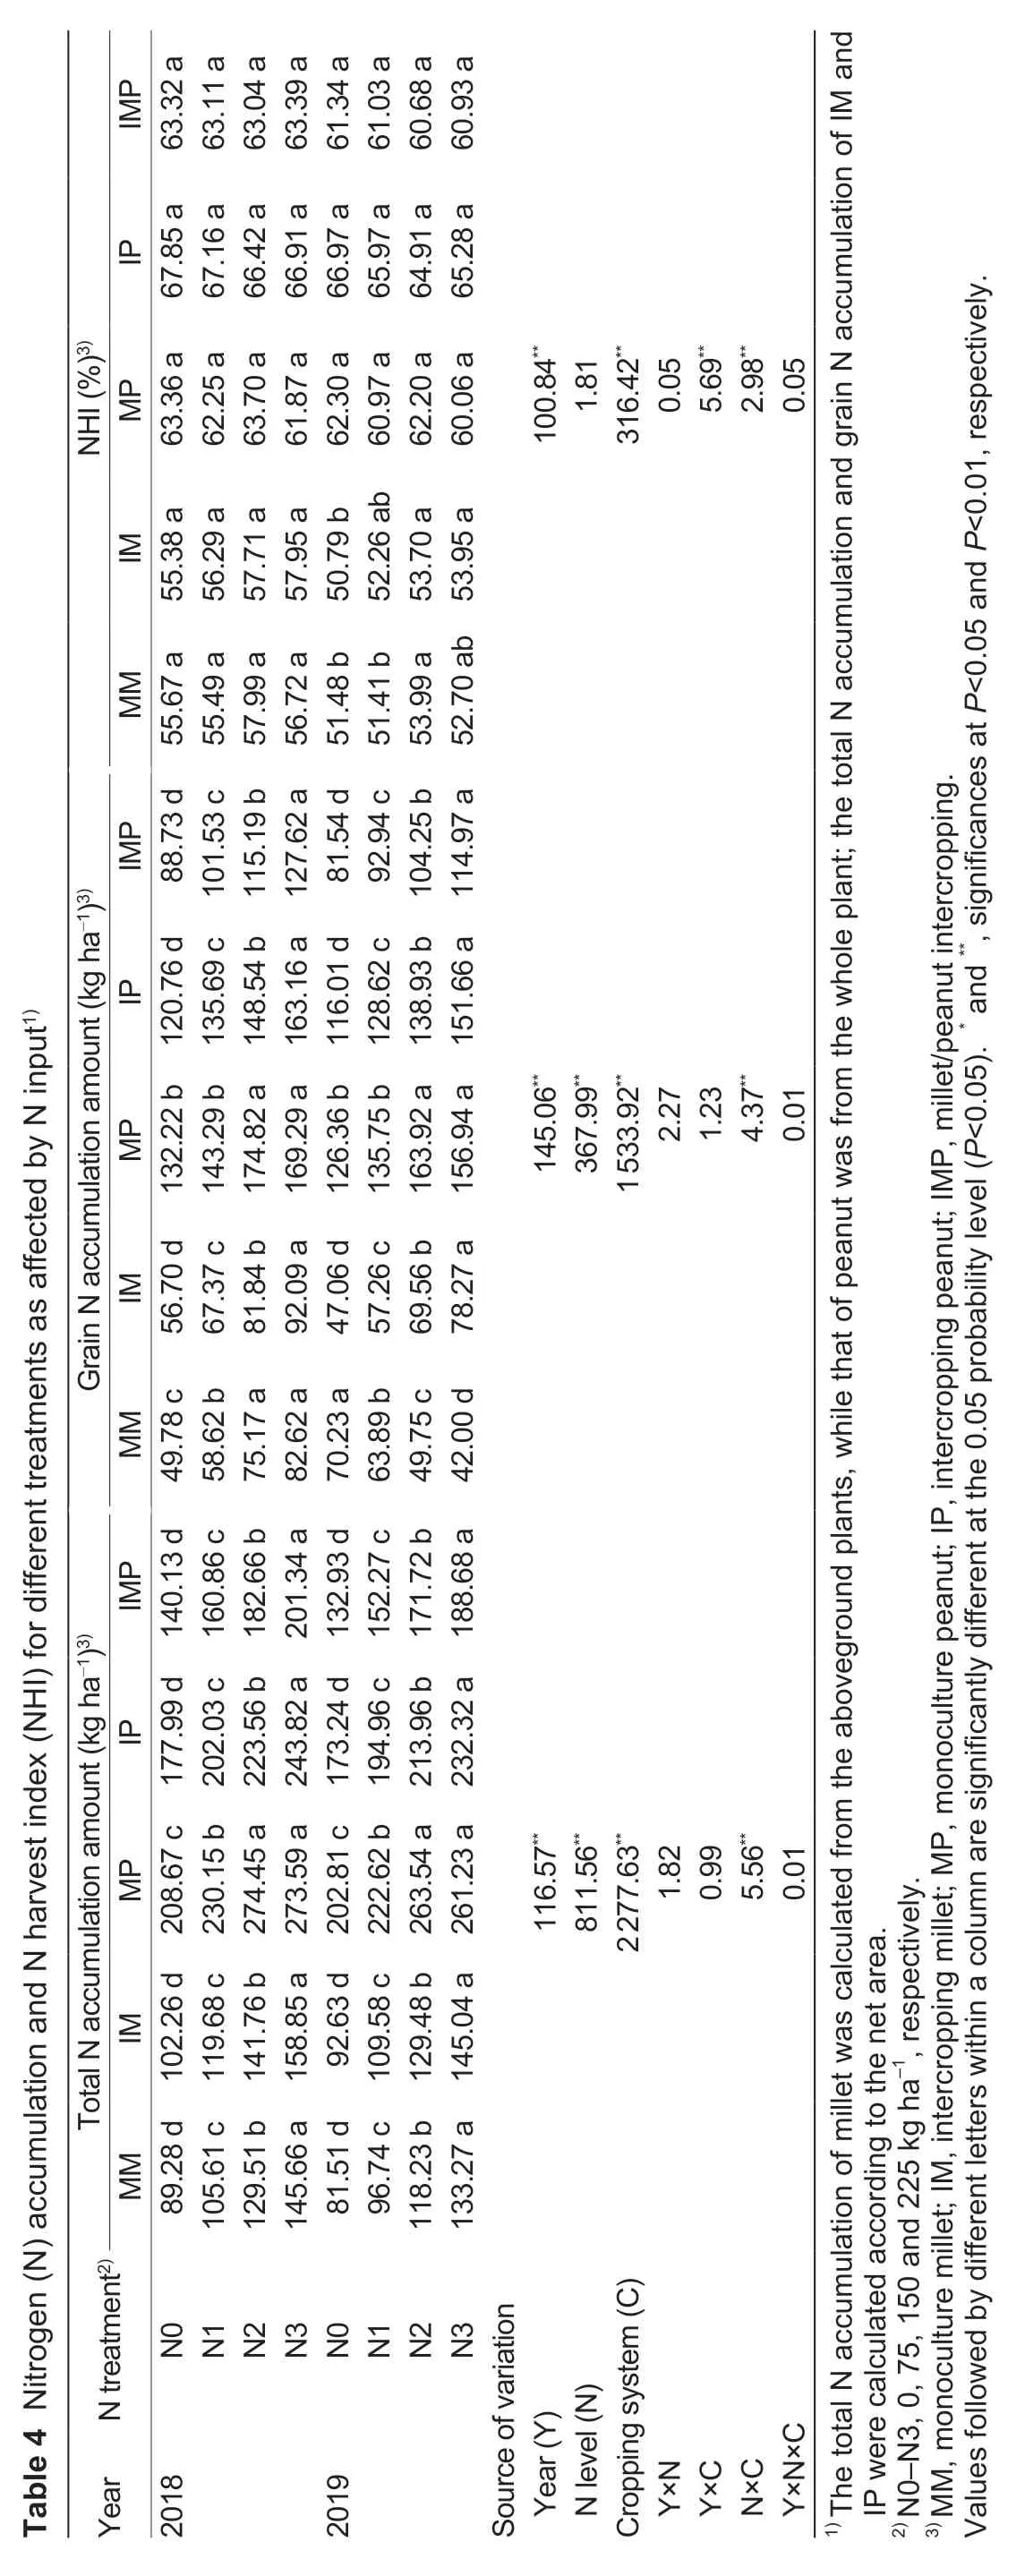
Millet and peanut N accumulation levels were significantly affected by N input (Table 4). Generally,total N accumulation was the greatest in monoculture peanut(242.13 kg ha-1averaged across the years and N levels),intermediate in intercropping (166.32 kg ha-1),and the lowest in monoculture millet (112.48 kg ha-1). Millet total N accumulation was higher in intercropping than in monoculture,while it was the opposite in peanut. For monoculture millet and the intercropping system,total N accumulation increased as N input increased,without reaching a plateau,while the total N accumulation of monoculture peanut peaked at the N2 level,but no significant difference was found between N2 and N3.Unlike in monoculture peanut,the N accumulation increased in intercropping peanut with the increase in the N level,without reaching a plateau. Compared with N0,total N accumulation in intercropping increased by 14.7,29.8 and 42.8% at the N1,N2 and N3 levels,respectively,averaged over the two years. Grain N accumulation showed a similar trend as total N accumulation. For the N harvest index (NHI),intercropping had the highest value,which was 62.11% on average over the years and N levels.
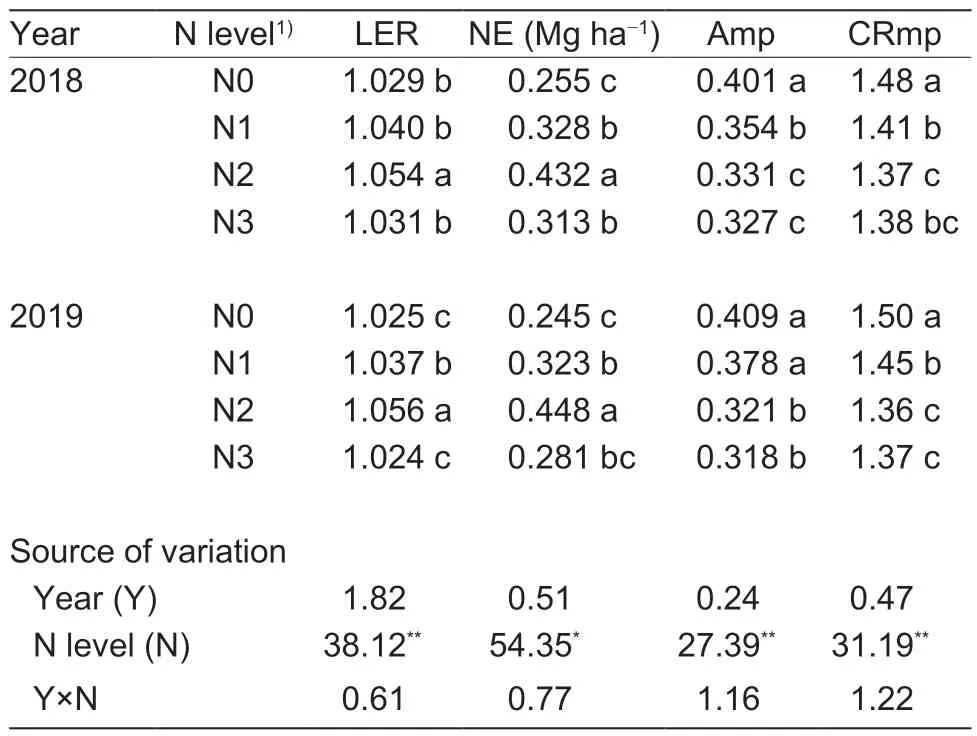
Table 3 Land equivalent ratio (LER),net effect (NE),aggressivity (Amp) and competitive ratio (CRmp) of the intercropping system as affected by N input
3.4.NAE and NUE
N input,cropping system and their interaction significantly affected the NAE and NUE of monoculture millet,monoculture peanut and the intercropping system(Table 5). For NAE,the different planting modes had different levels of performance,but the N3 level was significantly lower than those of N1 and N2 under the three planting modes (P<0.05). NUE had its highest value at the N2 level for all planting patterns over the two years. However,N input had little effect on NUE in the intercropping system.
3.5.Economic benefits
Averaged across the years and N levels,millet/peanut intercropping produced the highest net income(2 479 USD ha-1),which was 13.5 and 8.6% higher than those of monoculture millet and monoculture peanut,respectively (Table 6). The net income increased due to the application of N fertilizer,and a higher net income was found at the N2 level among all cropping systems in the two years. The intercropping system had the highest benefit-cost ratio among the three cropping systems at all N input levels (1.40 on average across the years and N levels),followed by monoculture peanut (1.29)and then monoculture millet (1.12). The N2 level of the intercropping system yielded the largest benefit-cost ratios of 1.53 in 2018 and 1.59 in 2019.
4.Discussion
4.1.Yield performance
Intercropping cereals and legumes can increase agricultural productivity and reduce the inputs of nitrogen fertilizer,which has been confirmed by many studies (Liet al.2001;Latatiet al.2014;Gonget al.2021a). In this study,the yield advantages in the millet/peanut intercropping system were observed across all nitrogen input levels. Previous studies have shown that intercropping can increase cereal yield but decrease legume yield (Liet al.2018;Zhang W Pet al.2021).Similar responses were also found in this millet/peanut intercropping system. This increase in cereal yield might be attributed to better lighting and ventilation conditions as well as interspecific facilitation in intercropping (Zouet al.2018),while the yield reduction of legumes in intercropping systems might be due to the shading effect of cereals (Wanget al.2021). In this study,the yield reduction of peanut was the smallest under the N2 level,which indicated that the appropriate N application could reduce the yield reduction range of legumes. In addition,the yield increasing effect of intercropping was weakened when the N application rate exceeded a certain level.Therefore,the combination of a suitable N application rate and intercropping mode is an important condition for improvements in grain yield. This is important for helping farmers to develop legume-based intercropping systems with low inputs and high outputs (Gonget al.2021a).
Nitrogen plays an important role in plant growth and grain yield (Latatiet al.2014). In this study,N fertilization significantly increased the yields of millet and peanut,however,the N2 level attained a higher total crop yield in the millet/peanut intercropping system than N3. These findings were consistent with the results of a maize and peanut intercropping pattern (Gaoet al.2020),indicating that reasonable N management is one of the main measures for realizing the advantages of intercropping (Gonget al.2021a). This also means that reducing the N input has a less negative effect on crop yield in intercropping than in monoculture (Gaoet al.2020). An optimum N fertilizer application rate exists in intercropping. Therefore,an N fertilizer application that is too low limits the potential yield,and one that is too high leads to increased stress on the plant in addition to serious environmental problems (Anaset al.2020). To obtain better productivity,the N application should be at the optimum level since N fertilizer is one of the important factors limiting potential yield (Xinget al.2019). In this study,millet/peanut intercropping obtained higher yields at an N input of 150 kg ha-1(6 000.0 kg ha-1in 2018 and 6 135.4 kg ha-1in 2019),showing the intercropping yield advantage. Therefore,the N2 level with a 150 kg ha-1N application rate can be used as an efficient N management practice for millet/peanut intercropping.According to the regression equation for yield change with N input,the amount of N application corresponding to the highest theoretical yield,whether peanut or millet,was lower in intercropping than in monoculture.This result indicates that there is more space for reducing N fertilizer in millet/peanut intercropping(Liu Zet al.2018).
4.2.Land use efficiency,net biodiversity effects and relative competitive abilities
The most obvious advantage of intercropping is saving land,which is usually quantified by the land equivalent ratio (LER) (Liet al.2020b). In this study,the LER values were all greater than one under any N application level (Table 3),indicating that the millet/peanut intercropping system improved land use efficiency and saved land resources. In the maize/soybean intercropping system,the LER was hardly affected by increasing N application rates (Zhang Ret al.2021). However,we found that the LER value was closely related to N input in our system. In the present study,the highest LER value was obtained at the N2 level in the two years,which means that millet/peanut intercropping is a high land use system when the N input is moderate,which is consistent with previous studies in other cereallegume systems (Hauggaard-Nielsenet al.2003;Luoet al.2016). Moreover,the LER decreased under the N3 level (Table 3),indicating that high N input trends to reduce the intercropping yield advantages. According to previous meta-analyses,the worldwide LER of intercropping averages either 1.22±0.02 (Yuet al.2015) or 1.30±0.01(Martin-Guayet al.2018),which may be caused by temporal and spatial niche differentiation (Xuet al.2020). However,the LER values in our study were lower than those in the previous studies,which might be because the millet and peanut were mostly sown and harvested at about the same time,that is,without temporal niche differentiation(Liet al.2020b). Simultaneous intercropping aggravates the shading effect,which might be mitigated by choosing a shade-tolerant variety (Liu Xet al.2018).
To quantify the difference between observed yield and expected yield in the intercropping system,the net effect (NE) was used,which can provide information on the absolute yield increase per unit area achieved by intercropping (Loreau and Hector 2001;Liet al.2020b). In this study,with an increase in the N application rate,NE increased at first and then decreased,and the N2 level hadthe highest NE value (Table 3). This difference clearly demonstrated that compared with the expected yield of the monocultures,millet/peanut intercropping can produce a greater yield per unit area. The greatest absolute yield was attained with the moderate N input,which further indicated that millet/peanut intercropping is more suitable for intermediate N input. Both CE and SE have been invoked to explain the positive diversity-productivity relationship in natural and semi-natural ecosystems (Zhang W Pet al.2021). The yield advantages in an intercropping system are generally believed to be driven by the overall functional complementarity and the temporal/space niche differentiation between the species (Zhang Ret al.2021). To understand the underlying mechanisms,we separated the CE and SE on grain yield using the additive partitioning method (Loreau and Hector 2001). We found that the values of CE and SE for grain yield were positive over the two-year study (Fig.4). From the results for the relative contributions of CE and SE to yield,we also found that CE and SE performed differently under different N application rates (Fig.5). The CE was more important for net biodiversity effects with moderate N fertilization,while the CE and SE were both important without N fertilization in the intercropping systems across the two years. This is different from a report that suggested the CE was more important for net biodiversity effects without N fertilization,while the SE was more important with N fertilization in the maize/peanut intercropping and maize/soybean intercropping systems (Zhang W Pet al.2021).In this study,moderate N fertilization increased the relative importance of CE while decreasing the importance of SE.The reason may be that moderate N fertilization contributed to the biological N fixation of legumes,thus potentially increasing the amount of N transferred to the intercropped cereals (Thilakarathnaet al.2016). Also,the interspecific competition between millet and peanut was relatively weak at a moderate N fertilization level (Table 3),leading to greater acquisition of limiting resources and therefore to higher productivity (Liet al.1999;Williamset al.2017).
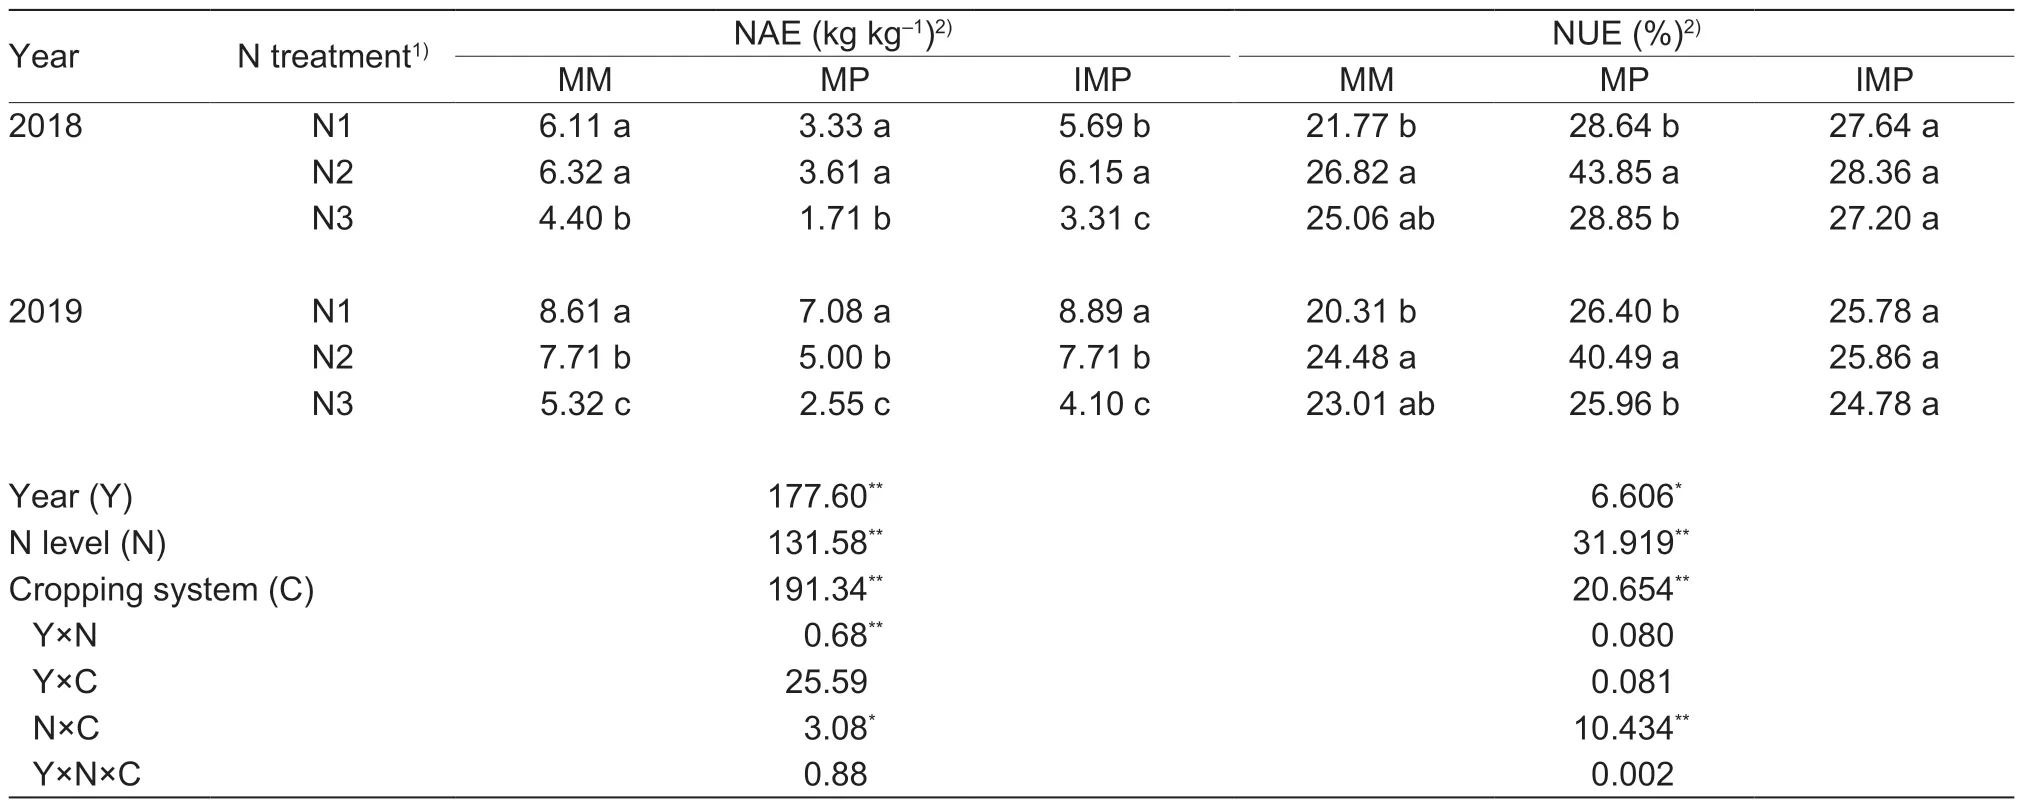
Table 5 Nitrogen (N) agronomic efficiency (NAE) and N use efficiency (NUE) for different treatments as affected by N input
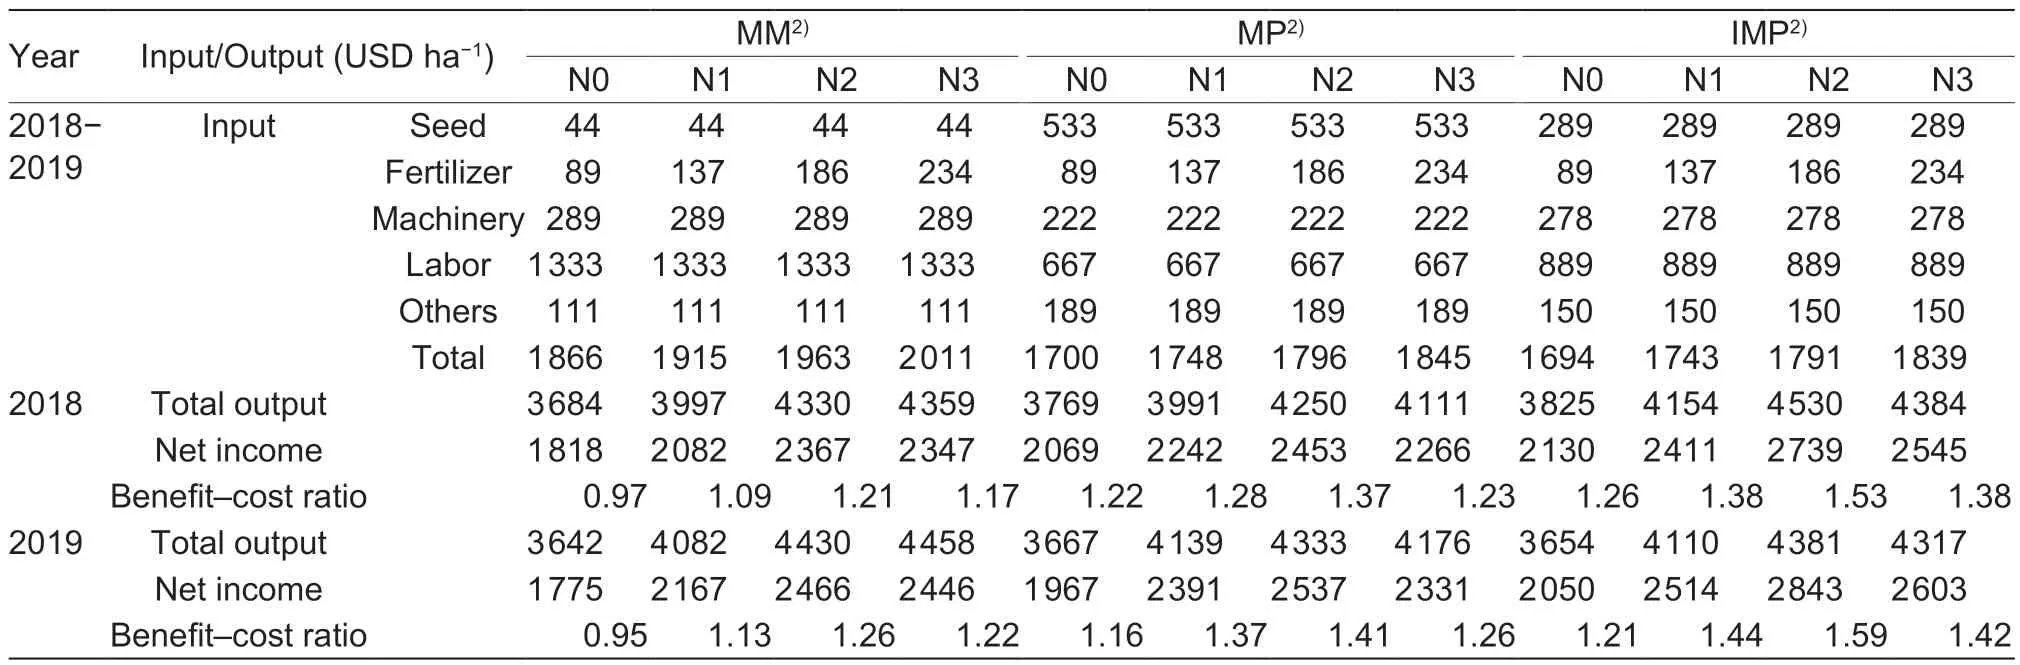
Table 6 Economic contributions for the different treatments as affected by nitrogen (N) input1)
The cereal/legume intercropping system is considered to be the most effective model among various intercropping systems (Corre-Hellouet al.2006). Most studies have shown that cereal crops have stronger competitiveness in the cereal-legume intercropping system due to their rooting patterns which differentiate them from legumes and they have a higher N demand(Trenbath 1993;Hauggaard-Nielsena and Jensena 2001). In this system,the competition of cereal crops for soil N can stimulate the biological N fixation of legumes (Andersenet al.2004). However,other studies have shown that legumes have a relatively higher competitiveness than cereals when intercropped together(Liet al.1999;Ganet al.2016). In the current study,the Amp of millet relative to peanut was consistently greater than zero,and the CRmp was greater than one,indicating that millet was the dominant crop in the system. Furthermore,the value of Amp decreased with the increase in N input,which means that interspecific competition might be alleviated by increasing the N input(Liet al.2011).
4.3.N utilization and economic benefits
The biological basis of the crop yield advantage in crop nutrition is mainly reflected in the increases in nutrient accumulation and use efficiency (Chowdhury and Rosario 1994). The higher nutrient accumulation results in greater yield (Fanet al.2020). In our experiment,the N accumulation in the intercropping peanut was lower than in the corresponding monoculture,but the intercropping millet had higher N accumulation,indicating that the ability of millet to compete for N in millet/peanut intercropping was stronger than that of peanut.Thus,the yield advantage of the intercropping system was primarily due to the higher N accumulation of the intercropping millet. Excessive N fertilizer can inhibit the N fixation ability of legumes. The N accumulation of monoculture peanut reached a peak at the N2 level,but the intercropping peanut did not reach a plateau(Table 4),which might mean that intercropping could alleviate the inhibitory effect of N fertilizer on legumes to some extent (Liet al.2009). The scientific and rational application of N fertilizer can significantly improve N use efficiency (Vitouseket al.2009). However,the overuse of N fertilizer can result in low N use efficiency,causing further negative environmental effects (Tilmanet al.2002;Guo Jet al.2010). According to Zhanget al.(2008),the N use efficiency of maize could reach 40% when the N application rate was reduced reasonably. In the present study,the NAE value of the N3 level was significantly lower than those of N1 and N2 under the three planting modes,indicating that excessive N input reduced N use efficiency. In addition,NUE reached its highest value at the N2 level for all planting patterns over the two years.This suggested that reducing N fertilizer application could achieve higher N utilization (Duet al.2020).
Whether farmers choose an intercropping mode depends on the ultimate economic benefits. Although the LER of this study was relatively low,the intercropping system had higher net incomes and benefit-cost ratios(Table 6). The reason is that intercropping reduces the inputs of plastic film,pesticide and insecticide compared with monocultures. Moreover,the inputs of machinery and labor also decreased slightly in intercropping. Obviously,the millet/peanut intercropping mode is attractive in terms of economic benefits. Meanwhile,the economic benefits of the intercropping system can be more stable in the face of market price fluctuations due to the harvesting of two crops at the same time. In either monoculture or intercropping,N application increased net income,but the income at the middle N application level was the highest.Although the yield increased slightly with the application of excessive N fertilizer,the net income decreased due to the cost of the excessive consumption of N fertilizer. It should be noted that intercropping still requires more labor in production (Chiet al.2019),so the labor shortage caused by urbanization is a challenge for the intercropping system.Therefore,realizing the mechanization of intercropping systems is worthy of further study.
5.Conclusion
Millet/peanut intercropping increased the land use efficiency relative to the corresponding monoculture,which was demonstrated by the higher LER. Millet was the dominant crop in the intercropping system.Intercropping enhanced millet productivity at the expense of peanut,but N application could reduce the yield reduction range of peanut. The yield increasing effect of intercropping was weakened when the N application rate exceeded a certain level. Among all the N levels of the intercropping system,the N2 level had the highest LER and economic benefits,and a more stable yield,in the two successive years. Lowering N inputs has less severe negative consequences for yields in intercropping than in monoculture. Overall,millet/peanut intercropping can be a suitable land use system when combined with a moderate N fertilizer application rate for the North China Plain and other areas with similar ecosystems.
Acknowledgements
This work was supported by the National Key Research and Development Program of China (2020YFD1000905)and the Natural Science Foundation of Shandong Province,China (ZR2020MC094). We thank the reviewers for their valuable comments and suggestions,and the editors for their valuable work.
Declaration of competing interest
The authors declare that they have no conflict of interest.
 Journal of Integrative Agriculture2023年3期
- Journal of Integrative Agriculture的其它文章
- Germinated brown rice relieves hyperlipidemia by alleviating gut microbiota dysbiosis
- Melatonin treatment alleviates chilling injury in mango fruit 'Keitt'by modulating proline metabolism under chilling stress
- Changes in the activities of key enzymes and the abundance of functional genes involved in nitrogen transformation in rice rhizosphere soil under different aerated conditions
- Growth and nitrogen productivity of drip-irrigated winter wheat under different nitrogen fertigation strategies in the North China Plain
- Effect of fertigation frequency on soil nitrogen distribution and tomato yield under alternate partial root-zone drip irrigation
- Phylogenetic and epidemiological characteristics of H9N2 avian influenza viruses in Shandong Province,China from 2019 to 2021