
Effects of different processing methods on the lipid composition of hazelnut oil: a lipidomics analysis
2022-11-28 13:19:30JiyngSunXionuoFengChunmoLyuShungZhouZixunLiu
食品科學(xué)與人類健康(英文) 2022年2期
Jiyng Sun, Xionuo Feng, Chunmo Lyu,*, Shung Zhou, Zixun Liu
a College of Food Science, Shenyang Agricultural University, Shenyang 110866, China
b College of Bioscience and Biotechnology, Shenyang Agricultural University, Shenyang 110866, China
Keywords:
Lipidomics
Hazelnut oil
Processing method
Lipid composition
A B S T R A C T
Although hazelnut oil is rich in nutrients, its quality is greatly affected by how it is processed. However,no studies to date have comprehensively analyzed the lipid composition of hazelnut oil using different processing methods. Here, we conducted a lipidomics analysis using UPLC-QTOF-MS to characterize the lipid composition of cold-pressed hazelnut oil (CPO), ultrasonic-assisted hexane hazelnut oil (UHO) and enzyme-assisted aqueous hazelnut oil (EAO). A total of 10 subclasses of 98 lipids were identified, including 35 glycerolipids (GLs), 56 glycerophospholipids (GPs) and 7 sphingolipids (SPs). The total lipid and GL content were the highest in CPO, GP content was the highest in UHO and the ceramide content in SPs was most abundant in EAO. Multivariate statistical analysis showed that the lipid profiles of hazelnut oil prepared with different processing methods varied. Twelve significantly different lipids (TAG 54:3, TAG 52:2, TAG 54:4, TAG 54:2, TAG 52:3, TAG 54:5, DAG 36:2, DAG 36:4, DAG 36:3, PC 36:2, PA 36:2 and PE 36:3)were identified, and these lipids could potentially be used as biomarkers to distinguish between hazelnut oil subjected to different processing methods. Our results provide useful information for hazelnut oil applications and new insight into the effects of edible oil processing.
1. Introduction
Hazelnut (Corylus heterophylla) is rich in oil and nutrients and is one of the 4 major dried fruits in the world. Hazelnut oil is a high-grade edible oil that is rich in nutrients, has a wide range of health effects and has a unique nut flavor. Fatty acids in hazelnut oil primarily consist of oleic acid (73.6% –82.6% ), linoleic acid (9.8% –16.6% ), palmitic acid (4.1% –6.8% ) and stearic acid (1.6% –3.7% ) [1],and the content of unsaturated fatty acids is as high as 90% . Previous studies have shown that the relative content of fatty acids in the hazelnut oil derived from different varieties, producing areas or processing methods are different, but the composition of fatty acids is basically the same [2,3]. Hazelnut oil is not only rich in a variety of beneficial fatty acids, but it also contains other biologically active ingredients and antioxidant active substances. For example, hazelnut oil contains a large amount ofα-tocopherol andβ-sitosterol [4,5].These natural ingredients endow hazelnut oil with anti-oxidation and anti-aging properties, improve immunity, prevent atherosclerosis and promote cholesterol degradation and metabolism. Our previous studies confirmed that hazelnut oil has hypolipidemic and antioxidant effects in hyperlipidemia rats, and different doses of hazelnut oil consumption can offset the adverse effects of a high-fat diet to varying degrees [6].
Traditional oil extraction methods have several disadvantages,including low oil yield, time-consuming operation and large solvent consumption. New methods such as supercritical CO2extraction,water enzymatic extraction, microwave extraction and ultrasonicassisted extraction are often more efficient and environmentally friendly. Several studies have shown that processing methods can affect physical and chemical indicators as well as the fatty acid and active ingredient content of vegetable oils. For example, the total phenol content and antioxidant activity of 8 nut oils extracted by the pressing method are higher than those of extracted by petroleum ether soxhlet [7]. The solubility of sterol, squalene and wax content in solvents is higher; thus, the content of these compounds in solventextracted hazelnut oil is higher than that in pressed hazelnut oil [8]. In this experiment, we used cold-pressed extraction, ultrasonic-assisted organic solvent extraction and enzyme-assisted aqueous extraction to characterize differences in the lipid composition of hazelnut oil samples. Our aim was to identify lipids that were characteristic of different hazelnut oil samples.
Lipids play an important role in life activities and have a variety of important physiological functions. Excessive lipid intake can result in abnormal metabolism and lead to a variety of diseases [9]. Lipids can be divided into eight categories: fatty acyls, glycerolipids (GLs),glycerophospholipids (GPs), sphingolipids (SPs), sterol lipids, prenol lipids, saccharolipids and polyketides [10]. Lipidomics is a branch of metabolomics that was first formally proposed by Han and Gross [11],wherein modern mass spectrometry is used to analyze the intrinsic chemistry of lipids. The emergence of high-resolution lipidomics platforms, including shotgun lipidomics, liquid chromatographymass spectrometry (LC-MS), matrix-assisted laser desorptionionization time-of- flight mass spectrometer (MALDI-TOF-MS) and imaging lipidomics, are tools that can be used to analyze lipids [12].The study of lipidomics involves the qualitative and quantitative analysis of lipids, analysis of their structural and functional properties and analysis of the dynamic changes of lipids in physiological and pathological stages. Data analysis can then be used to discover biomarkers and explore potential biochemical mechanisms. The main focus of food science is on the application of food nutrition and food safety control. Mass spectrometry has been widely used to study the composition, origin traceability, quality discrimination and authenticity identification of food [13].
No detailed studies on the lipidome of hazelnut oil have been conducted to date. In this study, lipidomics analysis was used to study hazelnut oil. High-resolution mass spectrometry and multivariate statistical analysis were used to qualitatively and quantitatively analyze the lipids in hazelnut oil. The lipid composition and structural characteristics of hazelnut oil were identified, and the effects of different processing methods on lipid composition and oil quality were explored. These data provide new insight into the processing and utilization of hazelnut oil and will aid the development of hazelnut products.
2. Materials and methods
2.1 Chemicals and reagents
Flat-European hazelnuts were purchased from Liaoning Institute of Pomology. Hazelnuts were deshelled, dried and crushed and then were placed through a 20-mesh sieve. High-performance liquid chromatography (HPLC) grade chloroform (CHCl3), methyl tert-butyl ether (MTBE), LC-MS grade acetonitrile (ACN),isopropyl alcohol (IPA) and methanol (MeOH) were supplied by Thermo Fisher Scientific (Rockford IL, USA). LC-MS grade ammonium acetate was supplied by CNW (Düsseldorf, Germany).Ultrapure water was obtained from a Milli-Q system (Milipore,Bedford, MA, USA). All lipid standards were purchased from Avanti Polar Lipids (Alabaster, Alabama).
2.2 Preparation of hazelnut oils
The preparation methods of Flat-European hazelnut oil were based on previously described methods. Three different hazelnut oil samples(cold-pressed hazelnut oil (CPO), ultrasonic-assisted hexane hazelnut oil(UHO) and enzyme-assisted aqueous hazelnut oil (EAO)) were obtained through cold-pressed, ultrasound-assisted hexane and enzyme-assisted aqueous extraction. The specific steps are detailed below.
The dried Flat-European hazelnuts were hulled and pressed for 30 min at a pressure of 40–50 MPa and temperature of 60 °C in a hydraulic press to obtain CPO. Next, 200 g of hazelnut powder that passed through a 20-mesh sieve was weighed, and ultrasonic-assisted extraction with hexane was used to extract Flat-European hazelnut oil.The extraction parameters were as follows: ratio of material to liquid 1:6, ultrasonic power 70% (210 W), extraction temperature 47.5 °C,extraction time 31 min and centrifugation at room temperature 8 000 r/min for 20 min; the supernatant was then collected and the solvent removed by rotary evaporation to obtain UHO [14]. A certain quantity of hazelnut powder was weighed, and distilled water was added to it to achieve a 1:5 (m/V) ratio of solid to liquid; the solution was then left to soak at 45 °C for 1 h. The pH was adjusted to 7.5,and 2% neutral protease was added. The sample was then placed in a 45 °C thermostat water bath and heated for 2 h, followed by boiling water for 10 min. EAO was obtained by centrifugation at 3 500 r/min for 20 min after cooling [15].
2.3 Sample preparation
A liquid oil sample was used in this study; there was thus no need for an excessive pretreatment process. The hazelnut oil sample(20 g) was diluted to 5 mg/mL, and 10 μL to 950 μL isopropanol was added along with a 50 μL (10 μg/mL) internal standard. After passing through a 0.22 μm organic filter membrane, testing was then conducted on the machine. Three hazelnut oil samples were mixed in equal quantities to obtain a quality control sample (QC sample) for quality control.
2.4 LC-MS data acquisition
A Shimadzu 30A system (Shimadzu Corporation, Kyoto, Japan)with a SIL-30A autosampler, equipped with a Phenomenex Kinetex C18column (100 mm × 2.1 mm, 2.6 μm) and a Phenomenex Security Guard precolumn of the same material coupled to a quadrupole timeof-light mass spectrometer (LC-Q-TOFMS, Triple TOF 6600 system,Applied Biosystems/MDS Sciex, Concord, ON, Canada) with an ESI source, was used to determine the Flat-European hazelnut oil lipid profile. Analyst 1.6 software (Applied Biosystems) was used to acquire chromatographic and mass spectrometry data. The injection volume was 1 μL, and the column temperature was maintained at 60 °C. The flow rate was 0.4 mL/min. The mobile phase consisted of A (H2O:MeOH:ACN = 1:1:1 + 5 mmol/L NH4Ac ) and B (IPA:CAN=5:1 + 5 mmol/L NH4Ac), and the elution gradient was as follows:0.5 min, 20% B phase; 1.5 min, 40% B phase; 3 min, 60% B phase;13 min, 98% B phase; 13.1 min, 20% B phase; and 17 min, 20% B phase. Information-dependent acquisition was performed for data acquisition and MS/MS analysis. Specific parameters are as follows: AB Sciex TripleTOF ? 6 600, ESI ion source, positive- and negative-ion modes, mass range ofm/z100-1 200. Mass spectrometry conditions are as follows: curtain gas, 35.000 psi; ion source gas 1,50.000; ion source gas 2, 50.00; ionspray voltage, 5 500.00 V; and temperature, 600 °C.
2.5 Lipid data processing
In the qualitative analysis of lipids, the freely available MS-DIAL and software packages PeakView, MasterView and MultiQuant(SCIEX) were used. Before MS-DIAL data processing, the raw data files (.wiff format) were converted to files in basic file format(.abf). Peak detection, calculation area and baseline correction were first applied to the MS data. The public MS/MS spectral library was used to match the spectra of the MS data and realize the identification of lipids. After lipid identification, MasterView(Version 2.0) was used to establish the quantitative method of lipid name, retention time andm/z. The absolute content of lipids in the sample was calculated by the method of peak area and the internal standard of stable isotope labeling. The internal standard information is shown in Table S1.
2.6 Statistical analysis
SIMCA version 15.0 software package (Umetrics AB, Umea,Sweden) was used to perform multivariate statistical analysis of the processed LC/MS data. Unsupervised principal component analysis(PCA) was performed by the statistics function prcomp within theR.Significantly different lipids between groups were determined by variable importance in projection (VIP) > 1 andP< 0.05. VIP values were extracted from the partial least squares discriminant analysis (PLS-DA) results, score plots and permutation plots, which were generated using theR. The data were Pareto-scaled before the PLS-DA. To avoid over fitting, a permutation test (200 permutations)was performed.
3. Results
3.1 Qualitative analysis of hazelnut oil lipids
Hazelnut oil samples were analyzed by UPLC-QTOF-MS in positive and negative ion modes, including 3 EAOs, 3 CPOs,3 UHOs and 3 QC samples. Fig. 1 shows the overlay of the total ion chromatogram (TIC) of QC samples detected by mass spectrometry.The results show that the curves of the total ion flow have high overlap; that is, the retention time and peak intensity are consistent.This indicates that the signal stability is high when the same sample is detected at different times by mass spectrometry, thus confirming the repeatability and reliability of the data. Table S2 shows the specific qualitative and quantitative results, including lipid name, retention time andm/z, etc.
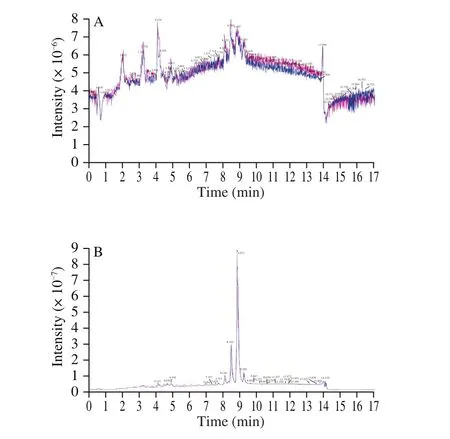
Fig. 1 Overlay of the TIC. (A) TIC overlap in negative ion mode. (B) TIC overlap in positive ion mode.
The characterization of lipid structure is one of the most important and fundamental components of the study of lipidomics, as the chemical structure of lipids determines the different fragmentation regularities. For example, the category GP depends on the structure of the X residue linked to the phosphate group. The fragmentation of deionized GP in the negative ion mode generates some specific fragmentation ion peaks, which can be used to determine the connection locations of fatty acids and qualitative analyze the isomers. However, TG is easily ionized into ammonium, lithium,sodium and other adducts in positive ion mode, which is more sensitive than anionic adducts in negative ion mode. In this study, a total of 98 lipids were identified in hazelnut oil samples, including 63 lipids in negative ion mode and 35 lipids in positive ion mode(Fig. 2A). As shown in Fig. 2B, lipids were classified into 3 lipid categories (GL, GP and SP) and 10 subclasses. There were 2 subclasses of GLs (diacylglycerol (DG) and triacylglycerol(TG)), 7 subclasses of GPs (glycerophosphatidic acid (PA),glycerophosphatidylcholine (PC), glycerophosphatidylethanolamine(PE), glycerophosphatidylglycerol (PG), glycerophosphatidylinositol(PI), and other GPs (PEtOH, PMeOH)) and 1 subclass of SP(glycerophosphatidic acid (Cer)).
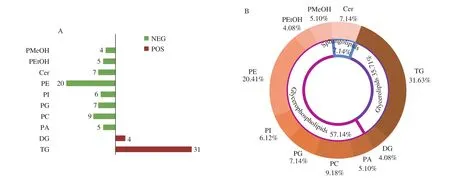
Fig. 2 Qualitative analysis of lipid subclasses in hazelnut oil. (A) Comparison of the numbers of lipids identified between positive and negative ion modes.(B) Percentages of the numbers of lipid subclasses.
3.2 Quantification of hazelnut oil lipids
Based on the high-resolution QTOF mass spectrometry, the accurate molecular weight of the characteristic peaks in the samples was obtained, and these weights were compared with the database information to obtain the qualitative results. According to the ion signal strength of the characteristic peaks in the mass spectrum, the quantitative results were obtained. The quantitative formula is as follows:
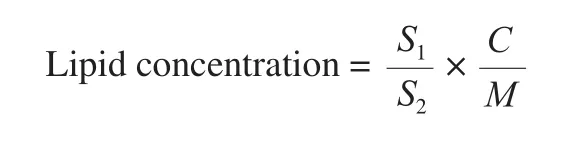
in whichS1represents peak area of the object to be measured,S2represents internal standard peak area,Crepresents internal standard concentration,Mrepresents sample mass or volume.
The total lipid content identified in CPO, UHO and EAO was 1 248 646.632 5, 1 056 993.741 6 and 1 027 794.902 7 nmol/g,respectively. The percentage of the total lipid content of each subclass was obtained by adding the lipid content of the same subclass;as shown in Figs. 3A-3C, TGs (98.498 48% , 98.324 12% and 98.429 83% ) accounted for the largest proportion in CPO, UHO and EAO groups, respectively, followed by DGs, PAs and PEs. Fig. 3D further compares the difference in lipid content of the same subclasses in 3 different hazelnut oils using box plots. The content of GLs(TGs and DGs) was higher in the CPO group than in the UHO and EAO groups, and the content of GPs was highest in the UHO group,especially PCs, PIs and PEs. The content of GLs and GPs in the EAO group were both lower than those in the other two groups; only the content of Cer in SPs was higher in the EAO group.
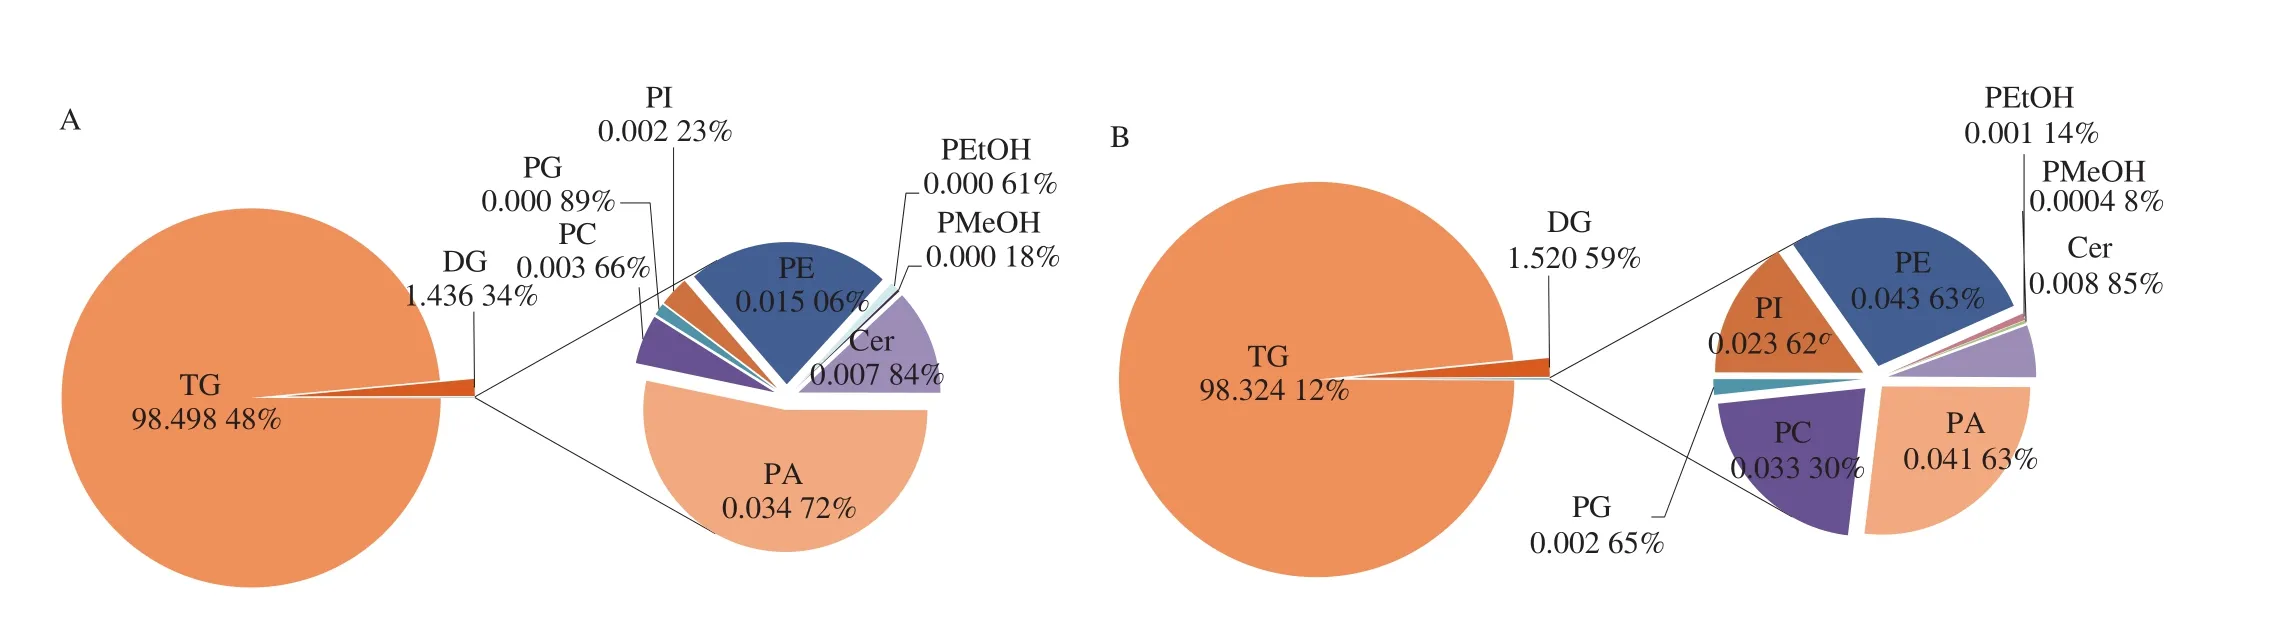
Fig. 3 (A) Percentages of lipid subclasses in CPO. (B) Percentages of lipid subclasses in UHO. (C) Percentages of lipid subclasses in EAO. (D) Comparison of the content of lipid subclasses in CPO, UHO and EAO. D1-D10 were TG, DG, PA, PC, PG, PE, PI, PEtOH, PMeOH, Cer.

Fig. 3 (Continued)
The molecular structures of the 31 TAGs were analyzed, and a total of 15 fatty acids were found. Except for C12:0lauric acid, C14:0myristic acid , C17:0margaric acid and C18:3linolenic acid, the contents of other fatty acids in the CPO group were significantly higher than those in the UHO and EAO groups (Table S3). However, after calculating the percentage of each fatty acid, it was found that the percentages of unsaturated fatty acids in CPO, UHO and EAO were 93.39% , 93.30% and 93.55% , respectively. The percentages of C18:0stearic acid, C18:1oleic acid, C20:0arachidic acid and C20:1linoleic acid in CPO were significantly higher than those in the other two groups(P< 0.05). But the percentages of C18:2linoleic acid and C18:3linolenic acid were significantly lower than the other two groups (P< 0.05)(Table 1).
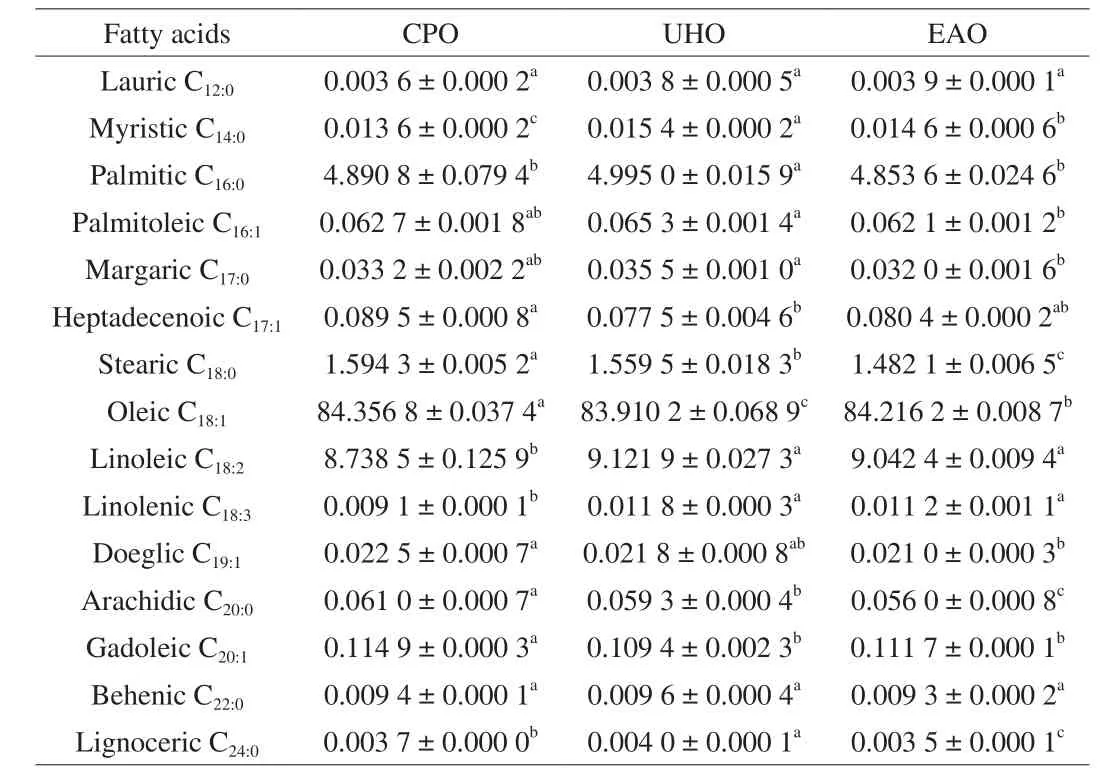
Table 1Composition of fatty acids in CPO, UHO and EAO (% ).
3.3 Supervised and unsupervised multivariate analysis
Multivariate statistical analysis can simplify and reduce the dimensions of high-dimensional and complex data while retaining much of the original information; it can also be used to establish a reliable mathematical model to summarize the characteristics of the metabolic spectrum. PCA is a multidimensional statistical analysis method for unsupervised pattern recognition [16]. PCA analysis of hazelnut oil samples subjected to different processing methods can provide preliminary insight into the overall differences between samples as well as variation between samples within groups. Clear differentiation in the samples can be observed in the PCA score plot(Fig. 4A). The distance between samples in the figure represents the difference between treatment groups. Closer distances correspond to higher similarity, and greater distances correspond to greater differences. Hazelnut oil samples subjected to different processing methods were significantly different in the figure. The cumulative contribution rates of the first principal component (PC1) and second (PC2) reached 98.92% , which indicated that the fit of the model was high and that the multidimensional statistical analysis results were reliable. The loading plot of the overall sample PCA (Fig. 4B) shows that the lipid species of the TG class were the most important variables contributing to the discrimination between hazelnut oils.
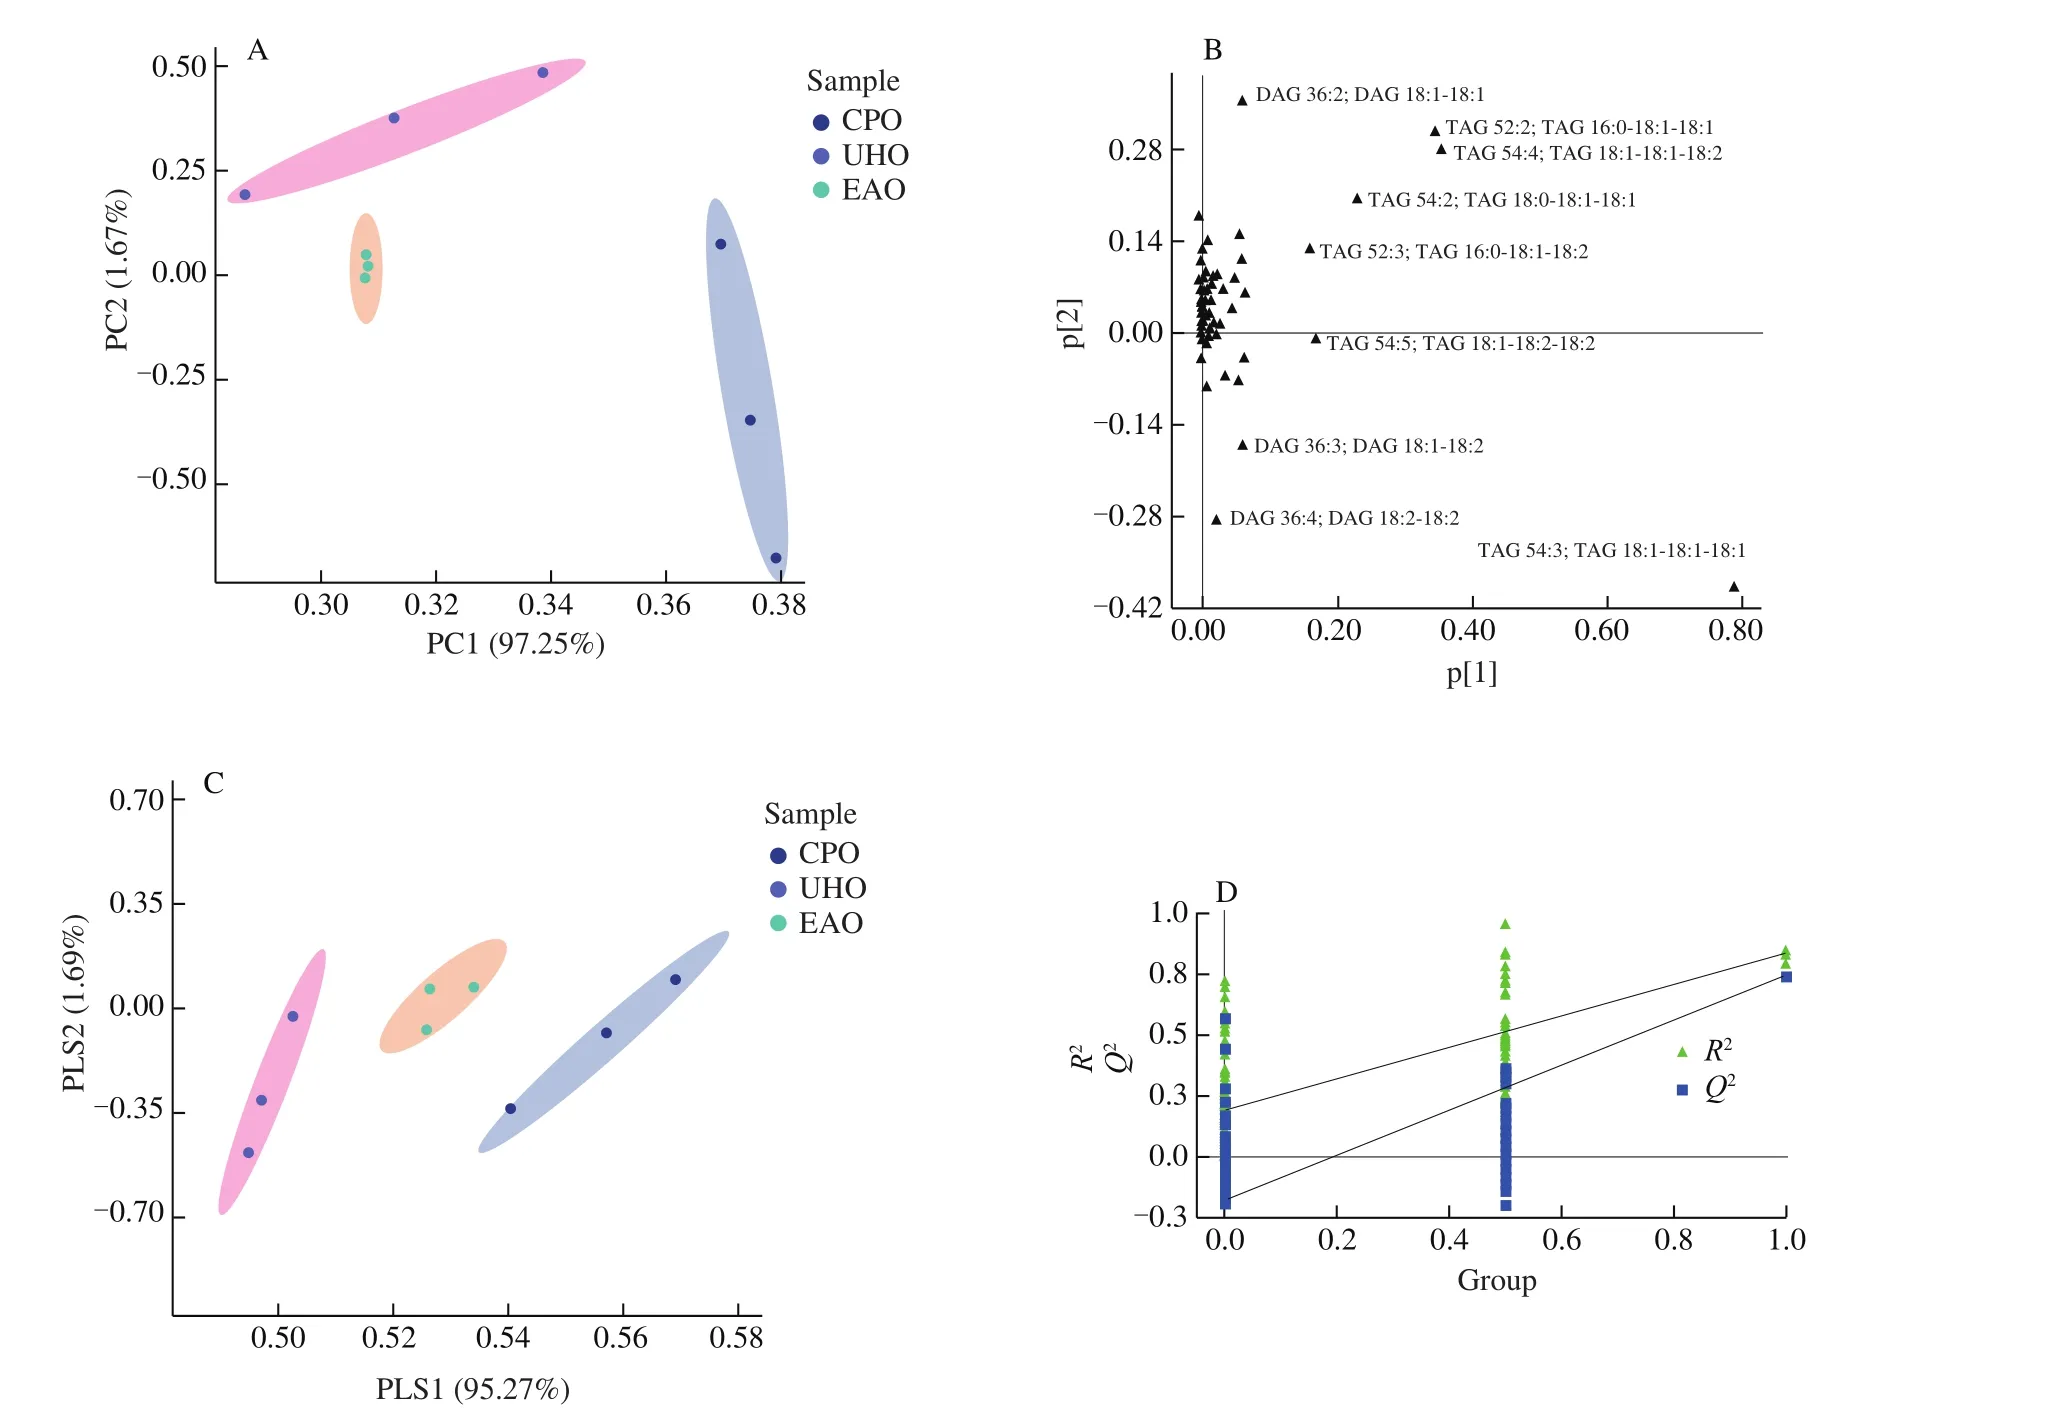
Fig. 4 Unsupervised and supervised multivariate analysis of the detected lipids in CPO, UHO and EAO. (A) PCA score plot. (B) PCA loading plot. (C) PLS-DA scores plot. (D) PLS-DA cross-validation plot.
To identify the differential lipids between the three hazelnut oil samples, PLS-DA was performed. PLS-DA is a supervised classification statistical method that is widely used to analyze differences between samples in different treatments as well as for the discovery and screening of biomarkers. The score plot(Fig. 4C) shows that the PLS-DA model could effectively distinguish the three hazelnut oils. The classification parameters were, andP= 0.009 614 1, values that were stable and indicated high fit and predictive power. To further verify the effectiveness of the model, we conducted 200 cross-validations to evaluate its stability and predictive ability. TheR2andQ2values were 0.868 7 and 0.776 9, respectively (Fig. 4D). The results indicate that the PLS-DA model had high reliability and predictive power and was not over fit.
Overall, there was clear separation among the three groups,suggesting that PCA and PLS-DA models could be used to identify differences between CPO, UHO and EAO.
3.4 Analysis of significantly different lipids in EAO, CPO and UHO
We used the VIP in the PLS-DA model to analyze the three different hazelnut oils. This value represents the contribution rate of this variable to the model. Lipids were considered significantly different when VIP > 1 andP< 0.05. Overall, 12 significantly different lipids were identified (Fig. 5A), including 6 TAGs (TAG 54:3; TAG 18:1-18:1-18:1, TAG 52:2; TAG 16:0-18:1-18:1, TAG 54:4; TAG 18:1-18:1-18:2, TAG 54:2; TAG 18:0-18:1-18:1, TAG 52:3; TAG 16:0-18:1-18:2 and TAG 54:5; TAG 18:1-18:2-18:2), 3 DAGs (DAG 36:2; DAG 18:1-18:1, DAG 36:4; DAG 18:2-18:2 and DAG 36:3; DAG 18:1-18:2), 1 PC (PC 36:2|PC 18:1_18:1), 1 PA (PA 36:2|PA 18:1_18:1) and 1 PE (PE 36:3|PE 18:1_18:2).
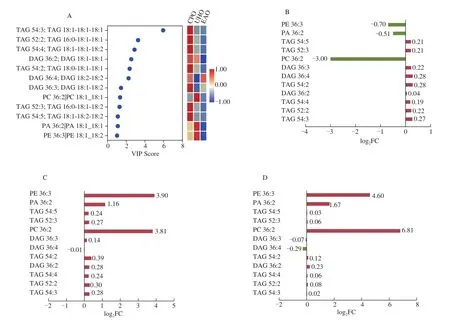
Fig. 5 (A) PLS-DA VIP score plot. The colored boxes on the right indicate the relative concentrations of the corresponding lipids. (B) Fold-change histogram between CPO and UHO. (C) Fold-change histogram between the CPO and EAO. (D) Fold-change histogram between the UHO and EAO.
We used the fold change to perform pairwise analysis to further compare the three processing methods (Figs. 5B–5D). After taking the logarithm of the fold-change value, 9 of the 12 significantly different lipids in the CPO group were up-regulated, and 3 were downregulated compared with the UHO group, among which PCs had the largest change (Fig. 5B). Compared with the EAO group, the CPO group had 11 significantly different up-regulated lipids and 1 downregulated lipid; PEs showed the largest change (Fig. 5C). Compared with the EAO group, 10 significantly different up-regulated lipids and 2 down-regulated lipids were observed in the UHO group, and PCs changed the most (Fig. 5D). The greatest changes in lipids were not observed for TG, which were the most abundant in hazelnut oil;instead, they were observed for GP, which was low in content in hazelnut oil. These changes in lipid content may affect the quality and function of lipids; there is thus a need to conduct further study of specific subclasses of lipids in the future. These significantly different lipids could be used as potential biomarkers to control the quality of these three different processing methods during the processing of Flat-European hazelnut oil.
4. Discussion
Hazelnut is rich in oil and bioactive substances and has broad development prospects; it can be processed into a variety of byproducts. Hazelnut oil is a new type of edible oil that has received much recent attention because of its nutritional properties [17,18]. We conducted a lipidomics analysis of hazelnut oil given that the lipid composition of hazelnut oil has not been extensively studied. UPLCQTOF-MS was used to analyze the non-targeted lipid profiles of hazelnut oil subjected to different processing methods, and their lipid compositions were determined. Including polar and non-polar lipids,a total of 98 lipids were qualitatively and semi-absolutely quantified.
Lipidomics analyses have been most frequently conducted in olive oil. Alves et al. [19]summarized some studies on the identification of polar lipids in olive oil and found that the main GPs were PGs,PEs, PAs and lyso-PAs. However, these studies used different extraction methods and mass spectrometry types; consequently, the results differed. Specifically, they used C30reversed-phase liquid chromatography (LC) and normal-phase hydrophilic interaction liquid chromatography (HILIC), both of which were coupled to electrospray ionization-mass spectrometry (ESI-MS), and ESI-MS/MS identified 71 TAG ions and 107 polar lipids [20]. Napolitano et al. [21]used LC-ESI/LTQOrbitrap/MS/MSnto identify 120 lipids in fresh and baked hazelnuts.
In this study, 98 lipids were identified, including 35 neutral lipids and 63 polar lipids. Compared with other vegetable oils, the number of identified lipids was lower, which may be related to the type of oil seeds, as well as the fact that a liquid oil sample was used. TAGs accounted for 98% of the total lipid content, which may have affected the identification of some extremely low-abundant lipids. There are no studies that provide a basis for comparison given the lack of studies of hazelnut oil. The structure analysis of TAG molecule revealed that these fatty acids were more abundant than those determined by GC-MS. The detection of C12:0lauric acid, C22:0behenic acid and C24:0lignoceric acid, which were low in content, indicated that this method has higher sensitivity.
Previous studies have shown that different processing methods can affect the lipid composition of vegetable oil. Xu et al. [22]compared the trace active components in peanut oil extracted by coldpressed, hot-pressed and enzyme-assisted aqueous extraction methods and found that hot pressing peanut oil can produce more active components. Animal experiments have further verified that different production processes can affect lipid metabolism in SD rats, and coldpressed peanut oil can significantly improve abnormal metabolism.Xie et al. [23]analyzed the lipids in cold-pressed rapeseed oil by direct infusion chromatography-tandem mass spectrometry, and a total of 92 PLs and 67 TAGs were identified. Microwave treatment had the most significant effect on PLs; specifically, the content of PLs increased by 40 times after microwave treatment.
In this study, we found that the GL content in cold-pressed hazelnut oil was the most abundant after quantitative analysis, which may stem from the higher lipid concentration caused by mechanical extrusion. The content of GPs in the UHO group was the highest, and the content of PCs, PIs and PEs were significantly higher in UHO compared with the other groups; the content of PAs was 117 times higher in UHO than in EAO. This result may stem from the fact that GPs are the main component of the biofilm. For UHO, hazelnuts are soaked in organic solvents, and the solvent destroys the cell membrane, which increases the release of GPs. GPs are amphiphilic and easily form emulsifiers in solution, which affects the quality of edible oil. Generally, GPs will be removed in the process of deacidification and degumming in commercial production; however,these substances have a certain antioxidant capacity and synergistic effect with phenols in oil, which can inhibit the oxidation of vegetable oil to a certain extent [24]. The content of SPs was higher in EAO than in the other two groups, which was mainly driven by Cer-NS; the increase in this substance could play a role in alleviating inflammation and repairing lipid barriers in the skin [25]. In conclusion, CPO appears to be the optimal choice in terms of lipid composition. The results of the multivariate statistical analysis revealed clear variation in hazelnut oil subjected to different processing methods, and the 12 significantly different lipids identified could be used as potential biomarkers. Generally, the results of this study provide new insight into the effect of different processing methods on vegetable oils.
5. Conclusions
In this study, a non-targeted lipidomics analysis of hazelnut oil using UPLC-QTOF-MS was conducted. The lipid composition of CPO, UHO and EAO was analyzed qualitatively and quantitatively,and 10 subclasses of 98 lipids were identified. Twelve significantly different lipids were identified by supervised and unsupervised multivariate statistical analysis. The significantly different lipids could be used as potential biomarkers to distinguish the three processing methods of hazelnut oil as well as for other adulteration detection and quality discrimination applications. This study clarified the lipid composition of hazelnut oil and confirmed the effect of different processing methods on vegetable oil lipids. The results of this study aid our understanding of the mechanisms of oil processing, provide useful information to aid future studies of specific lipids and promote the development and application of hazelnut oil.
Acknowledgments
This work was supported by Key R&D Project of Liaoning Province, under Grant Research and Demonstration of Key Technologies for Deep Processing and Comprehensive Utilization of Northeast Hazelnuts (2020JH2/10200037); Service Local Project of Liaoning Province, under Grant Demonstration and Promotion of new deep-processing technology for comprehensive utilization of Northeast Hazelnuts (LSNFW201903) and horizontal subject,under Grant Demonstration and Promotion of key technologies for transformation and deep processing of wild hazelnut forest in northwestern Liaoning (H2019388).
Conflicts of Interest
The authors declare that they have no conflicts of interest.
Appendix A. Supplementary data
Supplementary data associated with this article can be found in the online version, at http://10.1016/j.fshw.2021.11.024.
- 食品科學(xué)與人類健康(英文)的其它文章
- Deletion of the waaf gene affects O antigen synthesis and pathogenicity in Vibrio parahaemolyticus from shell fish
- Free fatty acid receptor 2 promotes cardiomyocyte hypertrophy by activating STAT3 and GATA4
- Comprehensive evaluation of Actinidia arguta fruit based on the nutrition and taste: 67 germplasm native to Northeast China
- Transcriptome-based insights into the calcium transport mechanism of chick chorioallantoic membrane
- Flavonoids of Rosa rugosa Thunb. inhibit tumor proliferation and metastasis in human hepatocellular carcinoma HepG2 cells
- Effects of different drying methods on phenolic components and in vitro hypoglycemic activities of pulp extracts from two Chinese bayberry(Myrica rubra Sieb. et Zucc.) cultivars