
Imaging volumes during COVID-19: A Victorian health service experience
2022-09-01 05:39:26JoAnnePinsonMyLinhDiepVinayKrishnanCarolineAirdCassieCooperChristopherLeongJeffChenNicholasArdleyEldhoPaulMohamedKhaldounBadawy
World Journal of Radiology 2022年8期
INTRODUCTION
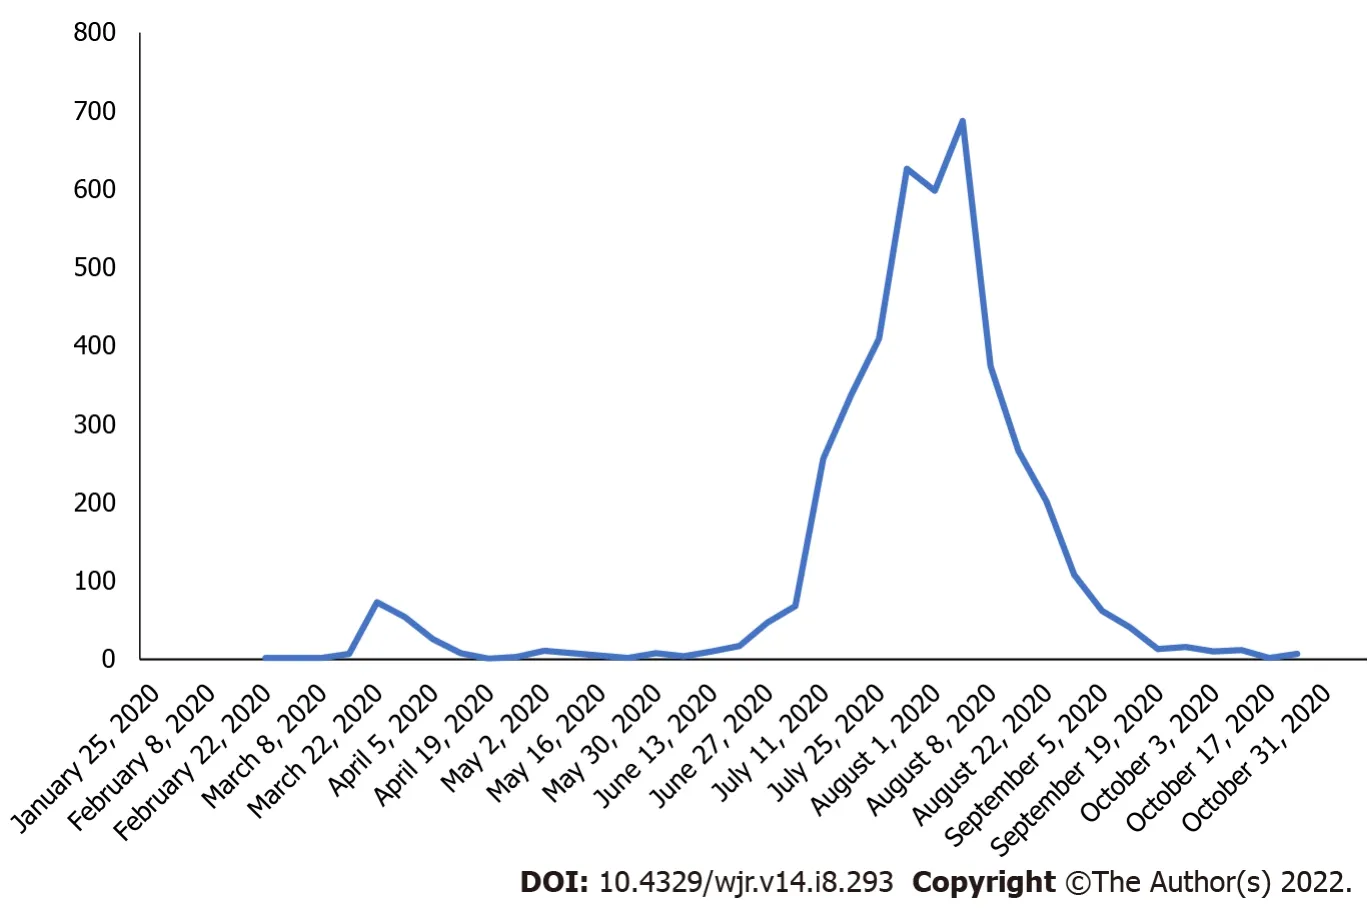
The World Health Organisation declared the coronavirus disease 2019 (COVID-19) a pandemic on March 11, 2020[1]. Healthcare facilities implemented strict infection control, social distancing protocols, and other measures in the interest of public health and safety[2]. In preparation for the surge in hospitalisations across the globe, overall elective surgical services decreased by approximately 72%[3]. In comparison, in Australia, this fell by about 69%. Others utilised computational modelling to help predict the health services saturation point for ICU beds and ventilators[4]. While globally, the relative caseload has been high, Australia’s has been relatively low. In this context, during 2020, Victoria has experienced most of Australia’s cases, with the new daily caseloads shown in Figure 1.
Due to the overwhelming prevalence of COVID-19 in various countries, for example, Italy, some radiology departments were dedicated to imaging COVID-19 patients only[5]. Radiology services have also seen significant changes in workflow across modalities and a reduction in imaging volumes[6-8]. For example, departments were re-configured to separate COVID-19 patients from non-infected patients, segregation of staff to reduce infection transmission, increased demand for PPE, radiologists reporting from home, and expansion of video conferencing use[5,9]. For patients presenting to the emergency department, general radiography was primarily used due to its accessibility, availability and low radiation levels. The chest X-ray was an ideal first choice for patients with typical symptoms of COVID-19, such as shortness of breath on exertion, persistent cough and chest pain [8]. To minimise the transmission risk of suspected COVID-19 (sCOVID) patients in hospital, mobile imaging became particularly important to manage workflow[10,11]. Imaging in the ward wearing PPE could reduce staff exposure, with effective cleaning of mobile units possible between imaging patients, without compromising patient care.
While it has been reported, there was a decrease in patients presenting with stroke to our institution during the pandemic[7]. To our knowledge, little is known about the severity of impact on radiology volumes in Australia. While overall Australian imaging volumes were analysed through Medicare, no institutional experience has been presented[12].
Objectives
This study investigates the imaging volume changes during the pandemic across the network at a large Victorian public health service provider. A secondary aim was to study changes in mobile imaging utilisation and whether that impacted the use of fixed (non-mobile) X-ray imaging systems. This data will help inform radiology practices for service adaptation with subsequent pandemic phases or other “once in a lifetime” events.
MATERIALS AND METHODS
This health network has 98 imaging systems across eight imaging modalities analysed according to Table 1.

Study setting
Our network provided over three million episodes of care from 2019 to 2020. Three of our five hospitals provide accident and emergency services, and one is a geriatric centre, and the other is an oncology centre that did not service COVID-19-positive patients (‘clean site’). Data from the geriatric and oncology centre were excluded due to heterogeneity in these sites. Significant federal, state and local health policy and guideline changes were implemented and updated during the pandemic that impacted the imaging pathway, including: patients with typical respiratory symptoms (fever, chest tightness, dyspnoea, cough) were classified as sCOVID-19 (suspected COVID-19); recommendation for all eligible sCOVID-19 patients to have computed tomography (CT) pulmonary angiography (CTPA) instead of V/Q scans[13]; rescheduling of non-urgent cases as discussed with referring clinicians; use of mobile X-ray to reduce infection transmission; social distancing guidelines restricting patient waiting room numbers and minimum area of 4 m
per person in shared spaces.
Desperately8, she scanned the block in both directions. Small mounds9 of snow and ice coated the sidewalks. Walking safely would be difficult for people who were steady on their feet, much less someone in Grandpa’s condition.
Data collection
Our angiography statistics represented interventional radiology procedures performed in the angiography suite primarily guided by fluoroscopy or ultrasound. Like other modalities, the angiography suite was substantially impacted in outpatient volume when the Department of Health and Human Services ruled that only Category 1 patients could attend. In April and August 2020, there was a decrease in inpatient studies. However, recovery in this patient class was swift, with patient volume surpassing pre-COVID attendances. Patients delayed procedures during the first wave of COVID-19 for fear of contracting the virus while in hospital.[7] This increased unplanned hospital admissions with patients requiring procedures, leading to increased service demand. Some patients may have also been scheduled to relieve burgeoning waitlist times.
Statistical analysis
Weekly volumes across patient class, modality and mobile imaging were summed for defined periods: wave 1 (weeks 11 to 16 for 2019; weeks 63 to 68 for 2020) and wave 2 (weeks 28 to 43 for 2019; weeks 80 to 95 for 2020). This was to evaluate the impact of COVID-19 on patient class, modality and mobile imaging case volumes during each COVID-19 wave. For analysis of mean weekly case numbers, pre-COVID data were defined as weeks 1 to 60 (
January 2, 2019 to February 29, 2020), while COVID-19 data were defined as the mean of weeks 61 to 104 (
March 1, 2020 to December 31, 2020). Independent sample
-tests were performed comparing the mean weekly imaging case volumes in the years 2020 and 2019 for each imaging modality type stratified by patient service locations for the pre-COVID-19 and post-COVID-19 periods with results presented as means and 95% confidence intervals (95%CI). The relationship between mobile and non-mobile imaging volumes was assessed using Spearman rank correlation. Statistical significance was considered for
values < 0.05. All analyses were performed using SAS version 9.4 (SAS Institute, Cary, NC, United States). Dr Eldho Paul reviewed the statistical methods of this study from Monash University.
This study was approved by the Monash Health Human Research Ethics Committee.
RESULTS
Adults
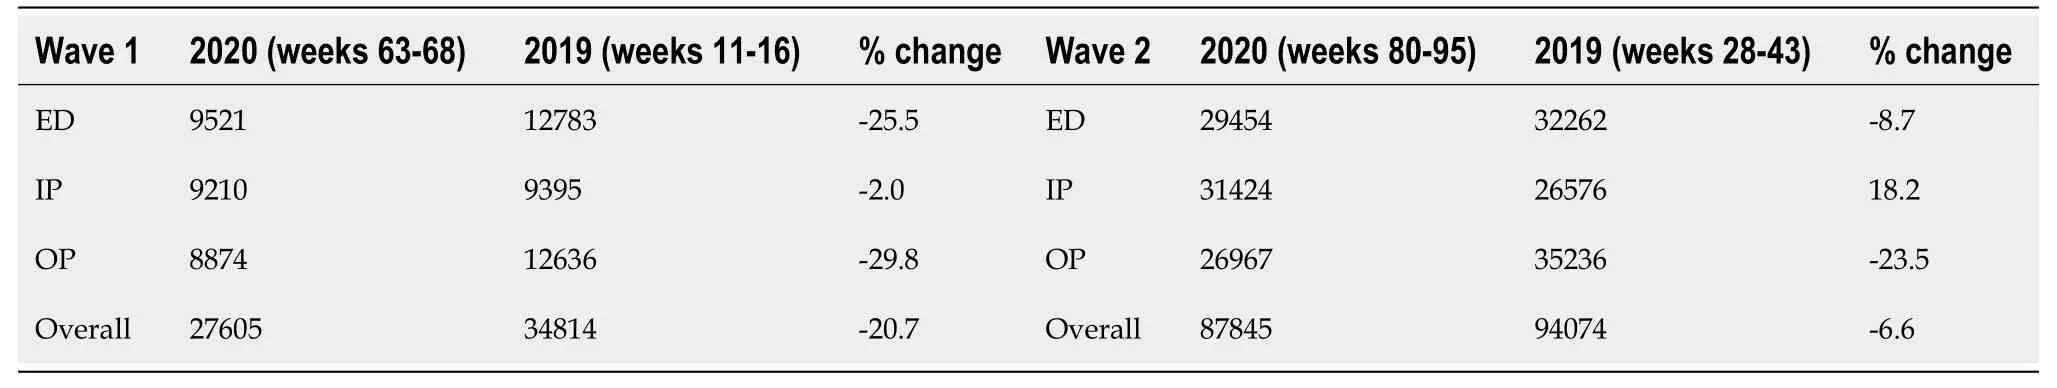
Total volume (all modalities): During the pandemic’s first wave in Victoria, total adult imaging volume across all modalities declined by 20.7% between March 11 and April 21, 2020 (weeks 63 to 68) compared to the same time in 2019 (March 13 and April 23, 2019, weeks 11 to 16). During the pandemic’s second wave, adult imaging volume across all modalities declined by 6.6% between July 8, and October 27, 2020 (weeks 80 to 95) compared to the same time in 2019 (July 10, and October 29, 2019, weeks 28 to 43).
Volume by patient class
Table 2 shows the summed weekly imaging volumes for the defined periods and the percentage of adult image volume change across all included modalities by patient class for weeks 11 to 16 (March 13 and April 23) and 28 to 43 (July 10 and October 29) in 2019 and weeks 63 to 68 (March 11 and April 21) and 80 to 95 (July 8 and 2October 27) in 2020.
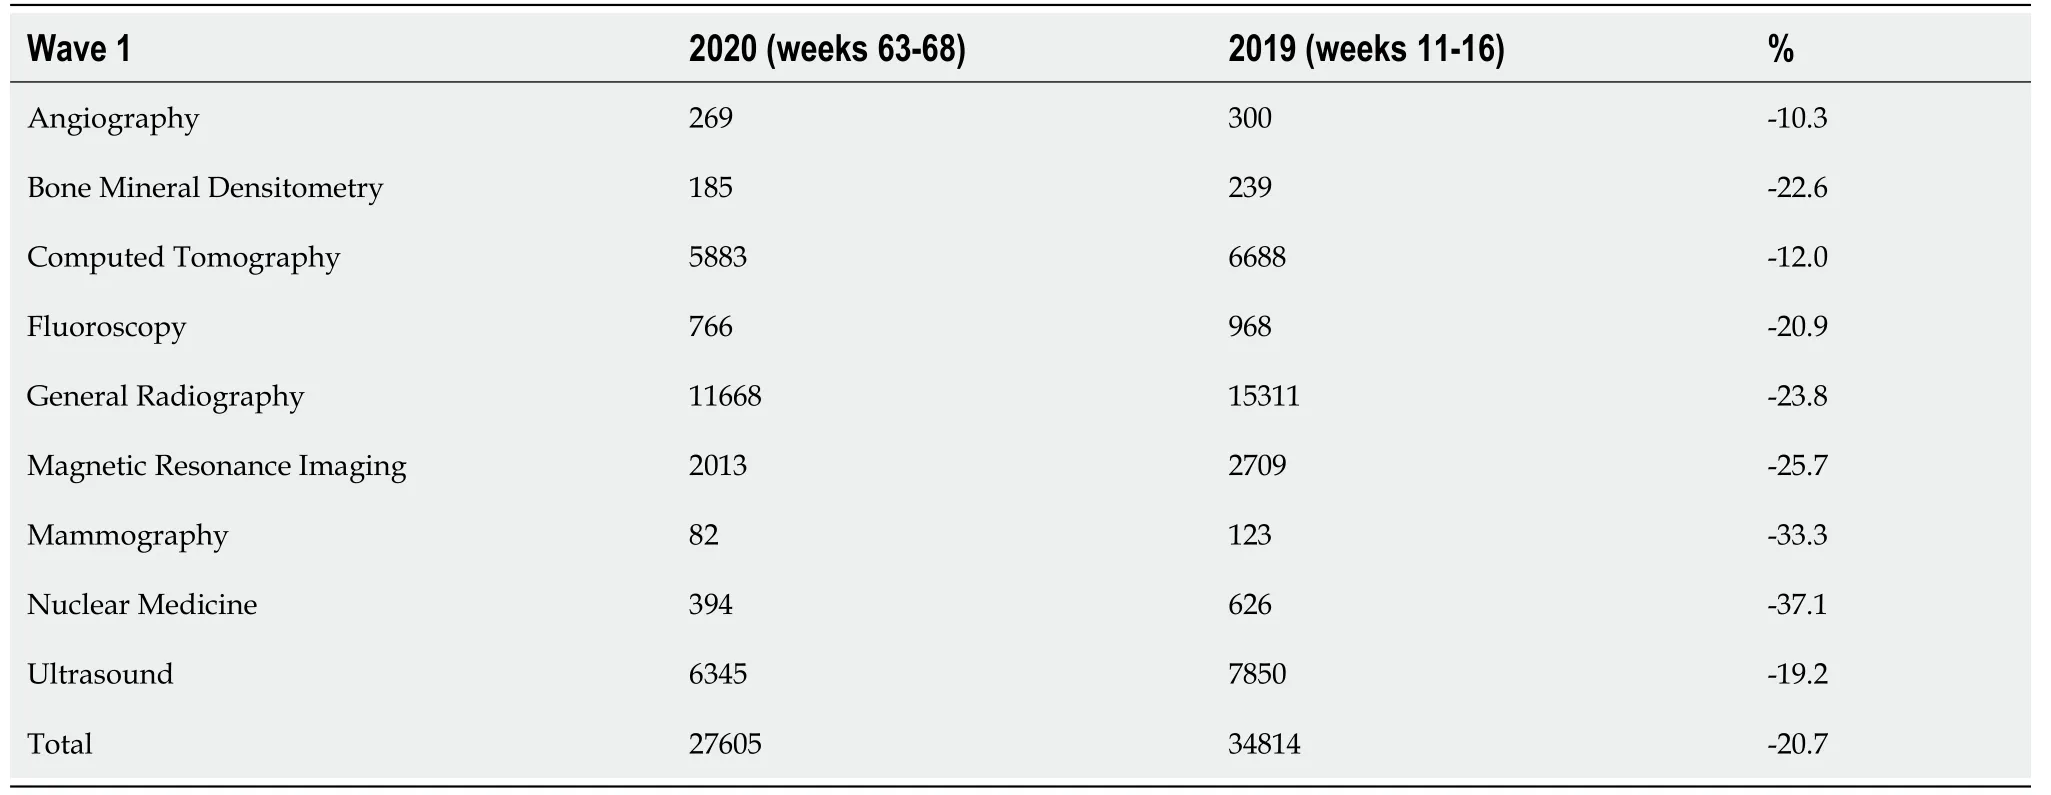
During the pandemic’s first wave between March 11 and April 21, 2020 (weeks 63 to 68), adult angiography, bone mineral densitometry, computed tomography, fluoroscopy, general radiography, magnetic resonance imaging, mammography, nuclear medicine and ultrasound imaging volumes declined between 10.3% and 37.1% when compared to the same time in 2019 (March 13 and April 23, 2019, weeks 11 to 16) shown in Table 3.
During the pandemic’s second wave between July 8 and October 27, 2020 (weeks 80 to 95), adult angiography, bone mineral densitometry, fluoroscopy, general radiography, magnetic resonance imaging, mammography, nuclear medicine and ultrasound services declined between 1.6% and 31.6%, while computed tomography increased by 1.7% when compared to the same time in 2019 (July 10 and October 29, 2019, weeks 28 to 43) shown in Table 4.
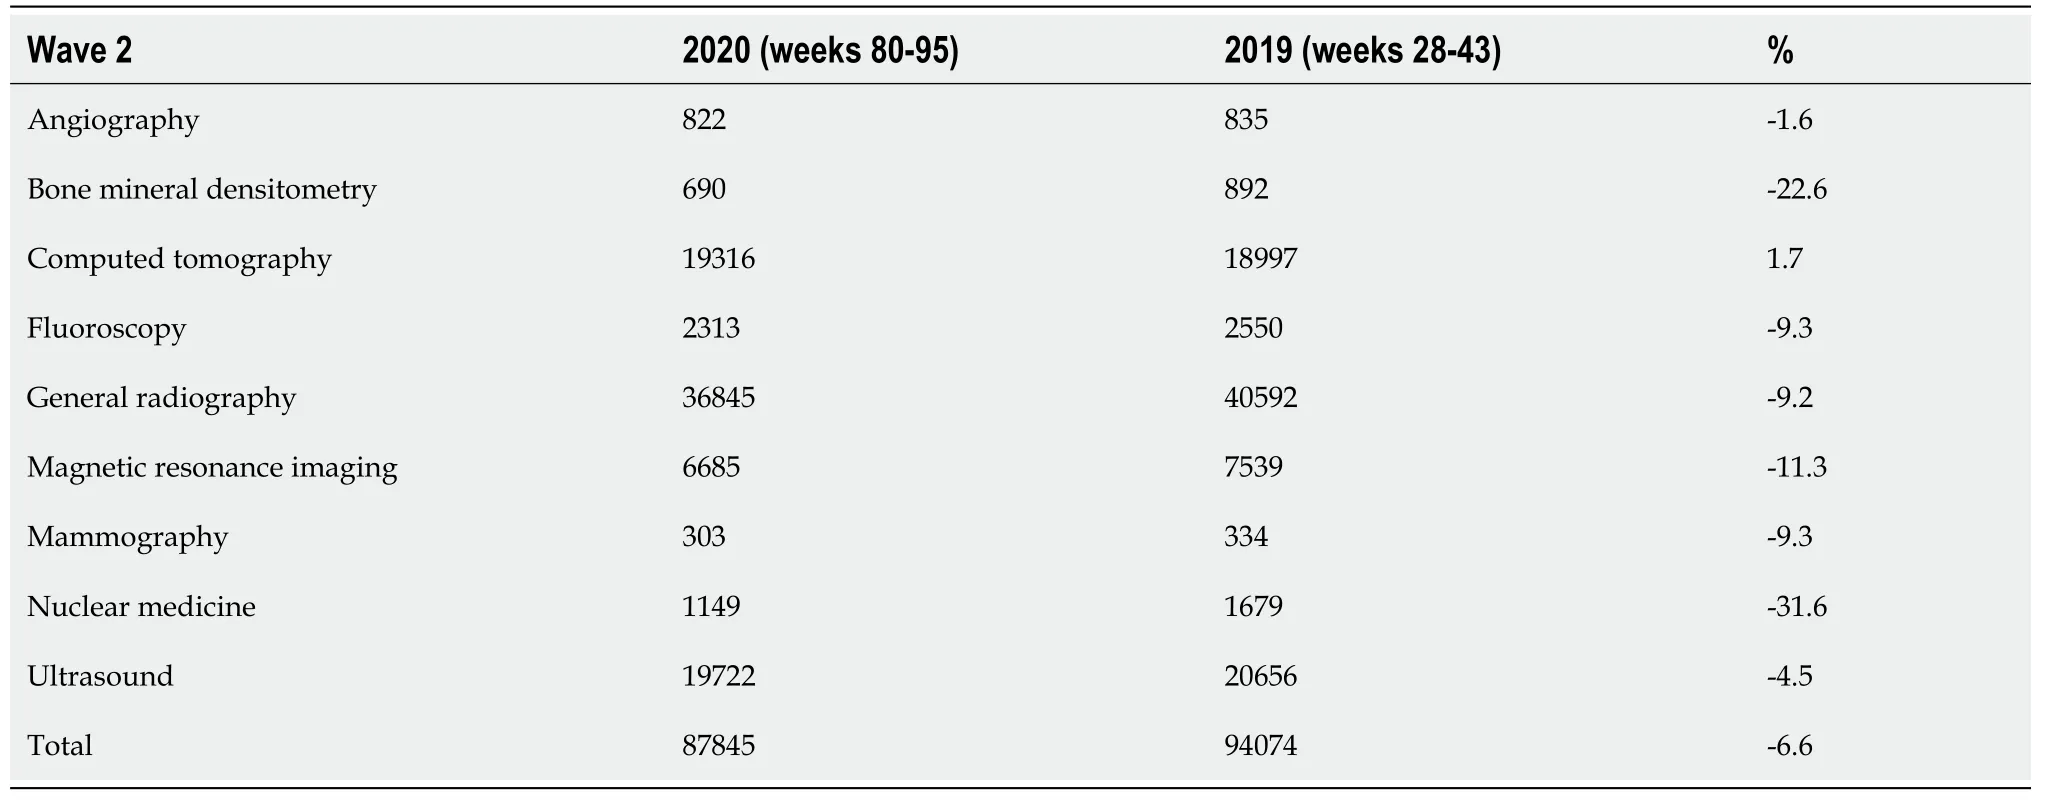
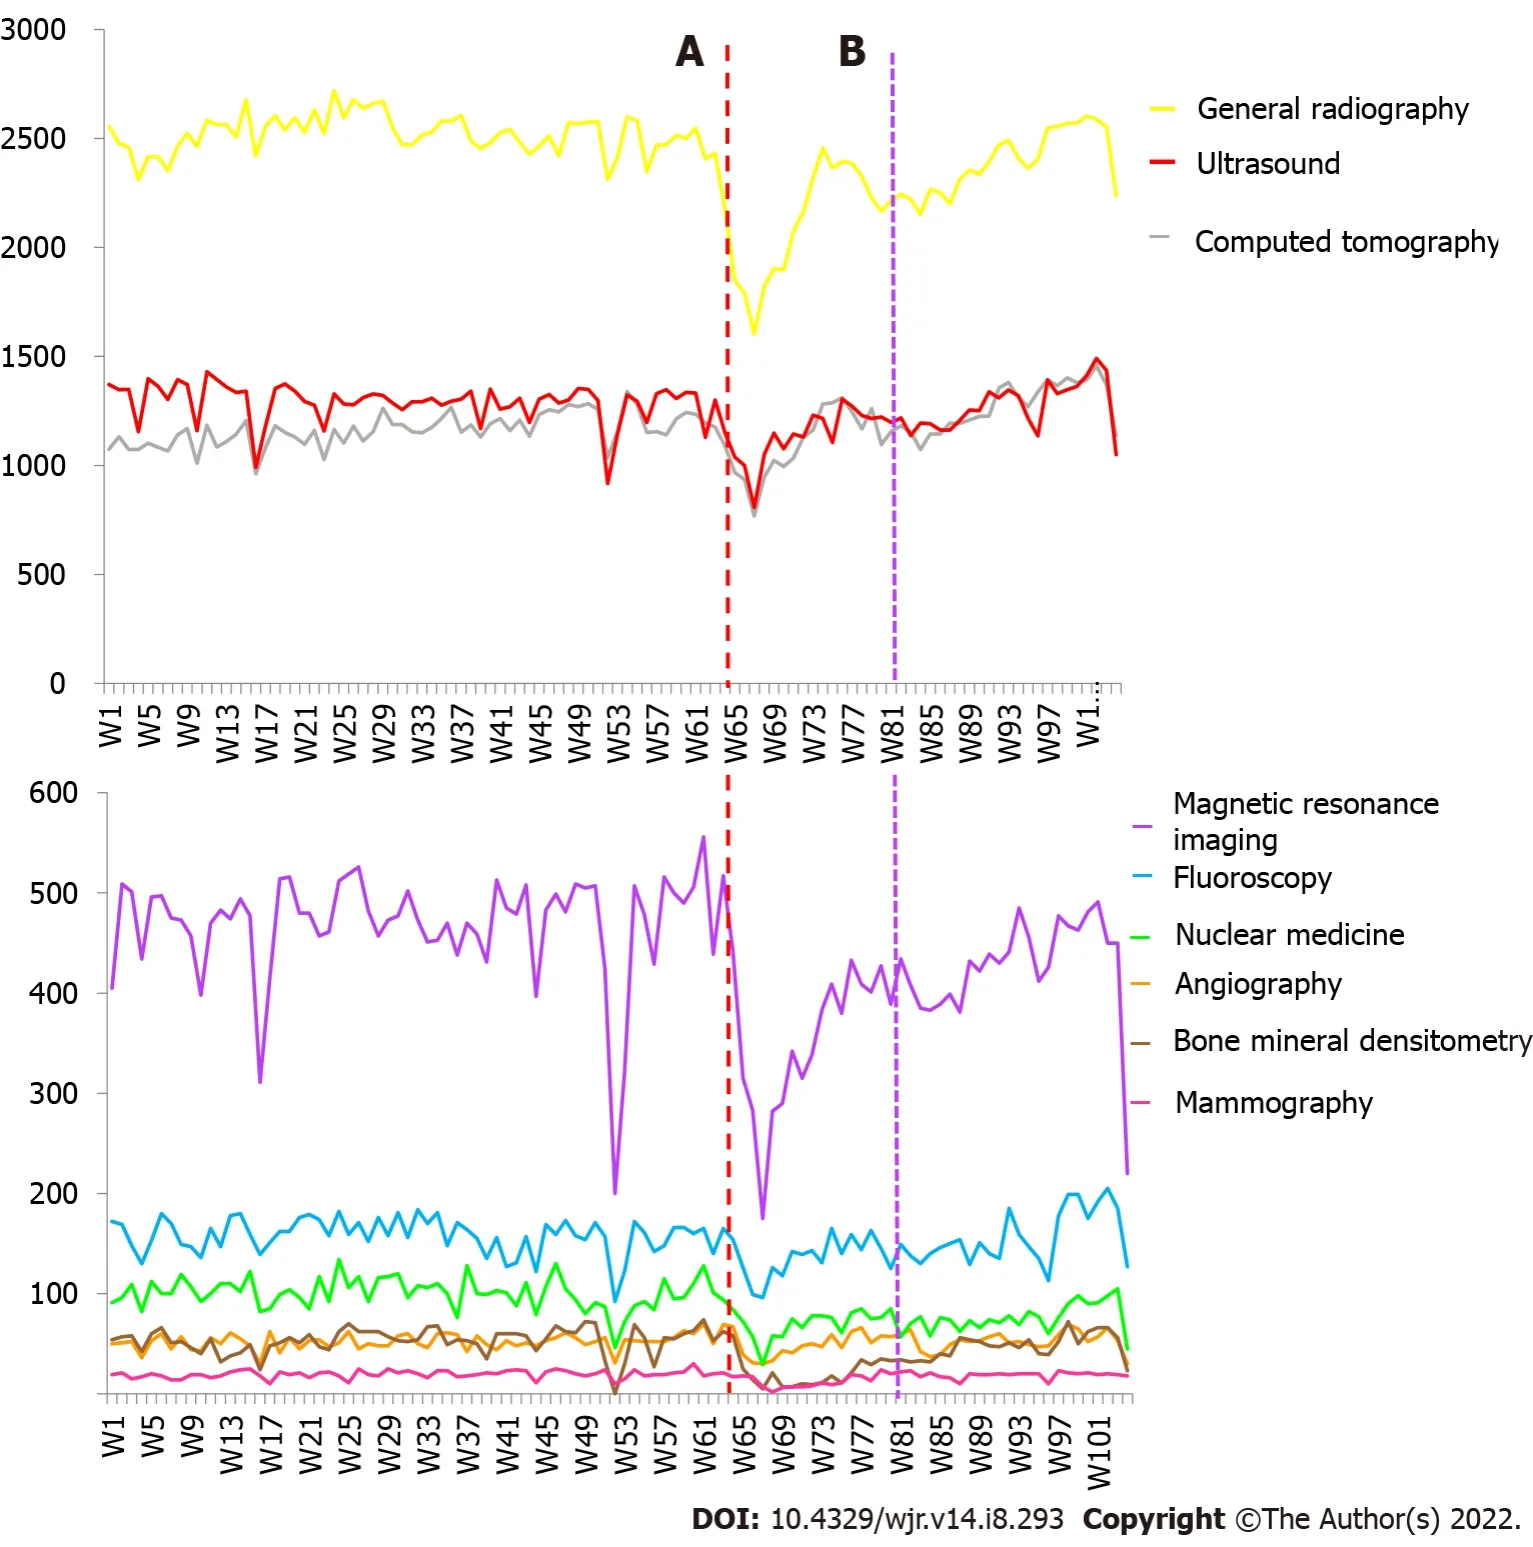
Figure 3 highlights the weekly adult modality imaging volumes.
That night, my girlfriend cried heavily in front of me. I asked her whether it was her father’s stupid deeds that made her feel humiliated8. But she said that she felt guilty for her dad and that though the rest of the whole world betrayed her, her old father would still back her up and help her get the justice she deserved, just as when she was young and the neighboring boy grabbed her ball, her father would get it back for her. However, this changed world was no longer the stage for her old father and his deeds became funnily obsolete9() . No one managed to see the real and ever-lasting love to his daughter behind his seemingly rude behaviors.
CT was one of the modalities least impacted by new policies and guidelines implemented during the pandemic. This is not surprising given the importance of CTPA for early contribution to patient diagnosis[5]. While early in the pandemic, CT was the modality of choice for assisting in COVID-19 diagnosis[5], this changed due to the high radiation doses and availability of PCR testing[5]. While there was a reduction in CT demand during the peak waves of the pandemic, we observed an increase in CT utilisation during the second wave of the pandemic, consistent with other reports[27]. During the pandemic, outpatient CT studies for malignancy staging were delayed based on criteria set by senior management due to the risk of cross-contamination between inpatients and outpatients. Access to an independent CT scanner within the hospital at an onsite research facility improved workflow for this patient cohort. During the pandemic, elderly Victorians in aged care died from the virus as transmission rates among staff members in certain aged care facilities increased. The government intervened by placing aged care residents into Victorian hospitals as a safety measure for our most vulnerable. The increase in inpatient CT scans during this period can likely be attributed to this mandate.
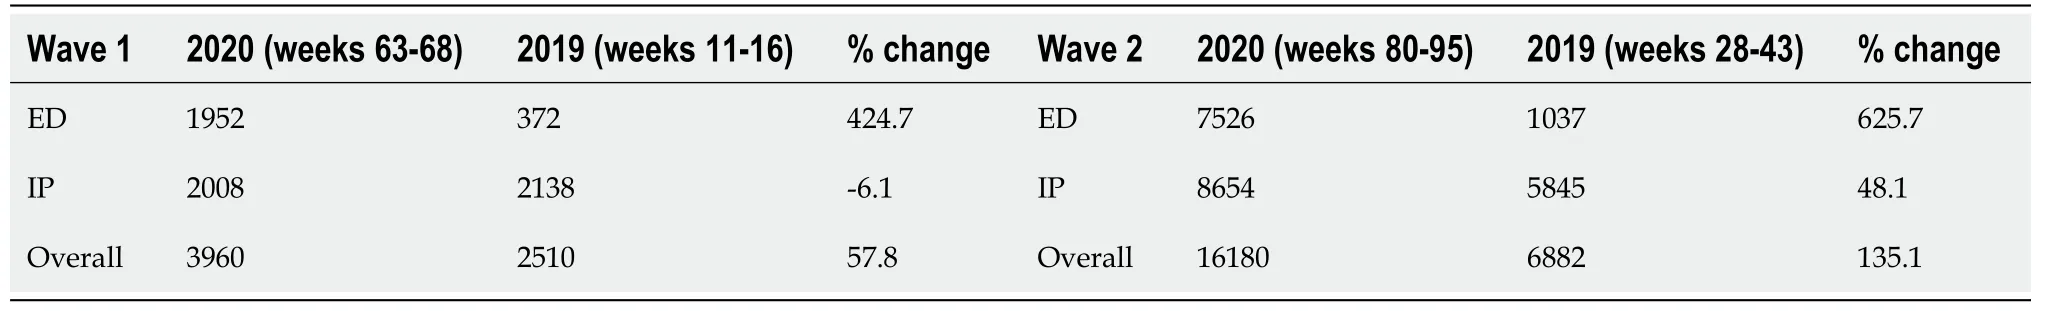
During the pandemic’s first wave in Victoria, total adult mobile imaging volume increased by 57.8% between March 11 and April 21, 2020 (weeks 63 to 68) compared to the same time in 2019 (March 13 and April 23, 2019, weeks 11 to 16). During the pandemic’s second wave, adult mobile imaging volume increased by 135.1% between July 8 and October 27, 2020 (weeks 80 to 95) compared to the same time in 2019 (July 10 and October 29, 2019, weeks 28 to 43). Table 6 highlights the mobile imaging changes across inpatient and emergency patient classes during the first and second waves.
‘Have you sent for Donkey Skin, who made me the cake ?’ asked he, and the courtiers began to laugh, and replied that they would not have dared to introduce so dirty a creature into the palace.
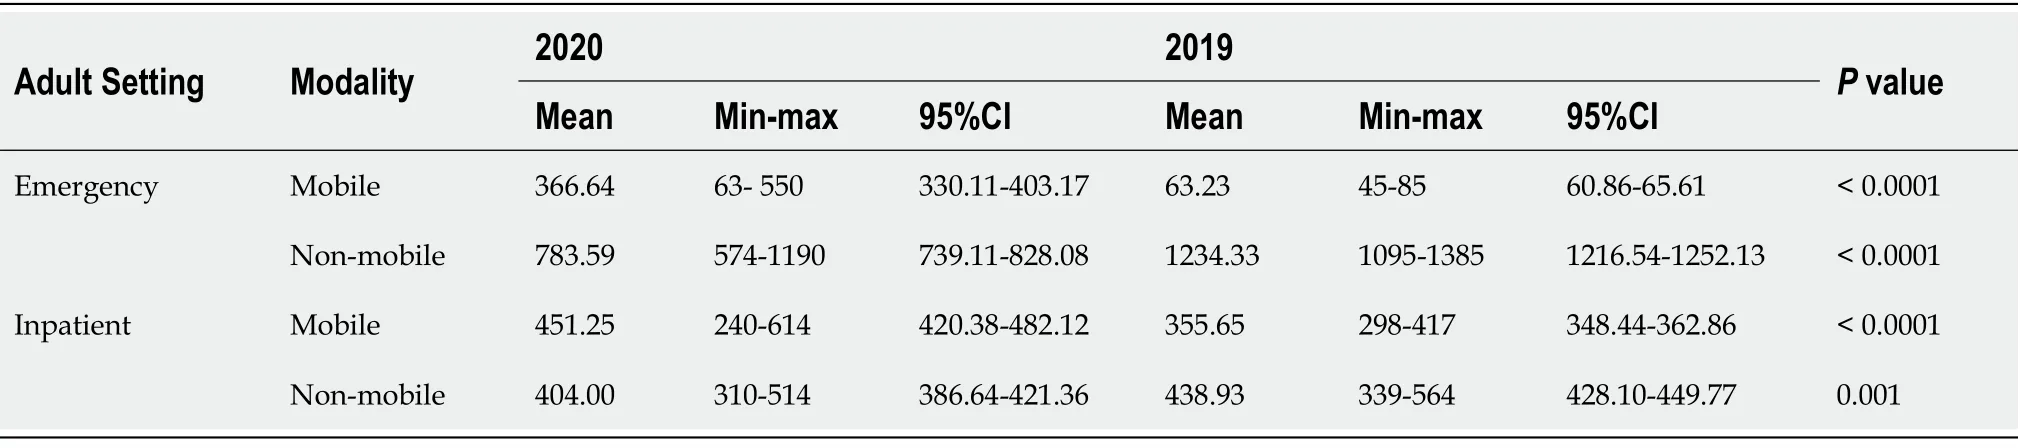
Comparison of the adult mean weekly 2019 (pre-COVID-19, January 2, 2019 to February 29, 2020, weeks 1 to 61) with 2020 (March 1 to December 31, 2020, weeks 61 to 104) mobile and non-mobile X-ray imaging volumes, categorised by inpatient and emergency services (Table 7) shows statistically significant changes across all mobile and non-mobile imaging (
0.001 to < 0.0001). A strong correlation was observed between mobile and non-mobile imaging in the emergency setting (Spearman’s correlation coefficient = -0.743,
0.000). No correlation was observed in the inpatient setting (Spearman’s correlation coefficient = -0.059,
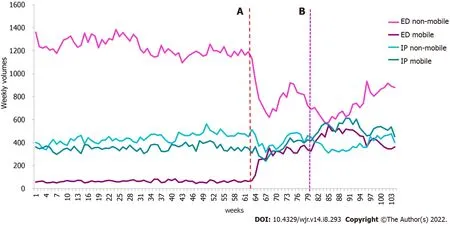
0.554). Figure 4 shows the weekly adult X-ray mobile and non-mobile imaging volumes.
Paediatrics
Total paediatric imaging volume across all modalities declined by 28.6% between March 11 and April 21, 2020 (weeks 63 to 68) compared to the same time in 2019 (March 13 and April 23, 2019, weeks 11 to 16). During the pandemic’s second wave, paediatric imaging volume across all modalities declined by 6.6% between July 8 and October 27, 2020 (weeks 80 to 95) compared to the same time in 2019 (July 10 and October 29, 2019, weeks 28 to 43).
Messengers were forthwith despatched to the garden house, and after awhile they returned bringing a negro whom they had discovered in a secret chamber181 underneath the throne of Mihr-afruz, dressed in a dress of honour, and surrounded with luxury
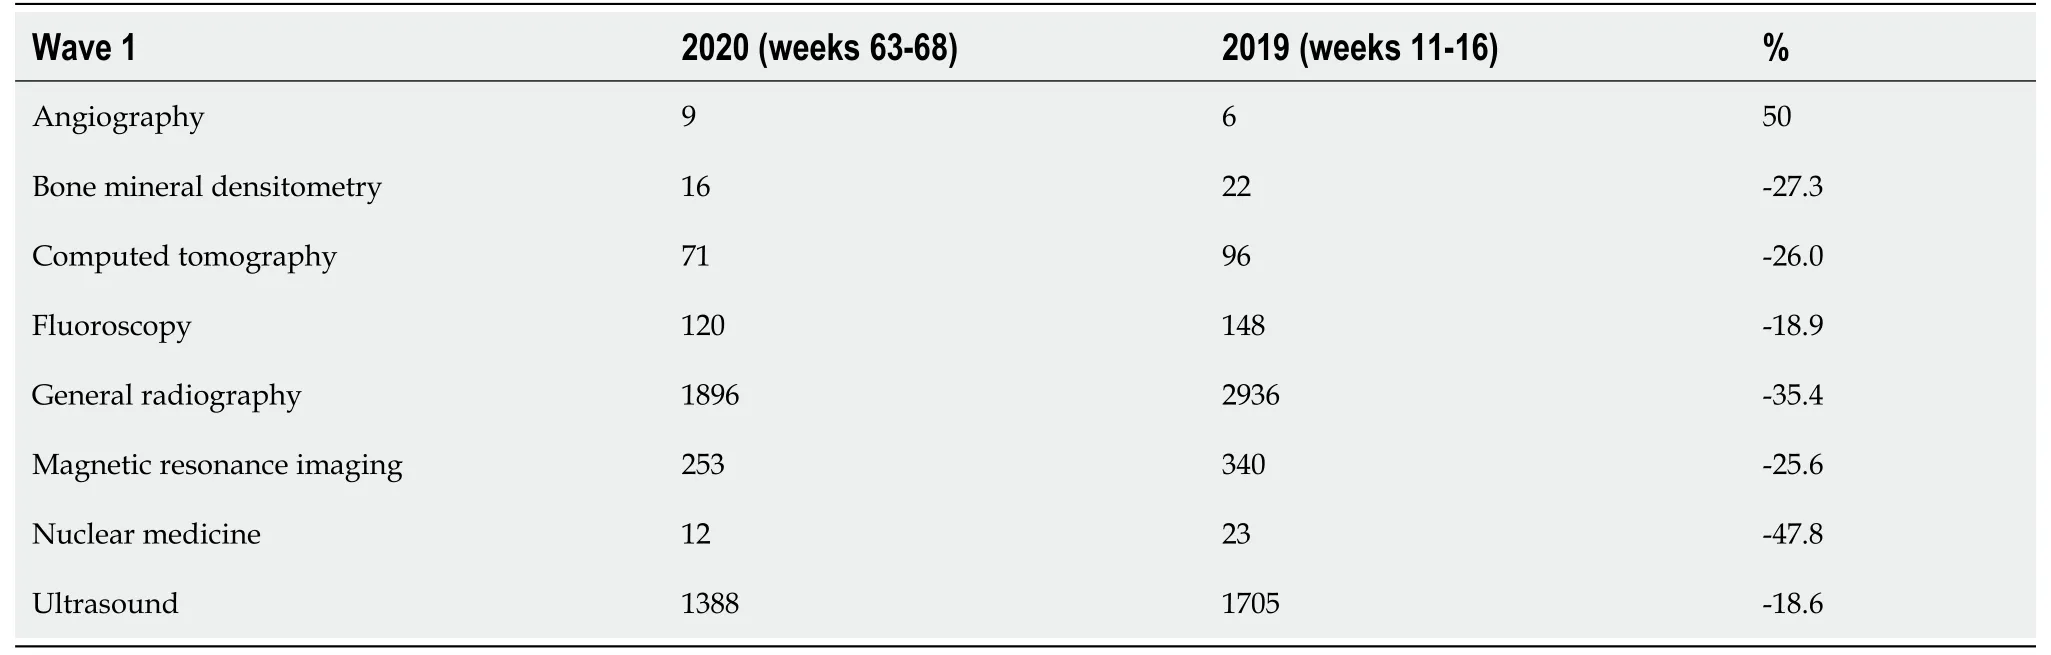
During the pandemic’s first wave between March 11 and April 21, 2020 (weeks 63 to 68), paediatric imaging modality services declined by between 18.6% and 47.8% and 18.6%, while angiography increased by 50% when compared to the same time in 2019 (March 13 and 23
April 2019, weeks 11 to 16 shown in Table 9.
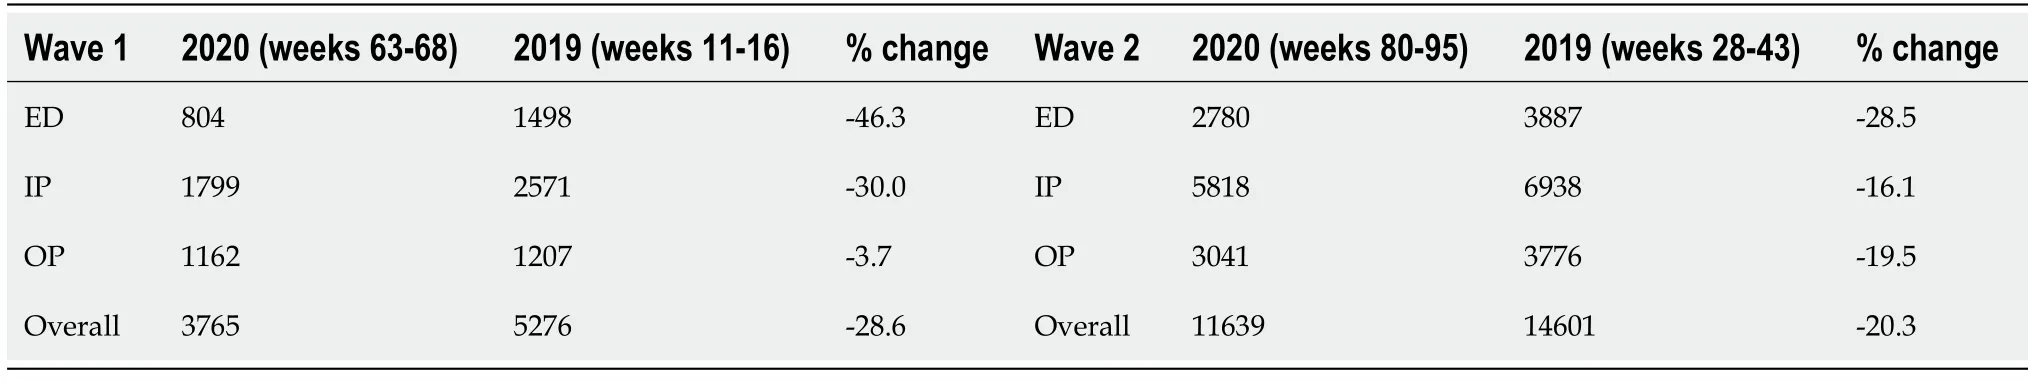
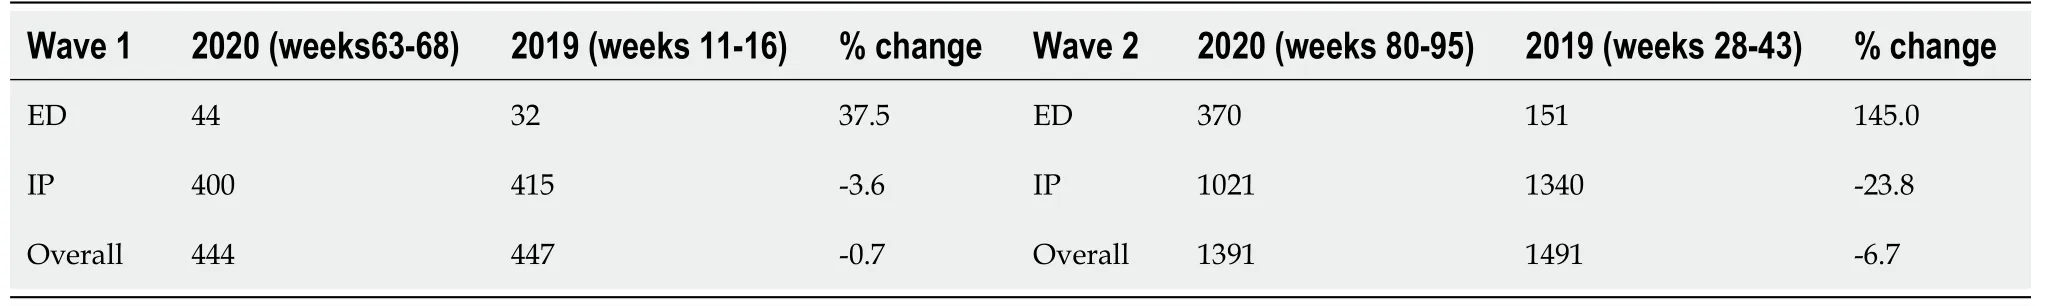
During the pandemic’s first wave between March 11 and April 21, 2020 (weeks 63-68), paediatric IP, OP and ED services declined by between 3.7% and 46.3% when compared to the same time in 2019 (March 13 and April 23 2019, weeks 11 to 16).
During the pandemic’s second wave between July 8 and October 27, 2020 (weeks 80 to 95), paediatric IP, OP and ED services declined by between 16.1% and 28.5% when compared to the same time in 2019 (July 10 and October 29, 2019, weeks 28 to 43).
Table 8 shows the percentage of paediatric image volume change across all included modalities by patient class for weeks 11 to 16 and 28 to 43 in 2019 and weeks 63 to 68 and 80 to 95 in 2020.
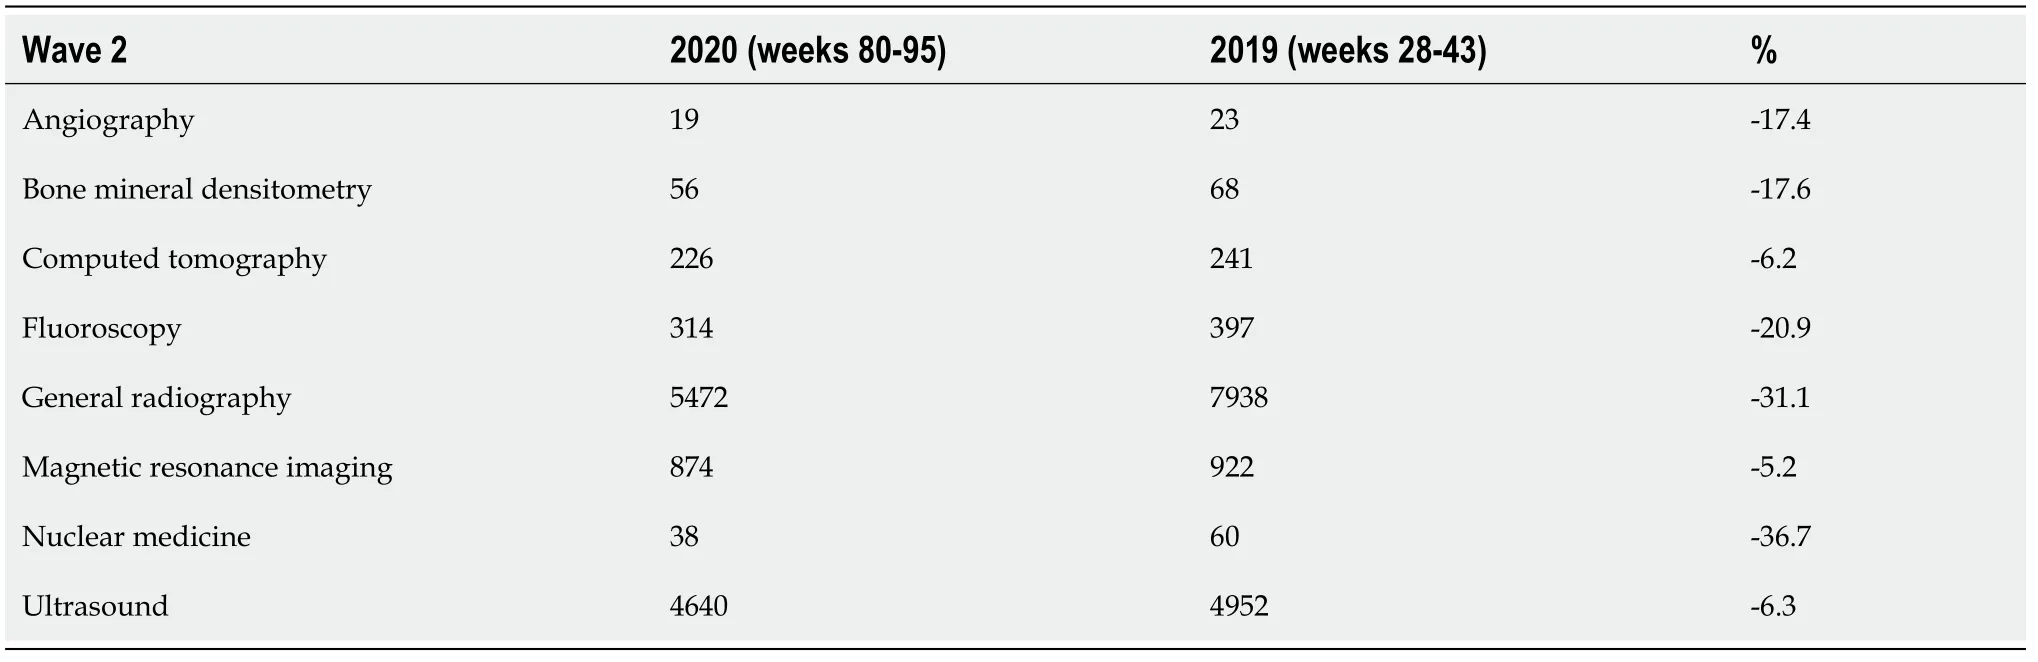
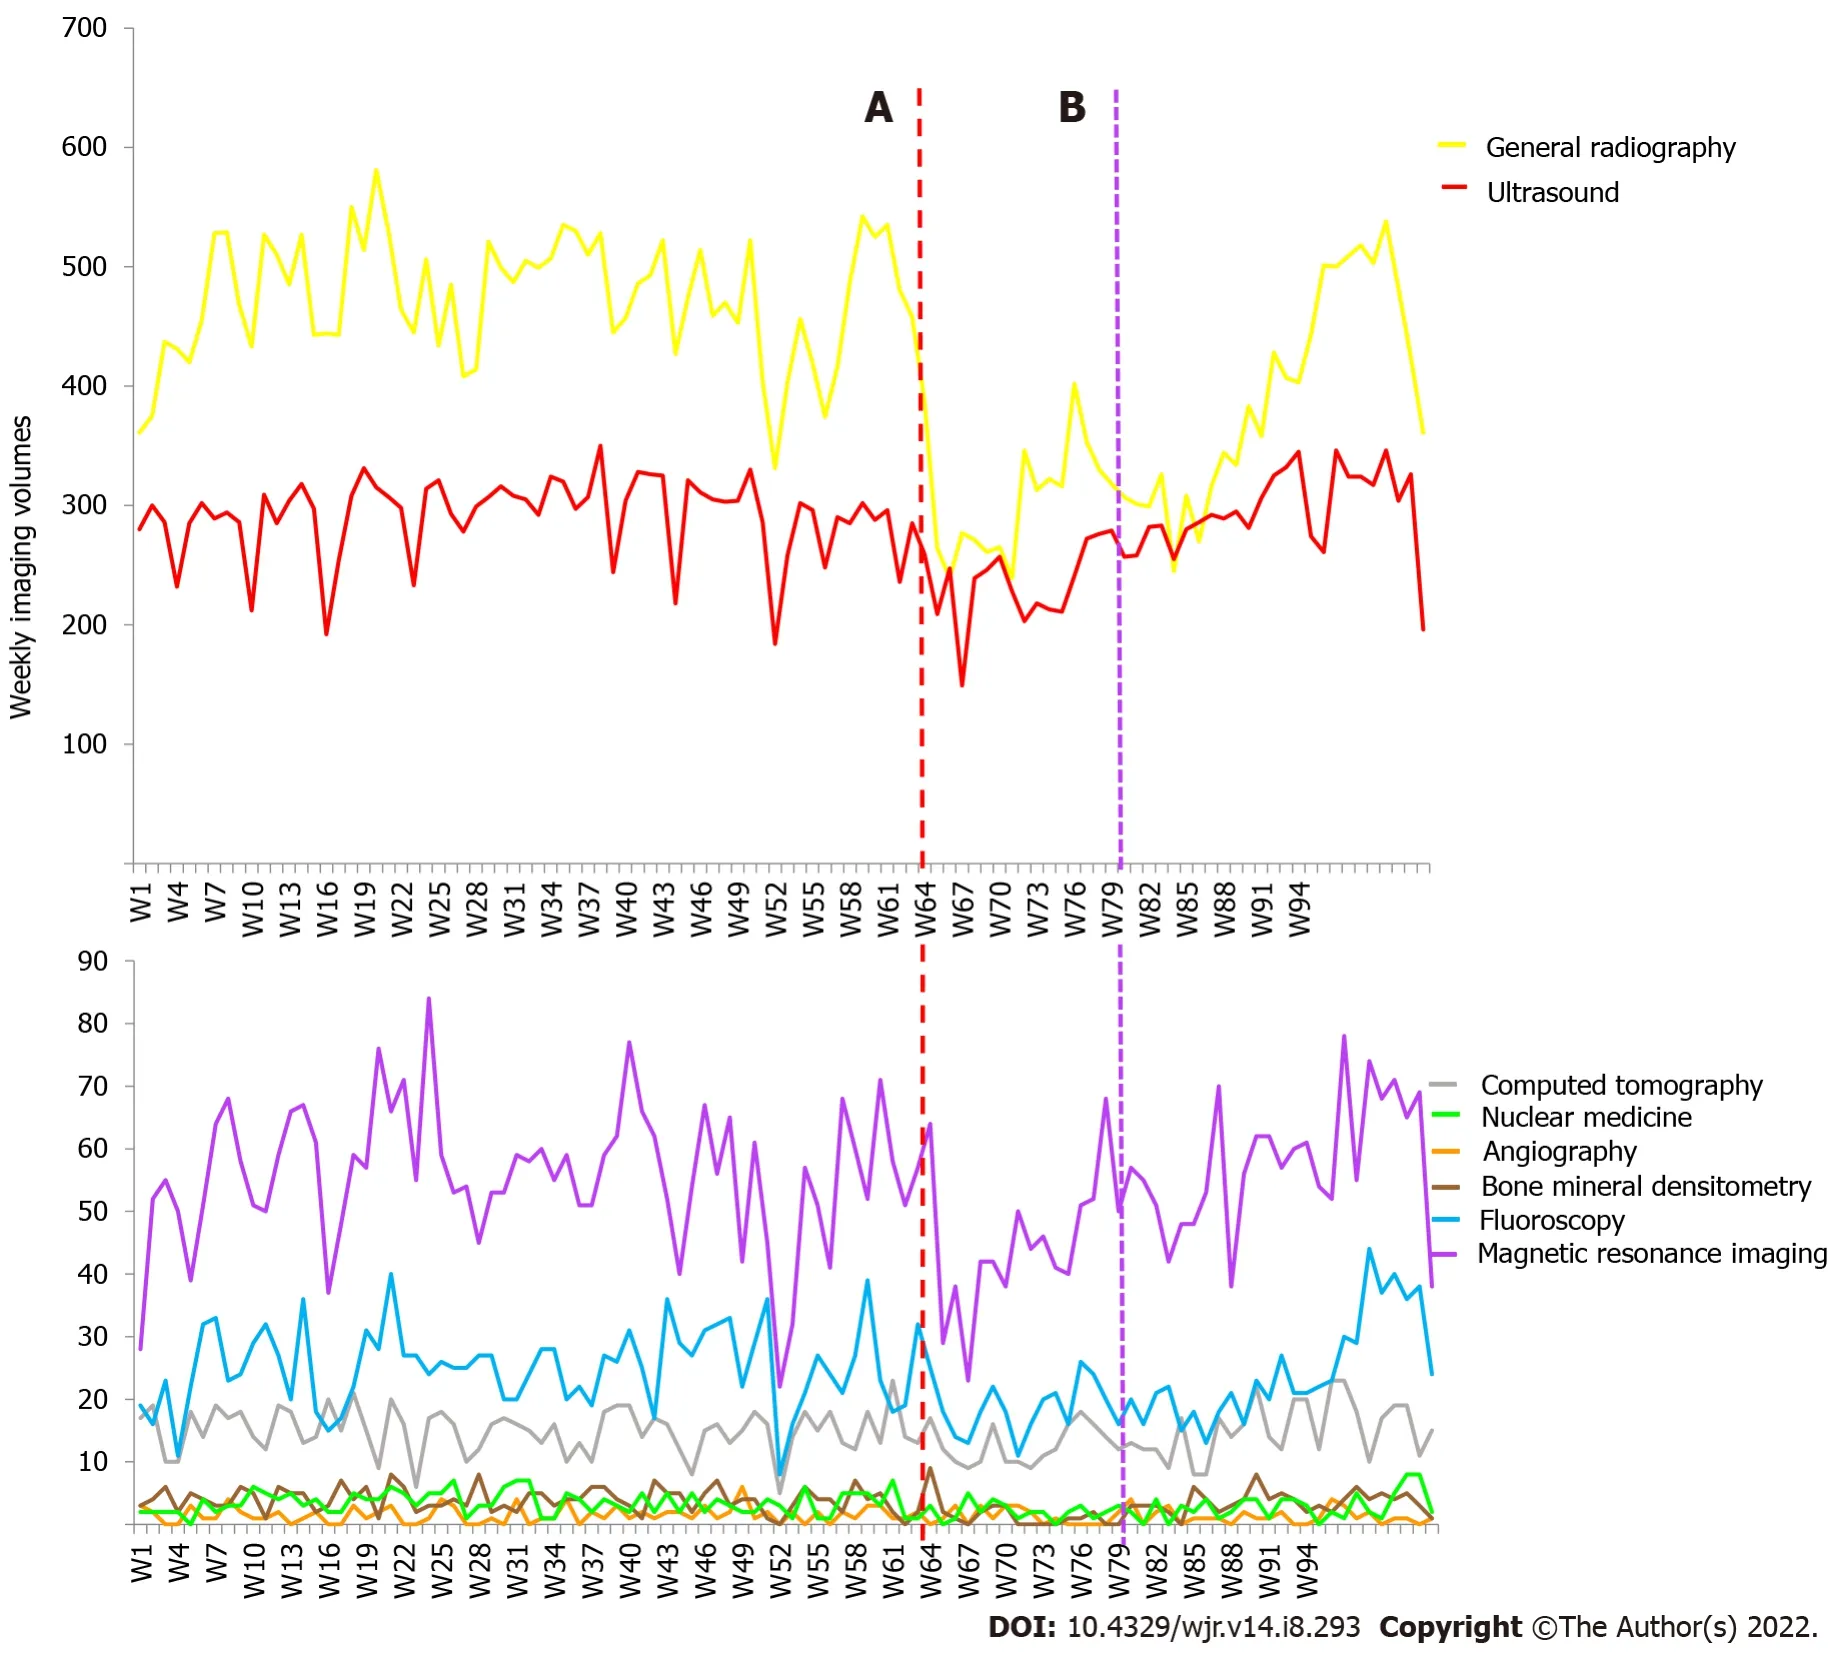
During the pandemic’s second wave between July 8 and October 27, 2020 (weeks 80 to 95), paediatric imaging modality services declined by between 5.2% and 36.7% when compared to the same time in 2019 (July 10 and October 29, 2019, weeks 28 to 43), shown in Table 10. Figure 5 highlights the weekly paediatric modality imaging volumes.
But she remembered the words of the giant, and knew not what had befallen her brothers, and kept her face steadily towards the mountain top, which grew nearer and nearer every moment
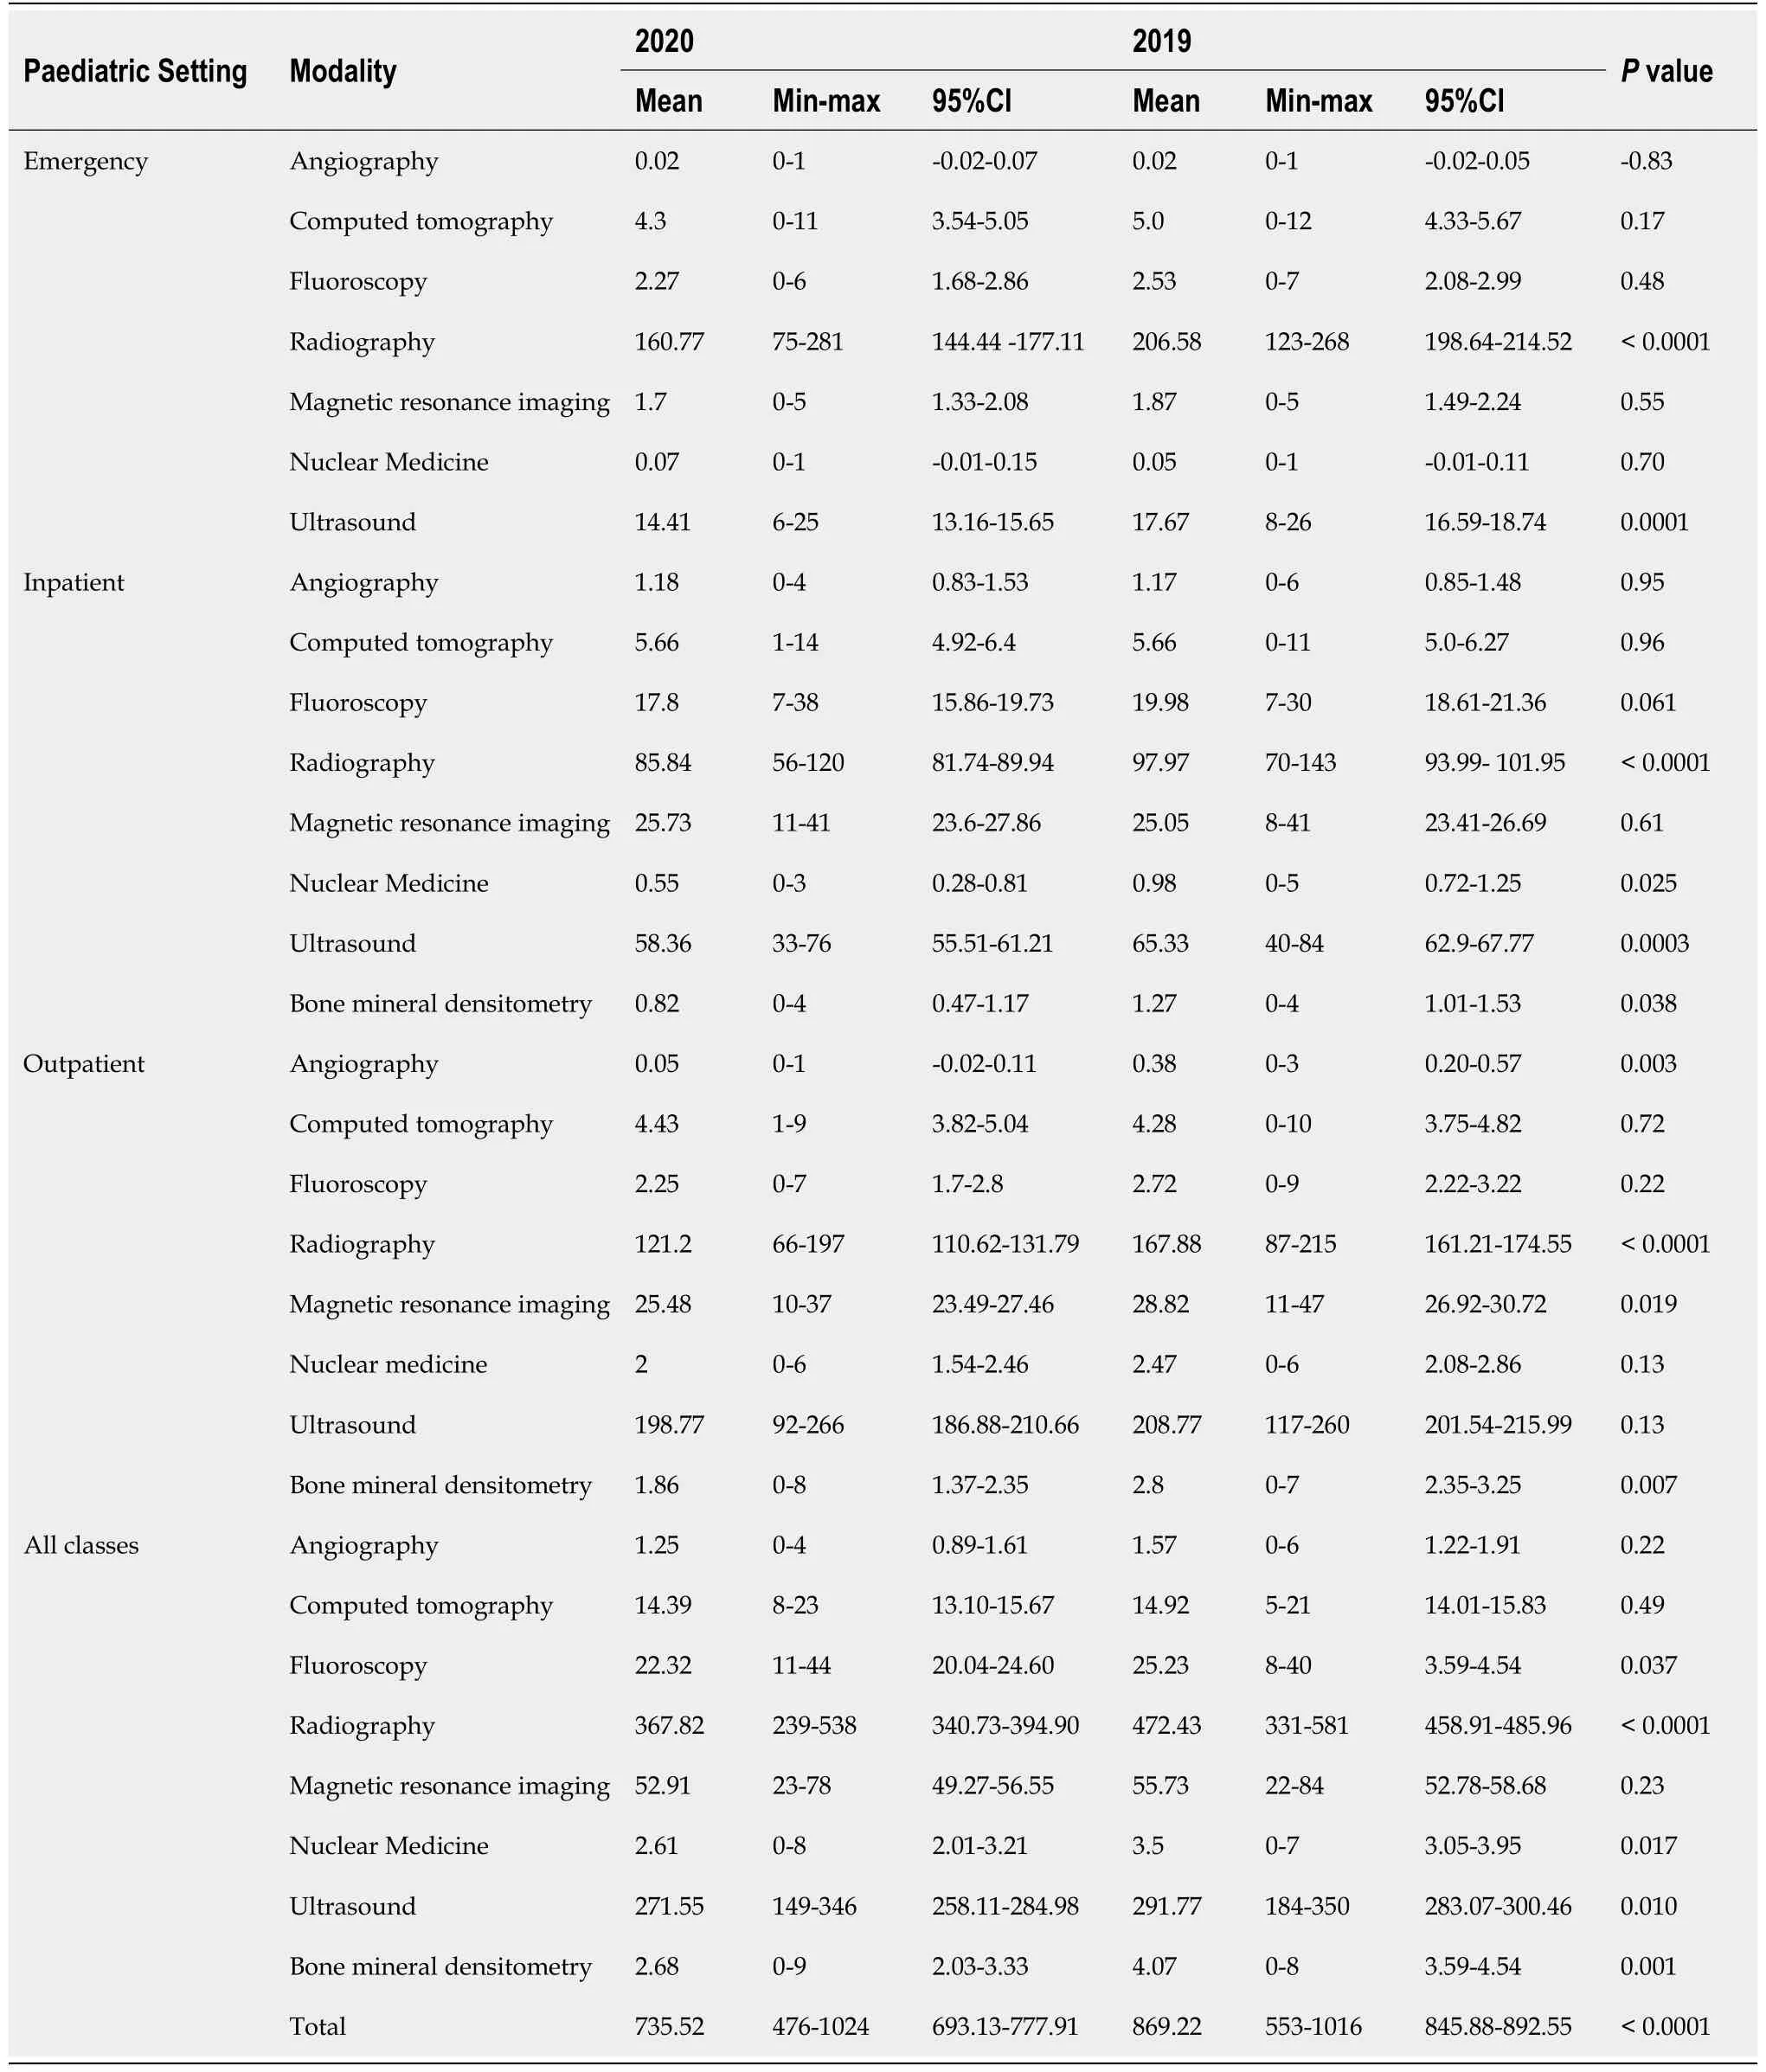
Comparison of the paediatric mean weekly 2019 (pre-COVID-19, Jan 2
2019 to 29
Feb 2020, weeks 1 to 61) with 2020 (March 1
to Dec 31
2020 weeks 61 to 104) imaging volumes by modality, categorised by inpatient, outpatient and emergency services (Table 11) shows statistically significant changes in two emergency imaging modalities (
0.0001 to
0.0001), two inpatient imaging modalities (
0.0003 to
0.0001), and four outpatient imaging modalities (
0.019 to
0.0001). Overall changes across all patient classes were observed in five imaging modalities (
0.037 to
0.0001).
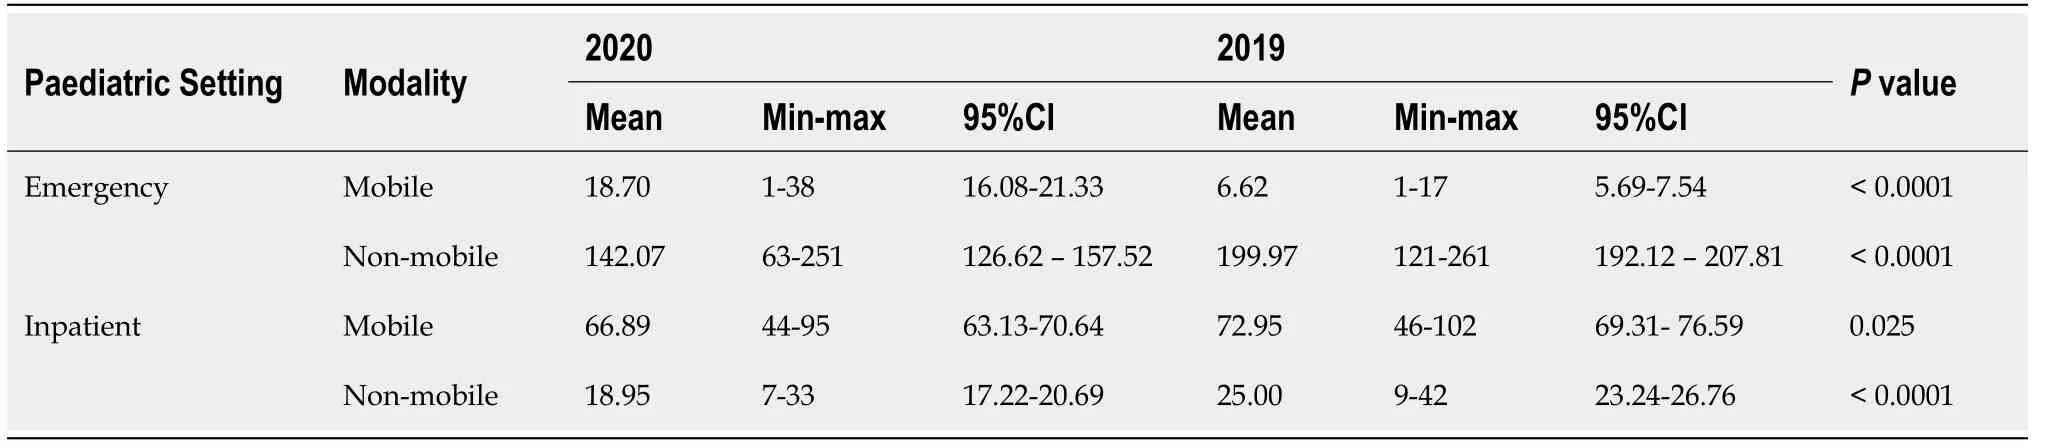
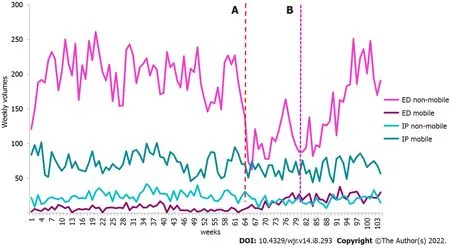
During the pandemic’s first wave in Victoria, total paediatric mobile imaging volume decreased by 0.7% between March 11 and April 21, 2020 (weeks 63 to 68) compared to the same time in 2019 (March 13 and April 23 2019, weeks 11 to 16). During the pandemic’s second wave, paediatric mobile imaging volume decreased by 6.7% between July 8 and October 27, 2020 (weeks 80 to 95) compared to the same time in 2019 (July 10 and October 29, 2019, weeks 28 to 43). Table 12 highlights the mobile imaging changes across inpatient and emergency patient classes during the first and second waves.
Similarly, during the first wave of the pandemic, there was a reduction in paediatric imaging volumes of between 19% and 48% across all modalities except for angiography reporting a 50% increase in the imaging volume. There was a 4%-46% reduction across all paediatric patient classes. Nuclear Medicine was the modality most impacted, with ultrasound being the least impacted. While paediatric emergency patient presentations decreased by 25% in one Sydney health service, we observed a larger decrease in paediatric imaging service utilisation in the emergency department and inpatient settings[18].
Comparison of the paediatric mean weekly 2019 (pre-COVID-19, Jan 2
2019 to 29
Feb 2020, weeks 1 to 61) with 2020 (March 1
to Dec 31
2020 weeks 61 to 104) mobile and non-mobile X-ray imaging volumes, categorised by inpatient and emergency services (Table 13) shows statistically significant changes across all mobile and non-mobile imaging (
0.025 to < 0.0001). The correlation between mobile and non-mobile imaging was -0.29 (
0.003) in the emergency setting, while no correlation was observed in the inpatient setting (Spearman correlation coefficient 0.044,
0.656). Figure 6 highlights the weekly paediatric X-ray mobile and non-mobile imaging volumes.
DISCUSSION
We found a reduction in the imaging volume between 2% and 30% across all adult patient classes and 10% and 37% in adult imaging volumes by modality during the first wave of the pandemic. Nuclear Medicine was the modality most impacted, and angiography the least impacted. While periods analysed may differ slightly, the findings for adult imaging volumes were less than those reported in Germany (41%, all modalities)[14], New York (14% to 53%)[15], California, Florida, Michigan, Massachusetts and New York (40% to 70%)[16], and Ohio (53%)[17]. During the second wave of the pandemic, all adult radiology modalities reported a reduction of between 2% and 32% in imaging volumes and between 9% and 24% in imaging volumes across all patient classes. Adult computed tomography imaging volumes experienced a 2% increase. Nuclear medicine was the modality most impacted. This is less than the data obtained from Medicare reported by Sreedharan
[12], who found that general radiography and ultrasound were most impacted, while computed tomography and nuclear medicine services were less affected. It was unclear whether paediatric data were included in their analysis[12].
THERE was once a Prince who wished to marry a Princess; but then she must be a real Princess.1 He travelled all over the world in hopes of finding such a lady; but there was always something wrong. Princesses he found in plenty; but whether they were real Princesses it was impossible for him to decide, for now one thing, now another, seemed to him not quite right about the ladies.2 At last he returned to his palace quite cast down, because he wished so much to have a real Princess for his wife.
Collected data provides an evidence-based insight into changing imaging volume related to COVID-19. This information will allow the network to predict the dynamic demands in imaging more accurately and promptly adapt its policies. We found that adult CT, angiography and ultrasound recovery following the first and second waves of the pandemic recovered faster than nuclear medicine, BMD and MRI. Paediatric MRI and ultrasound recovered faster than nuclear medicine and general radiography following the first and second waves of the pandemic. Modalities were less impacted during the second wave (July-September 2020) than during the first wave (April 2020), except for angiography outpatients. At our health network, nuclear medicine was the imaging modality most impacted by COVID-19 in adult and paediatric settings. There may have been other factors, however, influencing these results. Adult CT imaging increased during the second wave, while paediatric ultrasound was the least affected. Radiology departments can minimise the impact of future COVID-19/public health outbreaks on imaging volumes by ensuring each modality is appropriately resourced to continue providing safe and patient-centred care.
During the second wave of the pandemic, there was a reduction of between 5% and 37% in paediatric modality cases and between 16% and 28% across paediatric patient classes. Nuclear Medicine was most impacted, while magnetic resonance imaging was least affected.
Decline in adult services (2% IP, 30% OP, 26% ED) were generally less to those reported by Naidich
[15] (ED (27%), OP (57%), IP (14%)). Furthermore, outpatient services were reported in South Africa (40% over six months)[5]. outpatient imaging (58%, 72%[14,17], inpatient imaging (41%, 43%)[14,17], and emergency department imaging (39%, 49%)[14,17] in Ohio and Berlin highlighted greater declines in demands than we observed. Australia utilised the experience of other nations in preparation for COVID-19. For example, Australia reduced elective medical procedures in line with other countries and implemented PPE measures, social distancing, and stay-at-home measures for non-essential workers[5]. We found that most of our outpatient imaging services were severely impacted (19%-50% loss in imaging volume) by new social distancing and appropriate cleaning measures. Inpatient services were also affected by the decline in elective surgeries, while emergency patient volume was reduced due to more people isolating at home.
From July to September 2020, Australia experienced the pandemic’s second wave. This was most prevalent in Victoria. The government implemented border closures, curfews, limiting movement to a five-kilometre radius, working from home for non-essential workers, business and education closures, wearing masks indoors and outdoors, and physical distancing measures to reduce COVID-19 cases[5]. During this phase of the pandemic, we observed a minor reduction in patient volume across all modalities at our institution compared to the first wave’s impact. This could be due to health services becoming better equipped, informed and organised to manage pandemic outbreaks[5]; earlier diagnosis of COVID-19
more rigorous PCR testing[5,20]; patients were better informed about the risks of contracting COVID-19, thus more likely to seek medical care. Earlier in the pandemic, it had been reported that patients were afraid to come to the hospital, potentially compromising their health[21,22].
Angiography
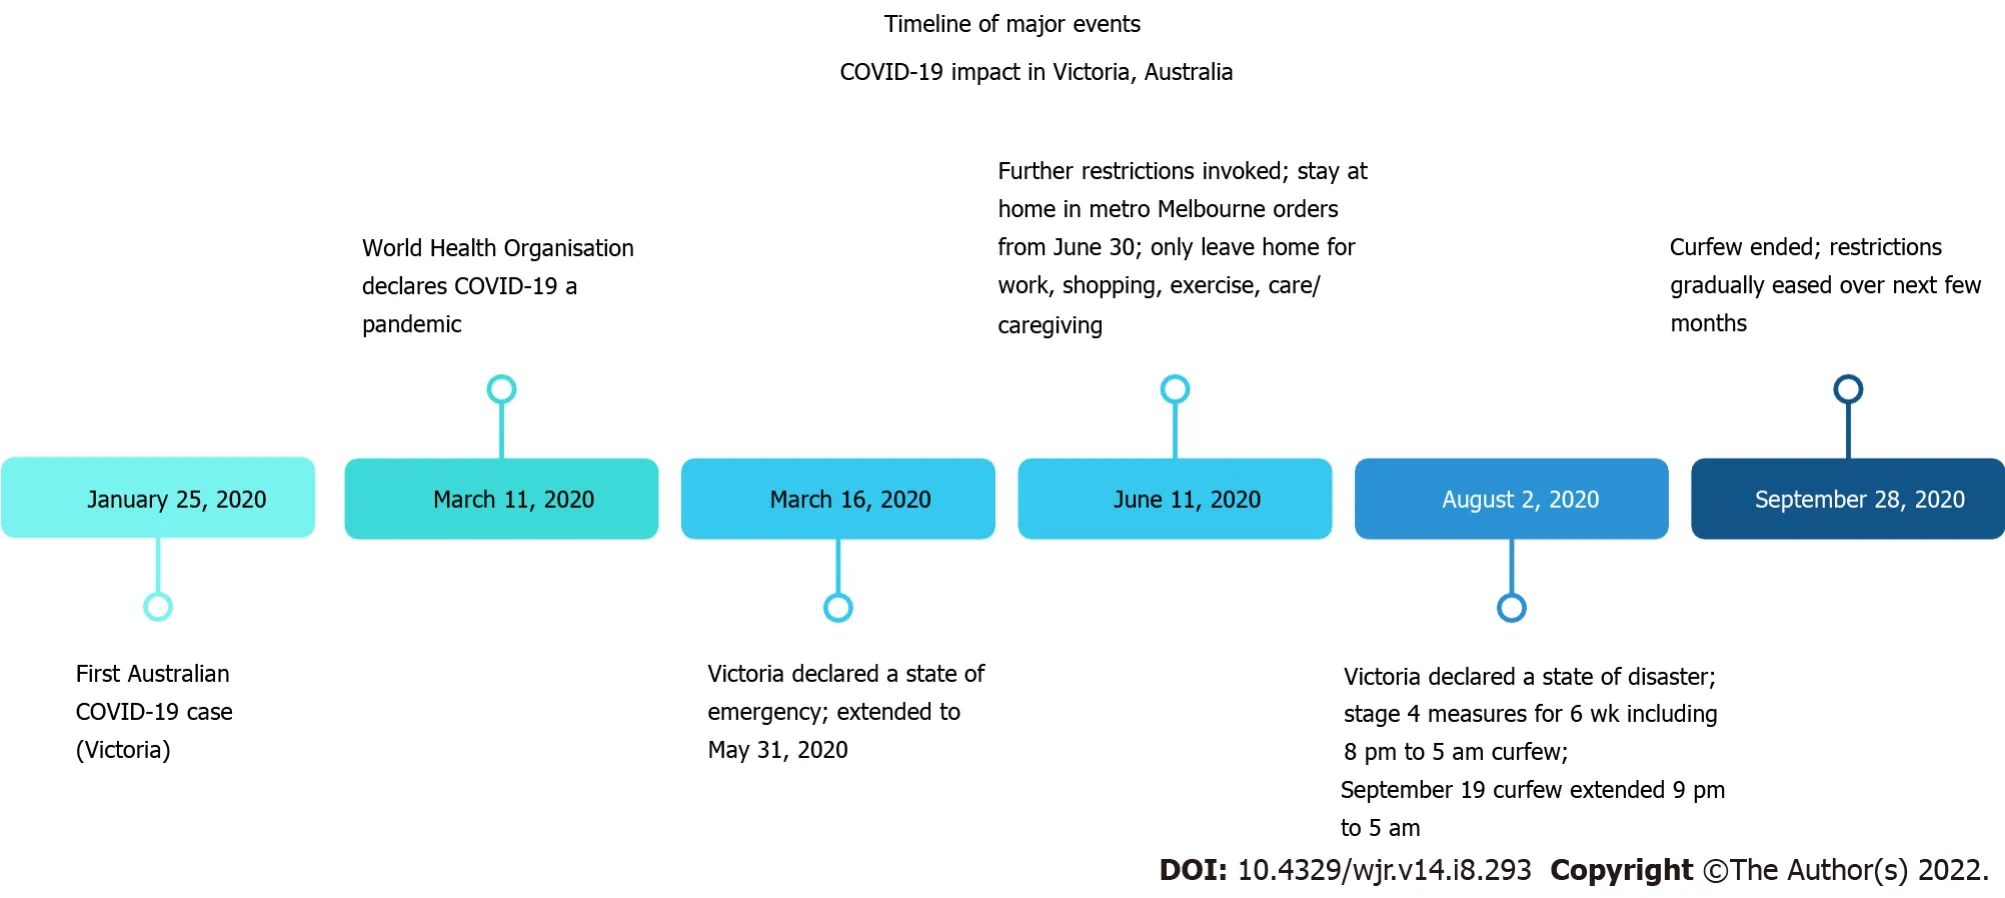
Microsoft Power Business Intelligence, linked to the radiology information system, was used to mine all completed examinations between January 1, 2019 and December 31, 2020 across three sites. Imaging modality was defined as the device or technology used in medical imaging (general X-ray, mammography, nuclear medicine, CT, magnetic resonance imaging (MRI), fluoroscopy, angiography, ultrasound, with mobile X-ray being a subset of X-ray). Fixed or non-mobile imaging was an X-ray system permanently secured in an X-ray room. Mobile imaging was defined as using a portable X-ray imaging system capable of moving to different locations. Patient classes were defined by location (inpatient (IP), outpatient (OP) or emergency department (ED)). Adult patients were ≥ 16 years, while paediatric patients were aged < 16 years. Examinations were filtered by modality and patient class. March 2020 and April 2020 [week 63 (March 11 to March 17) to week 68 (April 15 to April 21)] corresponded to Victoria’s first wave of the pandemic; July 2020 to October 2020 [week 80 (July 9 to July 14) to week 95 (October 21 to October 26)] corresponded to the second wave of the pandemic. Figure 2 provides the timeline of the first and second waves for considering the impact on departmental caseloads. The outcome measure was total weekly completed imaging case numbers from Wednesday to Tuesday commencing Wednesday January 2 to Tuesday January 8, 2019 (week 1) for direct day matched weekly comparisons between 2019 and 2020, allowing for any periodic variability observed. Weekly modality data were summed to reflect the first and second waves of the pandemic.
Bone mineral densitometry
United Kingdom bone mineral densitometry (BMD) wait lists increased during the pandemic, resulting in treatment delays for osteoporosis[23]. We observed the same relative reduction in imaging volumes during the first and second waves of the pandemic, likely determined by clinic closures[24], use of telehealth to minimise hospital visits[5], staff redeployment[25], or delaying medical treatment[26].
CT
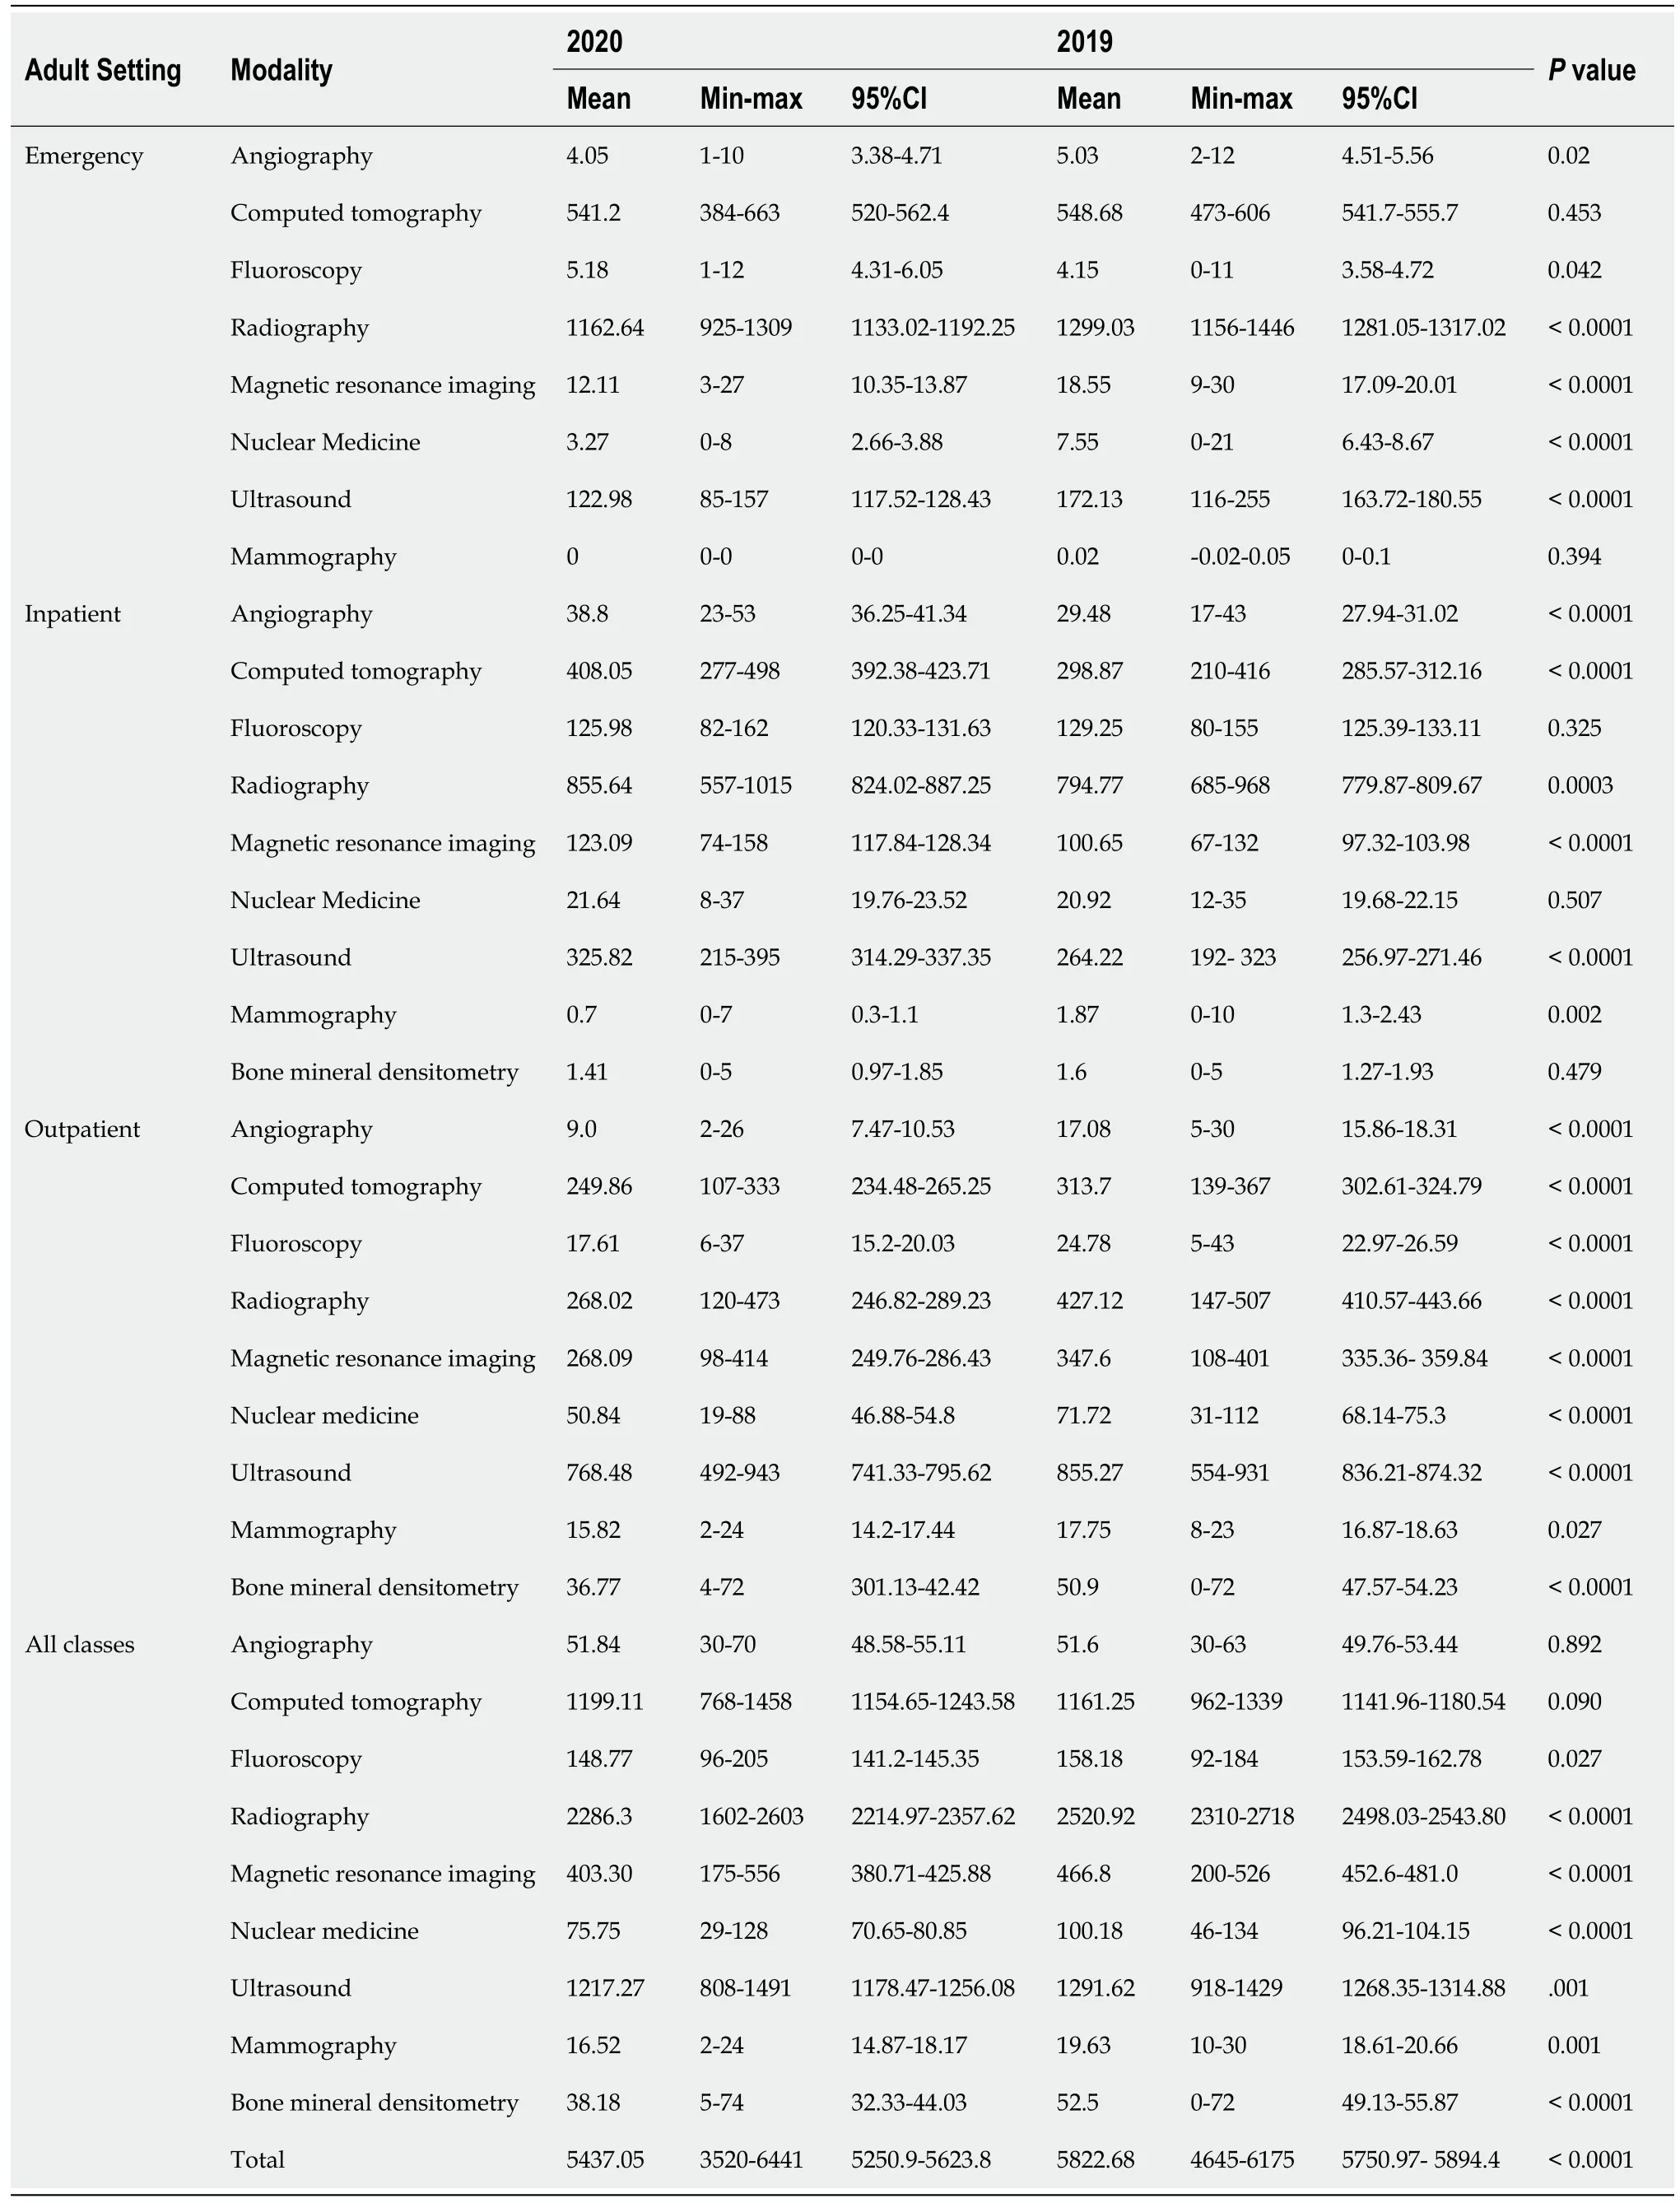
Comparison of the adult mean weekly 2019 (pre-COVID-19, January 1, 2019 to February 29, 2020, weeks 1 to 61) with 2020 (March 1 to December 31, 2020 weeks 61 to 104) imaging volumes by modality, categorised by inpatient, outpatient and emergency services (Table 5) shows statistically significant declines in six imaging modalities (
0.042 to
0.0001). There were statistically significant declines in one inpatient imaging modality (
0.002) and nine outpatient imaging modalities (
0.027 to
0.0001). Statistically significant increases were observed in five inpatient modalities (
0.0003 to
0.0001). All patient classes observed overall declines across seven imaging modalities (
0.027 to
0.0001).
Fluoroscopy
Many non-clinically urgent fluoroscopy studies, such as barium swallows for outpatient studies, were placed on hold or rescheduled during the pandemic. Following Victoria’s second wave, there was a resurgence of patient bookings from October 2020. The end of September 2020 marked the easing of stage 4 restrictions, with COVID-19 infections decreasing significantly. Thus outpatient and inpatient bookings were rescheduled over the coming months to cope with demand. A significant change in imaging volume was observed between June and July, with a below-average patient number in July (Figure S2). This can be likely attributed to the similar timing of outbreaks in COVID-19 at aged care centres, prompting the Victorian government to move aged care residents to hospitals to prevent further COVID-19-related deaths.
General radiography
While adult general X-ray was particularly impacted during the pandemic’s first wave, likely due to the cancellation of elective surgery and outpatient clinics, less impact was observed during the second wave. Conversely, paediatric general X-ray imaging volumes significantly reduced during both pandemic waves. In 2020, the utilisation of mobile imaging saw significant growth. This can be attributed to workflow changes such as infection control measures to reduce patient movement[28]. Senior management purchased extra mobile imaging systems to manage the increased demand, contributing to the observed changes. Other imaging protocol modifications to reduce the risk of contracting COVID-19, such as imaging through glass, were performed but not used routinely at our institution[8]. The utilisation of mobile imaging more than doubled during the peak of the pandemic at our institution, particularly in the emergency setting. This is comparable with the findings of others. Surveyed Western Australian medical imaging professionals perceived increased mobile chest imaging, particularly in the public hospital setting[29]. At the same time, in Singapore, there was a three-fold increase in emergency department mobile imaging usage[30]. Although mobile imaging utilisation increased, there was little change in radiographer-reported doses[31]. There was a slight shift in imaging regions other than the chest (data not shown)[31]. We also observed that fixed X-ray imaging decreased when adult mobile imaging increased in the emergency setting. This was likely to reduce transmission risk and manage potential increased demand[8,32]. The greatest impact on adult mobile imaging usage was observed during the pandemic’s second wave, when the risk of cold and influenza was heightened (July-September 2020)[33].
MRI
We observed appreciable declines due to work practice changes implemented in adult and paediatric MRI services during the pandemic contributed to long waiting lists across our network. Elective general anaesthetic cases were placed “on hold” as per Victorian Government recommendations and aerosolgenerating procedure policies to allow room resting and cleaning that extended the total examination time, particularly impacted paediatric services[3,34,35].
Mammography
As with other imaging modalities, our mammography service also experienced a reduction in imaging volumes during the first and second waves of the pandemic. This is consistent with other findings, though to a lesser extent, in our health service[15,36,37]. In Australia, breast screening services were temporarily suspended, with services reopening based upon government recommendations. Similarly, changes in workflow required stricter patient management protocols and cleaning protocols to minimise transmission risk[28,37,38].
Nuclear medicine
We found that nuclear medicine, then mammography were the modalities most impacted by the pandemic and consistent with the findings of others[15,16,36,37]. This could, in part, be due to logistical changes to isotope supply. From March to July and October to November 2020, there were significant issues with isotope transportation locally and overseas, particularly during the first wave of the pandemic. Due to unforeseen mechanical problems at the Australian Nuclear Science and Technology Organisation manufacturing site, there were also supply interruptions. These included a broken conveyer belt, storm causing electrical faults, production failure, isotope refinement and contamination issues. Other challenges included scheduled reactor shutdown, with difficulty in alternate isotope sourcing to meet demand. These interruptions could have contributed to the significant changes observed.
Ultrasound
At our institution, ultrasound was less impacted than other modalities, which is consistent with other experiences[16,19]. However, data from Germany found ultrasound was the most significantly affected imaging modality, though not all modalities were included in their analysis[14]. Ultrasound services were transformed considerably in the early weeks of the outbreak, with the expansion of ambulatory centres to provide ‘clean’ sites. In the main hospital centres, there was a substantive need for mobile ultrasound examination both in ED and in the wards. In the lead-up to the pandemic, we observed a decrease in ED patients. ED patient imaging volume stabilised during the pandemic, with some growth observed. The reason for this surge was thought to be multi-factorial. There seemed to be a tendency for patients to attend an ED rather than their local GP. It was also believed that patients’ examinations were initially delayed, and the surge compensated for this. There was no obvious change in the referral patterns for the types of examinations requested. Anecdotally, point of care ultrasound (PoCUS) examinations decreased across this period. This seemed to be related to clinicians minimising patient contact and deciding to suspend PoCUS training.
Inpatient services overall increased, but there were small reductions in patient volumes during the first and second waves. While other services reported some value for lung ultrasound, this was not used in evaluating COVID-19-positive patients at our institution[10]. Consistent with the other modalities, we did see a decrease in outpatient attendances, which returned relatively quickly. This is likely due to outpatient clinic closures, halting non-essential ultrasound intervention, and patients' choice to delay their scans. As with other modalities, ultrasound was less impacted during the second wave. Obstetric cases throughout this period were deemed an essential service and did not change. Sonographers were activated to perform blood pressures as part of a third-trimester pathway as many women were seen
telehealth. The Early Pregnancy Bleeding pathway and clinic were also relocated to ultrasound. Minor changes were made to scan protocols. Targeted scans were introduced for high-risk patients. The timing of paediatric hip screening was adjusted to minimise the risk of repeat examinations.
Paediatrics
Overall, there was a decrease of approximately 55% from April to October 2020 compared to 2019. Recovery of paediatric imaging, particularly after the second wave (September to December 2020), was more rapid, coinciding with the gradual reduction in Melbourne’s COVID-19 case numbers and the subsequent easing of restrictions. Many patients and families deferred non-urgent imaging during the lockdown. Moreover, lockdown, home-schooling and suspension of group sports further reduced paediatric cases from sporting injuries[39]. We did observe a slight increase in some services, such as MRI, during 2020 despite COVID-19 disruption, as services returned to pre-COVID-19 demand. This was due to the new software and hardware upgrade in February 2020, reducing the total scan time and potentially increasing patient throughput while providing additional time for cleaning. As observed with adult modality data, following lockdowns in April and July-September 2020 and elective surgery deferral, there was a dramatic decrease in paediatric imaging across all modalities, except for angiography (minimal imaging volume). Recovery was observed between the first and second waves. However, it did not reach the pre-COVID-19 Levels. We also observed an increase in mobile usage in emergencies to help reduce the transmission risk.
Study limitations
While our health service cared for the first Australian COVID-19 patient, other health services across Melbourne, particularly in the north and west, experienced higher caseloads. Consequently, these health services may have experienced more significant declines in radiology services than we observed across our health services. Our institution purchased additional mobile X-ray units to prepare for the pandemic, contributing to the increased use. Of note, the MRI software and hardware upgrades did not significantly increase the imaging volume. However, they did provide additional time for practice changes, such as improved infection control measures. Nuclear medicine experienced even more significant challenges during the pandemic due to unforeseen interruptions to isotope supplies as a confounding variable. This required additional patient rescheduling, often at short notice. Given that data was analysed between 2019 and 2020, some underlying baseline year-to-year variability may be contributing to the findings. Timeframes defining COVID-19 may vary worldwide, making data comparison somewhat difficult.
This work represents one large Victorian health service; however, it may not be generalisable to other health services.
(1) Once-in-a-lifetime events such as a global pandemic can significantly impact workflow across imaging modalities, with the need to implement new processes; (2) Our experience during the pandemic was not the same as those experiences described by other nations due to the variation in severity and (3) Modalities across our health network were impacted differently due to changes in service demands, closures of outpatient clinics, and rescheduling elective surgeries.
CONCLUSION
In the meantime the smell of the sweet jam rose to the ceiling, where heaps of flies were sitting, and attracted them to such an extent that they swarmed3 on to it in masses
ARTICLE HIGHLIGHTS
Research background
Medical imaging modalities worldwide were significantly impacted by the the coronavirus disease 2019(COVID-19) pandemic; however, each country's experience differed. This study provides an in-depth analysis of the impact on adult, paediatric, inpatient, outpatient, emergency and mobile services across the first and second waves of the COVID-19 pandemic in a large public health network in Victoria,Australia.
Research motivation
This work provides evidence for managing and redeploying resources during "once in a lifetime" events such as a pandemic and impact duration. Using this work, modelling and forecasting anticipated changes to imaging demand can be performed, allowing optimal utilisation of departmental staffing to manage workloads.
Research objectives
To identify adult and paediatric imaging volume changes, including mobile imaging across a large Victorian public hospital network. We realised our objectives, and the findings highlighted significant differences across the modalities analysed. Future research could monitor the long-term impacts of such events, such as staff burnout or opportunities for additional training to address deficiencies identified.
Research methods
The use of statistical methods in data analysis highlighted the modalities, patient classes and differences between adult and paediatric imaging. Particularly, methods to identify any correlation between mobile and non-mobile imaging volumes were novel.
Research results
We identified that the greatest impact occurred in Nuclear Medicine during the first and second waves,with all modalities less affected during the second wave; other modalities such as computed tomography were less impacted, requiring greater resources to manage service demand. We observed a shift in regions imaged using mobile imaging. It would be essential to understand this impact regarding image quality, workflow and patient radiation dose.
In an instant she felt herself rising from the ground, with the fan always beneath her, and while Grimace was too much blinded by her fury to notice what was going on the princess was quickly soaring out of her reach
Research conclusions
Medical imaging modality services across a large Victorian public health network were significantly affected during the COVID-19 pandemic; however, the impact on different modalities varied relative to studies performed in other countries. It is essential to have a broad perspective of the impact to each imaging modality in both the adult and paediatric context to help better address the need for workflow changes. It is essential to consider whether imaging services are inversely correlated to manage optimal departmental resourcing.
Research perspectives
Future research could further investigate the long-term impact of lockdowns and the pandemic on imaging modality volumes and their recovery. This can help inform future budgeting requirements regarding the need for additional equipment and staffing to manage continuous workflow demands.
FOOTNOTES
Pinson JA, Badawy MK, designed and coordinated the study; Pinson JA, Badawy MK, Diep ML, Krishnan V, Aird C, Cooper C, Leong C, Chen J, Paul E and Ardley N performed the data collection, analysed and interpreted the data; Pinson JA, Badawy MK, Diep ML, Krishnan V, Aird C, Cooper C, Leong C, Chen J, Paul E and Ardley N wrote the manuscript; all authors have read, edited and approved the final version of the manuscript.
The study was reviewed and approved by the Monash Health Human Research Ethics Committee Institutional Review Board [(Approval No. QA/69362/MonH-2020-235260(v1))].
Patients were not required to give informed consent to the study because the analysis used anonymous clinical data that were obtained after each patient agreed to treatment by written consent. For full disclosure, the details of the study are published on the home page of Fukushima Medical University.
We have no financial relationships to disclose.
Technical appendix, statistical code, and dataset available from the corresponding author at mohamed.badawy@monashhealth.org.
Day after day the little horse, which I named Sprite in hopes that she would aspire5 to her name, moped about, sniffing6 out her mother’s scent7 and eating enough to sustain her, but without the usual gusto of a growing animal. Sprite seemed determined8 to be miserable9.
This article is an open-access article that was selected by an in-house editor and fully peer-reviewed by external reviewers. It is distributed in accordance with the Creative Commons Attribution NonCommercial (CC BYNC 4.0) license, which permits others to distribute, remix, adapt, build upon this work non-commercially, and license their derivative works on different terms, provided the original work is properly cited and the use is noncommercial. See: https://creativecommons.org/Licenses/by-nc/4.0/
Australia
Jo-Anne Pinson 0000-0001-6654-0278; My Linh Diep 0000-0001-5007-3046; Vinay Krishnan 0000-0002-0062-5348; Caroline Aird 0000-0002-3942-4375; Cassie Cooper 0000-0001-8504-8086; Christopher Leong 0000-0001-9496-799X; Jeff Chen 0000-0003-4553-9221; Nicholas Ardley 0000-0002-2251-8754; Eldho Paul 0000-0003-1263-7255; Mohamed Khaldoun Badawy 0000-0001-8029-9951.
The Australasian Radiation Protection, 63506470.
The old man was fond of all creatures, and every morning he used to open the cage door, and the sparrow flew happily about until it caught sight of a cat or a rat or some other fierce beast, when it would instantly return to the cage, knowing that there no harm could come to it
I will make them little shirts, and coats, and vests, and trousers, and knit both of them a pair of stockings, and do thou, too, make them two little pairs of shoes: The shoemaker s wife is not stingy with her own work, making a complete ensemble44 for each of the little men
Nothing at all, I assure you, I replied in a tone which really ought to have convinced them, but they went on to describe various employments, and tried to discover which of them would be most to my taste
Wang LL
A
Many near-death experiences around the world, regardless of religious belief, involve the visitation of dead loved-ones, usually family members and close friends.Return to place in story.
Wang LL
1 Cucinotta D, Vanelli M. WHO Declares COVID-19 a Pandemic.
2020; 91: 157-160 [PMID: 32191675 DOI: 10.23750/abm.v91i1.9397]
2 Islam MS, Rahman KM, Sun Y, Qureshi MO, Abdi I, Chughtai AA, Seale H. Current knowledge of COVID-19 and infection prevention and control strategies in healthcare settings: A global analysis.
2020; 41: 1196-1206 [PMID: 32408911 DOI: 10.1017/ice.2020.237]
3 COVIDSurg Collaborative. Elective surgery cancellations due to the COVID-19 pandemic: global predictive modelling to inform surgical recovery plans.
2020; 107: 1440-1449 [PMID: 32395848 DOI: 10.1002/bjs.11746]
4 Weissman GE, Crane-Droesch A, Chivers C, Luong T, Hanish A, Levy MZ, Lubken J, Becker M, Draugelis ME, Anesi GL, Brennan PJ, Christie JD, Hanson CW 3rd, Mikkelsen ME, Halpern SD. Locally Informed Simulation to Predict Hospital Capacity Needs During the COVID-19 Pandemic.
2020; 173: 21-28 [PMID: 32259197 DOI: 10.7326/M20-1260]
5 Tan BS, Dunnick RN, Gangi A, Goergen S, Jin Z-Y, Neri E, Nomura CH, Pitcher RD, Yee J, Mahmood U. RSNA International Trends: A Global Perspective on the COVID-19 Pandemic and Radiology in Late 2020.
2021; 299: E193-E203 [DOI: 10.1148/radiol.2020204267]
6 Currie G. COVID19 impact on nuclear medicine: an Australian perspective.
2020; 47: 1623-1627 [PMID: 32296883 DOI: 10.1007/s00259-020-04812-z]
7 Amukotuwa SA, Bammer R, Maingard J. Where have our patients gone?
2020; 64: 607-614 [DOI: 10.1111/1754-9485.13093]
8 Brady Z, Scoullar H, Grinsted B, Ewert K, Kavnoudias H, Jarema A, Crocker J, Wills R, Houston G, Law M, Varma D. Technique, radiation safety and image quality for chest X-ray imaging through glass and in mobile settings during the COVID-19 pandemic.
2020; 43: 765-779 [PMID: 32662037 DOI: 10.1007/s13246-020-00899-8]
9 Seghers MC, Seghers VJ, Sher AC, Jadhav SP, States LJ, Trout AT, Alazraki AL, Sammer MBK. Working from home during the COVID-19 pandemic: surveys of the Society for Pediatric Radiology and the Society of Chiefs of Radiology at Children's Hospitals.
2022; 52: 1242-1254 [PMID: 35229184 DOI: 10.1007/s00247-022-05299-6]
10 Bla?i? I, Brklja?i? B, Frija G. The use of imaging in COVID-19-results of a global survey by the International Society of Radiology.
2021; 31: 1185-1193 [PMID: 32939620 DOI: 10.1007/s00330-020-07252-3]
11 Eastgate P, Neep MJ, Steffens T, Westerink A. COVID-19 Pandemic-considerations and challenges for the management of medical imaging departments in Queensland.
2020; 67: 345-351 [PMID: 32827241 DOI: 10.1002/jmrs.423]
12 Sreedharan S, Mian M, McArdle DJT, Rhodes A. The impact of the COVID-19 pandemic on diagnostic imaging services in Australia.
2022; 66: 377-384 [PMID: 34288493 DOI: 10.1111/1754-9485.13291]
13 V?? S, Dizdarevic S. Single photon emission computed tomography lung perfusion imaging during the COVID-19 pandemic: does nuclear medicine need to reconsider its guidelines?
2020; 41: 991-993 [PMID: 32796489 DOI: 10.1097/MNM.0000000000001246]
14 Fleckenstein FN, Maleitzke T, B?ning G, Kahn J, Büttner L, Gebauer B, Aigner A, Hamm B. Decreased Medical Care During the COVID-19 Pandemic-A Comprehensive Analysis of Radiological Examinations.
2021; 193: 937-946 [PMID: 33735933 DOI: 10.1055/a-1368-5047]
15 Naidich JJ, Boltyenkov A, Wang JJ, Chusid J, Hughes D, Sanelli PC. Impact of the Coronavirus Disease 2019 (COVID-19) Pandemic on Imaging Case Volumes.
2020; 17: 865-872 [PMID: 32425710 DOI: 10.1016/j.jacr.2020.05.004]
16 Norbash AM, Moore AV Jr, Recht MP, Brink JA, Hess CP, Won JJ, Jain S, Sun X, Brown M, Enzmann D. Early-Stage Radiology Volume Effects and Considerations with the Coronavirus Disease 2019 (COVID-19) Pandemic: Adaptations, Risks, and Lessons Learned.
2020; 17: 1086-1095 [PMID: 32717183 DOI: 10.1016/j.jacr.2020.07.001]
17 Vagal A, Mahoney M, Allen B, Kapur S, Udstuen G, Wang L, Braley S, Makramalla A, Chadalavada S, Choe KA, Scheler J, Brown A, England E, Hudepohl J, Rybicki FJ. Rescheduling Nonurgent Care in Radiology: Implementation During the Coronavirus Disease 2019 (COVID-19) Pandemic.
2020; 17: 882-889 [PMID: 32473108 DOI: 10.1016/j.jacr.2020.05.010]
18 Kam AW, Chaudhry SG, Gunasekaran N, White AJ, Vukasovic M, Fung AT. Fewer presentations to metropolitan emergency departments during the COVID-19 pandemic.
2020; 213: 370-371 [PMID: 32946589 DOI: 10.5694/mja2.50769]
19 Naidich JJ, Boltyenkov A, Wang JJ, Chusid J, Hughes D, Sanelli PC. Coronavirus Disease 2019 (COVID-19) Pandemic Shifts Inpatient Imaging Utilization.
2020; 17: 1289-1298 [PMID: 32622817 DOI: 10.1016/j.jacr.2020.06.011]
20 Wang C, Horby PW, Hayden FG, Gao GF. A novel coronavirus outbreak of global health concern.
2020; 395: 470-473 [PMID: 31986257 DOI: 10.1016/S0140-6736(20)30185-9]
21 Iezzi R, Valente I, Cina A, Posa A, Contegiacomo A, Alexandre A, D'Argento F, Lozupone E, Barone M, Giubbolini F, Milonia L, Romi A, Scrofani AR, Pedicelli A, Manfredi R, Colosimo C. Longitudinal study of interventional radiology activity in a large metropolitan Italian tertiary care hospital: how the COVID-19 pandemic emergency has changed our activity.
2020; 30: 6940-6949 [PMID: 32607633 DOI: 10.1007/s00330-020-07041-y]
22 Wong LE, Hawkins JE, Langness S, L. MK, Iris P, Sammann A. Where Are All the Patients?
2020; 1: 12. [DOI: 10.1056/CAT.20.0193]
23 Sapkota HR, Nune A, Bateman J, Venkatachalam S. A pragmatic proposal for triaging DXA testing during the COVID-19 global pandemic.
2021; 32: 1-6 [PMID: 33146750 DOI: 10.1007/s00198-020-05722-4]
24 Andrikopoulos S, Johnson G. The Australian response to the COVID-19 pandemic and diabetes-Lessons learned.
2020; 165: 108246 [PMID: 32502693 DOI: 10.1016/j.diabres.2020.108246]
25 Shi J, Giess CS, Martin T, Lemaire KA, Curley PJ, Bay C, Mayo-Smith WW, Boland GW, Khorasani R. Radiology Workload Changes During the COVID-19 Pandemic: Implications for Staff Redeployment.
2021; 28: 1-7 [PMID: 33036897 DOI: 10.1016/j.acra.2020.09.008]
26 Czeisler Mé, Kennedy JL, Wiley JF, Facer-Childs ER, Robbins R, Barger LK, Czeisler CA, Rajaratnam SMW, Howard ME. Delay or avoidance of routine, urgent and emergency medical care due to concerns about COVID-19 in a region with low COVID-19 prevalence: Victoria, Australia.
2021; 26: 707-712 [PMID: 34081819 DOI: 10.1111/resp.14094]
27 Garg M, Prabhakar N, Bhalla AS. Cancer risk of CT scan in COVID-19: Resolving the dilemma.
2021; 153: 568-571 [PMID: 34596597 DOI: 10.4103/ijmr.ijmr_1476_21]
28 ACR Recommendations for the use of Chest Radiography and Computed Tomography (CT) for Suspected COVID-19 Infection. Am Coll Radiol 2020, March 11. [cited 15 July 2021]. Available from: https://psnet.ahrq.gov/issue/acrrecommendations-use-chest-radiography-and-computed-tomography-ct-suspected-covid-19
29 Dann C, Sun Z. The impact of COVID-19 on Western Australian medical imaging clinical practice and workplace.
2022 [PMID: 35555866 DOI: 10.1002/jmrs.594]
30 Goh Y, Chua W, Lee JKT, Ang BWL, Liang CR, Tan CA, Choong DAW, Hoon HX, Ong MKL, Quek ST. Operational Strategies to Prevent Coronavirus Disease 2019 (COVID-19) Spread in Radiology: Experience From a Singapore Radiology Department After Severe Acute Respiratory Syndrome.
2020; 17: 717-723 [PMID: 32298643 DOI: 10.1016/j.jacr.2020.03.027]
31 Yeung P, Pinson JA, Lawson M, Leong C, Badawy MK. COVID-19 pandemic and the effect of increased utilisation of mobile X-ray examinations on radiation dose to radiographers.
2022; 69: 147-155 [PMID: 35180810 DOI: 10.1002/jmrs.570]
32 Koehler D, Ozga AK, Molwitz I, May P, G?rich HM, Keller S, Adam G, Yamamura J. Time series analysis of the demand for COVID-19 related chest imaging during the first wave of the SARS-CoV-2 pandemic: An explorative study.
2021; 16: e0247686 [PMID: 33657140 DOI: 10.1371/journal.pone.02476867]
33 Reichert TA, Simonsen L, Sharma A, Pardo SA, Fedson DS, Miller MA. Influenza and the winter increase in mortality in the United States, 1959-1999.
2004; 160: 492-502 [PMID: 15321847 DOI: 10.1093/aje/kwh227]
34 van Doremalen N, Bushmaker T, Morris DH, Holbrook MG, Gamble A, Williamson BN, Tamin A, Harcourt JL, Thornburg NJ, Gerber SI, Lloyd-Smith JO, de Wit E, Munster VJ. Aerosol and Surface Stability of SARS-CoV-2 as Compared with SARS-CoV-1.
2020; 382: 1564-1567 [PMID: 32182409 DOI: 10.1056/NEJMc2004973]
35 Raissaki M, Shelmerdine SC, Damasio MB, Toso S, Kvist O, Lovrenski J, Hirsch FW, G?rkem SB, Paterson A, Arthurs OJ, Rossi A, van Schuppen J, Petit P, Argyropoulou MI, Offiah AC, Rosendahl K, Caro-Domínguez P. Management strategies for children with COVID-19: ESPR practical recommendations.
2020; 50: 1313-1323 [PMID: 32621013 DOI: 10.1007/s00247-020-04749-3]
36 Parikh KD, Ramaiya NH, Kikano EG, Tirumani SH, Pandya H, Stovicek B, Sunshine JL, Plecha DM. COVID-19 Pandemic Impact on Decreased Imaging Utilization: A Single Institutional Experience.
2020; 27: 1204-1213 [PMID: 32665091 DOI: 10.1016/j.acra.2020.06.024]
37 Sprague BL, O'Meara ES, Lee CI, Lee JM, Henderson LM, Buist DSM, Alsheik N, Macarol T, Perry H, Tosteson ANA, Onega T, Kerlikowske K, Miglioretti DL. Prioritizing breast imaging services during the COVID pandemic: A survey of breast imaging facilities within the Breast Cancer Surveillance Consortium.
2021; 151: 106540 [PMID: 34217424 DOI: 10.1016/j.ypmed.2021.106540]
38 Spuur KM. The COVID-19 BreastScreen Department-beyond the pandemic.
2020; 67: 352-355 [PMID: 33026711 DOI: 10.1002/jmrs.430]
39 Johnson MA, Halloran K, Carpenter C, Pascual-Leone N, Parambath A, Sharma J, Seltzer R, Ellis HB, Shea KG, Ganley TJ. Changes in Pediatric Sports Injury Presentation During the COVID-19 Pandemic: A Multicenter Analysis.
2021; 9: 23259671211010826 [PMID: 33997072 DOI: 10.1177/23259671211010826]
 World Journal of Radiology2022年8期
- World Journal of Radiology的其它文章
- Triple rule-out computed tomography angiography: Evaluation of acute chest pain in COVID-19 patients in the emergency department
- Progress in interventional radiology treatment of pulmonary embolism: A brief review
- Amebic liver abscess: Clinico-radiological findings and interventional management
- Advanced magnetic resonance imaging findings in salivary gland tumors
- Augmenting prostate magnetic resonance imaging reporting to incorporate diagnostic recommendations based upon clinical risk calculators