
Stock Market Turnover and China’s Real Estate Market Price: An Empirical Study Based on VAR
2022-08-24 09:24:54SunXianchaoandHuangChengjie
Contemporary Social Sciences 2022年4期
Sun Xianchao, and Huang Chengjie
Sichuan Normal University
Abstract: Our analysis used the monthly data of the average sales price of commodity houses and stock turnover in the Shenzhen Stock Exchange from January 2016 to December 2020. We selected this data to establish a Vector Autoregression (VAR) model using the Granger causality test to investigate the correlation between the stock market and the real estate market. We found that there is a significant positive correlation between the stock market and the real estate market. We also found that the real estate market price is the one-way Granger cause for the stock market turnover, and that changes in the real estate market price have a significant role in forecasting changes in stock market turnover. Therefore, the linkage between the two markets should be considered in macro regulations, and the impact on one of the markets should be considered when regulating the other.
Keywords: stock market turnover, real estate prices, VAR model, Granger causality test
Introduction
As an important part of China’s major economic system, both the stock market and the real estate market play a vital role in stimulating economic growth. With the reform of the securities market and the continuous expansion of the market scale, constant improvements have been made in the market systems and institutions. As of November 2020, there have been over 4,100 listed companies in the A-share market in both markets, with a total market value exceeding RMB76 trillion. Over the past three decades, China’s securities market has vigorously supported the reform of stateowned listed companies and the development of new companies, offering inexhaustible impetus for China’s economic development and providing RMB16 trillion of available funds to more than 4,000 listed companies.①Data Source: http://www.sse.com.cn/, and http://www.szse.cn/.The real estate market, on the other hand, has been an important driving force in supporting China’s economic growth and a key driver of investment and consumption. Except for a low of two percent in 2015, real estate investments have accounted for over 10 percent of GDP for 20 years since 2000②Data Source: http://www.stats.gov.cn/.and have become one of the core engines of China’s economic growth. There have been over 100 real estate sectors since the housing reform. China’s economic strength continues to grow in the world, recently reaching the second. Therefore, the real estate industry provides a stable force for the “new normal” of China’s economy (Jiang & Chen, 2020; Qi & Liu, 2020). Clearly, the stock market and the real estate market have important impacts on China’s economy. Is there a correlation between the two markets? Is this correlation significant? Does the stock market affect the real estate market, or does the real estate market affect the stock market?
Research on the correlation between the real estate market and the stock market has attracted the attention of many economists and sociologists at home and abroad. Some scholars hold that there is no significant correlation between the stock market and the real estate market (Chen & Zheng, 2020). Other scholars argue that there is a causal relationship between the real estate market and the stock market, in that the stock market dominates the real estate market (Liu et al., 2020) or the real estate market dominates the stock market (Huang et al., 2018).
In order to examine the correlation between the real estate market and the stock market, we selected the monthly data of stock turnover and the average sales prices of commodity houses on the main boards; the Small and Medium-sized Enterprise Board (SMEB), the Growth Enterprise Market (GEM), and their combined totals in the Shenzhen Stock Exchange (SZSE) from 2016 to 2020 as samples, and conducted an empirical analysis using the VAR model, Granger causality test, and impulse response and variance decomposition. We found that the real estate market has a significant positive correlation with the stock market. Conversely, there is no such positive correlation between the two markets. An in-depth analysis revealed that the lagging real estate market price has a great impact on the current real estate market price and stock turnover.
There are two major innovations in this study. First, we analyzed the household asset allocation of individual investors from the perspectives of the wealth effect and household asset allocation theory, discussed their different decisions when investing in stocks and real estate, and then explored the correlation between the stock market and the real estate market. Second, the research data were selected from the stock turnover on the main board, SMEB, GEM, and their sum in the SZSE as the stock turnover could better reflect the aggregation of funds than the Shanghai Composite Index or the SZSE index. There were, however, two deficiencies in the data we selected. First, missing data of the average sales price of commodity houses for January each year were calculated based on the growth rate of the current year, which may have errors, and second, there was a big difference between first-tier cities and non-first-tier cities in housing prices due to the clear regional inclinations of the various local housing markets, which may lead to some uncertainties.
The following sections of the paper include the literature review; our theoretical analysis and hypotheses, our discussion of the data, the model, and the empirical results; the practical applications of our findings; and our conclusions and suggestions.
Literature Review
Many domestic and foreign scholars have examined the correlation between the stock market and the real estate market but have come to different conclusions.
Some scholars argue that there is no significant correlation between the stock market and the real estate market. Apostolos Kiohos et al. (2017) investigated the linkage between the real estate market and the stock market in China from 2003-2008 using the VAR model and concluded that there is no significant correlation between them. Nicholas & Scherbina (2013) conducted an in-depth analysis of the correlation between the real estate market and the stock market in the US after the Great Recession and found that there is an uncertain correlation between the two markets. Chen & Zheng (2020) built a financial dynamic computable general equilibrium (CGE) model to empirically study the volume-price interaction between the real estate market and the stock market, and the results showed that the study of the correlation between the housing market and the stock market is generally consistent with the classical correlation theory in terms of the price, but to an overall weaker extent. Zhang et al. (2020) observed the dynamic impact relationship between the RMB exchange rate, housing prices, and stock prices using the ternary generalized auto regressive conditional heteroskedasticity (GARCH) and BEKK time-series models and found that there is an insignificant correlation between housing prices and stock prices.
Some scholars believe that there is a significant positive correlation between the stock market and the real estate market. Gounopoulos et al. (2019) used Greek’s quarterly data from 1997-2015 to observe the dynamic correlation between the stock market and the real estate market and found that the stock market is a one-way Granger cause of the real estate market in the short run. Lu & Dong (2017) collected the SSE index and real estate price index from 2005-2015 and conducted the empirical analysis; the results showed that stock price is the Granger cause of real estate price, which helps explain the future changes of real estate prices. Based on the analysis using the TVP-VAR method, Liu et al. (2020) explored the relationship between credit, housing prices, stock prices, and GDP, and concluded that a positive shock to housing prices could raise stock prices, and a positive shock to stock prices can also raise house prices. Based on the empirical analysis of weekly data during 1998-2013, Li et al. (2014) studied the fluctuations between housing prices and stock prices and found a long-term positive correlation between the two markets.
Some other scholars argue that there is a significant negative correlation between the real estate market and the stock market, meaning that the real estate market has negative impacts on the stock market. Li et al. (2015) studied the relationship between the US housing market and the stock market and found that the two markets had a high negative correlation from 1998-2002. Jiang & Chen (2020) conducted a study using the DCC-GARCH model and concluded that there was a negative correlation between the two markets from 2014-2017. Liu & Xie (2016) found a negative correlation between the stock market and the real estate market in China through an empirical study. Zhang & Jiang (2014) studied the correlation between the two markets in different countries and at different times through theoretical and empirical studies and found that there was a negative correlation between the stock market and the housing market in developed countries.
Through the above literature review, it is clear that scholars have different research conclusions on the exact correlation between the stock market and the real estate market. In studying the correlation between two markets, most scholars used the price index and the Shanghai Composite Index, while few scholars studied the stock turnover. From this perspective, we selected the average sales price of commodity houses in the real estate market and the stock turnover in the stock market as research data and used the time-series analytical method to investigate the correlation between the two markets by building a VAR model. Therefore, this study is an important supplement and improvement to the existing literature.
Stock Market and Real Estate Market: Theoretical Analysis and Hypotheses
In the stock market and the real estate market, stocks and real estate have become hot investment products. Theoretically, there is a certain correlation between the two markets. In this study, the correlation between the two markets was analyzed in terms of the wealth effect and household asset allocation theory, the effect of lag lengths, and the substitution correlation, and three hypotheses are proposed accordingly.
Wealth Effect and Household Asset Allocation Theory
According to the wealth effect theory working on housing prices and consumption, real estate assets are an important part of household wealth; an increase in housing prices implies an increase in household wealth, which in turn boosts the consumption of residents (Ando & Modigliani, 1963).
Ludwig & Slok (2002) classified the wealth effect into realized and unrealized wealth effects. The realized wealth effect means that the appreciation of real estate assets promotes the increase of rental income, transfer income, and residential mortgage income; the unrealized wealth effect means that although the rise in housing prices does not directly affect people’s real disposable income, the current rise in the housing prices foreshadows a future rise in the housing price and creates the expectation of future wealth. At the same time, household asset allocations are closely linked to wealth levels. The wealth growth affects not only the stock market participation behavior of households (breadth) but also the proportion of household holdings (depth). Both direct and indirect household participation in the stock market increases significantly as wealth grows (Xu & Tan, 2016). According to the wealth effect and household asset allocation theory, the rise in housing prices promotes wealth growth, and the wealth growth contributes to residents’ investment in the stock market. Based on the above findings, the first hypothesis of this study is proposed as follows:
H1: The rise in housing prices could promote the increase in stock turnover.
The Effect of Lags
To address the contemporaneous and lagged effects of the real estate market on the stock market, Huang, Wang & Xie (2018) established a TVP-VAR model for empirical analysis and concluded that contemporaneous housing prices have a time-varying effect on stock prices; during the period from 2009 to 2013 when the stock market fluctuations were stable, contemporaneous housing price had a significant impact on stock prices, but stock market surges and crashes could greatly weaken the significant impact of housing price fluctuations on stock prices; the fluctuations of lagged housing prices had a lasting impact on stock prices, which could last for one quarter; since February 2009, lagged housing prices have promoted contemporaneous stock prices. Gao & Li (2011) used the time-domain analysis to study the fluctuation relationships between the real estate market and the stock market in China and found that the correlation between the housing market and the stock market has a lag effect, which is manifested in the fact that it takes some time for the effect of the housing price fluctuation to be reflected in the stock market. From January 1999 to April 2005, the lag between the real estate market and the Shanghai and Shenzhen stock markets was one month, and the lag between the real estate market and stock price fluctuations in Shenzhen real estate stock markets was three months and two months, respectively. From May 2005 to January 2008, the lag between the real estate market and the Shanghai and Shenzhen stock markets was one month, and the lag between the real estate market and stock price fluctuations in the Shenzhen real estate stock markets was two months and three months, respectively. This shows that the capital flow between the real estate market and the stock market needs a period of transformation, which is about two months. Based on the above findings, the second hypothesis of this study is proposed as follows:
H2: Housing prices in the lagged period have a significant effect on stock turnover in the current period.
Substitution Correlation
Money flow is a standard technical index which reflects the current excess demand or supply of stock in the market. Money inflows represent excess demand for a stock, and money outflows represent an excess supply of stock. If there is a continuous excess demand and supply of funds, there will be a continuous net inflow and outflow of funds, causing stocks to rise and fall; in other words, money flow is correlated with stock returns (He, Liu & Xu, 2011). James & Richard (2001) conducted an empirical analysis using data from the New York Stock Exchange (NYSE) and found that money flow had a predictive effect on stock returns and concluded that money flow had a positive correlation not only with stock returns in the same period but also with stock returns in the future. Thus, an increase in stock returns will promote the money inflow. Individual investors have limited investment funds, so they must make trade-offs when choosing investment products such as real estate and stocks. The rise in stock yields drives investors to put more money into stocks and less into real estate, and holding houses means holding fewer stocks. Based on the above findings, the third hypothesis of this study is proposed as follows:
H3: There is an inverse substitution correlation between the real estate market and the stock market.
Data, Model, and Empirical Results
Data Selection and Description
The development of the stock market is measured by stock turnover. The stock turnover is one of the most important indexes for observing, analyzing, and studying the economic situation and economic cycles of different countries and regions. From 2010 to 2020, the Shenzhen and Shanghai stock markets had slightly different volatility, yet the overall trend was that there was a strong correlation between the Shanghai and Shenzhen stock markets in terms of volatility trends. The Shanghai Stock Exchange provides services mainly to traditional central and state-owned enterprises, which are the backbone of the national economy; its financing funds are mostly controlled by the state, being macro-regulatory in nature. In contrast, the Shenzhen Stock Exchange renders services mainly to high-tech SMEs and entrepreneurs, with the aim of fully supporting the growth of SMEs and promoting the implementation of innovation strategies. China officially launched the Small and Medium-sized Enterprise Board (SMEB) in June 2004 and launched the GEM board ChiNext in 2009. Thus, a multi-level capital market system structure has been basically established.
Therefore, we selected the stock turnover in the Shenzhen Stock Exchange, which represents a more multi-level capital market, for our research data. In this study, monthly stock turnover shows the development of the stock market, and the main board (main), SMEB (small), GEM (growth), and the three combined boards (sum) in the Shenzhen Stock Exchange were selected, respectively. The data sources are from the monthly statistical reports on the website of the Shenzhen Stock Exchange. Due to the uncertainty and volatility of the stock market and the large volume base, we took the logarithm of all the data of Shenzhen stock turnovers during the data processing, which not only makes the data smooth but also eliminates the heteroskedasticity of test data while converting it into a linear trend.
Averaging the sales price of commodity houses (ASPH) denotes real estate development and growth. The monthly data from January 2016 to December 2020 was selected for this study, with a total of 60 observations. As for the real estate market, the average sales price of commodity houses was selected. Average Sales Price of Commodity Houses = Commodity House Sales / Commodity House Sales Area. The data provided a powerful symbol for real estate market prices, and the data sources were from the State Statistics Bureau. We also used the logarithm to process the data so that the data maintains a linear relationship with the stock turnover.
Model and Research Methods
Many domestic and foreign scholars determine and analyze the correlation between the stock market and the real estate market using the VAR and the Granger causality test. For the VAR model, its advantage is that all variables are treated as endogenous variables, so the increased uncertainty of the equation model due to subjective judgment errors is simplified. The principle and practical implications of the proposed method are briefly introduced below.
VAR model.
In the VAL each endogenous variable in the system is considered as a function of the range values of all endogenous variables in the system. It is set to forecast indexes related to the time series system and to explain the changes in various indexes of economic variables caused by economic shocks.

In Eq. (1),εtdenotes an unautocorrelated interference term quantity, with a zero mean and a contemporaneous covariance matrix=Ω. This system of equations is the VAR.
Eq. (1) can also be written as:
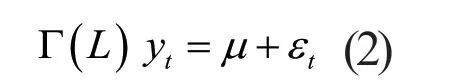
In Eq. (2), Γ(L) denotes the polynomial matrix of the lag operator. The single equation is:
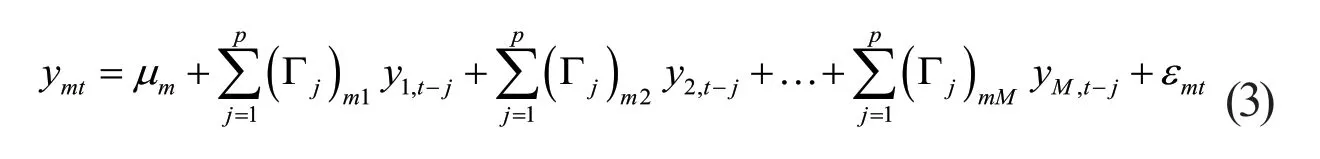
In Eq. (3), ( )mlis the (m, l)-th element ofjΓ .
VAR has been used mainly in macroeconomics. At its beginning, some researchers (e.g., Sims, 1980; Litterman, 1979 & 1986) held that VAR could be used for forecasting. It may be argued that a VAR is a reduced form of an overfitted simultaneous equation model as long as μ contains current observations of the (truly) significant exogenous variable that really matters. Overfitting results from the fact that it may contain more lags than the proper original model. In addition, one of the advantages of the VAR is that it sidesteps decisions about which variables should be exogenous; it has only lagged (prior) variables on the right, all of which are endogenous.
Granger causality test.
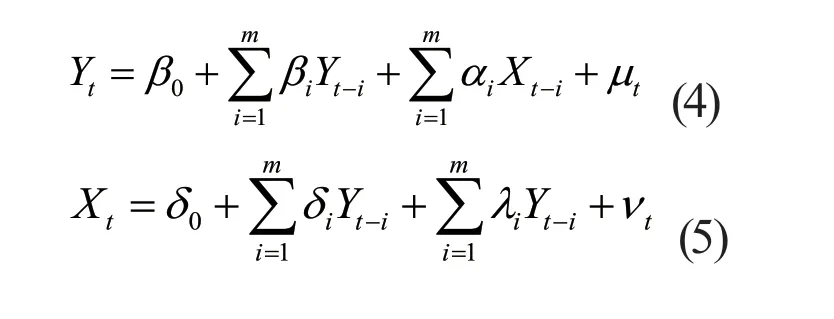
The causality test mainly studies and analyzes the causality of variables under the time series. Under the time series, Granger examines the causality between the economic variablesXandY: IfXis more predictable thanY, thenXhelps explain future changes inY, and theXGranger causesY.Xdepends primarily on the current time horizonY, andXcan explain the historical situation. The scientific degree of serial interpretation can be further enhanced by the inclusion of the lagged value ofX. IfXpromotes the forecasting result ofYor there is an obvious coefficient statistical correlation betweenXandY,Xcan be determined as the Granger cause ofY. The regression model for the Granger causality test is shown below:
There are four possible test results:
a.Xhas a unidirectional action onY, manifested by the fact that the parameters preceding each lagged term ofXin Eq. (4) are not zero, while all parameters preceding each lagged term ofXin Eq. (5) are zero.
b.Yhas a unidirectional action onX, manifested by the fact that the parameters preceding each lagged term ofYin Eq. (5) are not zero, while all parameters preceding each lagged term ofXin Eq. (4) are zero.
c. There is an obvious two-way effect relationship betweenXandY, manifested by the fact that all parameters preceding the lagged term of Eq. (4) are not zero, and all parameters preceding the lagged term ofYin Eq. (5) are non-zero.
d.Xand Y are independent of each other, indicating that all parameters preceding the lagged term ofXin Eq. (4-4) are zero, and all parameters preceding the lagged term ofYin Eq. (4-5) are also zero.
With the help of a constrained F test, the Granger Causality test can successfully obtain relevant research results. For example, assuming thatXis not the Granger cause ofY, that is, all parameters preceding the lagged term ofXin Eq. (4) are not zero, the regression analysis is carried out from two perspectives with and without the lagged term ofX, followed by the calculation of the F-statistic. The detailed results are shown below:
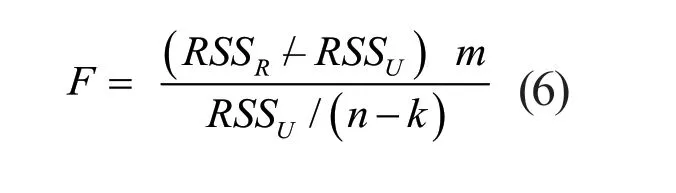
where,ndenotes the sample size,Mdenotes the number of lagged terms, andkdenotes the number of parameters to be estimated.
If theF-value is higher than the critical value at a significance level α, the original hypothesis cannot work, and thus the Granger cause ofYis determined to beX.
Impulse response function.
The impulse response function describes the reflection of the endogenous variable to the error variance size and shows the change path of the sequence after it is affected by random perturbation. It also helps to keep track of the effects of all variables.
In some specific cases, it is possible to add a constant equation other than the prescribed one to any VAR, and the corresponding model can be built. The model is shown below:
where, if none of the characteristic roots of Γ is higher than 1, then the system has the required stability. If the system of equations can maintain dynamic stability, an equilibrium result will be obtained. Equation (8) can be obtained by iterating and combining with the lag operator:
According to the stability condition, there are:
The coefficient of the power of Γ is the multiplier in the system of equations. If the time ofvis zero, it causesyto achieve its desired equilibrium. In order to make a change to anyU, a single pulse needs to be injected into the system. As shown before, a second return to the previous equilibrium state will be made after ymt.
Variance Decomposition.
The purpose of variance decomposition is to attribute the variance of a variable. If there are two variables (xandy) in a VAR system, then after performing variance decomposition, it is clear how much of the variance of t and x at a given time is caused byxand byy; similarly, it is clear how much of the variance ofyis caused byyand byx. Its main idea is to decompose the changes of the(m)endogenous dependent variables into m parts according to the components of each element to identify the effect of each innovation point on the variation of each endogenous variable in the model.
Empirical Analysis
Combining the VAR model with the Granger causality test and impulse effect analysis, we delved into the correlations between the real estate market and the stock market. All measurement operations were performed on Eviews9.
Stationarity test of each variable (ADF test).
Data on time series are prone to pseudo-regression. To avoid pseudo-regression, the data are first tested for stationarity. Due to the great fluctuations and large values of the stock turnover, logarithmic sequence processing can not only eliminate heteroscedasticity, but also effectively reduce the order of magnitude, alleviate the data volatility, and make it easier to achieve stationarity. The variables after taking logarithms are denoted as Ln(main), Ln(small), Ln(growth), Ln(sum) and Ln(asph). The ADF test was used in this study to conduct the corresponding unit root tests on the processed data. The relevant results are detailed in Table 1.
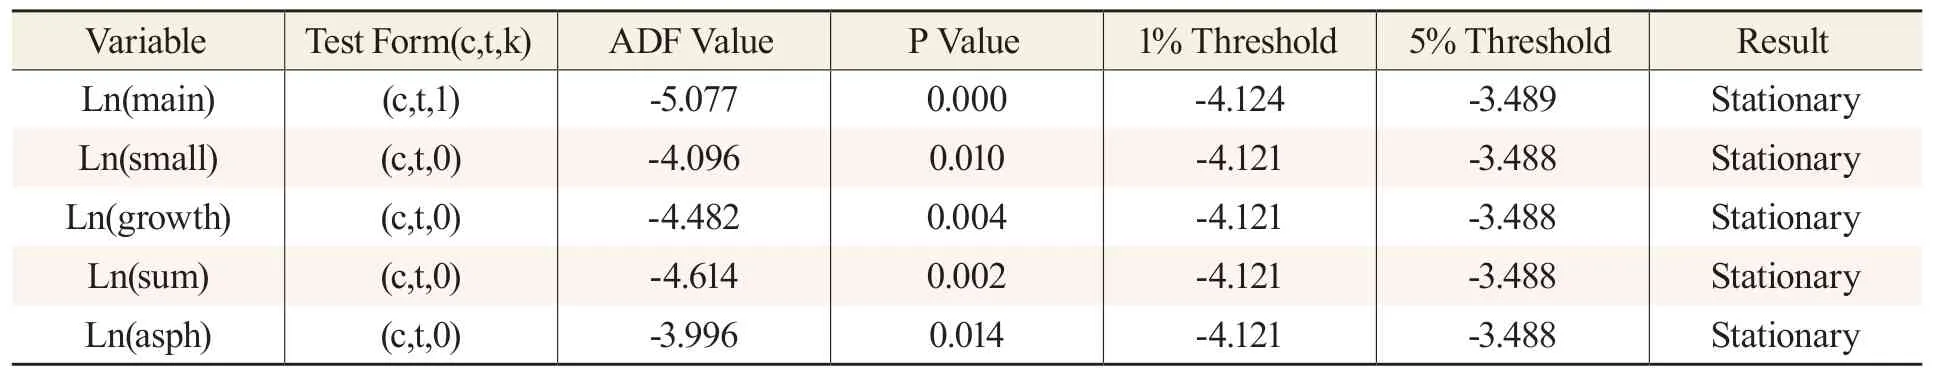
Table 1 Sequence Unit Root Test
According to Table 1, the ADF statistics of the stock turnover of the main board, SMEB, GEM and their sum in the Shenzhen Stock Exchange are smaller than the critical value at the five percent significance level, indicating the null hypothesis that there is at least one unit root is rejected and the sequences Ln(main), Ln(small), Ln(growth), and Ln(sum) denote stationary time series. The ADF statistic of the average sales price of commodity houses is also smaller than the critical value at the five percent significance level, indicating that the null hypothesis is rejected, and the sequence Ln(asph) is a stationary time series.
Granger causality test.
In most cases, the Granger causality test is often chosen in studies on the correlations of model variables. The Granger causality test was conducted on the correlation between the stock turnover of the main board, SMEB, GEM, and their sum in the Shenzhen Stock Exchange, and the results are shown in Table 2.
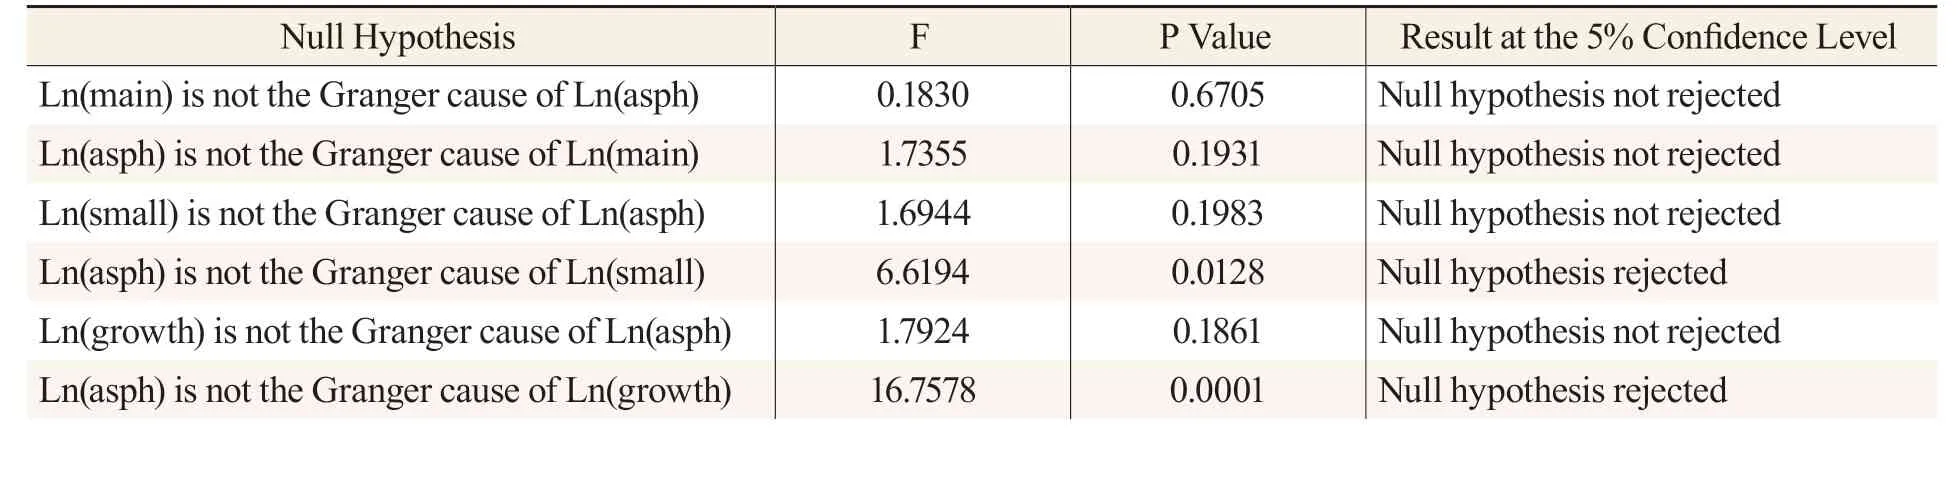
Table 2 Granger Causality Test of Variables
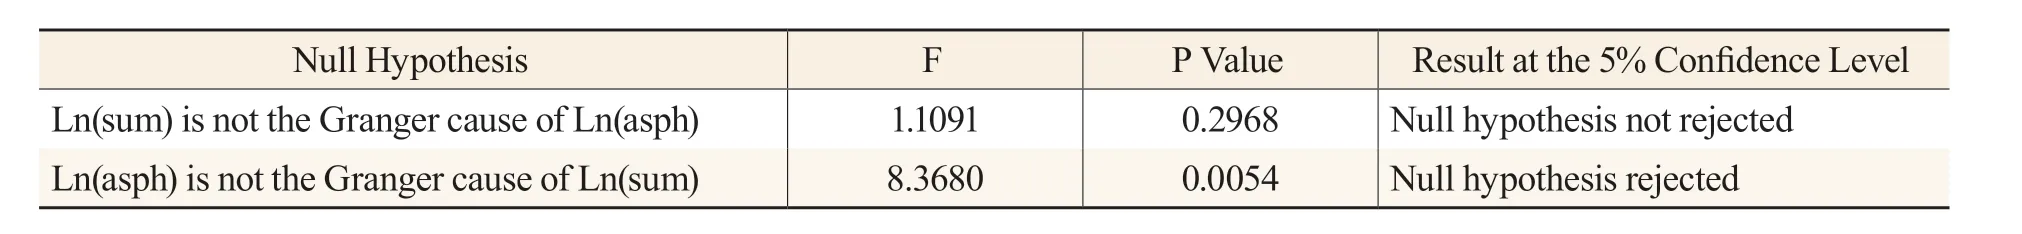
Null Hypothesis F P Value Result at the 5% Confidence Level Ln(sum) is not the Granger cause of Ln(asph) 1.1091 0.2968 Null hypothesis not rejected Ln(asph) is not the Granger cause of Ln(sum) 8.3680 0.0054 Null hypothesis rejected
Table 2 indicates that the average sales price of commodity houses can affect the SZSE stock turnover. At the 5 percent significance level, the average sales price of commodity houses is the Granger cause of stock turnover of the SMEB, GEM, and their sum in the SZSE, not the Granger cause of stock turnover of the main board in the SZSE. The stock turnover of the main board, SMEB, GEM and their sum in the SZSE is not the Granger cause of the average sales price of commodity houses, i.e., at the 5 percent significance level, the SZSE stock turnover has no significant effect on the average sales price of commodity houses.
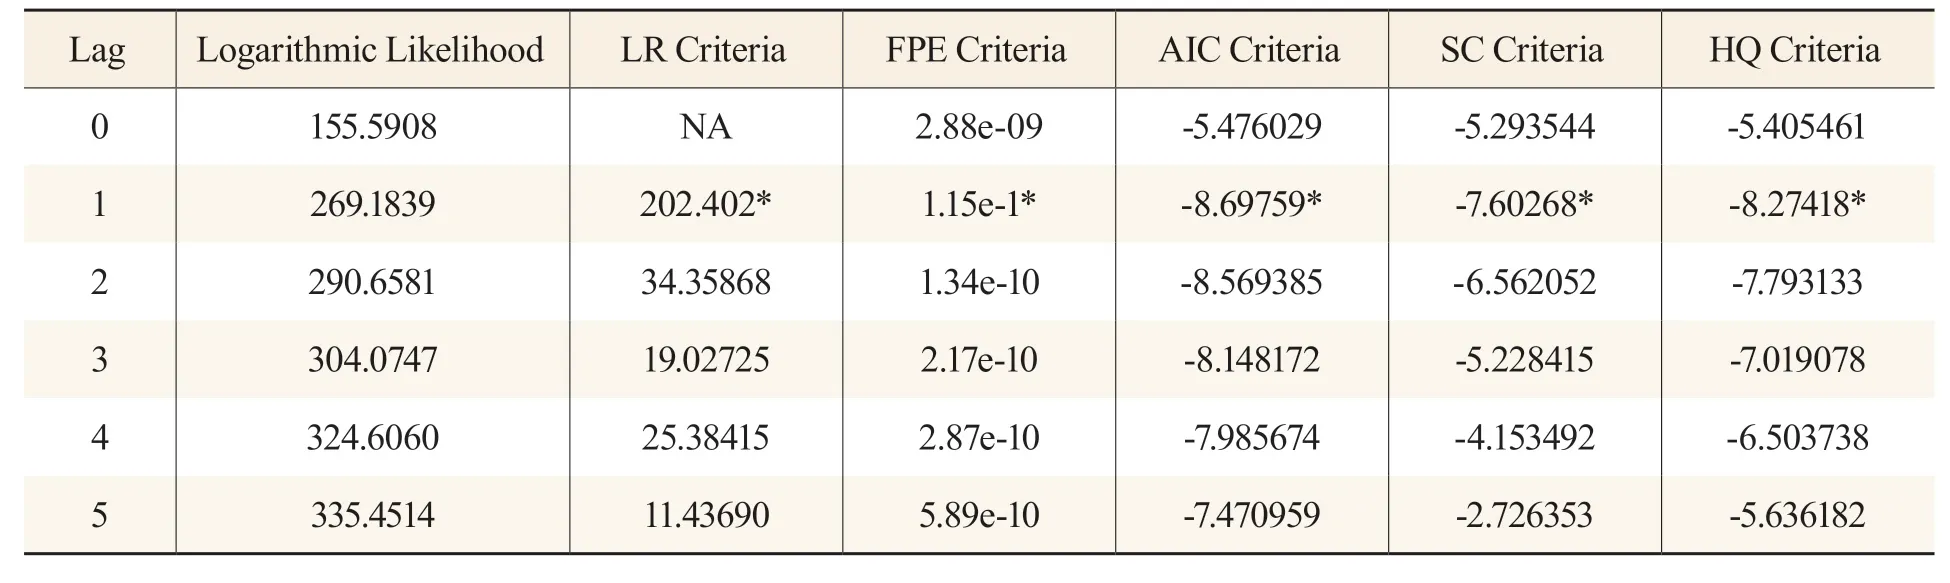
Table 3 List of Information Criteria
In summary, the average sales price of commodity houses is the Granger cause of the stock turnover of the SMEB, GEM, and their sum in the SZSE, and the change in the average sales price of commodity houses has a significant effect on forecasting the stock turnover of the SMEB and GEM in the SZSE; yet the change in the SZSE stock turnover does not have a significant effect on forecasting the change in the average sales price of commodity houses. Therefore, the Granger causality test has verified H1: the rise in housing prices can promote the increase in stock turnover.
Empirical result.
The lag order is of great concern in the study of our VAR model. The choice of lag order p needs both sufficient freedom and enough time lag. In the specific research process of our VAR model, it was often necessary to consider the information criteria such as SC and AIC in order to determine the lag order through these two values. Generally speaking, the smaller the SC and AIC are, the easier it is to determine the lag order in our VAR model. After the lag order of our VAR model was determined, a model lag could be established to obtain the stationarity of the VAR model.
Optimal lag order of our VAR model.
The optimal lag order of the VAR model is determined based on information criteria such as LR, FPE, AIC, SC, and HQ. The smaller the values, the better the model. According to Table 3, the optimal lag order of our VAR model is 1; that is, the model is VAR (1).
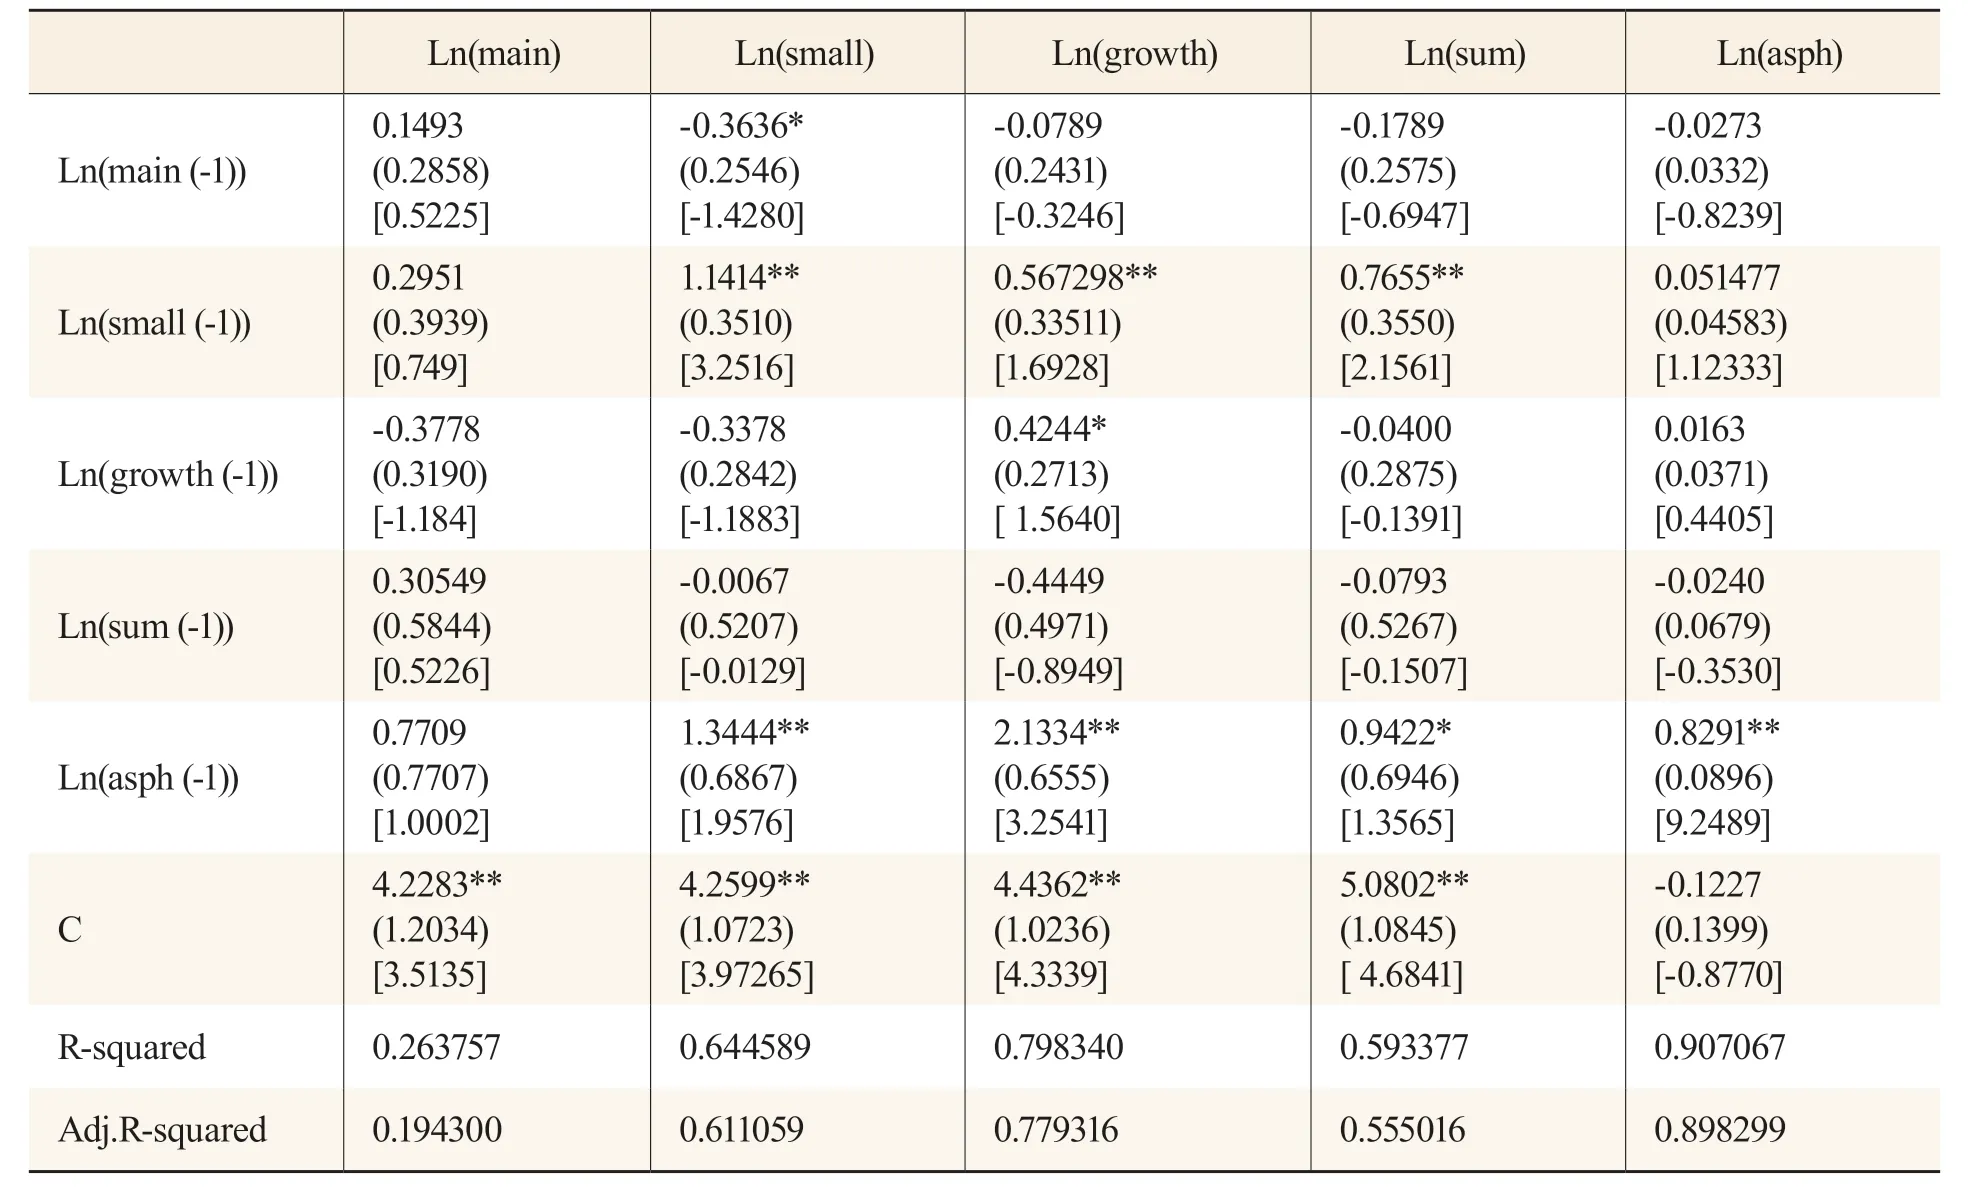
Table 4 Output Result of the Model
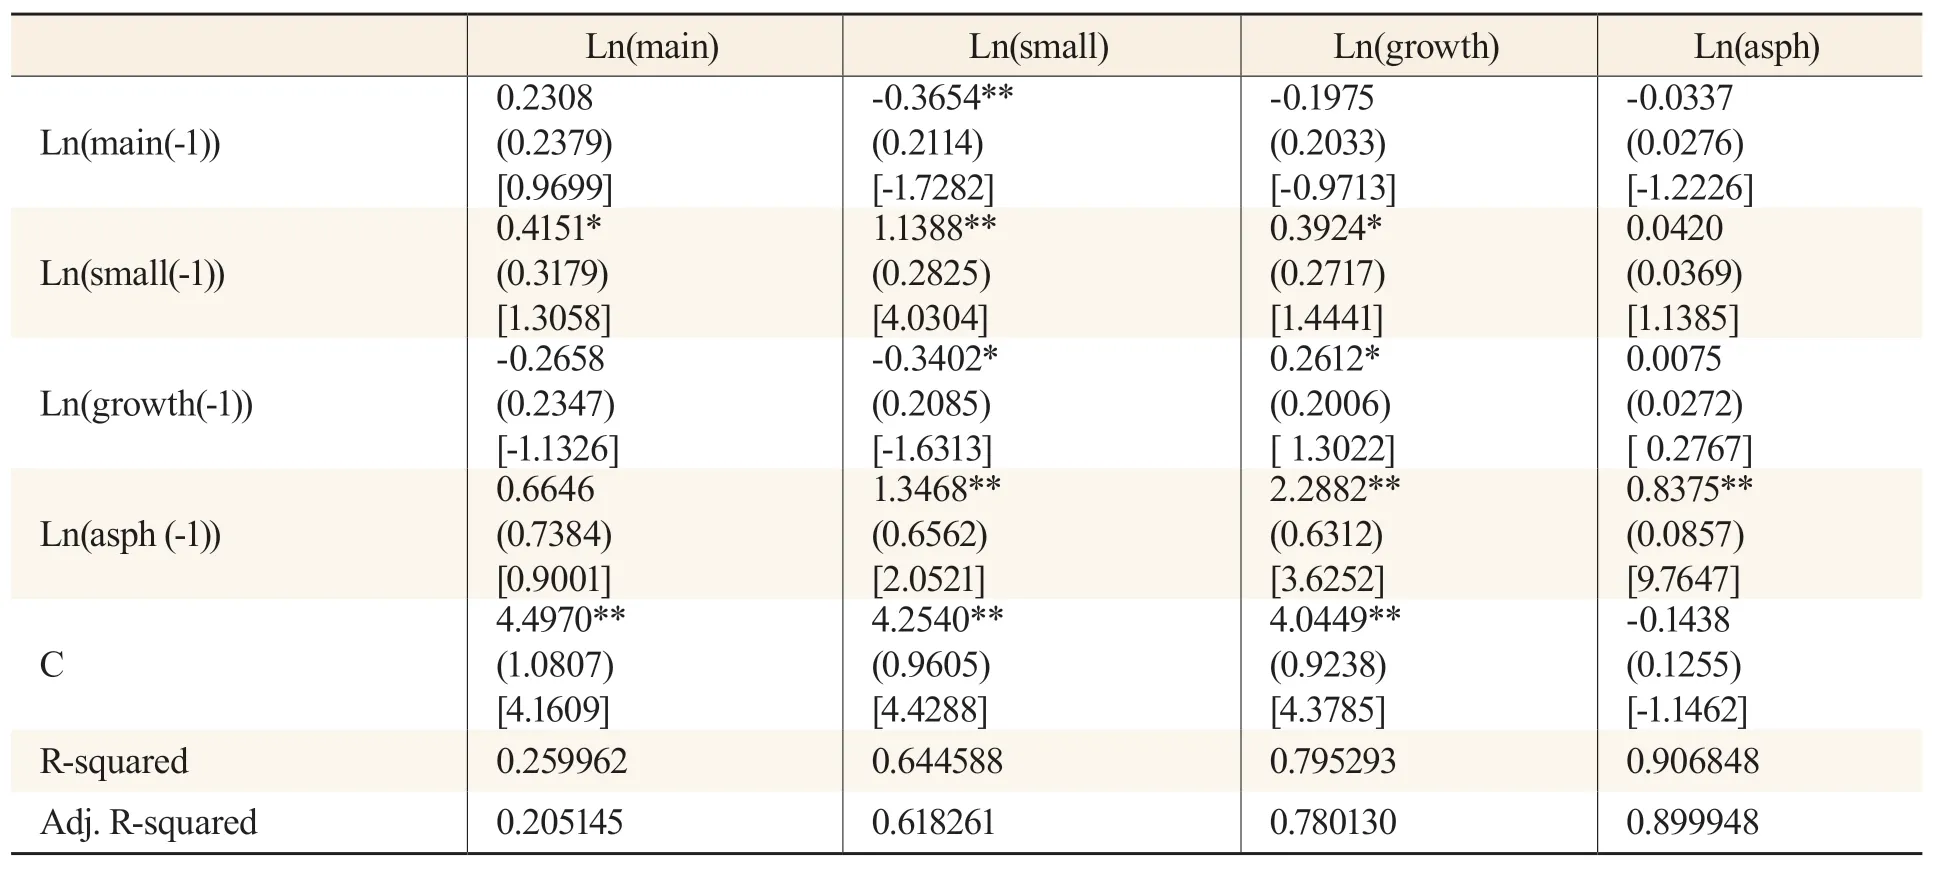
Table 5 Output Results of the Model with a Lag of One Period
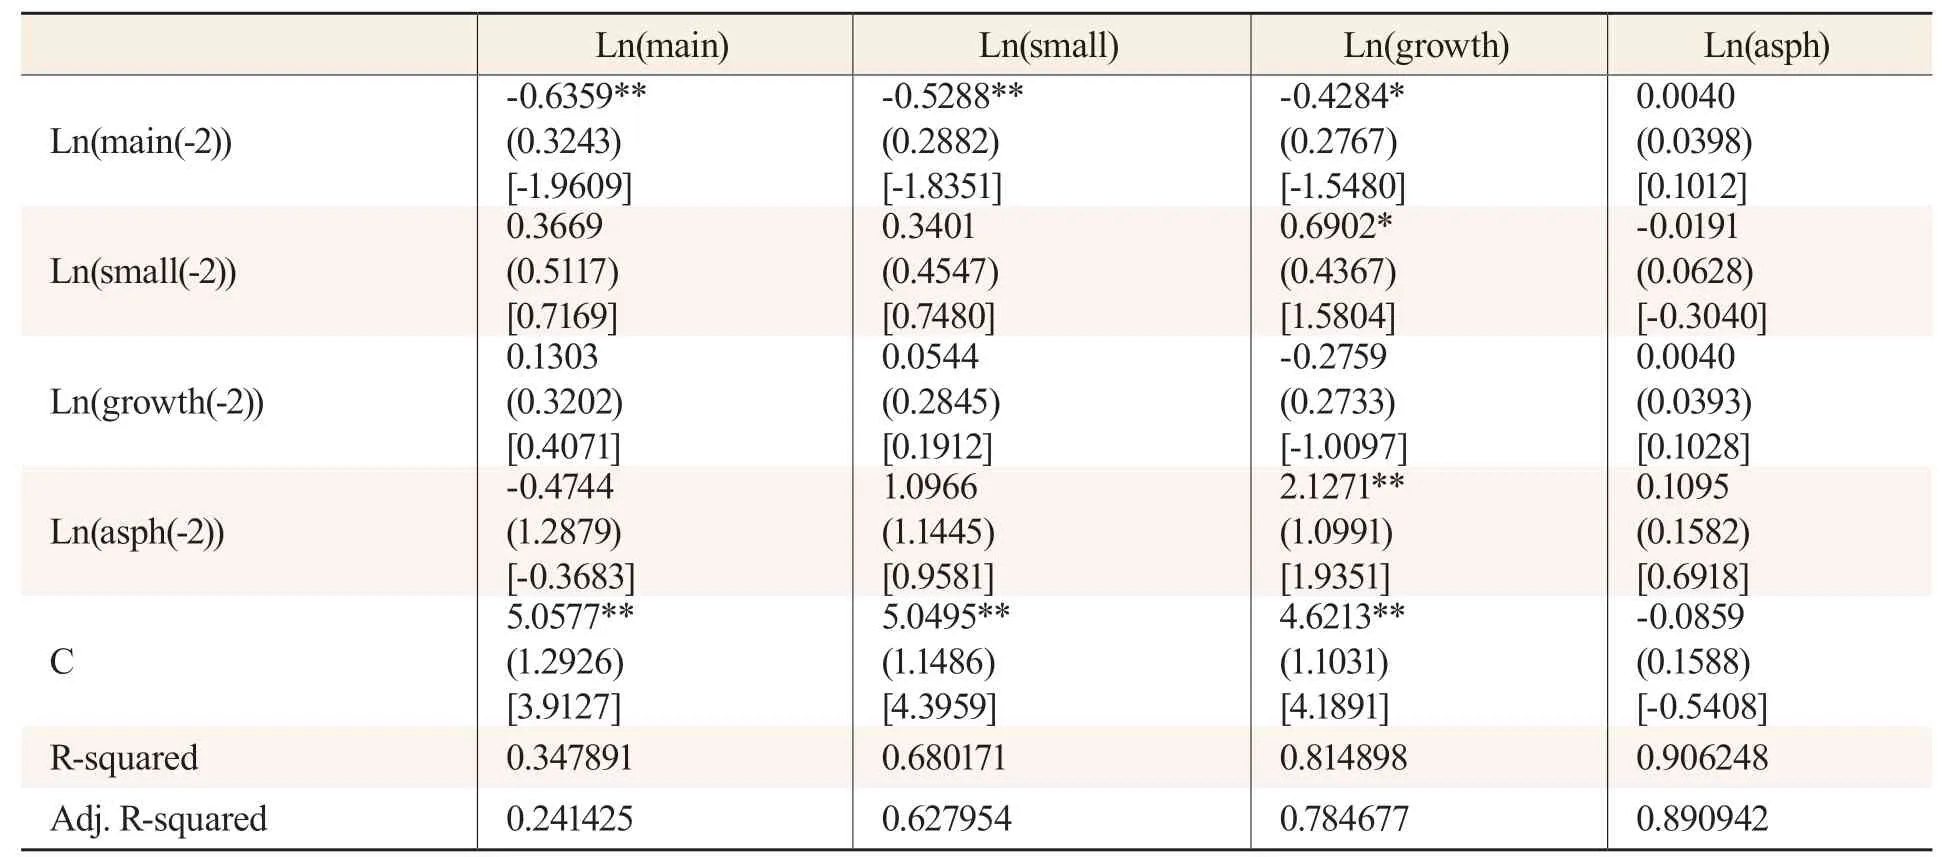
Table 6 Output Results of the Model with a Lag of Two Periods
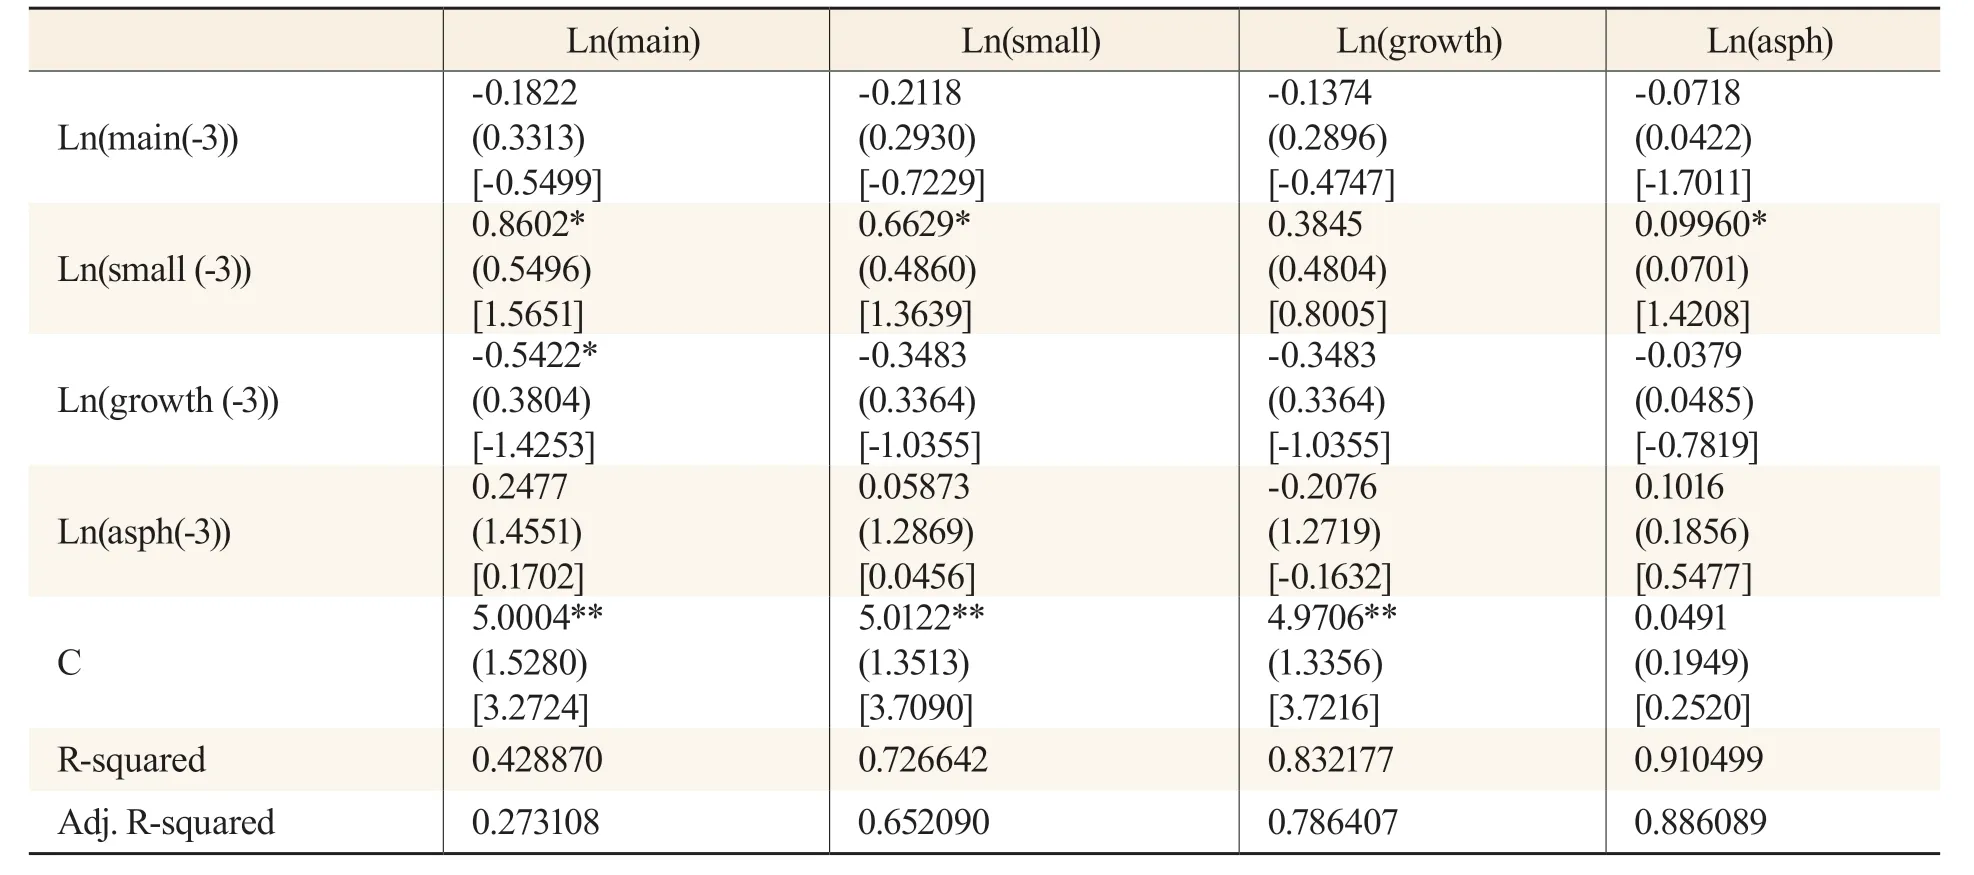
Table 7 Output Results of the Model with Lags of Three Periods
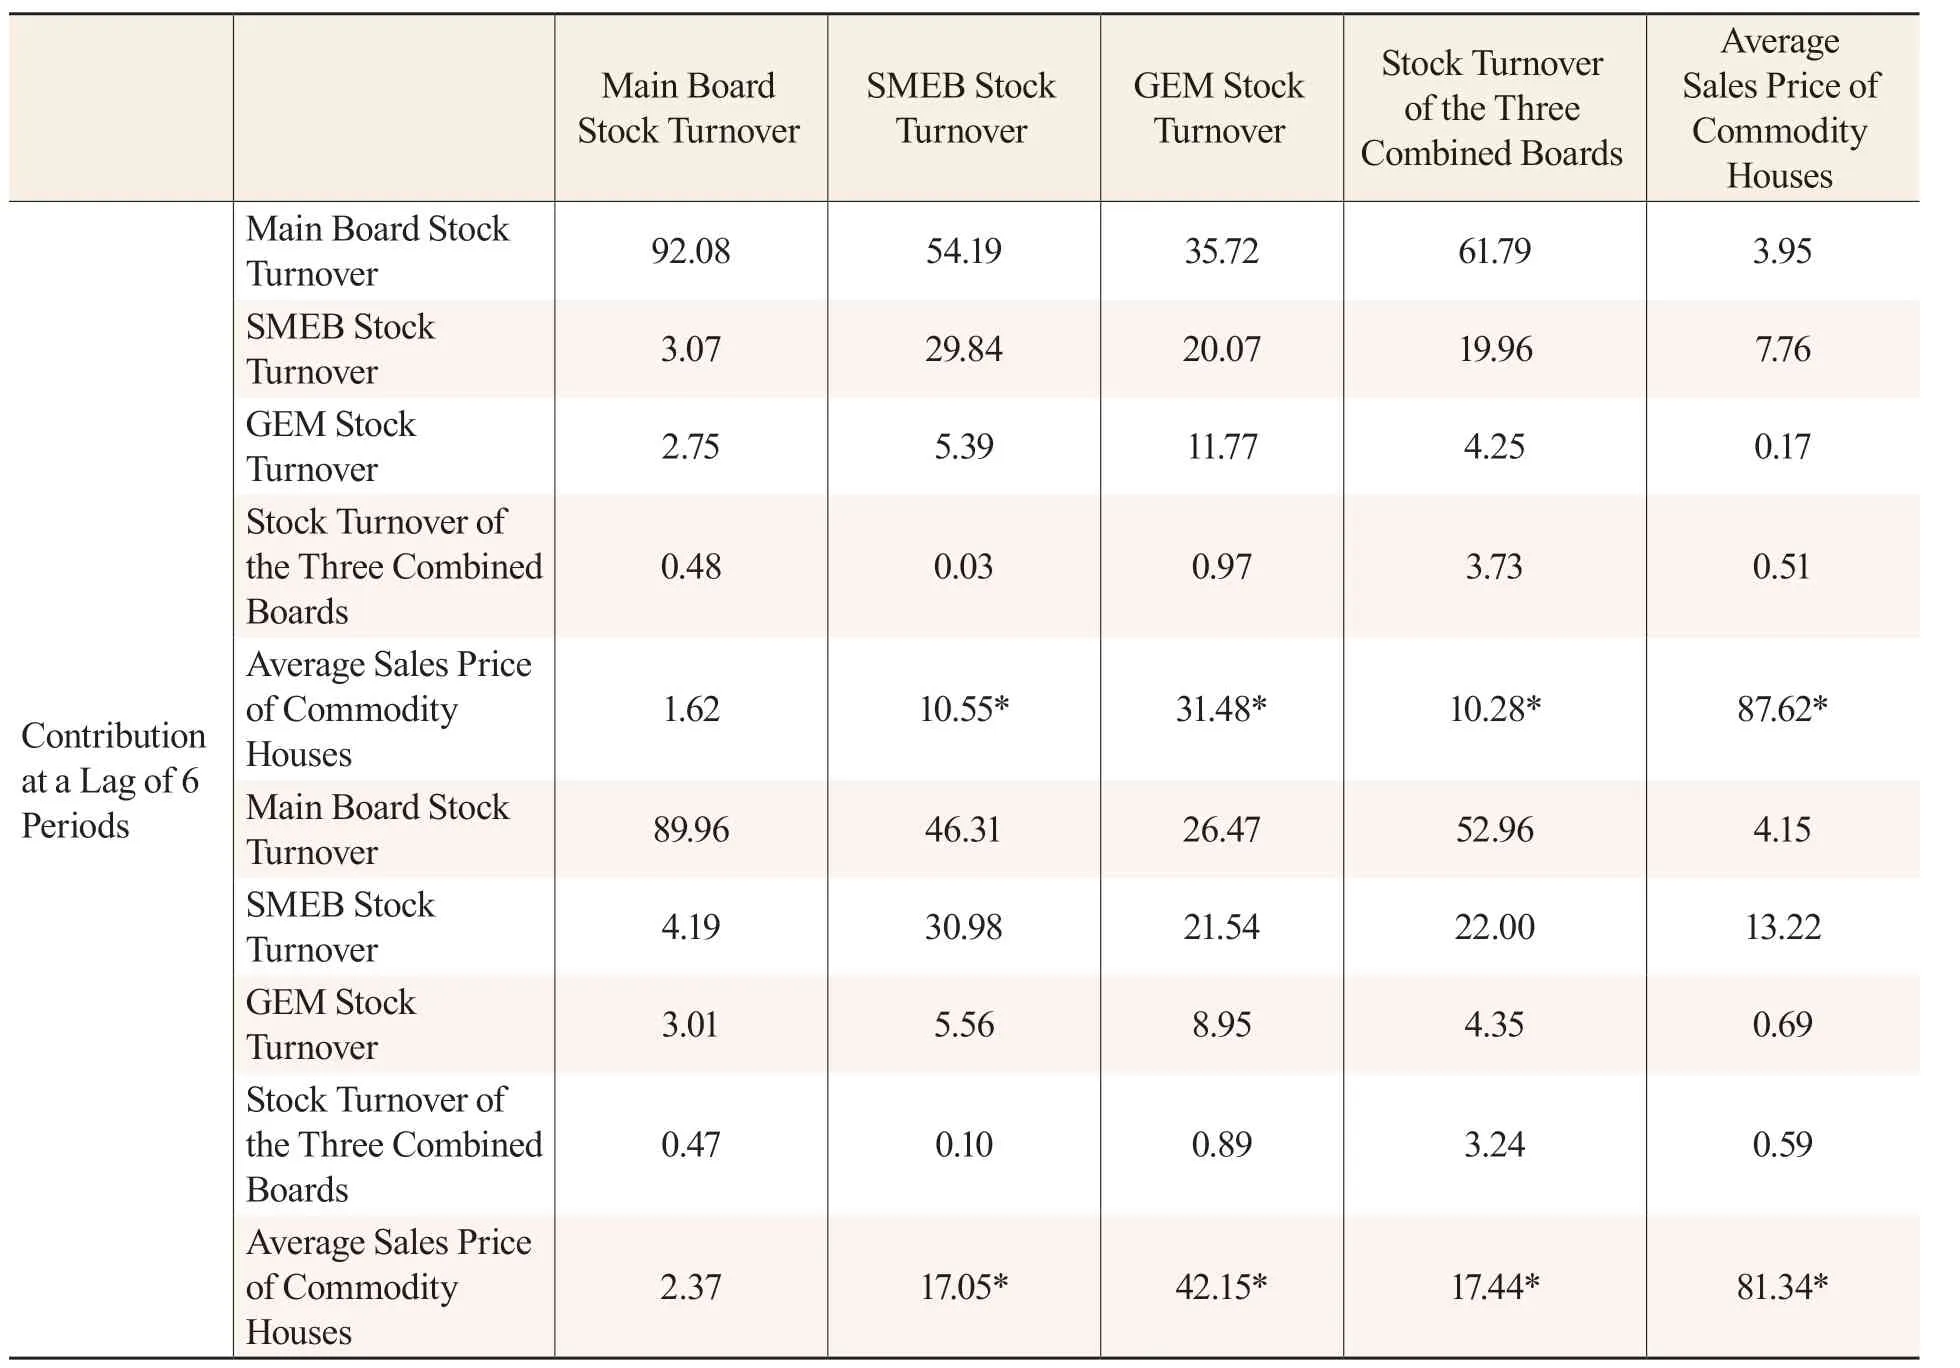
Table 8 Variance Decomposition Results at a Lag of 6 and 12 Periods
The output result of the VAR model.
The coefficients of Ln(asph (-1)) and Ln(main), Ln(small), Ln(growth), Ln(sum), and Ln(asph) are 0.77, 1.34, 2.13, 0.94, and 0.83, respectively, which are all positive. The t-values corresponding to the coefficients are 1.00, 1.96, 3.25, 1.36, and 9.25, respectively, in which the coefficients corresponding to t-values of 1.96, 3.25, 1.36, and 9.25 are significant. The results show that the average sales price of commodity houses in the previous period has a significant positive effect on SMEB and GEM stock turnover and the average sales price of commodity houses in the current period in the SZSE. The output of the model rejects H3: there is an inverse substitution correlation between the real estate market and the stock market. In mature capital markets, there are negative changes between the two markets; in China’s current capital market, however, the substitution effect of this negative relationship does not yet exist.
In order to investigate the impact of different lags of the main board, SMEB and GEM stock turnover, and the average sales price of commodity houses on each current index, VAR(1), VAR(2) and VAR(3) data are set in this study for observing the impact of the lagged indexes on the current indexes.
The coefficients of Ln(asph (-1)) and Ln(main), Ln(small) and Ln(growth) are 0.66, 1.34 and 2.28, respectively, which are positive at the five percent significance level. The t-values corresponding to the coefficients are 0.90, 2.05 and 3.62, respectively, in which the coefficients corresponding to t-values of 2.05 and 3.62 are significant. This indicates that the average sales price of commodity houses in the previous period has a significant positive effect on the SMEB and GEM stock turnover of the SZSE in the current period.
The coefficients of Ln(main(-2)) and Ln(main), Ln(small) and Ln(growth) are -0.47, 1.09 and 2.12, respectively, at the 5 percent significance level, where 1.09 and 2.12 are positive and -0.47 is negative. The t-values corresponding to the coefficients are -0.36, 0.95, and 1.93, respectively, where the coefficient corresponding to t-values of 1.93 is significant. This indicates that the average sales price of commodity houses in the last two periods had a significant positive effect on the GEM stock turnover of the SZSE in the current period.
The coefficients of Ln(asph(-3)) and Ln(main), Ln(small), and Ln(growth) are 0.24, 0.05, and -0.20, respectively, at the 5 percent significance level, where 0.24 and 0.05 are positive, and -0.20 is negative. The t-values corresponding to the coefficients are 0.17, 0.04, and -0.16, respectively, where the corresponding coefficients are not significant. This indicates that the average sales price of commodity houses in the last three periods has no significant effect on the main board, SMEB and GEM stock turnover of the SZSE in the current period.
In summary, regarding the correlation between the average sales price of commodity houses and the main board, SMEB and GEM in the SZSE, this study shows that the average sales price of commodity houses with one period lag has a significant positive correlation with SMEB and GEM, and the average sales price of commodity houses with two periods lag has a significant positive relationship with GEM.
Determination of the VAR model stability.
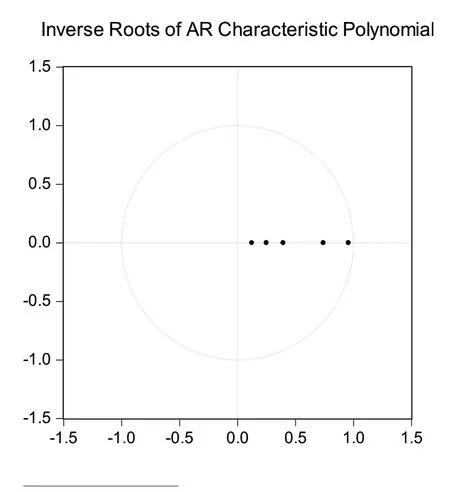
Fig.1 VAR (1) Model Unit Circle Stability Test
The VAR model for Ln(main), Ln(small), Ln(growth), Ln(sum) and Ln(asph) based on the AIC information criterion and SC information criterion are VAR (1). The unit root distribution of the F matrix of the VAR model is examined when lagged to order 1, from which the model stability is determined. Figure 1 indicates all the unit roots fall within the unit circle, so the VAR (1) model is stable.
Model Applications
Impulse Response
In order to further examine and analyze the dynamic relationship between the real estate market and the stock market, we used the impulse response function based on the established VAR model for exploring the response patterns of Ln(main), Ln(small), Ln(growth) and Ln(sum) under the shock of Ln(asph). Figure 2 shows the result of the impulse response function, where the horizontal axis represents the number of lags, and the vertical axis represents the degree of shock response.
Fig. 2 shows that when Ln(asph) is changed, Ln(main), Ln(small), Ln(growth), and Ln(sum) first presents an upward positive shock effect after being shocked by their changes, then reaches a peak at the lag of 1 period where the shock effect is obvious, finally, the shock effect decreases in each period and gradually returns to 0. This indicates that Ln(asph) has an overall positive shock effect on Ln(main), Ln(small), Ln(growth), and Ln(sum) after being shocked by external conditions and there is a certain positive correlation. The result of the impulse response proves H2: housing prices in the lagged period have a significant effect on stock volume in the current period.
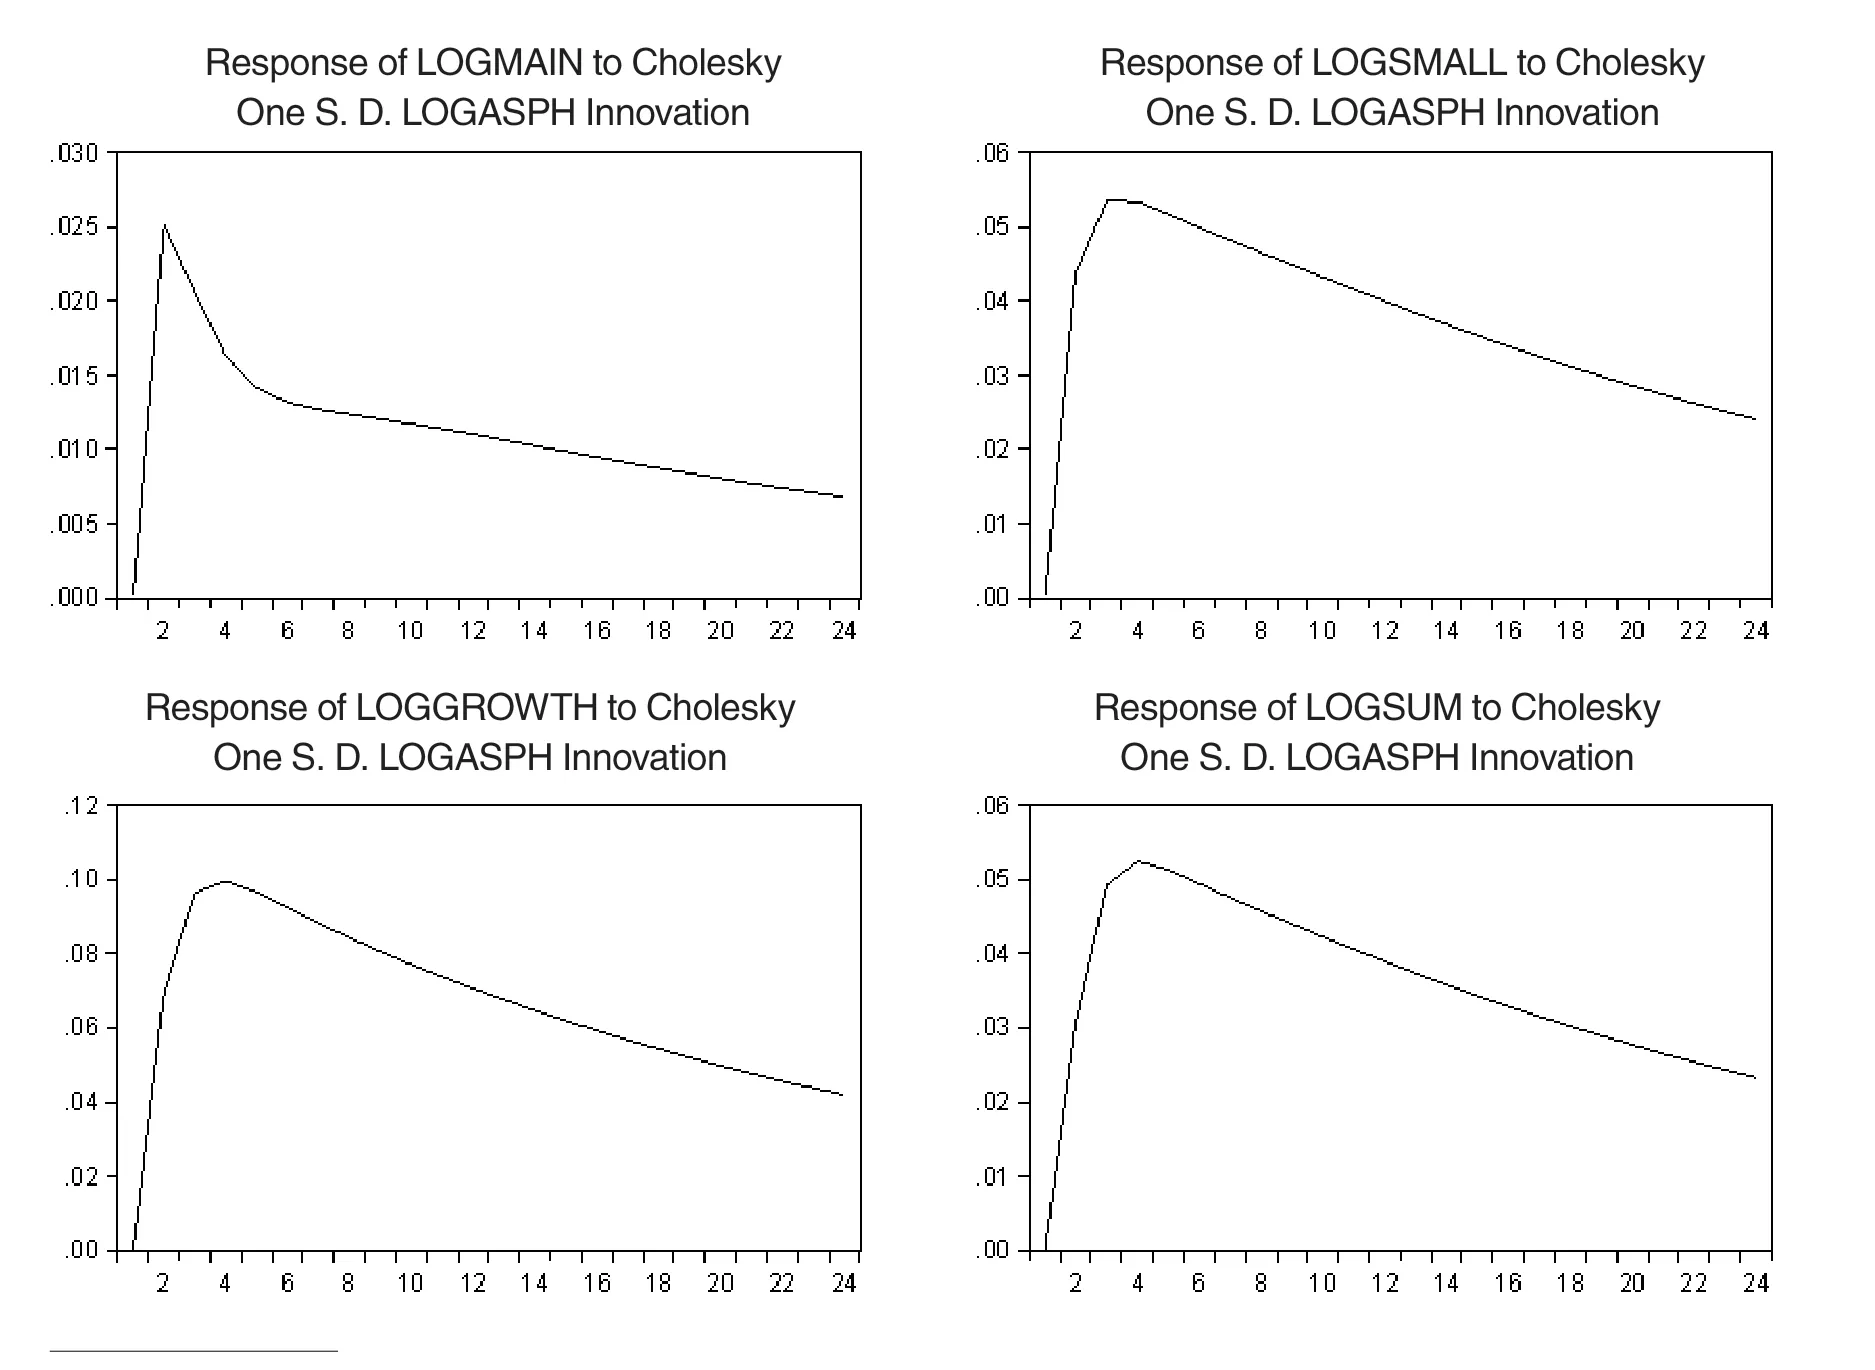
Fig.2 Results of Impulse Response Function
Variance Decomposition
In order to clearly investigate the contribution of the shocks of an endogenous variable to changes in itself and other endogenous variables, and to evaluate the importance of shocks of different endogenous variables, the variance decomposition in this study quantifies the shock of endogenous variables and precisely obtains the contribution of each variable to the effects at different lags.
According to Fig. 3, the effects of the average sales price of commodity houses on the stock turnover of the main board, SMEB, and GEM in the SZSE increases with the number of lagged periods. The effect of the average sales price of commodity houses in the lagged period on the average sales price of commodity houses in the current period decreases gradually. In order to determine the specific contribution of different variables to the effects, the variance decomposition is tabulated for analysis in this study.
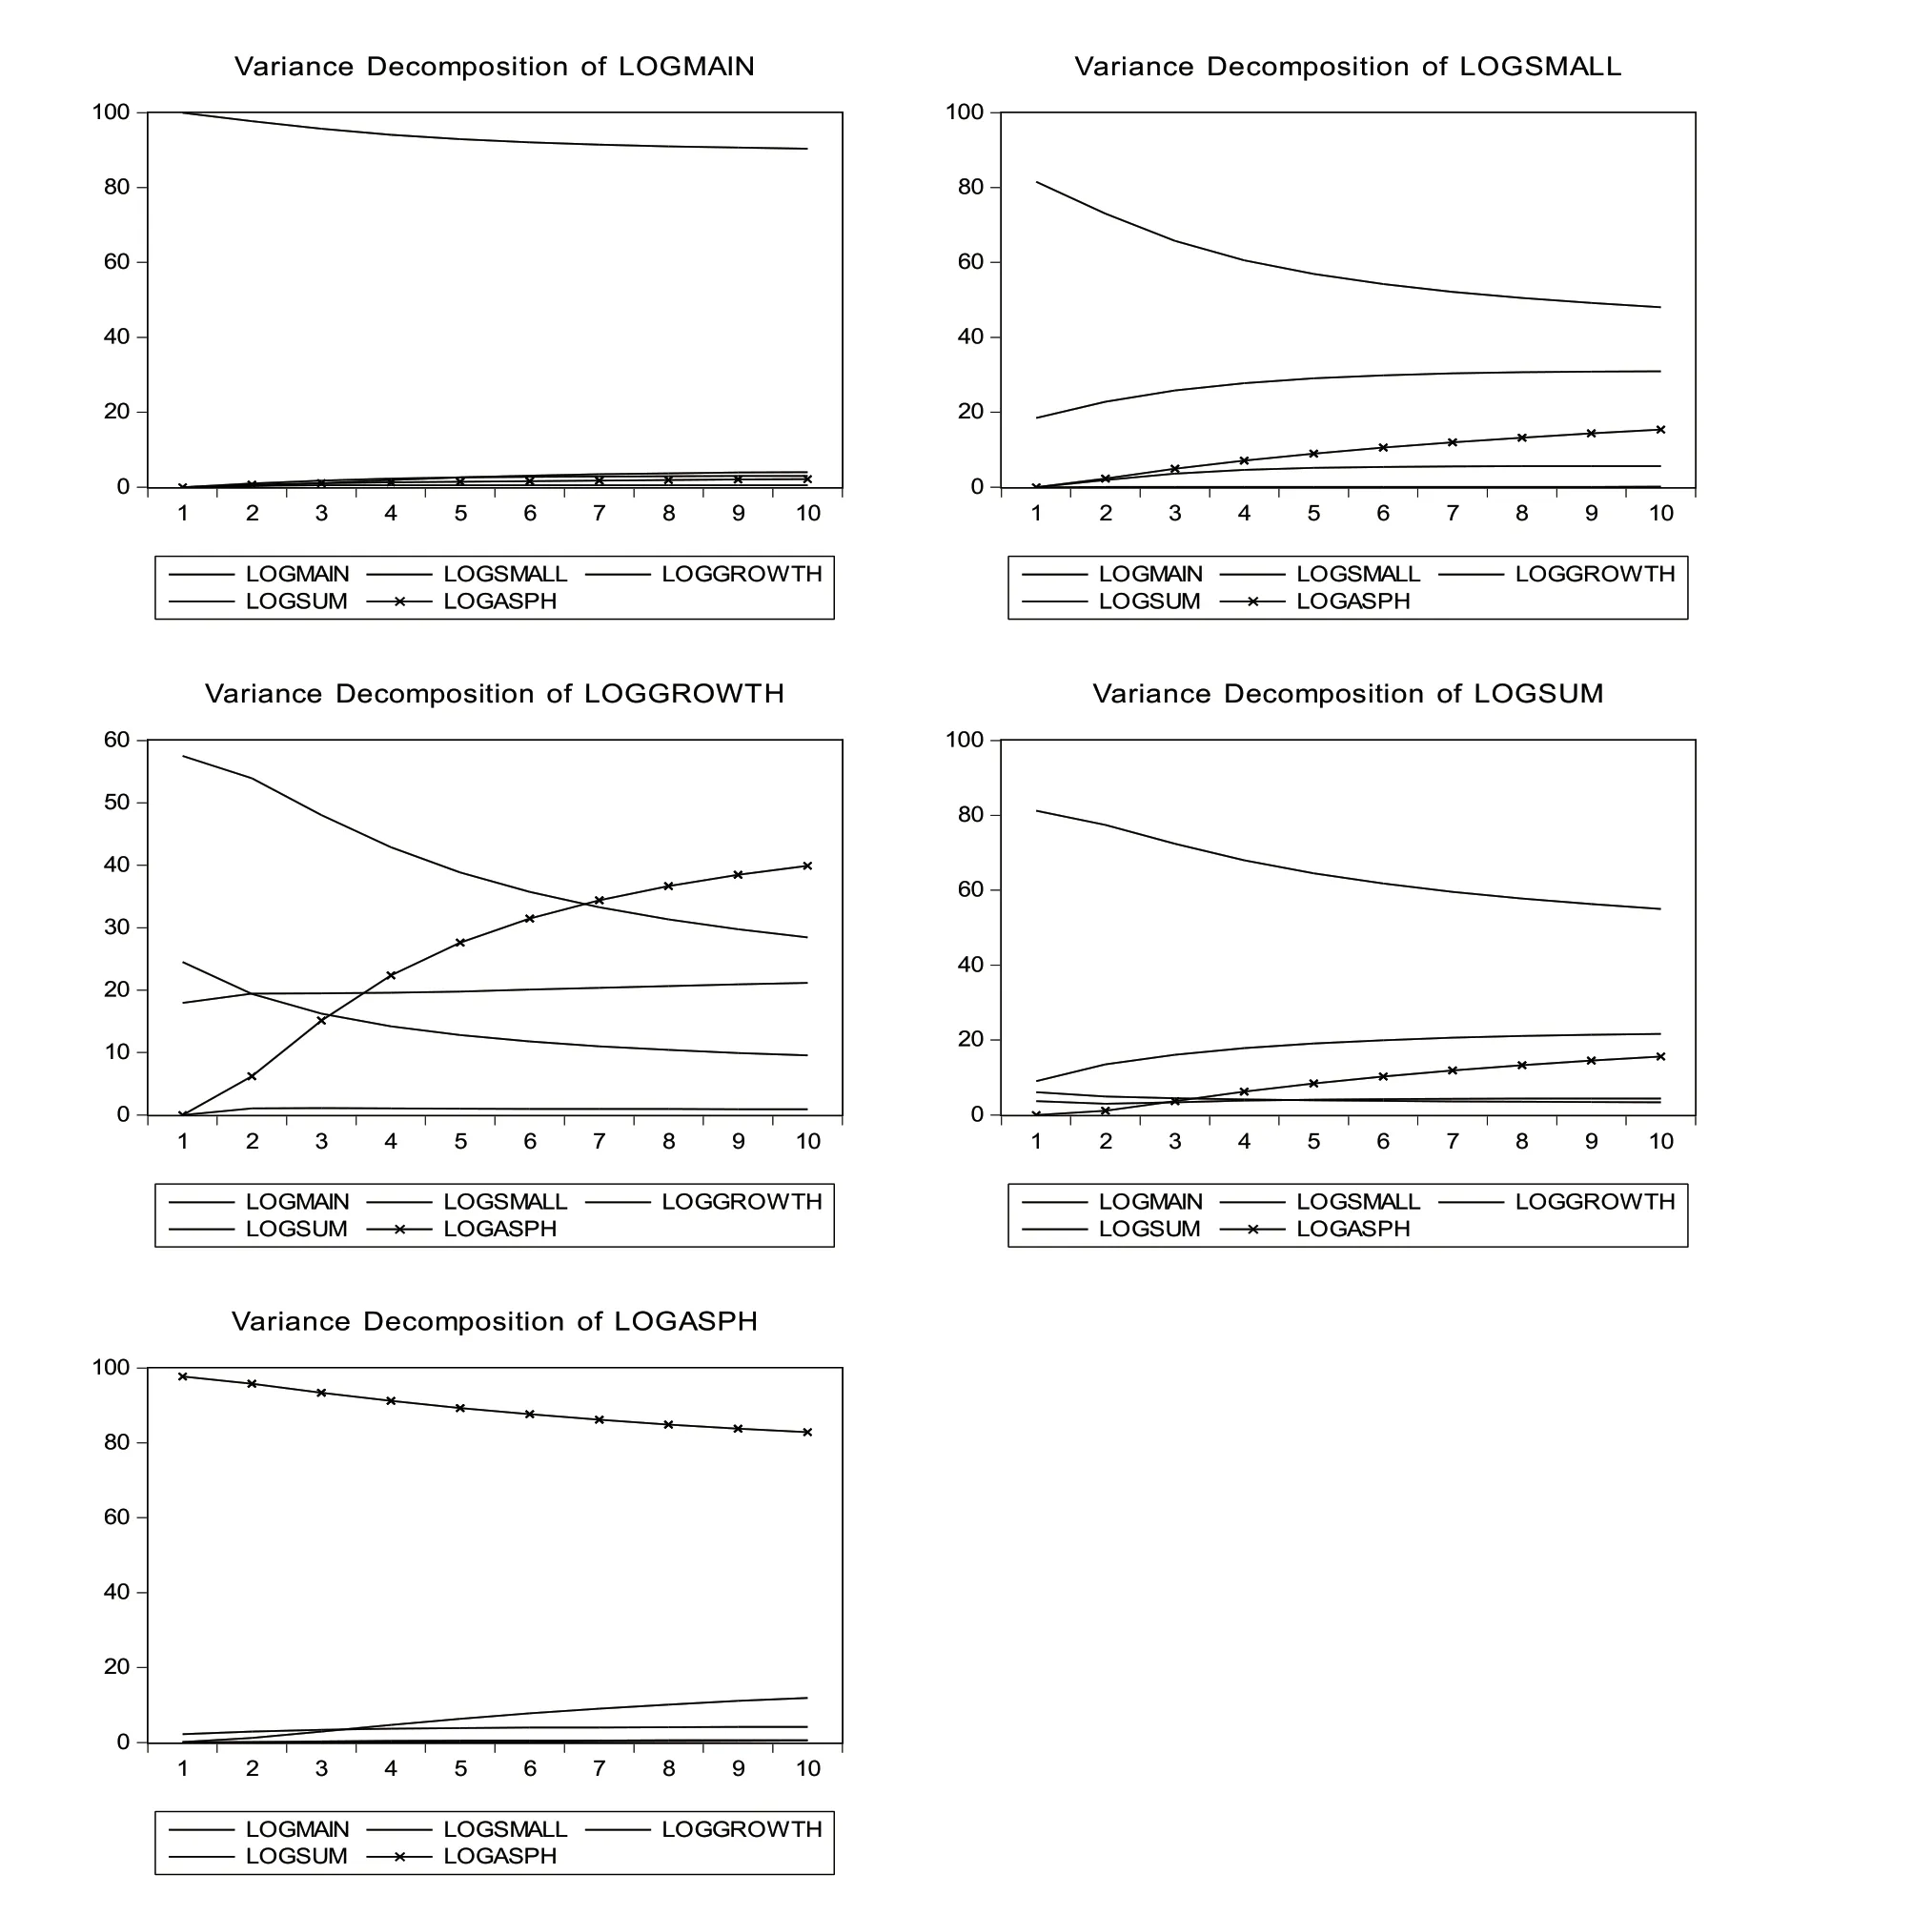
Fig.3 Variance Decomposition Results
According to Table 8, at a lag of six periods, SMEB stock turnover is mainly influenced by itself, the main board stock turnover and average sales price of commodity houses, with the contributions of 29 percent, 54 percent and 10 percent , respectively; GEM stock turnover is mainly influenced by itself, main board, SMEB stock turnover and average sales price of commodity houses, with contributions of 11 percent, 35 percent, 20 percent and 31 percent, respectively. At a lag of 12 periods, SMEB stock turnover is mainly influenced by itself, main board stock turnover and average sales price of commodity houses, with contributions of 30 percent, 46 percent and 17 percent, respectively; GEM stock turnover is mainly influenced by main board, SMEB stock turnover and average sales price of commodity houses, with contributions of 26 percent, 21 percent and 42 percent, respectively.
In summary, the average sales price of commodity houses at lags of six and 12 periods has a greater effect on the SMEB and GEM stock turnover in the current period, and this effect also intensifies with an increase of the lagged period. The variance decomposition indicates that the real estate market has a positive effect on the stock market.
Conclusions and Suggestions
Conclusions
In this study, the monthly data of the average sales price of commodity houses and stock turnover in the Shenzhen Stock Exchange from January 2016 to December 2020 were selected to establish a VAR model, and an empirical analysis was made using the Granger causality test, impulse response and variance decomposition, and the correlation between the stock market and the real estate market was investigated. We found that there is a significant positive correlation between the stock market and the real estate market. We also found that the real estate market price is the one-way Granger cause for the stock market turnover, and the average sales price of commodity houses in the lagged period has a significant positive effect on the SME and GEM stock turnover in the Shenzhen Stock Exchange; but conversely, this positive effect is not significant.
According to the wealth effect and household asset allocation theory, the rise in housing prices promotes wealth growth, and the wealth growth contributes to residents’ investments in the stock market. When real estate prices rise, investors believe that future real estate prices will also rise, so they have the expectation of wealth growth and thus increase their investments in the stock market. Due to the large proportion of small and medium-sized investors in the SZSE, short holding periods, poor financial literacy, obvious speculative mentalities, and irrational factors account for a large part of their investment behavior when part of their funds flow into the stock market. They profit from short-term bid-ask spreads, rather than long-term holdings and regular dividends because they are optimistic about the growth prospects. Therefore, they mostly choose stocks listed on the GEM and SMEB. These stocks have greater volatility that can satisfy the speculative mindset of investors and fulfill their expectations.
Based on theoretical and empirical studies, housing prices in the lagged period can affect the stock turnover in the current period. Housing price fluctuations are one of the effective signals of China’s economic fluctuations, and the housing prices in the lagged period can also predict the fluctuations of China’s financial markets. The results show that when housing prices fluctuate, money flow changes and positively affects the stock market. However, the transmission of this effect is time-dependent, with the effect reaching its strongest level after approximately one quarter and then slowly weakening. This suggests that the lag effect is manifested in the fact that it takes some time for the effect of the housing price fluctuation to be reflected in the stock market.
The real estate market has played an indispensable role in the national economy. Based on the contribution of real estate to GDP, China’s macroeconomic development is inseparable from the support of the real estate markets. The rise in housing prices provides a good reserve of wealth for China’s capital markets and facilitates the transition from direct finance to indirect finance in China. The rise in housing prices will also have a positive impact on the consumption of urban residents through the wealth effect.
Suggestions
Our study and analysis of the correlation between the two markets are not only beneficial for individual investors to build an effective asset portfolio and make a reasonable allocation of assets but also for the government to formulate relevant economic policies. In this way, financial risks and real estate bubbles can be controlled, and the national economy can be stimulated.
Suggestions for the development of the real estate market.
At present, there are still some serious problems in China’s real estate industry, which affects its stock market and even its national economy. Therefore, strong macro regulations should be adopted for the real estate markets.
First, the government should formulate policies and measures according to local conditions. With the intensification of urbanization, there is still a greater demand for real estate. Due to differences in economy, geography and population, the real estate demand varies from city to city. Furthermore, the government should give monetary and credit support to people with immediate real estate needs and set long-term effective macro policies by focusing on areas such as urbanization construction. In addition, the government should formulate reasonable purchase restriction policies for the real estate market and treat real estate more as fixed assets, thereby reducing “housing speculation” and minimizing the housing problems.
Second, the government should establish and improve the housing security system that incorporates affordable housing, low-cost housing and public rental housing to provide effective housing security for the people. Also, the government may effectively flow the accumulated funds in real estate to other areas for increased investment returns. With a sound housing security system, the people with real estate can live in a more secure manner, and the people without any real estate may afford their own houses.
Suggestions for the development of the stock market.
Studies have found that the stock market can have an impact on the real estate market, and the money flow in the stock market can also affect the real economy. Therefore, it is necessary to promote the national economy by improving the stock market.
First, the competent departments should establish sound laws and regulations. For listed companies on different boards, the competent departments should tighten listing rules and conditions, monitor the growth of listed companies in real time, improve their quality, and resolutely crack down on telling lies and making false accounts; build a perfect delisting system, so that listed companies may have a sense of crisis in their business process; strengthen the sense of responsibility of issuers and intermediaries, and effectively protect small and medium-sized entrepreneurs.
Second, the government should strengthen the education of small and medium investors. Since individual investors are the majority in the securities market and have poor financial awareness, there is a need to enhance the education for small and medium-sized investors, to encourage them to invest more rationally and build a reasonable portfolio of assets. Besides, investors should be encouraged to know about the culture and operations of the companies they invest in, so that their sense of responsibility as “shareholders” is increased, and long-term returns are valued over short-term speculation.
Suggestions for the Development of the Two Markets.
According to the results of our analysis and the result of our VAR model, there is a significant positive correlation between the real estate market and the stock market. Therefore, the linkage between the two markets should be considered in macro regulations, and the impact on the other market should be considered when regulating the other.
First, government regulation tools should be diversified. At present, the Chinese government mainly regulates real estate in terms of price and demand. According to the different regions, the government should fully consider the influence factors of the real estate market price changes on the stock market and balance the development of the stock market and the real estate market through diversified ways and channels, instead of viewing stocks and real estate as unrelated commodities.
Second, investors should exercise prudent judgment in establishing reasonable portfolios of assets. Small and medium-sized investors, who are the majority of investors, prefer speculation due to their inadequate financial literacy. To relieve this issue, it is necessary to build reasonable portfolios for maintaining a stable stock market and increasing investor returns. As investment products, both real estate and stocks should be understood for their correlation for reasonable allocation of assets and maximized investor returns.
Finally, investor channels should be broadened. Investors should not limit themselves to the two markets when investing their surplus funds. This is because the correlation between the two markets can lead to risk pooling and the formation of bubbles. Therefore, an increase of investment products can effectively disperse risks, increase their own benefits, and boost the national economy, thereby enhancing the stability of the national financial markets and avoiding financial crises.
 Contemporary Social Sciences2022年4期
- Contemporary Social Sciences的其它文章
- Determination of Relationships and Allocation of Responsibilities—Taking the Adjudication of Household Service Contract Disputes as an Example
- A Brief Analysis of Competitive Sports Depicted on the Portrait Bricks and Stones of the Han Dynasty
- Tri-Engine Structure and Industrial Composition of Cultural Productivity
- Full Empowerment and the Participatory Governance in Rural Communities: A Comparative Study Based on Two Cases
- Measurement and Spatial Difference Analysis of Innovation-Driven Urban Development Levels in Sichuan Province
- Research on the Impact of the Pension Insurance System on the Optimization of the Consumption Structure of Rural Families