
Mitochondrial phylogenomics provides insights into the phylogeny and evolution of spiders (Arthropoda:Araneae)
2022-08-05 10:42:46MinLiWenTingChenQiLinZhangMinLiuChengWeiXingYaCaoFangZhenLuoMingLongYuan1
Zoological Research 2022年4期
Min Li ,Wen-Ting Chen ,Qi-Lin Zhang ,Min Liu ,Cheng-Wei Xing ,Ya Cao ,Fang-Zhen Luo,Ming-Long Yuan1,,*
1 State Key Laboratory of Grassland Agro-Ecosystems, Lanzhou University, Lanzhou, Gansu 730020, China
2 College of Pastoral Agriculture Science and Technology, Lanzhou University, Lanzhou, Gansu 730020, China
3 National Demonstration Center for Experimental Grassland Science Education, Lanzhou University, Lanzhou, Gansu 730020, China
4 Faculty of Life Science and Technology, Kunming University of Science and Technology, Kunming, Yunnan 650500, China
5 Lanzhou University Second Hospital, Lanzhou University, Lanzhou, Gansu 730030, China
ABSTRACT Spiders are among the most varied terrestrial predators,with highly diverse morphology,ecology,and behavior.Morphological and molecular data have greatly contributed to advances in the phylogeny and evolutionary dynamics of spiders.Here,we performed comprehensive mitochondrial phylogenomics analysis on 78 mitochondrial genomes (mitogenomes) representing 29 families;of these,23 species from eight families were newly generated.Mesothelae retained the same gene arrangement as the arthropod ancestor (Limulus polyphemus),while Opisthothelae showed extensive rearrangement,with 12 rearrangement types in transfer RNAs (tRNAs) and control region.Most spider tRNAs were extremely truncated and lacked typical dihydrouridine or TΨC arms,showing high tRNA structural diversity;in particular,trnS1 exhibited anticodon diversity across the phylogeny.The evolutionary rates of mitochondrial genes were potentially associated with gene rearrangement or truncated tRNAs.Both mitogenomic sequences and rearrangements possessed phylogenetic characteristics,providing a robust backbone for spider phylogeny,as previously reported.The monophyly of suborder,infraorder,retrolateral tibial apophysis clade,and families (except for Pisauridae)was separately supported,and high-level relationships were resolved as (Mesothelae,(Mygalomorphae,(Entelegynae,(Synspermiata,Hypochilidae)))).The phylogenetic positions of several families were also resolved (e.g.,Eresidae,Oecobiidae and Titanoecidae).Two reconstructions of ancestral web type obtained almost identical results,indicating that the common ancestor of spiders likely foraged using a silk-lined burrow.This study,the largest mitochondrial phylogenomics analysis of spiders to date,highlights the usefulness of mitogenomic data not only for providing efficient phylogenetic signals for spider phylogeny,but alsofor characterizing trait diversification in spiderevolution.
Keywords:Spiders; Mitochondrial genome;Gene rearrangement;Truncated tRNAs;Trait evolution;Phylogenomics
INTRODUCTION
Spiders (Order:Araneae) are the second largest group within Arachnida,with more than 49 906 described species worldwide classified into 4 239 genera from 130 families(World Spider Catalog,2022).Informed by the earliest fossil record ofAttercopus fimbriunguis(Order:Uraraneida),spiders are an ancient group of arthropods,generally assumed to have emerged in the Middle Devonian period (374–380 million years ago (Ma)) (Magalhaes et al.,2020;Selden et al.,1991),or at least in the Carboniferous period (Kallal et al.,2021).Spiders are highly diverse in morphology (e.g.,size,color,spinnerets,silk glands,and cheliceral venom glands)(Coddington &Levi,1991;Dimitrov &Hormiga,2021;Garrison et al.,2016),ecology (e.g.,habitat,lifestyle,and feeding characteristics) (Toft,2013),and behavior (e.g.,silk production,web building,and toxin production) (King &Hardy,2013;Vollrath &Selden,2007).These prominent characteristics of spiders have been of interest to scientists for many decades (Dimitrov &Hormiga,2021;Fernández et al.,2018;Garrison et al.,2016;Kulkarni et al.,2021;Wheeler et al.,2017).
As one of the most important generalist predatory groups in terrestrial ecosystems,spiders fulfill essential ecological roles(Blackledge et al.,2009;Dimitrov &Hormiga,2021;Garrison et al.,2016).Furthermore,many species (e.g.,PardosaandThomisus) are important for natural pest control in various habitats (e.g.,wheat,rice,and cotton fields).The predatory success of spiders is largely attributed to their multiple uses of silk and their ability to employ venom to subdue prey(Eberhard,2020;Greco &Pugno,2021;King &Hardy 2013;Ludwig et al.,2018;Vollrath &Selden,2007).All spiders can produce silk via spinnerets (Dimitrov &Hormiga,2021),but not all spiders utilize silk to build webs for predation.Silk webs show considerable diversity in architecture and silk type (e.g.,orb webs spun by Araneoidea,brush sheets spun by Agelenidae,sheet webs spun by Linyphiidae,and cobwebs spun by Theridiidae) (Blackledge et al.,2009,2011;Fernández et al.,2018;Garrison et al.,2016;Shao &Li,2018).However,the evolutionary process underlying web diversity within the order Araneae remains unclear.
Phylogenetic analyses of Araneae have been conducted at various taxonomic levels using morphological and molecular data (e.g.,Dimitrov &Hormiga,2021;Fernández et al.,2018;Garrison et al.,2016;Kulkarni et al.,2021;Wheeler et al.,2017).Morphological phylogeny consistently suggests that all spiders (Araneae) are comprised of two suborders:Mesothelae (i.e.,primitive spiders) and Opisthothelae (i.e.,true spiders,further classified into the two infraorders Mygalomorphae and Araneomorphae) (Coddington,2005;Coddington &Levi,1991;Haupt,2005;Platnick &Gertsch,1976).This suborder/infraorder-level phylogeny has also been tested using molecular data,including multiple molecular markers (Blackledge et al.,2009;Dimitrov et al.,2012;Wheeler et al.,2017),mitogenomic data (Kumar et al.,2020;Tyagi et al.,2020),and transcriptome data (Fernández et al.,2018;Garrison et al.,2016).However,the monophyly and phylogenetic relationships of certain spider groups within the infraorders (e.g.,retrolateral tibial apophysis (RTA) clade(Coddington,2005;Dimitrov et al.,2017;Hormiga &Griswold,2014;Magalhaes et al.,2020),Araneoidea (Dimitrov et al.,2017;Hormiga &Griswold,2014),and Eresoidea(Coddington,2005;Hormiga &Griswold,2014;Kulkarni et al.,2021;Wheeler et al.,2017) are still not well resolved and remain controversial among studies.
Metazoan mitochondrial genomes (mitogenomes) are typically circular double-stranded molecules,~15 kb in size and encoding 37 genes,including 13 protein-coding genes(PCGs),two ribosomal RNA (rRNA) genes,and 22 transfer RNA (tRNA) genes (Bernt et al.,2013a;Cameron,2014).Animal mitogenomes have been widely employed for studies on molecular evolution,phylogenetics,and population genetics (Arribas et al.,2020;Cameron,2014;Tyagi et al.,2020).Since the sequencing of the first spider mitogenome(Habronattus oregonensis) (Masta &Boore,2004),55 complete mitogenomes from 40 genera belonging to 21 families of Araneae have deposited in GenBank (as of January 2021).These sequenced mitogenomes preliminarily exhibited two characteristics,i.e.,severely truncated tRNAs(Masta &Boore,2008;Pons et al.,2019) and frequent gene rearrangements (Li et al.,2021;Tyagi et al.,2020).However,these characteristics have not been comprehensively analyzed,primarily due to the limited number of sequenced spider mitogenomes.
In this study,the mitogenomes of 23 spider species from 16 families of Araneae were newly sequenced,eight families of which were reported for the first time.In combination with the 55 other spider mitogenomes retrieved from GenBank,phylogenetic analyses were conducted to compile the largest mitochondrial phylogeny of spiders to date.Moreover,truncated tRNAs and mitochondrial gene rearrangements were also detected,and detailed evolutionary analyses among different lineages were performed.The evolutionary processes of web design in Araneae were further explored.This study tested:(i) whether mitogenomic data can provide efficient phylogenetic signals for spiders;(ii) whether evolutionary rates of mitochondrial genes are related to gene rearrangements and/or truncated tRNAs;and (iii) what is the evolutionary process of web design diversification in spiders.Thus,this study provides new insights into spider evolution from a mitogenomic perspective.
MATERIALS AND METHODS
Sampling and DNA extraction
Adult specimens of 23 spider species from 16 families in seven localities of China were sampled.All taxa were identified by Min Li and Fang-Zhen Luo according to the morphological characteristics of each spider species.The samples used did not involve in any endangered or protected species.Detailed information on sampling,voucher specimen code,and identification is provided in Supplementary Table S1.Voucher specimens were deposited in the College of Pastoral Agriculture Science and Technology,Lanzhou University,Lanzhou,China.All samples were stored in absolute ethyl alcohol and preserved at–80 °C until DNA extraction.Total genomic DNA was extracted from the legs of a single spider specimen using a DNeasy Tissue Kit (Qiagen,Germany) following the manufacturer’s protocols.Quality of the extracted DNA was assessed using 1.2% agarose gel electrophoresis and spectrophotometry using a NanoDrop ND-1000 (Thermo Scientific,USA).
Sequencing,assembly,and annotation
The mitogenome of each spider species was sequenced on a NovaSeq sequencer (2×150 bp) by Wuhan Benagen (China).SOAPnuke v2.1.0 (Chen et al.,2018) was used to remove low-quality reads,including reads with a Phred quality score cutoff of Q20,adapter-contaminated reads,reads with more than 5% N bases,and repeated reads introduced by repeated polymerase chain reaction (PCR).High-quality reads were used to assemble the spider mitogenomes using SPAdes v3.13.0 (Dierckxsens et al.,2017).
Annotations of the 23 newly sequenced spider mitogenomes were conducted using the MITOS web-server(http://mitos2.bioinf.uni-leipzig.de) (Bernt et al.,2013b) to determine the locations of PCGs and rRNAs.To ensure accuracy of gene boundaries,each of the 13 PCGs and two rRNAs of the 78 spider species were aligned individually using MUSCLE,implemented in MEGA X (Kumar et al.,2018).The tRNAs were first predicted according to their cloverleaf secondary structures using tRNAscan-SE (Chan &Lowe,2019).However,most tRNAs could not be detected by tRNAscan-SE and were further identified through sequence similarity alignment using MEGA X (Kumar et al.,2018).The main principle of tRNA annotation was to minimize both the spacing and overlap between genes as much as possible while ensuring the cloverleaf secondary structure.For the 13 families containing more than two species,the sequences of each tRNA from the same family were aligned.For the remaining 16 families (except Atypidae) containing only one species,the tRNAs of all spider species were aligned together.Finally,the tRNA sequences of 77 species were aligned for each tRNA.All mitogenomes of the 23 spider species newly sequenced in this study were submitted to GenBank (accession Nos.MW776432–MW776438,MW822556–MW822557,and MW832845–MW832858).The mitogenomes of three spider species available from GenBank were re-annotated (Uroctea compactilis(MH752074),Loxosceles rufescens(MK257773),andPisaura bicornis(MN296112)) due to the lack of annotation information.
Phylogenetic analysis
Complete or nearly complete mitogenome sequences of the 78 spider species from 29 families were used for phylogenetic analysis (Supplementary Table S2).Twelve species from five other orders within Arachnida (i.e.,Uropygi,Amblypygi,Solifugae,Opiliones,and Ricinulei) were included andLimulus polyphemusin Xiphosura was used as an outgroup.For each PCG,rrnLandrrnSwere aligned using MAFFT,as described previously (Yuan et al.,2016).Poorly aligned positions and divergent sequences were removed using the GBlocks Server(http://molevol.cmima.csic.es/castresana/Gblocks_server.html).
Four mitogenomic datasets (Supplementary Data S1) were generated for phylogenetic analyses:(1) 13P123,nucleotide sequences for all three codon positions of 13 PCGs with 10 413 nucleotides (nt);(2) 13P123AA,inferred amino acid sequences of 13 PCGs with 3 471 amino acids;(3)13P123Degen,with 10 413 nt,and (4) 13P123RNA,including 13P123 and nucleotide sequences of two rRNA genes with 11 856 nt.The 13P123Degen dataset was generated using Degen script (Regier et al.,2010;Zwick et al.,2012) to convert each codon from the 13P123 dataset into a"degenerated" codon.A substitution saturation test was performed for each nucleic dataset using DABME v6.4.20(Xia,2013).Only the third codon position showed substantial substitution saturation under 16 and 32 operational taxonomic unit subsamples (Supplementary Table S3).The optimal partitioning schemes and corresponding nucleotide substitution models for each dataset were determined using PartitionFinder 2 (Lanfear et al.,2017).The best-fit partitioning schemes and corresponding evolutionary models (see Supplementary Table S4) were utilized in the following phylogenetic analyses.
Phylogenetic analyses were conducted for each dataset using both Bayesian inference (BI) and maximum-likelihood(ML) methods with the CIPRES Science Gateway v3.3 (Miller et al.,2010b).ML analyses were performed with RAxMLHPC2 on XSEDE v8.0.24 (Stamatakis,2014) under the GTRGAMMA model,using 1 000 bootstraps (BS).BI analyses were performed using MrBayes v3.2.2 (Ronquist et al.,2012),with 1×10⁷generations and sampling every 100 generations.Stationarity was considered to have been reached when the estimated sample size value was over 100 and when the potential scale reduction factor approached 1.0 (Ronquist et al.,2012).After removing the first 25% of samples as burn-in,posterior probability values were calculated for a consensus tree.
A topology test was conducted using the IQ-TREE webserver (http://iqtree.cibiv.univie.ac.at/) (Trifinopoulos et al.,2016) to assess incongruity among tree topologies obtained from the four datasets and two analytical methods.For each dataset,four tests were performed with 1 000 replicates,including the Shimodaira-Hasegawa (Shimodaira &Hasegawa,1999),Kishino-Hasegawa (Kishino &Hasegawa,1989),expected-likelihood weight (Strimmer &Rambaut,2002),and approximately unbiased tests (Shimodaira,2002).
Evolutionary rate of mitochondrial genes
For each PCG,the pairwise synonymous (dS) and nonsynonymous (dN) evolutionary rates were calculated between the outgroup and all included spider species using PAML v4.9 (Yang,2007).Based on the mitochondrial phylogenetic tree (see Results),Mastigoproctus giganteus(Uropygi),which is the most closely related to Arachnida,was selected as the outgroup.For this,cleandata=0 was set for treating the alignment gap as ambiguous characters,model=0 was set for a singledN/dSvalue across all branches,and runmode=–2 was set for pairwise comparisons ofdNanddS.Default settings were used for all other parameters.Pairwise genetic distances for each of the 24 RNA genes were calculated with the Jukes-Cantor model implemented in MEGA X (Kumar et al.,2018),using the outgroup speciesMastigoproctus giganteusas a reference.
Gene arrangement analysis
Tyagi et al.(2020) recently conducted gene arrangement analysis and identified 14 gene arrangement modes in 44 spider species.However,the number of gene rearrangement modes was overestimated due to incorrect annotations of specific tRNAs in certain spider mitogenomes available in GenBank (Supplementary Table S5).Therefore,the positions and orientations of all tRNAs of the 55 spider mitogenomes retrieved from GenBank were re-annotated and 18 tRNAs from 14 spider species were found to have been incorrectly annotated (Supplementary Table S5).
Gene arrangement analyses for 77 spider species in 28 families were conducted using two independent methods,i.e.,CREx (http://pacosy.informatik.uni-leipzig.de/crex) (Bernt et al.,2007) and qMGR (Zhang et al.,2020).Atypus largosaccatus(Atypidae) was excluded as it lacked seven mitochondrial genes (i.e.,trnM,trnW,trnV,trnQ,rrnL,rrnS,andnad2).Compared to a reference gene arrangement,qMGR accumulates changes in two neighbor genes to calculate the rearrangement score (RS) of different arrangement modes and rearrangement frequency (RF) of every gene in the given mitogenome (Zhang et al.,2020).Here,based on the frequency of rearrangement of each gene,qMGR was used to detect the conserved gene set and highfrequency rearrangement segments in each mitogenome(Zhang et al.,2020).CREx was used for pair-wise comparisons of mitogenome gene order to determine gene rearrangement events and analyze their evolutionary history(Bernt et al.,2007).This software cannot handle missing or duplicated genes (Bernt et al.,2007).Therefore,to retain uniformity,two spider species (Pirata subpiraticusandTitanoecasp.) were excluded from CREx analysis.The gene orders of all 37 genes and control region (CR) were considered.Structural differences between gene orders were represented by the number of shared common intervals(NSCIs),which is a measure of genome similarity calculated with the CREx program (Bernt et al.,2007).
The correlations betweendN,dS,anddN/dSof the 13 PCGs were analyzed and each of the three gene rearrangement distances (i.e.,BP(breakpoint),RS,andRD(reversal distance)) obtained from CREx were analyzed using Pearson correlation.The differences in evolutionary rates between rearranged and non-rearranged genes were analyzed usingttest.
Molecular dating
Spider species divergence times were estimated with the uncorrelated lognormal relaxed clock model implemented in BEAST v1.8.4 (Bouckaert et al.,2019) using the best phylogenetic tree (Supplementary Figure S1A) as a constraint tree.The following settings were used:“Substitution Model”was set to mtREV model,“Site Heterogeneity Model” was set to Gamma+Invariant sites model,“Tree Models” was set to a Yule process of speciation,and the remaining parameters were set to default.Posterior estimates of spider ages and 95% highest posterior densities (HPD) were summarized using TreeAnnotator v1.8.1 (Drummond,2012).Six spider fossils evaluated by Magalhaes et al.(2020) were used for divergence time calibration with a lognormal prior.Detailed information is provided in Table 1.
Ancestral state reconstruction
Ancestral web types within Araneae were reconstructed using two methods:(1) R package Phytools (Revell,2012) and ape(Paradis,2012) based on the ML approach;and (2) PastML(https://pastml.pasteur.fr/) (Ishikawa et al.,2019) using marginal posterior probability approximation (MPPA) with an F81-like model.For Phytools,we fit models of web types under the equal rates (ER),symmetrical (SYM),and all rates different (ARD) models implemented using the ace function in ape.Results showed that the ER model was the best model for the web type dataset.The web trait data were primarily obtained from recent studies (Dimitrov et al.,2012;Fernández et al.,2018;Kallal et al.,2021;Shao &Li,2018),and are documented in the Supplementary Materials (Supplementary Table S6).The best phylogenetic tree (Supplementary Figure S1A) was used to construct the ancestral state and each terminal taxon was marked with one of the following 12 characters:brush sheet;cobweb;irregular aerial sheet;irregular ground sheet;open burrow;orb web;purse web;sheet web;silk-lined burrow;stereotyped aerial sheet;unknown web;and no foraging web.“No foraging web” refers to cases where webs are absent or serve functions other than prey capture,(e.g.,nursery webs of some pisaurids).
RESULTS
Mitogenomic phylogeny
The phylogenetic relationships of spiders were reconstructedusing the four mitogenomic datasets and two analytical methods (Figure 1;Supplementary Figure S1 and Data S2),involving a total of 78 species from 29 families(Supplementary Tables S1,S2).Seven different tree topologies were obtained (Figure 1;Supplementary Figure S1 and Table S7),indicating that both the mitogenomic datasets and inference methods influenced the phylogenetic results.However,all 13 families with more than two species were supported as monophyletic in all analyses,except for Pisauridae (Supplementary Figure S1).Tree topology tests supported the phylogenetic tree based on the 13P123AA dataset using BI as the best topology (Figure 5;Supplementary Figure S1A).
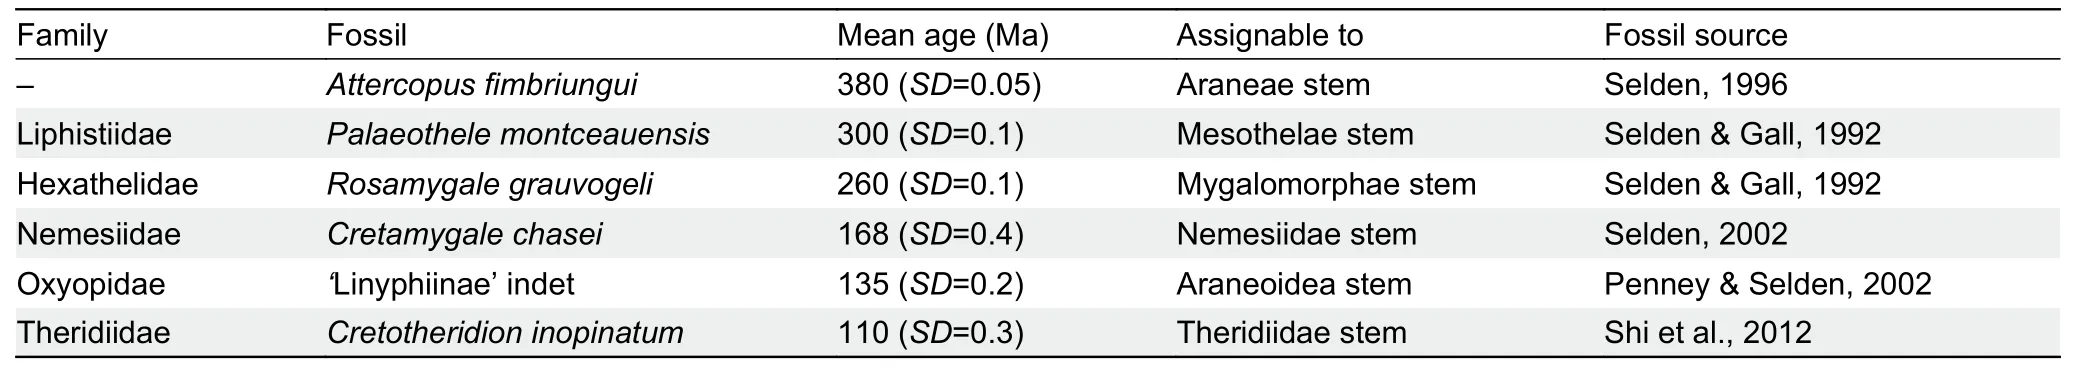
Table 1 Fossils used as calibrations and relevant settings for fossil calibrations in molecular dating analysis
All phylogenetic analyses consistently supported the monophyly of both suborders (i.e.,Mesothelae and Opisthothelae) (Figure 1;Supplementary Figure S1).The infraorder Mygalomorphae within Opisthothelae was recovered as a monophyletic group in all analyses (Figure 1;Supplementary Figure S1).This was also the case for the infraorder Araneomorphae,except for ML analysis of the 13P123 dataset (Supplementary Figure S1E).Within Mygalomorphae,all analyses supported the basal position of Atypidae,while unstable phylogenetic relationships were present among the three other families (i.e.,Dipluridae,Nemesiidae,and Theraphosidae) (Figure 1;Supplementary Figure S1).
For Araneomorphae,two clades were recovered:Synspermiata+Hypochilidae and Entelegynae (Figure 1;Supplementary Figure S1).Seven analyses supported Hypochilidae as sister to the monophyletic Synspermiata(Supplementary Figure S1).All analyses supported the monophyly of Entelegynae and placed Oecobiidae at the basal position of Entelegynae.Among the remaining 20 families within Entelegynae,Eresidae clustered with the monophyletic Araneoidea,which was sister to the Titanoecidae+RTA clade (13 families) (Figure 1).All analyses supported the basal position of Theridiidae within Araneoidea,and the sister relationship between Araneidae and Tetragnathidae+Linyphiidae.
Based on six analyses,all 13 RTA families were clustered together,and three monophyletic groups were recovered:Clade A (six families),Clade B (three families),and Lycosoidea (four families) (Figure 1;Supplementary Figure S1).Clade B was always identified as sister to Clade A and Lycosoidea.The phylogenetic position of Titanoecidae was unstable and identified either as sister to the RTA clade (six analyses,Figure 1A) or mixed within RTA as a sister group of Agelenidae or Cybaeidae (Figure 1B).Within Lycosoidea,all analyses consistently obtained the phylogeny Thomisidae+(Oxyopidae+(Lycosidae+Pisauridae)).Four different topologies were obtained for Clade A,largely due to the uncertain phylogenetic position of Miturgidae (Figure 1;Supplementary Figure S1).
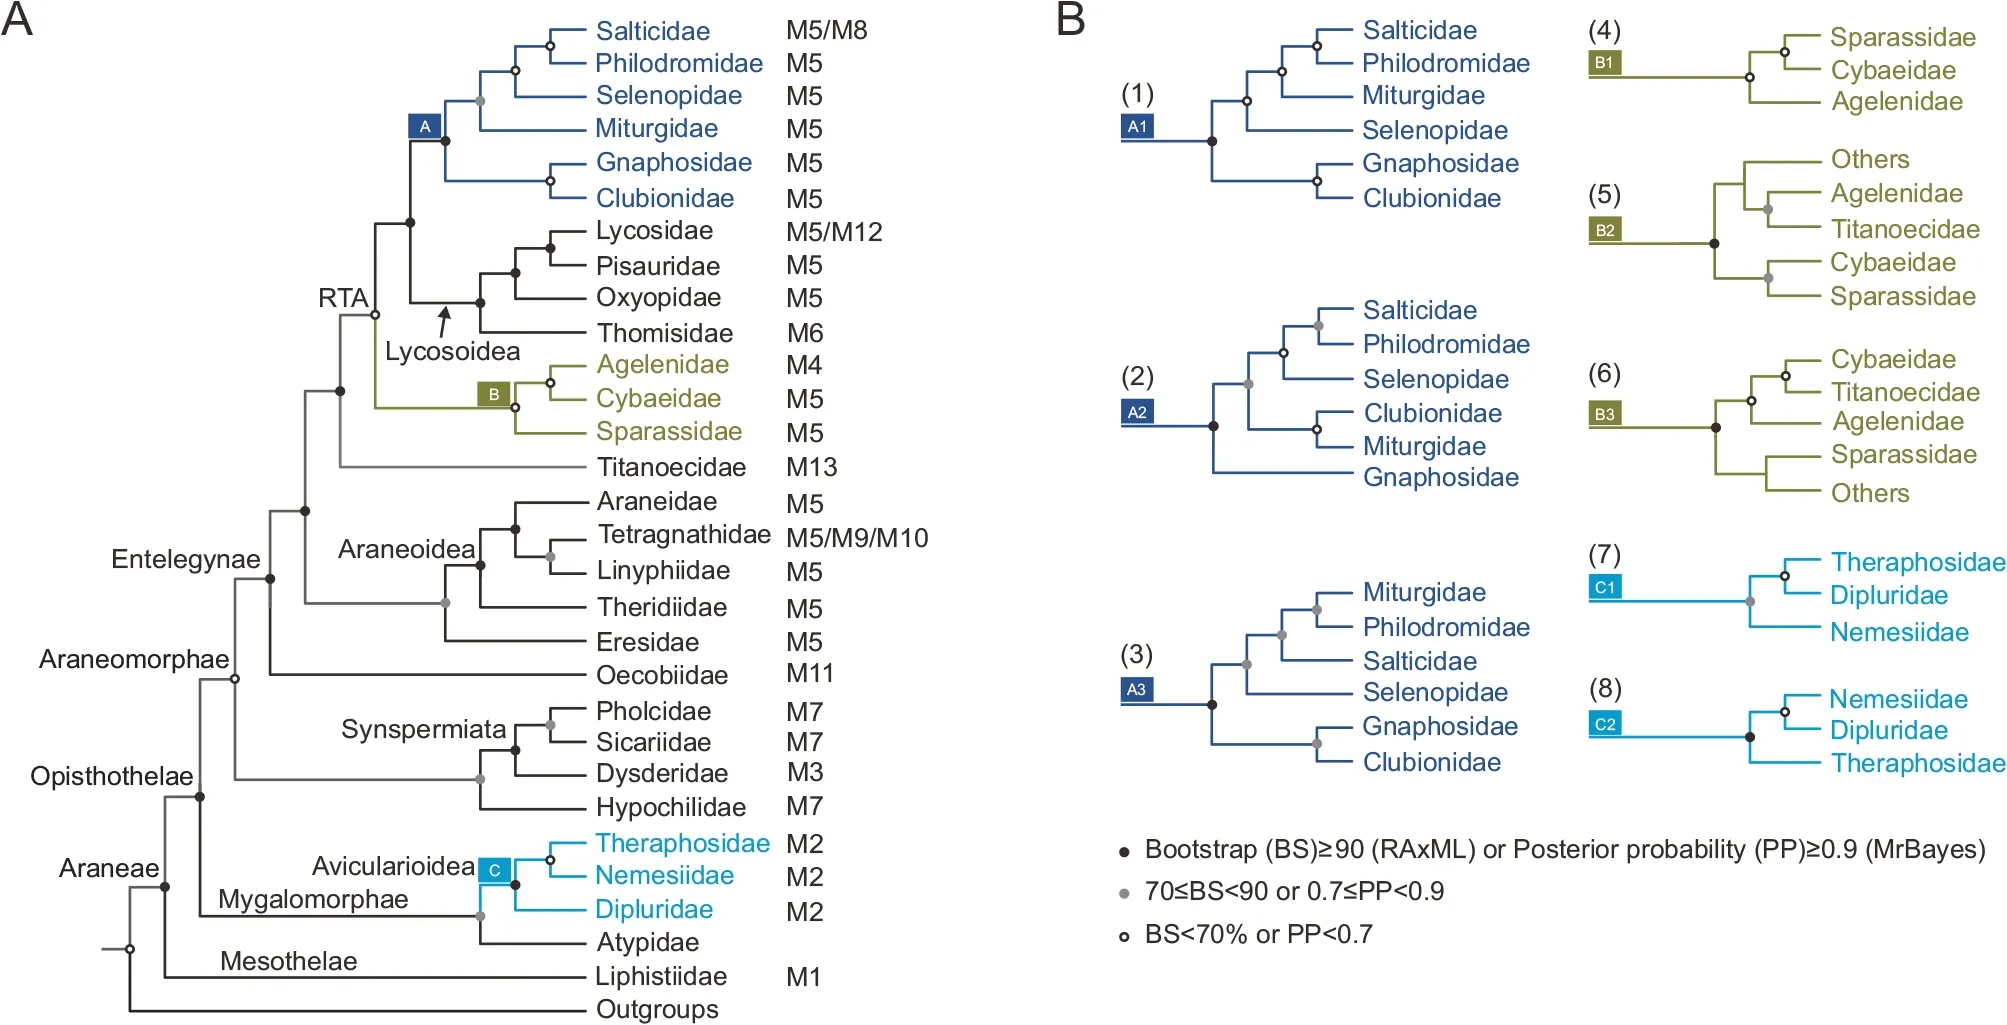
Figure 1 Phylogenetic relationships among 29 families within Araneae based on mitogenomic data
Mitochondrial gene rearrangement
A total of 13 gene arrangement modes (M1–M13) were found in the complete mitogenomes of 77 spider species from 28 families (Figure 2;Supplementary Table S8).The gene arrangement (M1) of three Liphistiidae species (Mesothelae)was identical to that ofLimulus polyphemus.Among the remaining 12 rearrangement modes,two were reported for the first time,i.e.,M8 inHeliophanus lineiventris(Salticidae) and M13 inTitanoecasp.(Titanoecidae).The most common rearrangement mode (M5) was present in 47 species from 16 families within Opisthothelae.Gene rearrangement was generally conservative within the same family,and each of the three families (Lycosidae,Salticidae,and Tetragnathidae)showed more than one arrangement mode (Figure 1A).All 12 gene rearrangement modes in the spider mitogenomes only involved tRNAs and/or the CR,with rearrangements of PCGs and rRNAs not detected.Gene rearrangements in the spider mitogenomes could be divided into four types:i.e.,inversions(reversals),transpositions,reverse transpositions,and tandem duplication-random loss (TDRL) (Figure 2).
Based on CREx analyses,two rearrangement modes (i.e.,M2 and M7) were the most similar to gene arrangement in Liphistiidae (number of shared common intervals (NSCI):432 over 1 400),followed by M3 (NSCI:394 over 1 440)(Figure 1A;Supplementary Table S9).Starting from M7,each rearrangement could be parsimoniously explained with a minimum number of changes (Figure 2).Compared to the ancestral arrangement (M1),five tRNAs (i.e.,trnA,trnR,trnT,trnL2,andtrnC) and CR showed translocated positions in M7(Figure 2).M2 only differed from M7 by atrnIreversal(Figure 2).M3 was present in six Dysderidae species and differed from M2 by the presence of a reverse transposition oftrnIand a duplication of CR.The gene order shared by most spiders (M5) was derived from M3 bytrnItranslocation,followed by translocations oftrnL2inHeliophanus lineiventris(Salticidae,M8) andAgelena silvatica(Agelenidae,M4)(Figure 2).Compared with M4,five tRNAs (i.e.,trnA,trnR,trnE,trnS1,andtrnD) showed translocated positions in M11 specific toUroctea compactilis(Oecobiidae).Shared by four Thomisidae species,M6 was derived from M11 by translocations of bothtrnIandtrnD.Two rearrangement modes (i.e.,M9 and M10) were present in the same family(Tetragnathidae) and differed by the translocation of CR(Figure 2).Compared with M5,M12 (Pirata subpiraticus)lackedtrnGbetweencox3andnad3,whereas M13 (Titanoecasp.) had an additional CR betweentrnTandnad1.Therefore,the evolutionary pathways of these two modes were not analyzed by CREx due to missing or duplicated genes.
In addition,qMGR was used to calculate theRFof 37 mitochondrial genes and CR (Supplementary Figure S2).TheRFof most genes (23 genes) and CR exceeded 37.7.The highestRF(%) (105.2) was assigned to CR,followed by nine tRNAs (RF=96.1;Supplementary Figure S2),Two tRNAs (i.e.,trnHandtrnV) and three PCGs (i.e.,cox2,nad5,andnad4)had the smallestRF(RF=0;Supplementary Figure S2).Thenad5-trnH-nad4gene cluster was identified as the most conserved segment in the spider mitogenomes,while the order oftrnY-trnC,which was rearranged fromtrnC-trnYin Mesothelae,was consistently present in all Opisthothelae species (Figure 2).Furthermore,theRSvalues of 77 spider species were calculated to identify the rearrangement degree of different species (Supplementary Table S8).The highest value (RS=42) was found in two Tetragnathidae species (i.e.,Tetragnatha maxillosa(M9) andTetragnatha nitens(M10))and Oecobiidae (Uroctea compactilis(M11)),whereas the lowest value (RS=32) was found in two Sicariidae species(M7) (Supplementary Table S8).
The correlations between the evolutionary rates of 37 mitochondrial genes and three gene rearrangement distances(RS,BP,andRD) were tested using Pearson correlation analysis (Figure 3).The evolutionary rates of each of the 15 genes (four PCGs,10 tRNA genes,andrrnS) were significantly correlated with each of the three gene rearrangement distances (P<0.05;Figure 3;Supplementary Tables S10–S13).The correlation betweenRDand evolutionary rates of the combined two rRNAs was significant(P<0.05,r=0.257),as wastrnG(P<0.05;Figure 3).No correlation between the pairwise genetic distance of the 22 combined tRNAs and any rearrangement distance was observed (P>0.05;Figure 3;Supplementary Table S10).Among the mitogenomes of 77 species,no significant differences in the evolutionary rates between rearranged and non-rearranged tRNAs were detected (T=0.18,P<0.05).No significant differences were found inRFvalues between mitogenomes involving CR rearrangement and those not involving CR rearrangement (T=0,P=1).
Truncated tRNA genes
The tRNAs of 23 newly sequenced spider mitogenomes were first annotated by tRNAscan-SE.Most tRNAs were not detected,largely due to the lack of well-paired dihydrouridine(DHU) and TΨC arms,and mismatches in aminoacyl acceptor arms.Furthermore,tRNAs in 55 sequenced spider mitogenomes available in GenBank were not well annotated,nor accurate.Some tRNAs had incorrect anticodons,or their positions on the plus and minus strands were incorrect.Some tRNAs were too short or too long.Therefore,all tRNAs of the 78 spider mitogenomes were reannotated by sequence similarity alignment using MEGA X.The main goals of tRNA annotation were to identify minimal gene overlaps,maximum sequence similarity within the same family and/or genus,and the formation of DHU and/or TΨC arms as far as possible.Seven tRNAs were not detected inAtypus largosaccatusbecause of incomplete sequencing;thus,this species was excluded from the following analyses.Results showed that the average size of all 22 tRNAs present in the 77 spider mitogenomes was 57±3 nt,ranging from 51±0.28 nt (trnL2) to 62±1.37 nt (trnK) (Supplementary Figure S3).The length of gene spacers or gene overlaps found in each tRNA gene varied.There were four large gene overlaps in nearly all spider mitogenomes,i.e.,trnW-trnY(9–29 nt) in 69 species,trnY-trnC(3–27 nt) in 70 species,trnR-trnE(4–20 nt) in 74 species,andtrnE-trnF(4–25 nt) in 75 species.ThetrnQgene in 71 species was considered a normal full-length tRNA gene because it did not overlap with other genes and could be folded into a cloverleaf secondary structure (Figure 4;Supplementary Figure S3).
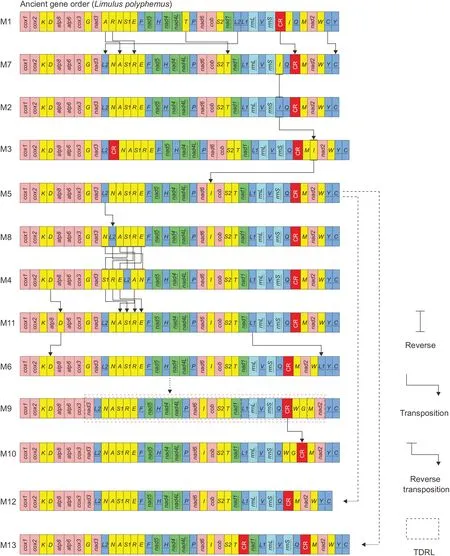
Figure 2 Evolution of gene rearrangement modes in spider mitogenomes
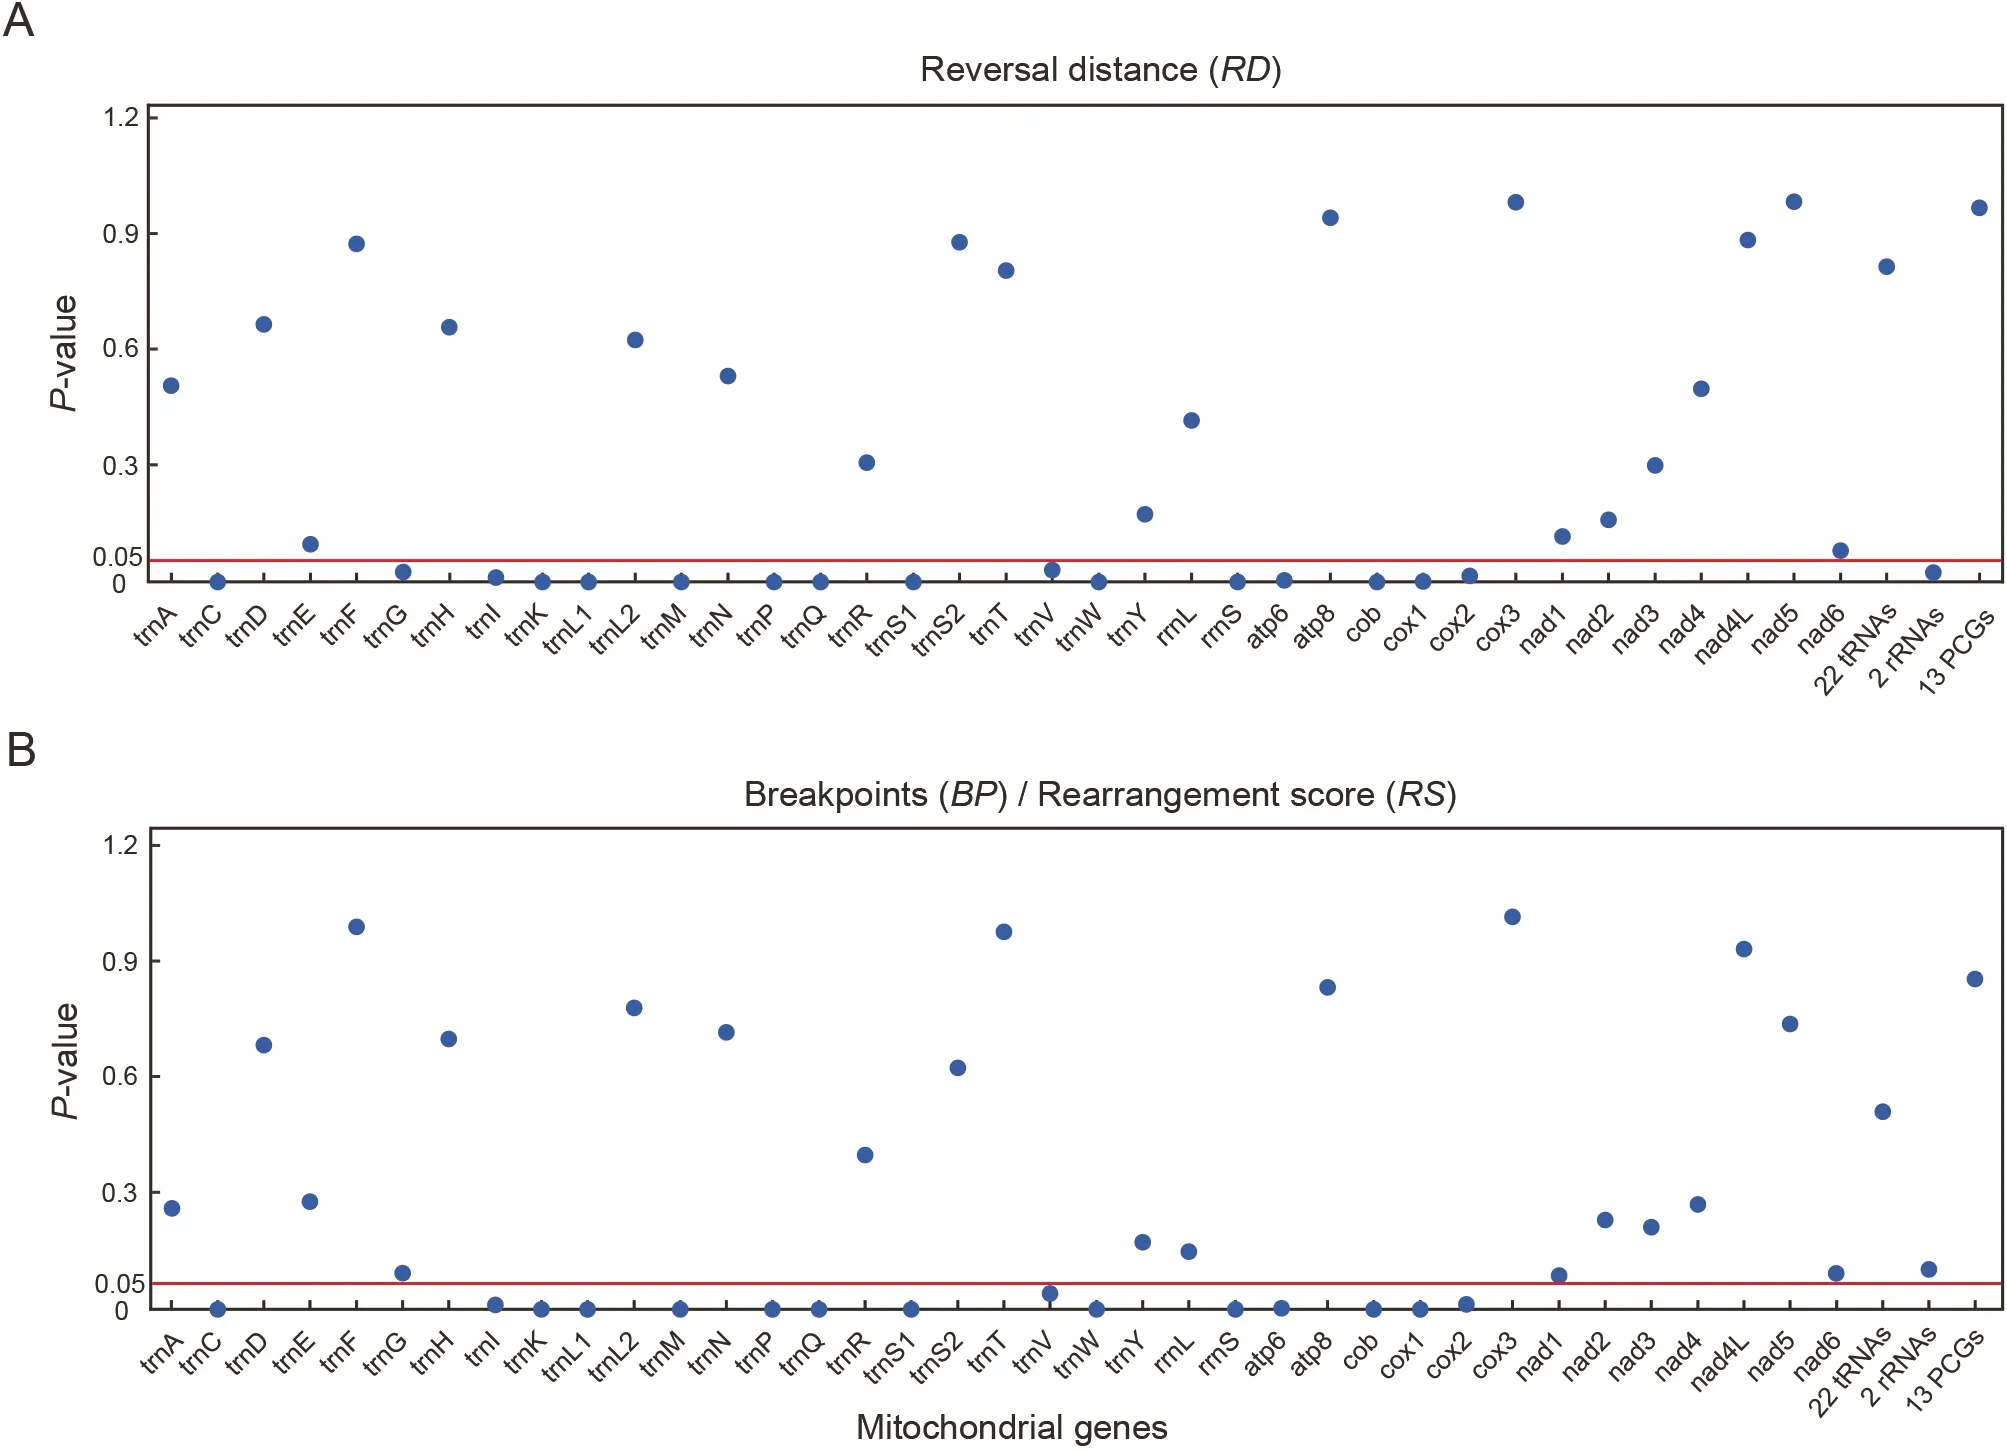
Figure 3 Pairwise correlation between the three gene arrangement distances (breakpoints (BP),rearrangement score (RS),and reversal distance (RD)) and evolutionary rates of mitochondrial genes
Three types of secondary tRNA structures were obtained:(1) tRNAs with a typical cloverleaf structure,(2) tRNAs missing the DHU arm,and (3) tRNAs missing the TΨC arm(Figure 4A;Supplementary Figure S3).Among the 22 tRNAs,only seven (i.e.,trnI,trnV,trnR,trnK,trnN,trnM,andtrnL1)among the 77 species formed a typical cloverleaf secondary structure (Supplementary Figure S3 and Table S14).The remaining 15 tRNAs lacked either the DHU or TΨC arms in at least one species.Most tRNAs (i.e.,18) in the 77 species formed a base-paired DHU arm,with a DHU stem of 2–4 bp.The remaining four tRNAs lacked the DHU arm either in all species (trnS1andtrnA),most species (trnS2),or six Dysderidae species (trnQ) (Supplementary Figure S3 and Table S14).Only 11 tRNAs in all 77 species were inferred to possess a TΨC arm,six of which (i.e.,trnA,trnE,trnK,trnS1,trnS2,andtrnQ) presented relatively conservative TΨC arms across all 77 spider species.The remaining five tRNAs (i.e.,trnY,trnR,trnV,trnL1,andtrnI) were less conserved(Supplementary Figure S3).The size and nucleotide identity of the TΨC arms in certain tRNAs of specific families were very different from that of other families (e.g.,trnAandtrnWin Pholcidae andtrnQin Dysderidae;Supplementary Figure S3).
The anticodon arms of all 22 tRNAs in all spiders showed high sequence conservation and most tRNAs had slight mismatches in the anticodon arm stems (1–2 nt)(Supplementary Figure S3).The most common mismatch in the anticodon arm stems wastrnF(27 species),followed bytrnH(18 species),trnL1(15 species),andtrnC(10 species)(Supplementary Figure S3).Notably,the anticodon oftrnS1was not unique,and varied from the most common GCT (59 species of 27 families) to TCT (17 Araneidae species) or CCT(Argiope bruennichiof Araneidae) (Figure 4B;Supplementary Figure S3).Poorly paired or unpaired aminoacyl acceptor arms were present in all 22 tRNAs.Although the exact gene boundaries could not be determined using only DNA sequences,all 22 tRNA genes appeared to lack the sequence that forms a fully paired aminoacyl acceptor stem.Extreme examples were found in six tRNAs (i.e.,trnR,trnM,trnE,trnK,trnL2,andtrnF),where the aminoacyl acceptor arms of all species contained mismatches.

Figure 4 Secondary structures of tRNAs in spider mitogenomes
To explore potential associations between sequence size of truncated tRNAs and that of other mitochondrial genes,Pearson correlation was performed (Supplementary Table S15;differences in evolutionary rates of tRNAs were also compared).Results indicated that both the size (P<0.05,r=0.286) and evolutionary rate (P<0.01,r=0.634) of the combined 22 tRNAs were significantly correlated with that of the combined two rRNAs.Differences in the evolutionary rates of the tRNAs were also compared by dividing all 22 tRNAs of each species into three groups,i.e.,typical cloverleaf structures,lack of DHU arms,and lack of TΨC arms(Supplementary Table S10 and Figure S4).A significant difference in the evolutionary rate was found in tRNAs with a typical cloverleaf structure and tRNAs that lacked the TΨC arm (Supplementary Figure S4A).For the two tRNAs (i.e.,trnQandtrnS2) that lacked DHU arms in at least two species,the evolutionary rates of the tRNAs of species lacking or containing DHU arms were further compared (Supplementary Figure S4B) but showed no significant differences (P>0.05;Supplementary Figure S4B).For the nine tRNAs lacking TΨC arms in at least two species,the evolutionary rates of the species lacking or containing TΨC arms were compared(Supplementary Figure S4C),with a significant difference found intrnH(P<0.05).
Divergence time estimation
The root of Araneae was estimated to be 329 Ma (95% HPD:301–359 Ma) (Figure 5;Supplementary Figure S5).The origin of Opisthothelae was estimated to be 258 Ma (95% HPD:233–284 Ma).The divergence time between Entelegynae and Synspermiata+Hypochilidae was 240 Ma (95% HPD:215–265 Ma).The origins of the RTA clade,Araneoidea,and Lycosoidea were dated to 163 Ma (95% HPD:140–186 Ma),170 Ma (95% HPD:114–233 Ma),and 107 Ma (95% HPD:87–130 Ma),respectively (Figure 5;Supplementary Figure S5).

Figure 5 Ancestral state reconstruction of web type in spiders using Phytools
Trait evolution
The ancestral state was reconstructed for web types across the spider phylogeny using Phytools (Supplementary Figure S6) and PastML (Supplementary Data S3).Despite differences in likelihood values,the two methods obtained almost identical ancestral reconstruction results in several large clades of Araneae (Figure 5;Supplementary Data S3).Ancestral state reconstruction of 12 web types showed that the common ancestor likely foraged using a silk-lined burrow(Figure 5;Supplementary Figure S6 and Data S3).The mygalomorphs likely foraged using an open burrow.The ancestral web states of Opisthothelae,Araneomorphae,Synspermiata,and Entelegynae suggested no foraging webs(Supplementary Figure S6 and Data S3).The araneoid ancestors likely built orb webs (Supplementary Figure S6 and Data S3).The ancestors of the RTA clade did not build foraging webs and evolved into hunting spiders after losing their web-making abilities (Figure 5;Supplementary Figure S6 and Data S3).
DISCUSSION
Mitochondrial phylogeny of spiders
Mitogenomic data have been widely used to explore the phylogenetic relationships among various arthropod groups,e.g.,Acari (Arribas et al.,2020;Xue et al.,2018) and insects(Li et al.,2017;Yuan et al.,2016).Our phylogenomic analyses represent the largest assessment of spider phylogeny using mitogenome data in terms of spider species number.Several recent studies suggest that horseshoe crabs should be phylogenetically nested within the arachnids (Ballesteros et al.,2022;Ballesteros &Sharma,2019;Lozano-Fernandez et al.,2019;Sharma et al.,2021).In our phylogenetic analyses,all spider species were clustered together (Supplementary Figure S1),indicating that theLimulus polyphemusoutgroup did not influence spider phylogeny in the present study.These results highly support the monophyly of both suborders(Opisthothelae and Mesothelae),both infraorders(Mygalomorphae and Araneomorphae),Synspermiata,Entelegynae,and all families (except for Pisauridae) with more than one species.Furthermore,a high-level phylogeny of(Mesothelae+(Mygalomorphae+Araneomorphae)) was also recovered.These mitochondrial phylogenomic results are highly consistent with previous studies based on morphological and molecular data (Fernández et al.,2018;Garrison et al.,2016;Hawlena &Schmitz,2010;Kallal et al.,2021;Kulkarni et al.,2021;Kumar et al.,2020;Wheeler et al.,2017;Xin et al.,2015).This consistency indicates that mitogenomic data may provide useful information for resolving Araneae phylogeny.
Our results supported the monophyly of Araneomorphae,except for one analysis,although this monophyletic group remains controversial in previous studies based on different datasets (Fernández et al.,2018;Garrison et al.,2016;Kallal et al.,2021;Kulkarni et al.,2021;Kumar et al.,2020;Tyagi et al.,2020).The non-monophyly of Araneomorphae was attributed to the unstable position of the family Hypochilidae that erroneously clustered with Opisthothelae.Traditionally,Hypochilidae is assumed to be sister to all remaining araneomorphs (Neocribellatae) (Coddington,2005;Coddington &Levi,1991).However,most analyses in this study grouped Hypochilidae with Synspermiata,matching recent molecular studies (Kallal et al.,2021;Kulkarni et al.,2021;Wheeler et al.,2017).The monophyly of Synspermiata was also recovered,as suggested in earlier morphological phylogenetic studies (Coddington,2005;Coddington &Levi,1991) and recent molecular studies (Fernández et al.,2018;Kallal et al.,2021;Kulkarni et al.,2021).
Previous morphology-based phylogenetic studies supported the monophyly of Eresoidea,with the assignment of three families (i.e.,Eresidae,Hersiliidae,and Oecobiidae)(Coddington,2005;Toft,2013).More recent gene-based studies on Entelegynae phylogeny separated Eresidae from Oecobiidae and Hersiliidae,grouping the latter two into the new superfamily Oecobioidea (Hormiga &Griswold,2014;Miller et al.,2010a;Wheeler et al.,2017).None of our analyses recovered the monophyly of Eresoidea,consistent with previous molecular studies (Bond et al.,2014).Eresidae was recovered as sister to Araneoidea,in accordance with the findings of Miller et al.(2010a),Garrison et al.(2016),and Kallal et al.(2021).Oecobiidae was recovered as sister to all remaining Entelegynae,but recent molecular studies classified Oecobioidea as sister to the RTA clade.Both present and previous results increase doubt as to the accuracy of the superfamily Eresoidea;thus,phylogenetic relationships of both Oecobioidea and Eresoidea should be further studied.Nephilids were not treated as a valid family but ranked in Araneidae (Kallal et al.,2021;World Spider Catalog,2022).The results of this study strongly supported the monophyly of Araneoidea,as per previous molecular studies (Dimitrov et al.,2017;Garrison et al.,2016;Wheeler et al.,2017).We identified Theridiidae (cobweb spiders) as sister to the remaining araneoids,consistent with recent molecular and transcriptomic studies (Bond et al.,2014;Garrison et al.,2016;Kallal et al.,2021).
The most diverse spider lineage (i.e.,RTA clade) was consistently identified as the evolutionarily youngest and a monophyletic group by various analyses.Titanoecids lack a retrolateral tibial apophysis on the male palp and have historically been excluded from the RTA clade (Griswold et al.,1999,2005).Therefore,it has been proposed that titanoecids do not belong to the RTA clade (Coddington,2005;Wheeler et al.,2017),as also found in the present study based on most analyses,which recovered a (Clade B+(Lycosoidea+Clade A))phylogeny within the RTA clade.The placement of Thomisidae in Lycosoidea was formally established in two previous studies (Bayer &Sch?nhofer,2013;Polotow et al.,2015),although the phylogenetic position of Thomisidae remains controversial (Ramírez,2014).Phylogenetic relationships among the three families within Clade B were not always stable,as reported previously (Kallal et al.,2021;Wheeler et al.,2017).Here,the topology test supported Sparassidae as sister to Cybaeidae+Agelenidae,consistent with previous molecular studies (Kallal et al.,2021;Kulkarni et al.,2021).Within Clade A,Gnaphosidae grouped with Clubionidae,while the remaining four families (i.e.,Miturgidae,Selenopidae,Philodromidae,and Salticidae) clustered together.However,their internal relationships were unstable,as reported in an earlier molecular phylogenetic study(Wheeler et al.,2017).
Although both mitogenomic datasets and analytical methods exert important impacts on tree topologies,mitogenomic data have important implications in phylogenetic studies on spiders.As shown in the present study,mitogenomes are a useful tool for providing a robust spider phylogeny,even though the position of certain families could not be well determined.However,this problem also applies for other molecular data(Fernández et al.,2018;Kallal et al.,2021;Wheeler et al.,2017).Family diversity in the present study still represents less than a quarter of the total spider family count.Therefore,further research is needed combining molecular (i.e.,transcriptome,genome,and mitogenome) and morphological data under denser taxon sampling to build the Spider Tree of Life.
Gene rearrangement evolution
Mitochondrial gene rearrangement appears to be common and is frequently reported in animal groups,especially in response to the dramatic increase of completely sequenced mitogenomes (Boore,1999;Cameron,2014;Xue et al.,2018;Yuan et al.,2010).This is also true for spider mitogenomes,with a total of 13 gene arrangement modes (M1–M13)detected in the present study.Tyagi et al.(2020) identified more gene arrangements (14 modes) in fewer spider species(44 spider species) due to incorrect tRNA annotations of certain mitogenomes previously submitted to the NCBI database.When analyzing gene rearrangements in this study,the position and orientation of all tRNAs were corrected,resulting in a reduction in gene rearrangement modes.High gene rearrangement is a typical feature of spider mitogenomes,but only the suborder Opisthothelae presented gene rearrangements,whereas Mesothelae retained the ancient gene order.This identified Mesothelae as the most ancient group within Araneae and that gene rearrangements in Opisthothelae originated from those in Mesothelae.Only one rearrangement mode was found in each of the families,except for Lycosidae,Tetragnathidae,and Salticidae,which had more than one.The occurrence of rearrangements within the same family has also been found in other animal groups,such as mites (Zhang et al.,2021) and insects (Babbucci et al.,2014).As only a single species was sequenced for many spider families,sequencing more mitogenomes of other members of these families is necessary for exploring rearrangement diversity and evolution at various taxonomic levels within Araneae.
CREx can be used to analyze the evolutionary pathway of gene rearrangement (Bernt et al.,2007),and qMGR can measure the intensity of gene rearrangement by calculatingRSandRF(Zhang et al.,2020).Here,the CREx results showed that rearrangements in spider mitogenomes only involved tRNAs and/or CR,and the qMGR results showed that rearrangements in spider mitogenomes involved tRNAs,rRNAs,CR,and 10 PCGs.According toRF,rearrangements in tRNAs were far more frequent than those in large PCGs,as reported in animal mitogenomes (Cameron,2014;Gissi et al.,2008).The tRNA blocktrnA-trnR-trnN-trnS1was identified as a gene rearrangement hot spot by two methods,as reported in other arthropods showing rearrangement in tRNAs betweennad3andnad5(Boore,1999;Cameron,2014;Qiu et al.,2005).Another rearrangement hot spot in the spider mitogenomes was the region near CR that contains essential regulatory elements for transcription and replication (Boore,1999).The gene block CR-trnI-trnQ-trnM(in Mesothelae) was rearranged totrnQ-CR-trnM(in most spiders),trnQ-CR-trnW(inTetragnatha maxillosa),ortrnG-CR-trnM(inTetragnatha nitens).Two CRs were present inTitanoecasp.(Titanoecidae),leading to rearrangement (M13).Although the metazoan mitogenome usually contains only one mitochondrial CR,the presence of two CRs has also been reported in mites (Jeyaprakash &Hoy,2007;Shao et al.,2005) and insects (Cameron,2014;Shao et al.,2001).Furthermore,the short conserved non-coding sequences betweentrnL2andtrnNin the six species of the family Dysderidae were also considered to be an additional CR(Pons et al.,2019;Tyagi et al.,2020).This indicates that duplicated CRs may be common,which requires further investigation in spider mitogenomes.
Gene rearrangements in metazoan mitogenomes can be explained by two widely accepted models:i.e.,TDRL model(San Mauro et al.,2006) and recombination model (Lunt &Hyman,1997).Tandem duplication of certain genes in a region may occur because of slippage during replication (Xu et al.,2006).The TDRL model assumes that rearrangement of mitochondrial genes occurs through tandem duplication of specific genes,followed by random loss of one copy of each gene (Kumazawa et al.,2014;Shi et al.,2014).This mechanism only changes the position of the gene,not its direction.The transpositions of tRNAs can be well explained by the TDRL model,such as M3→M5→M8,as reported in previous studies on gene rearrangements in spiders (Kumar et al.,2020;Qiu et al.,2005).However,duplication of the CR in Titanoecidae cannot be explained by the TDRL model,and the related mechanism remains to be explored.Recombination within a circular genome can result in the removal of a smaller circle from a larger circle,or the reversal of the genomic region,depending on how DNA strands are reconnected (Dowton &Campbell,2001;Lunt &Hyman,1997).Reversal rearrangement involving the switching of genes between two strands can be explained by the recombination model,such as M7→M2→M3.
It has been proposed that if the position of a gene changes because of a gene rearrangement event,the base frequency within the gene will lose its balance,which may cause rapid bursts of substitutions,especially at synonymous positions,until equilibrium is again reached (Xu et al.,2006).Therefore,an increase in the rate of gene rearrangement will cause an increase in the evolutionary rate,suggesting that the evolutionary rate and gene rearrangement may be related.A significant positive correlation between plastid genome rearrangements and evolutionary rates has been observed in plants (Ren et al.,2020;Weng et al.,2014).Certain insect groups have also been shown to have simultaneously high mitochondrial gene rearrangement rates and high evolutionary rates (Kumazawa et al.,1998;Shao et al.,2003;Yokobori et al.,1999).Here,significant correlations were found between the three rearrangement distances and evolutionary rates of 15 genes in the spider mitogenomes,indicating that gene rearrangement of spider mitochondrial genes may be related to the increased evolutionary rate of tRNAs.It has been suggested that mitochondrial tRNAs have the highest density of post-transcriptional modifications among all RNAs,which may cause high gene rearrangements (Lorenz et al.,2017).Furthermore,the effects of other factors (e.g.,DNA repair,metabolic rate,generation time,life history,parasitic lifestyle,and spider size) on the evolutionary rate of mitochondrial genes may also contribute to gene rearrangements in spider mitogenomes.Whether the accumulation of gene rearrangements in spider mitogenomes is due to their higher structural mutation rate or weak natural selection of gene order remains unclear.
Gene rearrangement has been used as an informative phylogenetic characteristic for certain lineages (Boore et al.,1998;Cameron,2014;Zhang et al.,2021).In the current study,species (mitogenomes) with similarRSvalues tended to be phylogenetically clustered,suggesting that gene rearrangement in spiders shows phylogenetic characteristics.Among the 12 rearrangement modes,the most parsimonious evolutionary scenarios of 10 modes were largely congruent with the phylogenetic results,i.e.,three rearrangement modes(M2,M3,and M7) originated from the ancient gene order (M1)present in the basal groups (M2 in Mygalomorphae,M7 in Hypochilidae,as well as M3 and M7 in Synspermiata).The shared rearrangement mode (M7) between Hypochilidae and Synspermiata supported the same group,consistent with our phylogenetic analyses and the results of previous studies(Bond et al.,2014;Garrison et al.,2016).In addition,M5 was widely shared by most spiders in Entelegynae,and the remaining eight modes present in Entelegynae likely originated independently (Figure 1A).ThetrnK-trnDcluster was high conserved in Arthropoda but changed totrnK-atp8-trnDin Oecobiidae (M11),indicating that this family differs from other families.This is further supported by our phylogenetic results identifying Oecobiidae as the most basal within Entelegynae.ThetrnY-trnCcluster changed from the ancienttrnC-trnY,which was shared by all rearranged spider mitogenomes,indicating that this rearrangement is a synapomorphy for Opisthothelae.Titanoecidae had two CRs,whereas only one CR was present in all RTA species,indicating that this rearrangement mode (M13) originated independently,thus supporting the non-RTA clade of Titanoecidae,consistent with our phylogenetic results.These findings indicate that the rearrangement evolution of spider mitogenomes largely followed sequence evolution and reflected systematic evolution of spiders.Therefore,gene rearrangement could provide valid phylogenetic signals for spider phylogeny,especially for groups with unstable phylogenetic positions.These results suggest that the evolution of mitochondrial gene rearrangement generally matches the evolutionary relationship of spiders.This provides important information and insight for establishing high-level phylogeny of spiders.
Truncated tRNAs
All spider mitogenomes encoded a complete set of 22 tRNAs,except for the wolf spiderPirata subpiraticus,which lacks the tRNAtrnG.Loss of tRNA genes is rare in animal mitogenomes but has been reported across various animal groups (Gissi et al.,2008),including other orders within Arachnida (e.g.,scorpions (Dávila et al.,2005) and mites (Xue et al.,2018))and insects (e.g.,ladybirds (Yuan et al.,2020),weevils (Haran et al.,2013;Song et al.,2010),whiteflies (Thao et al.,2004),and true bugs (Dai et al.,2012)).The loss of tRNA may be compensated by importing tRNAs from the cytoplasm(Duchêne et al.,2009).
In the spider mitogenomes,all tRNAs used the standard anticodon,except fortrnS1,which used three kinds of anticodons (i.e.,standard GCT,unusual CCT,and TCT).These mutations in thetrnS1anticodon only occurred in the family Araneidae and have been preserved for at least 109 Ma.The point mutation in the anticodon of mitochondrialtrnS1has also been reported in other arthropods,such as the plant bugAdelphocoris suturalis(Wang et al.,2014) and sea spiderTanystylum orbiculare(Masta et al.,2010).Less common anticodons have also been found in other tRNAs,i.e.,trnE(CTC instead of TTC) inSteganacarus magnus,trnI(AAT instead of GAT) inSteganacarus magnusandHistiostoma feroniarum,andtrnF(AAA instead of GAA) inTyrophagus longiorandTyrophagus putrescentiae.The genetic code provides the basic rules for converting genetic information from coding sequences to proteins by establishing correspondences between codons and amino acids (Abascal et al.,2012).Therefore,anticodon point mutations can lead to codon reassignments,such as the reassignment of the AGG codon between lysine and serine in plant bug mitogenomes.Here,no mutation was found in thetrnKanticodon in the spider mitogenomes,suggesting that there may be no reassignment for the AGG codon.Further research is needed to explore the diversity and functionality oftrnS1in spider mitogenomes.
Generally,metazoan mitochondrial tRNA has a highly conserved cloverleaf structure with four arms,i.e.,aminoacyl acceptor (AA) arm,DHU arm,anticodon arm,and TΨC arm(Jühling et al.,2012a).In a recent study,none of the 22 tRNAs in six spider species (i.e.,fiveParachtesspecies and oneHarpactocratesspecies) had a typical cloverleaf structure and at least four tRNAs lacked both DHU and TΨC arms (Pons et al.,2019).In contrast,by including more spider species,our analyses showed that seven tRNAs formed four arms in all spider mitogenomes,and none of the 22 tRNAs in any spider mitogenome lacked both the DHU and TΨC arms.This discrepancy may be due to inconsistent tRNA annotations between this study and that of Pons et al.(2019).In Pons et al.(2019),when DHU or TΨC arms were lost,making it difficult to determine gene boundaries,truncated tRNAs were manually obtained by finding the most complementary sequences to form the AA arm.In our study,tRNAs were annotated by reducing overlaps between genes as much as possible,not merely striving to achieve a good pairing of the AA arm.The obtained tRNA annotation showed that mismatches of AA arms are common in most tRNAs of the spider mitogenomes.The mismatch of AA arms is likely not a problem,but rather,a typical feature of spider mitochondrial tRNAs.This assumption is supported by previous studies,which have proposed tRNA editing for the formation of completely paired AA arms in spiders (Masta &Boore,2004,2008).Post-transcriptional tRNA editing is likely common and has been reported in centipedes (Lavrov et al.,2000),velvet worms (Segovia et al.,2011),and sponges (Lavrov et al.,2013).However,accurate annotation of truncated mitochondrial tRNAs remains challenging,especially when it depends on bioinformatic analyses of DNA sequences alone.
The absence of DHU arms was first identified intrnS1in mammalian mitochondria in the 1970s,withtrnS1since found to be very common in metazoan mitogenomes (Gissi et al.,2008;Jühling et al.,2012a).Such atypical tRNA structures have been extensively reported in nematode mitogenomes,where all tRNAs either lack the DHU arm,TΨC arm,or both(Jühling et al.,2012b,2018;Wende et al.,2014).Within Arachnida,tRNA truncation has also been frequently reported in Acari (Sch?ffer et al.,2018;Xue et al.,2016;Yuan et al.,2010),pseudoscorpions (Lonergan &Gray,1993),scorpions(Dávila et al.,2005;Masta &Boore,2008),and Thelyphonida(Masta &Boore,2008).The tRNAs are central players in translation and function as adapter molecules between mRNA codons and amino acids (Lorenz et al.,2017).Whether structurally abnormal tRNA exhibits normal biological function remains an area of focus.In nematodes,mitochondrial tRNAs with extremely truncated structures are still recognized by synthetases and can be aminoacylated (Giegé et al.,2012;Wolfson et al.,1999).Two elongation factors (EF-Tu1andEFTu2) encoded by nuclear DNA in nematodes can bind to mitochondrial tRNAs without canonical cloverleaf structures(Arita et al.,2006;Ohtsuki et al.,2001).Studies on the nematodeRomanomermis culicivoraxand two-spotted spider miteTetranychus urticaeprovide further evidence that tRNAs with abnormal structures can be post-transcriptionally modified and show aminoacylation by the addition of a CCA tail,supporting the functionality of these tRNAs (Jühling et al.,2012b;Warren &Sloan,2021;Wende et al.,2014).Furthermore,in the present study,we found a significant positive correlation in both evolutionary rate and size between tRNAs and rRNAs in the spider mitogenomes,suggesting that tRNA and rRNA genes may have co-evolved (Masta &Boore,2008;Watanabe et al.,2014).Therefore,it is necessary to investigate whether truncated tRNAs in spider mitogenomes truly lack the DHU or TΨC arms,and if so,whether they remain functional.
Evolutionary dynamics of traits
Spiders have undergone about 300–400 Ma of evolution on Earth (Garrison et al.,2016;Magalhaes et al.,2020;Selden et al.,1991).Fossil remains are direct proof of organisms that no longer exist and are valuable tools for studying how biological evolution has unfolded across geological time (Magalhaes et al.,2020).Although spiders are found in nearly every ecosystem on the planet in abundant numbers,their exoskeletons are soft,and their bodies are fragile (Selden &Penney,2010).Therefore,spider fossils are relatively rare as their preservation requires special conditions (Selden &Penney,2010).Dated phylogenies are a useful way to address questions in evolutionary biology (Magalhaes et al.,2020).Various studies have estimated divergence time in different spider groups (Fernández et al.,2018;Garrison et al.,2016;Kallal et al.,2021;Magalhaes et al.,2020;Shao &Li,2018) based on advances in spider phylogeny.In this study,the root of Araneae was estimated approximately at the Carboniferous period,consistent with the estimates of Garrison et al.(2016) and (Shao &Li,2018) but slightly younger than the estimates of Fernández et al.(2018) and Magalhaes et al.(2020).These differences may be the result of different sampling taxa,molecular phylogenies,and fossils in the studies.Major historical events (e.g.,changes in geology and climate) during this period may have affected the spread and evolution of spiders.The origin of Mygalomorphae was dated to the Triassic period,slightly younger than previous estimates (Fernández et al.,2018;Garrison et al.,2016;Magalhaes et al.,2020).The divergence times of both the RTA clade and Araneoidea were dated to the Jurassic period (Fernández et al.,2018;Garrison et al.,2016;Magalhaes et al.,2020).During Jurassic radiation,climatic factors (especially low oxygen and high carbon dioxide levels in the atmosphere) promoted the differentiation and evolution of species (Lü et al.,2020).Whether the differentiation of RTA spiders during this period is also related to climatic factors is worth further study.The ancestors of Lycosidae appeared in the background of the Eocene “greenhouse” climate,with its significantly expanding thermal forest (Morley,2011).With an average age of about 39 Ma,Lycosidae formed the youngest spider group on Earth,but they emerged well before the expansion of grasslands (Piacentini &Ramírez,2019).
Spiders started spinning about 400 Ma (Huang et al.,2018;Sensenig et al.,2010;Wang et al.,2018).Spiders can have up to eight different silk glands and can produce various super-strong silks,which are used in almost every aspect of a spider’s life (Garb,2013;Sensenig et al.,2010).Ecologically,spiders can be divided into two categories:wandering spiders and web-building spiders (Foelix,2011).The former category consists of most members of the RTA clade,e.g.,wolf spiders,nursery web spiders,jumping spiders,and lynx spiders,which mainly use silk for basic functions,including building retreats and wrapping their eggs (Foelix,2011;Vollrath &Selden,2007).The latter category also uses silk for these same basic functions,as well as to build various types of prey-capturing webs.Our results indicated that the common ancestors of spiders likely foraged from a silk-lined burrow (e.g.,sometimes called a burrow with a trapdoor),as reported in Fernández et al.(2018) and Hedin et al.(2019).Our results supported the hypothesis that webs are ancestral for spiders,consistent with previous studies (Fernández et al.,2018;Garrison et al.,2016;Kallal et al.,2021).
Moreover,rather than an irregular ground sheet (Fernández et al.,2018),an open burrow may be the ancestral state for all mygalomorphs.Mygalomorphs are also capable of spinning at least slightly adhesive silk (Coyle &Ketner,1990).Mygalomorphs show limited diversity in silk glands and spigot types,and their use of silk is not as developed as that in certain araneomorphs (Kovoor,1987).Coddington et al.(2019) suggested the probability of an ancestral orb web in the common ancestor of Entelegynae (Coddington et al.,2019).Our results indicated that an ancestral orb web was probably the common ancestor state of Araneoidea,rather than Entelegynae (Kallal et al.,2021),which appears to spin noforaging webs.Garrison et al.(2016) and Coddington et al.(2019) inferred a single origin for orb webs.However,Fernández et al.(2018) and Kallal et al.(2021) rejected the“ancient orb-web hypothesis”,with the former implying multiple origins (two to six) for orb webs,and the latter suggesting that orb webs evolved twice in the UDOH Grade (i.e.,Uloboridae,Deinopidae,and Oecobiidae+Hersiliidae) and once (in analysis of 13-state web types) or thrice (in analysis of twostate web types) in Araneoidea.We used two methods for ancestral state reconstruction of web traits and obtained almost identical results.However,ancestral states of some taxa were inconsistent with that of previous studies(Coddington et al.,2019;Fernández et al.,2018;Kallal et al.,2021),likely due to different phylogenies and taxa included in analyses.For example,compared to Kallal et al.(2021),our analyses did not include the three families of the UDOH Grade(i.e.,Uloboridae,Oecobioidea,and Deinopidae).
Our analyses indicated that the ancestors of the RTA clade were primitively vagrant.While most spiders in the RTA clade continued as hunting spiders,others switched to a webbuilding lifestyle in at least two lineages (i.e.,Agelenidae and Cybaeidae).The family Lycosidae (well-known vagrant representatives) originated during the Eocene period,a time when tropical forests were dominant,thus the overall dominance of forests did not necessarily establish webbuilding traits.Previous analysis suggests that RTA spiders may have the highest diversification rate,followed by mygalomorphs and araneoids (Garrison et al.,2016).The current study indicated that RTA spiders were more active and spread farther within a short period,with greater exposure to more complex and challenging environments,which increased their rate of differentiation.Loss of foraging webs and shifts to web-less behaviors are common and have occurred many times across Araneae (in many families of the RTA clade and family Dysderidae),as discussed previously (Garrison et al.,2016;Kallal et al.,2021).Even though it has been hypothesized that web loss may be a major driver of spider diversification,recent analysis suggests that the absence of webs was not the main factor causing a difference in evolutionary rate (Fernández et al.,2018).Therefore,we hypothesize that spiders in the RTA clade may have accumulated several traits that contributed to a highly mobile lifestyle.
SCIENTIFIC FIELD SURVEY PERMISSION INFORMATION
No specific ethics permits were required for this study.The spider species used in this study are not endangered species and are not included in the “List of Protected Animals in China”.No specific permissions were required for sampling activities.
SUPPLEMENTARY DATA
Supplementary data to this article can be found online.
COMPETING INTERESTS
The authors declare that they have no competing interests.
AUTHORS CONTRIBUTIONS
M.L.Y.conceived and designed the experiments.M.L.,W.T.C.,M.L.,C.W.X.,Y.C.,and F.Z.L.sampled the spider specimens.M.L.,W.T.C.,M.L.,Y.C.,and F.Z.L.conducted the experiments.M.L.,W.T.C.,Q.L.Z.,C.W.X.,and M.L.Y.performed data analyses.M.L.,W.T.C.,Q.L.Z.,and M.L.Y.wrote the manuscript.All authors read and approved the final version of the manuscript.
ACKNOWLEDGMENTS
We thank six anonymous reviewers for providing invaluable comments and suggestions.

- Zoological Research的其它文章
- Towards a primate single-cell atlas
- Protein composition of extracellular vesicles from skin secretions of the amphibian Bombina maxima
- Chromosome-level genome assembly of the freshwater snail Bellamya purificata (Caenogastropoda)
- Liobagrus chengduensis,a new species of torrent catfish (Teleostei:Siluriformes:Amblycipitidae) from the upper Changjiang River basin in southwest China
- A new seamoth species of Pegasus (Syngnathiformes:Pegasidae) from the East China Sea
- Allele-specific expression analyses reveal immune divergences between ibex and goat species