
Intermittent hypoxia is involved in gut microbial dysbiosis in type 2 diabetes mellitus and obstructive sleep apnea-hypopnea syndrome
2022-06-10 07:57:54ShaShaTangChengHongLiangYalLeiLiuWeiWeiXinRuDengXiaoYangShiLiMinWangLiJunZhangHuiJuanYuan
World Journal of Gastroenterology 2022年21期
Sha-Sha Tang, Cheng-Hong Liang,Ya-lLei Liu, Wei Wei, Xin-Ru Deng, Xiao-Yang Shi, Li-Min Wang, Li-JunZhang,Hui-Juan Yuan
Abstract
Key Words: Gut microbiota; Obstructive sleep apnea-hypopnea syndrome; Type 2 diabetes mellitus;Intermittent hypoxia; Obstructive sleep apnea
lNTRODUCTlON
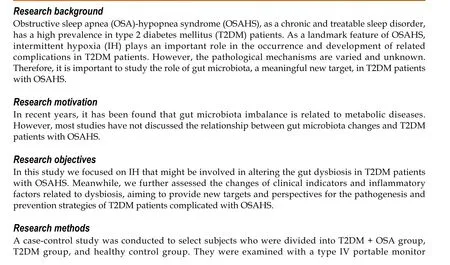
Obstructive sleep apnea (OSA)-hypopnea syndrome (OSAHS) is characterized by recurrent partial or complete pharyngeal obstruction during sleep[1 ], resulting in intermittent hypoxia (IH); cyclical adverse changes in heart rate, blood pressure (BP), and sympathetic activity; and disruption of sleep architecture[2 ]. Epidemiological studies have shown that OSAHS is a globally prevalent chronic sleep disorder,especially in adults with type 2 diabetes mellitus (T2 DM), with rates varying from 23 % to 87 %[3 ,4 ].Moderate to severe OSAHS has been found to be associated with an increase in the incidence of T2 DM,and the incidence of OSAHS in patients with T2 DM was > 50 % higher than that in those without diabetes, independent of traditional risk factors, such as obesity and other confounders. IH, a hallmark of OSAHS, plays an important role not only in the pathogenesis of OSAHS but also in reducing glycemic control and insulin resistance in patients with T2 DM and diabetes-related complications[5 -7 ],probably by activating several systematic inflammatory mediators and enhancing the oxidative stress cascade and hypothalamic-pituitary-adrenal function, among others[8 ].
Commensal bacteria, termed microbiota, cover every surface of our body exposed to the external environment, with 70 % of these residing in the gastrointestinal tract[9 ]. The microbiome is a vast and complex polymicrobial ecosystem that coexists with the human organism and has been identified as playing important roles in the development of host immunological phenotypes. Gut microbiota dysbiosis has been linked to a series of metabolic disorders, such as diabetes and hypertension[10 ]. In a study of IH mimicking OSAHS, in anLdlr-/-mice fed a high-fat diet, the imbalance of gut microbiota was found to be associated with adverse cardiovascular events and metabolic disorders[11 ,12 ].Similarly, sleep fragmentation induced by OSAHS alters feeding behavior and promotes obesity and metabolic abnormalities, while the host gut microbiome changes, leading to increased intestinal permeability and chronic inflammation of adipose tissues[11 ,12 ]. For T2 DM patients with OSAHS, only a few studies have focused on the relationship between severe metabolic disorders caused by IH and gut microbial dysbiosis, independent of conventional risk factors, such as obesity and hypertension.Hence, our study aimed to investigate the gut microbiota changes in T2 DM patients with OSAHS.Clinical indices, such as inflammatory factors and homocysteine (HCY), were compared for the groups as well.
MATERlALS AND METHODS
Participants
In total, 78 participants, including 25 hospitalized patients with T2 DM (Group T2 DM), 27 hospitalized patients with T2 DM complicated by OSAHS (Group T2 DM + OSA), and 26 healthy controls (HC) who were examined with a type IV portable monitor (PM, Sleep Fairy-A7 , China) overnight (from 10 p.m. to 7 a.m.), were recruited from July 2019 to July 2020 . Most of the sleep recording took place in a quiet and comfortable hospital ward at Henan Provincial People’s Hospital; the remainder was performed by participants sleeping at home after being systematically trained in using the PM. The patient-reported periods before sleep onset and after awakening in the morning were excluded before manual scoring[13 ]. We collected fasting blood and fecal samples the next morning. General questionnaires were used to collect information on demographic characteristics and health status.
OSAHS assessment
Pulse oximetry was used to assess oxyhemoglobin saturation, and respiratory effort was measured with a pneumatic sensor attached to an effort belt. Nasal airflow was recorded using a nasal cannula connected to a pressure transducer. The final data were automatically generated by the software system.The scoring rules were based on the 2007 American Academy of Sleep Medicine manual. The apneahypopnea index (AHI) was calculated as the total number of episodes of apnea (continuous cessation of airflow for at least 10 s) and hypopnea (reduction in airflow for ≥ 10 s with oxygen desaturation of ≥ 4 %)divided by the total duration of sleep events, and OSAHS was defined as an AHI of 5 events/h.
Inclusion and exclusion criteria
The inclusion criteria were as follows: (1 ) Age of 18 -70 years; (2 ) Treatment-na?ve type 2 diabetes based on the 1999 World Health Organization Criteria[14 ]; (3 ) 6 .5 % ≤ glycated hemoglobin A1 c (HbA1 c) ≤11 %; (4 ) No antibiotic use within the 12 wk before enrollment and no probiotics and/or prebiotics; and(5 ) No glucose-lowering drugs other than insulin during the 12 wk before enrollment in patients with diabetes.
The exclusion criteria were as follows: (1 ) Body mass index (BMI) of > 28 kg/m2 ; (2 ) Diagnoses of chronic respiratory disease, central system sleep apnea syndrome, severe heart failure, BP of ≥ 140 /90 mmHg, and severe organic diseases such as cancer, myocardial infarction, and stroke; (3 ) Diagnoses of other types of diabetes, for example, type 1 diabetes; (4 ) Diagnoses of inflammatory bowel disease,coagulation disorders, connective tissue diseases, or gastrointestinal surgery, except for appendicitis and hernia surgery; (5 ) Participation in other programs during the previous 3 mo; (6 ) Alcoholism(drinking more than five times in 1 wk: > 100 g of spirits, 250 g of rice wine, or 5 bottles of beer); (7 )Pregnancy; and (8 ) Taking drugs that may affect respiratory function, for example, anxiolytics,hypnotics, or mood stabilizers.
Sample collection
Biological samples and anthropometric data were obtained without medical treatment. Blood samples were collected after overnight fasting and centrifuged using centrifuge (Multifuge X3 R, Thermo Fisher Scientific, United States) at 3000 rpm for 20 min after standing at 24 °C for 30 min to obtain serum. Fresh fecal samples, morning urine, and serum samples were immediately frozen on dry ice after collection and stored at -80 °C until further analysis.
Clinical indices
Fasting plasma glucose (FPG) concentrations were measured with the Automatic Biochemical Analyzer(TBA-120 FR, Toshiba, Japan). Fasting insulin concentrations were measured using immunochemiluminometric assays (ADVIA Centaur, Siemens A.G., German). Plasma HbAlc concentrations were measured by high-performance liquid chromatography (Bio-Rad D-10 , Bio-Rad Laboratories Co., Ltd.,Germany). Routine blood tests were performed using the Swelab Alfa Cell analyzer (Boule Diagnostics AB, Sweden). The Homeostatic Model Assessment for Insulin Resistance (HOMA-IR) was calculated using the following formula: FPG*FIN/22 .5 , where FIN is fasting insulin.
Inflammatory factors and HCY
C-reactive protein (CRP) and HCY concentrations were measured with the Automatic Biochemical Analyzer. The determination of the plasma concentrations of the lipopolysaccharide-binding protein(LBP), interleukin (IL)-6 , IL-17 , and transforming growth factor (TGF)-β1 was performed using human ELISA kits according to the manufacturer's instructions. The ELISA kits for the assessment of the concentrations of human LBP, tumor necrosis factor (TNF)-α, IL-17 , and TGF-β1 were all from Cusabio Biotech, Wuhan, China. The kits for high sensitivity IL-6 were purchased from Multi-Science,Hangzhou, China.
1 6 S rRNA gene amplification sequencing
The DNA of the participants was extracted using the E.Z.N.A.?Stool DNA Kit (Omega Bio-tek, Inc.,Norcross, GA, Unite States). The isolated DNA was used as the template for polymerase chain reaction(PCR) amplification of the V3 -V4 region of 16 S rRNA genes. The forward primer (341 F) was 5 '-CCTACGGGNGGCWGCAG-3 ', and the reverse primer (805 R) was 5 '-GACTACHVGGGTATCTAATCC-3 .' PCR was performed with an EasyCycler 96 PCR system (Analytik Jena Corp., AG), and the products from different samples were indexed and mixed at equal ratios for sequencing by Shanghai Mobio Biomedical Technology Co. Ltd. using the Miseq platform (Illumina Inc., San Diego, CA, Unite States) according to the manufacturer’s instructions.
Sequencing data analysis
Amplicon sequence variants (ASVs) were identified with the DADA2 algorithm. The representative sequences for each ASV were annotated using the SILVA reference database (SSU138 ). The alpha diversity metrics (Shannon-Wiener diversity index and Simpson diversity index) were assessed by using Mothur v1 .42 .1 . The non-parametric Mann-Whitney U test was used to test for significant differences between the two groups. The comparison of multiple groups was performed using a nonparametric Kruskal-Wallis test. Principal coordinates analysis (PCoA) based on Bray-Curtis and unweighted UniFrac distance was conducted using the R program (version 3 .6 .0 , http://www.Rproject.org/) to display microbiome space between samples. The key ASVs associated with T2 DM and OSA were identified by random forest models, and those significantly associated with BMI selected by MaAsLin2 (https://github.com/biobakery/Maaslin2 ) were removed. A heatmap plot was drawn to indicate the distributions of the rest of the key ASVs. The linear discriminant analysis effect size (LEfSe)method (lefse 1 .1 , https://github.com/SegataLab/Lefse) was used to detect taxa with differential abundance. PICRUSt2 v2 .4 .1 (https://github.com/picrust/picrust2 /wiki) was used to predict functional abundance based on 16 S rRNA gene sequences.
Statistical analyses
Continuous variables are expressed as means ± SD or medians with interquartile ranges for normal distribution data or non-normal distribution data, respectively. Categorical variables are expressed as percentages. All the statistical analyses, including one-way analysis of variance, Kruskal-Wallis test,Mann-Whitney U test, and least significant differencet-test, were performed using SPSS version 26 .0 ,with a two-sidedPvalue of < 0 .05 denoting statistical significance. Significant differences were adjusted by Bonferroni correction. The correlation coefficients for the concentrations of the gut microbiota,inflammatory factors, and HCY were evaluated using Spearman correlation.
RESULTS
Clinical parameters and inflammatory levels among three groups
Applying the strict inclusion and exclusion criteria described above, a total of 78 fecal samples were collected for analysis after PM assessment. We characterized the clinical indices and gut microbiomes of patients in groups HC, T2 DM, and T2 DM + OSA (Figure 1 ). There were no significant differences in sex and age among the three groups (P> 0 .05 ). Compared with group T2 DM, there were no significant differences in the insulin resistance index (HOMA-IR), BMI, waist-to-hip ratio, neck circumference, FPG,HbA1 c, systolic BP, and diastolic BP in group T2 DM + OSA; however, they were significantly increased compared with those in group HC (P< 0 .05 ).
The HCY level was the highest in group T2 DM + OSA compared with the other two groups. Our PM data revealed that the AHI and oxygen desaturation index (ODI) increased significantly, accompanied by a decrease in the mean oxygen saturation (SpO2); group T2 DM + OSA had lower SpO2 than group HC. Further details on the clinical parameters of the participants with diverse severities are shown in Table 1 .
The concentration of CRP increased gradually from the HC group to the T2 DM group and even more in the T2 DM + OSA group. In addition, the levels of TNF-α, IL-17 , IL-6 , and LBP increased and the levels of TGF-β1 decreased in group T2 DM + OSA compared with those in group HC, while the level of TNF-α increased compared with that in group T2 DM (P < 0 .05 ) (Figure 2 and Supplementary Table 1 ).
IH is related to differences in the gut microbiota of T2 DM + OSA patients
The resulting rarefaction curves showed that the microbial richness of the sampled guts was near saturation at the applied sequencing depth (Supplementary Figure 1 ), which was sufficient to identify most of the bacterial community members for each microbiome. The alpha diversity of the gut microbiota expressed by the Shannon estimator, ACE estimator, and Simpson index (Figure 3 A-C andSupplementary Table 2 ) showed that there were no significant differences in groups HC, T2 DM, and T2 DM + OSA (P > 0 .05 ). The overall structures of the gut microbiota in the three groups showed a minimal difference as revealed by the PCoA plot (Figure 3 D); however, the difference was not significant (Adonis,P> 0 .05 ).

Table 1 Participant characteristics and clinical parameters
We further analyzed the taxonomic composition and alterations of the gut microbiome. The composition and abundance of the bacterial community in each sample at the phylum and genus levels are shown in Supplementary Figure 2 . At the phylum level,FirmicutesandProteobacteriawere the dominant bacteria in groups HC, T2 DM, and T2 DM + OSA (Figure 4 A). At the genus level, we found no significant differences in the relative abundance ofEscherichia-Shigella,which had the highest abundance among the three groups (P> 0 .05 ) (Figure 4 B). The relative abundance of the following genera significantly differed among groups:Faecalibacterium(P= 0 .0434 ), Streptococcus (P = 0 .0393 ),Haemophilus(P= 0 .0286 ), Phascolarctobacterium (P = 0 .0242 ), and Oscillibacter (P = 0 .0274 ) (Figure 4 C).Among the above genera, the levels ofPhascolarctobacteriumdecreased and the levels ofOscillibacterincreased in group T2 DM + OSA compared with group T2 DM, and the levels ofFaecalibacteriumsignificantly decreased in group T2 DM + OSA compared with group HC. A gradually decreasing trend ofFaecalibacteriumabundance from group HC to groups T2 DM and T2 DM + OSA was observed(Figure 4 C). Through LEfSe, we also found a significant decrease in the level ofFaecalibacteriumin group T2 DM + OSA (Figure 4 D).
We found 12 ASVs associated with gut microbial dysbiosis in group T2 DM + OSA compared with group T2 DM, including ASV632 (Streptococcus), ASV450 (Clostridiaceae_Clostridium_sensu_stricto),ASV352 (Faecalibacterium), ASV511 (Roseburia), ASV307 ([Eubacterium]_hallii_group), ASV1000 ([Eubacterium]_eligens_group), ASV995 (Blautia), ASV584 (Eggerthella), ASV535 (Erysipelotrichaceae_UCG-003 ), ASV87 (Phascolarctobacterium), ASV1112 (Prevotella), and ASV548 (Oscillibacter). On comparing groups HC and T2 DM + OSA, 15 ASVs were different: ASV450 (Clostridiaceae_Clostridium_sensu_stricto),ASV511 (Roseburia), ASV1000 ([Eubacterium]_eligens_group), ASV266 (Lachnospiraceae_unclassified),ASV763 (Lachnospiraceae_unclassified), ASV367 (Faecalibacterium), ASV779 (Actinomyces), ASV986(Haemophilus), ASV352 (Faecalibacterium), ASV436 (Faecalibacterium), ASV265 (Streptococcus), ASV535 (Erysipelotrichaceae_UCG-003 ), ASV68 (Blautia), ASV347 (Saccharimonadales), and ASV1022 (Acinetobacter)(Figure 5 A). Therein, the relative abundance of ASV1022 (Acinetobacter), ASV367 (Faecalibacterium),ASV436 (Faecalibacterium), ASV763 (Lachnospiraceae_unclassified), and ASV266 (Lachnospiraceae_unclassified) were progressively decreased, and the abundance of ASV779 (Actinomyces) increased from group HC to group T2 DM and to group T2 DM + OSA (Figure 5 B).
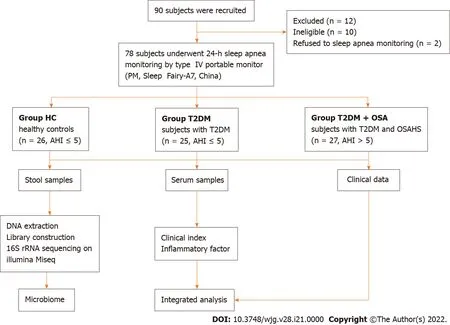
Figure 1 Flowchart of the study.
IH-related gut microbiota dysbiosis was associated with abnormal metabolic and inflammatory indicators of T2 DM + OSA patients
We further studied the correlations among metabolic indicators, inflammatory factors, and the above six key ASVs with ascending or decreasing trends. Spearman correlation analysis revealed that the decreased abundance of ASVs showed a significant negative correlation with indicators related to IH or respiratory disorders, such as the ODI and AHI; glucose metabolism indicators, such as HbA1 c, FPG,and HOMA-IR; cardiovascular disease-related metabolic indicators, such as HCY; and inflammatory factors, such as CRP, TNF-α, and LBP. The ASV436 (Faecalibacterium) was negatively correlated with the AHI, ODI, FPG, HbA1 c, CRP concentrations, and HOMA-IR, while the ASV763 (Lachnospiraceae_unclassified) was negatively correlated with the AHI and FPG, HbA1 c, CRP, and LBP concentrations (P < 0 .05 ).Furthermore, the ASV436 (Faecalibacterium), ASV1000 ([Eubacterium]_eligens_group), and ASV367 (Faecalibacterium) were positively correlated with the mean SpO2, another IH-related indicator. Among the three groups, the gradually increasing abundance of ASV779 (Actinomyces) showed an opposite relationship; it was significantly positively correlated with the AHI, ODI, and TNF-α concentration and negatively correlated with the mean SpO2(P < 0 .05 ) (Figure 6 and Supplementary Table 3 ).
DlSCUSSlON
T2 DM has been linked to gut dysbiosis and chronic inflammation in several clinical and animal experiments[15 -17 ], which may be a consequence of the loss of or deficiency in a beneficial function,such as short-chain fatty acid (SCFA)-producing bacteria production from carbohydrate fermentation, in the gut ecosystem[16 ]. Diseases previously partially attributed to lifestyle, such as obesity and OSAHS,are now considered microbiota-related as well[12 ,18 ]. Although much epidemiological and clinical evidence has suggested that OSAHS is an independent risk factor for the development of T2 DM[19 ], the underlying pathogenesis of altered glucose metabolism in T2 DM patients with OSAHS remains to be elucidated. Meanwhile, a longitudinal cohort study over a period of 6 years found that the insulin resistance index (HOMA-IR) was a predictor of incident “witnessed apnea”, independent of obesity[20 ]. This showed that dysglycemia and insulin resistance may lead to the development of OSAHS.Together with the findings of the above-mentioned studies, this strongly suggests that the relationship between T2 DM and OSAHS may be bidirectional[2 ]. Therefore, it is necessary to investigate whether the imbalance of the intestinal microbiota plays a key role in the pathophysiology underlying metabolic dysfunction of patients with T2 DM complicated by OSAHS.
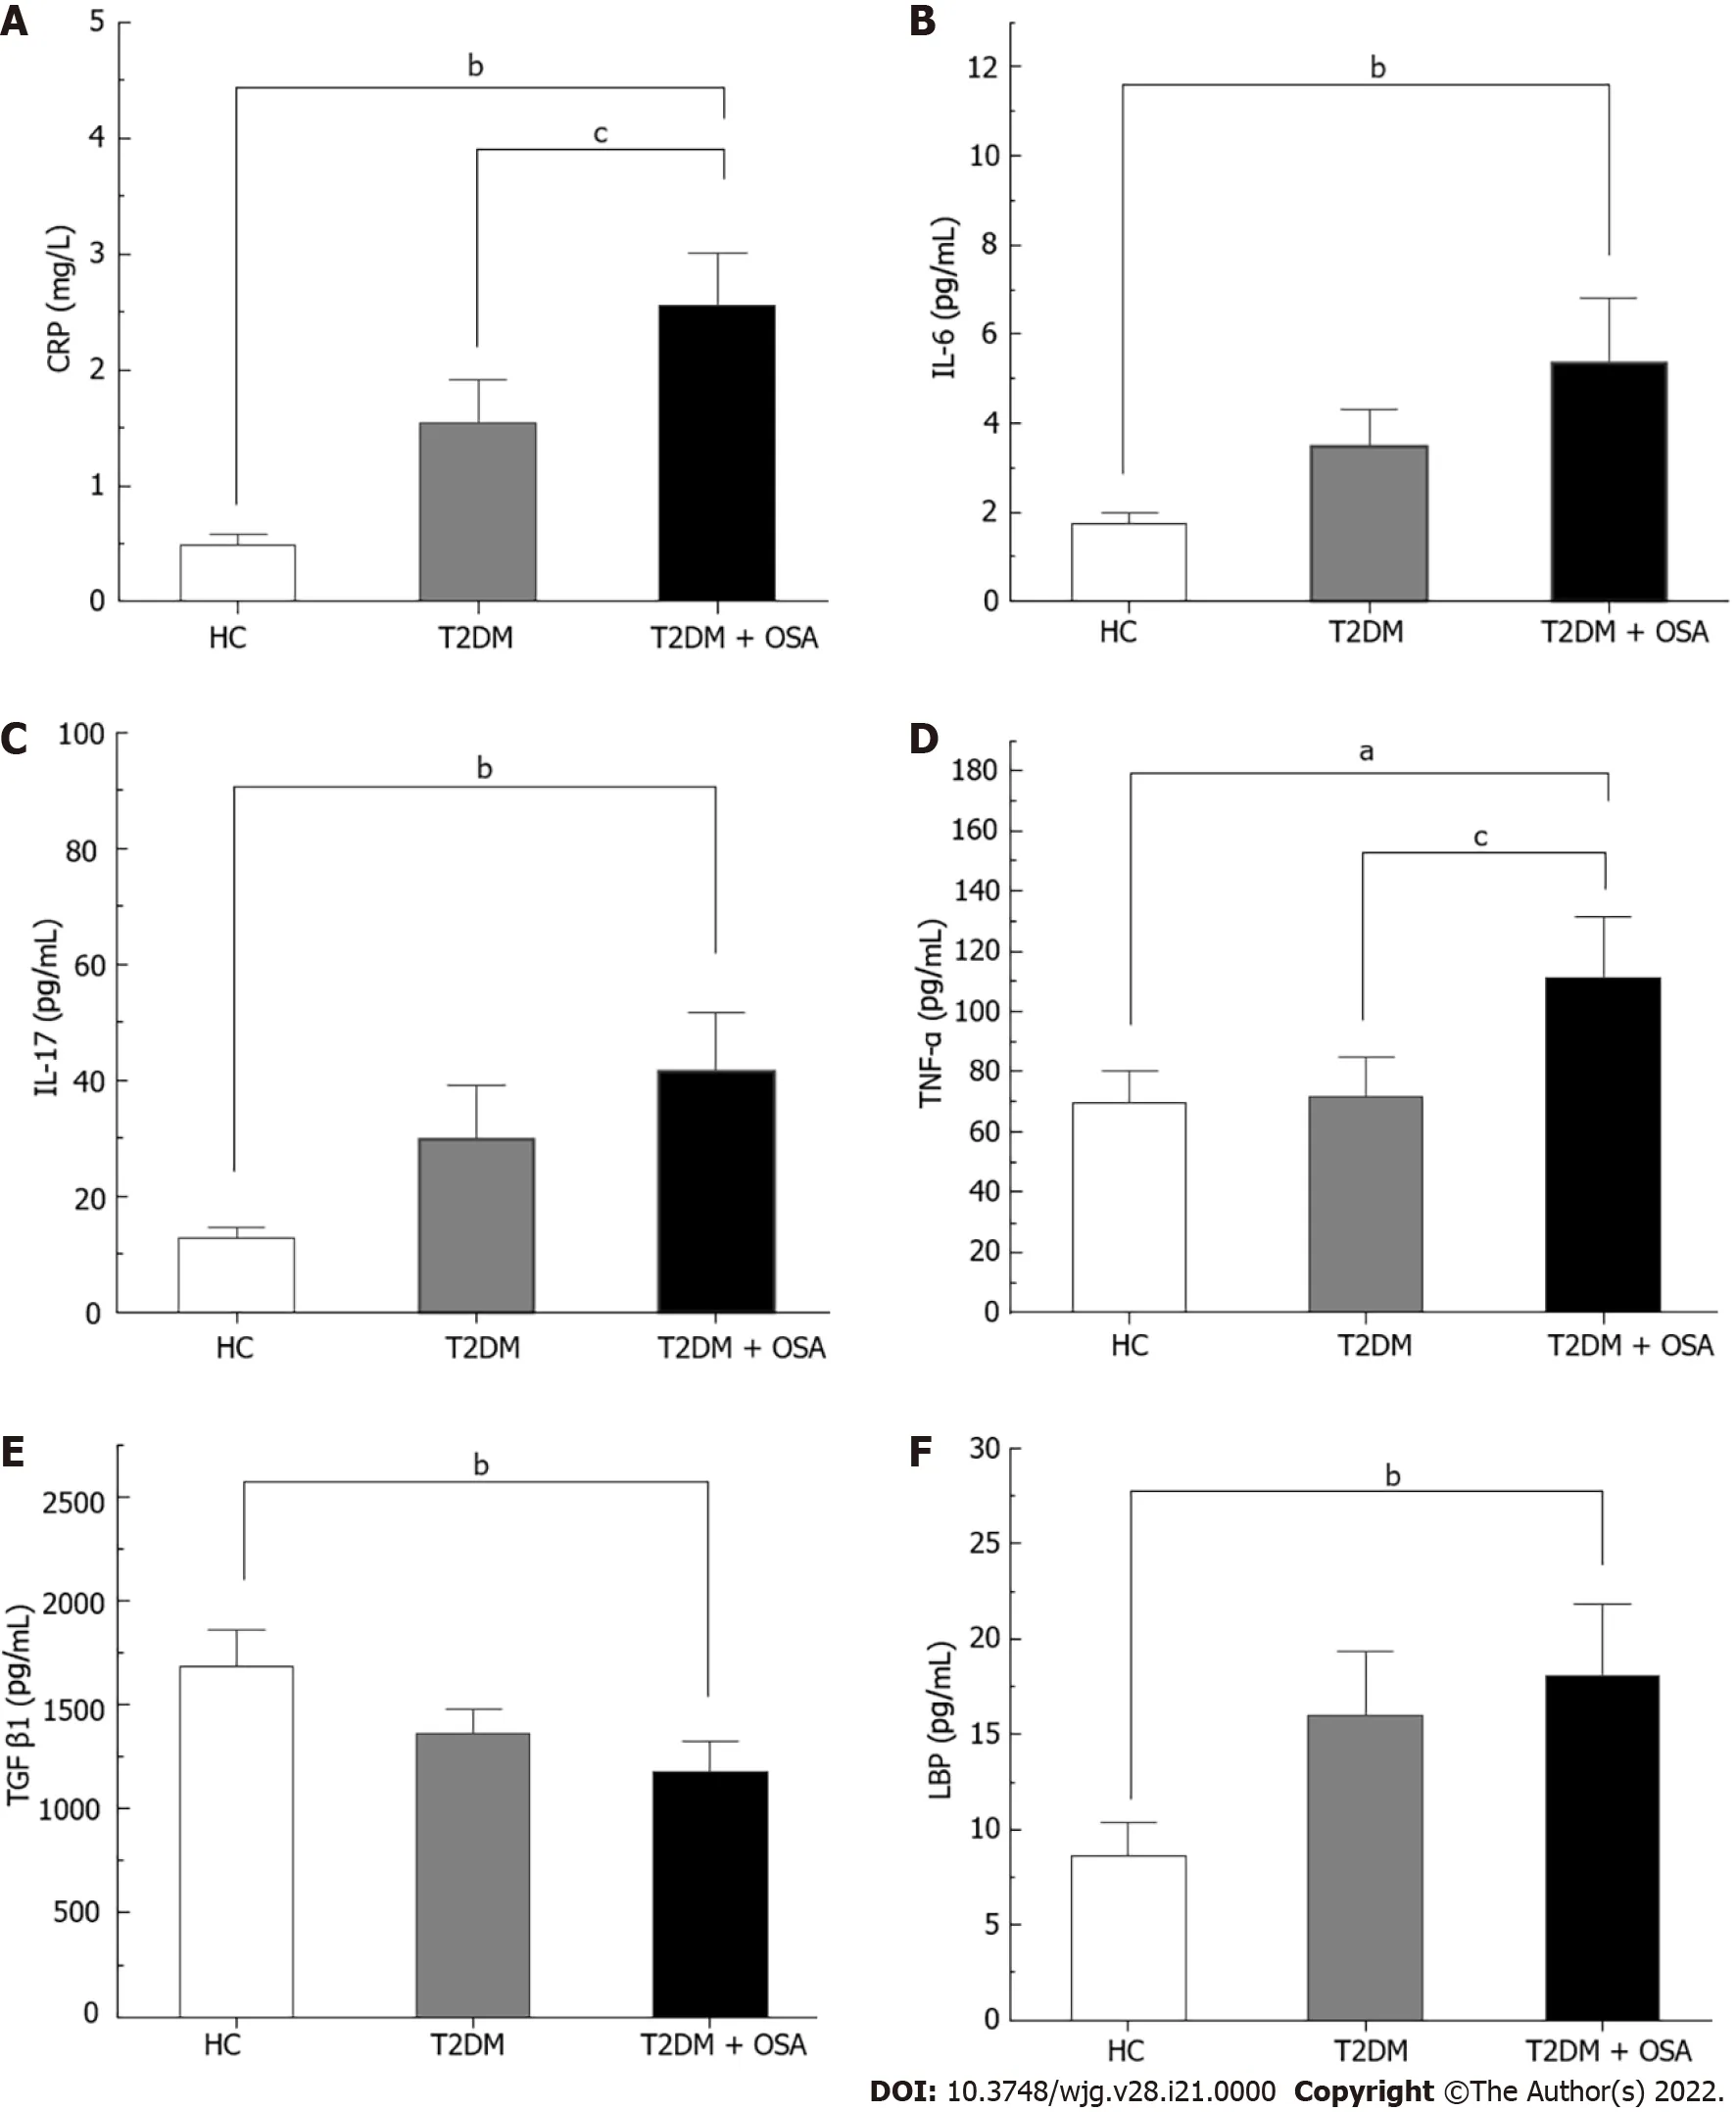
Figure 2 The concentrations of inflammatory factors in groups healthy control, type 2 diabetes mellitus, and type 2 diabetes mellitus plus obstructive sleep apnea. A: CRP; B: IL-6 ; C: IL-17 ; D: TNF-α; E: TGF-β1 ; F: LBP. Bar charts show the means ± SE of the mean. aP < 0 .05 vs healthy control(HC); bP < 0 .01 vs HC; cP < 0 .05 vs type 2 diabetes mellitus. The P value was based on Kruskal-Wallis test or one-way ANOVA. A significant difference was shown by the least significant difference t-test or Mann-Whitney U test. Significant differences were adjusted by Bonferroni correction. CRP: C-reaction protein; IL-6 :Interleukin-6 ; IL-17 : Interleukin-17 ; TNF-α: Tumor necrosis factor-α; TGF-β1 : Transforming growth factor beta 1 ; LBP: Lipopolysaccharide-binding protein; HC:Healthy control; T2 DM: Type 2 diabetes mellitus; OSA: Obstructive sleep apnea.
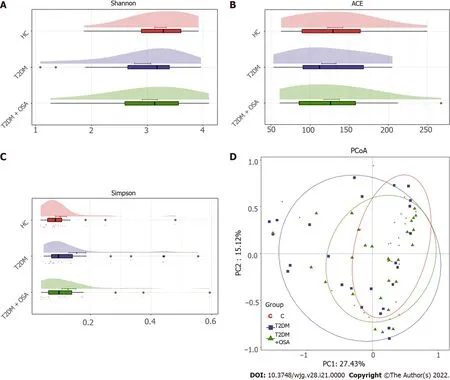
Figure 3 The gut microbial diversity and structures of the gut microbiota in groups healthy control, type 2 diabetes mellitus, and type 2 diabetes mellitus plus obstructive sleep apnea. A: Shannon index; B: ACE estimator; C: Simpson index; D: Principal coordinates analysis plot of the gut microbiota among groups healthy control, type 2 diabetes mellitus, and type 2 diabetes mellitus plus obstructive sleep apnea. HC: Healthy control; T2 DM: Type 2 diabetes mellitus; OSA: Obstructive sleep apnea.
In our study, the sequencing analysis of the 16 S rRNA gene-tags applied to fecal samples from T2 DM patients complicated by OSAHS showed differences in the relative abundances of the predominant taxa of the genera levels. We found that the concentrations of various IH-related gut bacteria, including SCFA-producing bacteria such asFaecalibacteriumandLachnospiraceae,were significantly correlated with the concentrations of FPG HbA1 c and HOMA-IR, as well as the concentration of HCY, a risk predictor of hypertension and arteriosclerosis[21 ,22 ]. IH can result in hypoxia/re-oxygenation cycling events within the gut microbiome and, as a result, the biological diversity of gut microorganisms may be modified[16 ]. Although the intestinal epithelium is significantly resistant to hypoxia, regulating the absorption and barrier function of the intestinal epithelium is sensitive to the oxygen level in the intestine[23 ]. Hypoxia/re-oxygenation can directly impair cellular functionviaan increase in permeability and bacterial translocation and a decrease in tight junction integrity[16 ]. In addition,studies have shown that after prolonged normoxic recovery after IH exposure, the gut microbiota and circulating endotoxemia remain negatively affected[8 ]. Our results do not show significant differences in α-diversity and β-diversity. However, the gradual decrease in the relative abundance of SCFAproducing bacteria (such as the ASVs ofFaecalibacterium,Eubacterium,andLachnospiraceae) associated with abnormal indicators of oxygen metabolism, as well as elevated levels of inflammatory indicators(including CRP, IL-17 , and TNF-α), which are critically involved in the development of insulin resistance and pathogenesis of T2 DM, was observed in T2 DM + OSA patients[24 ]. Emerging evidence shows that SCFAs can modulate glycemic control, exhibit anti-inflammatory and antitumorigenic activity, and decrease oxidative stress[25 -28 ]. Short chain fatty acids contribute to mucin synthesis,decrease bacterial translocation, maintain gut integrity, and mitigate inflammation in the intestine[29 ,30 ]. Thus, we speculated that SCFAs may be regarded as potential targets for recognizing metabolic comorbidities in patients with T2 DM complicated by OSAHS.
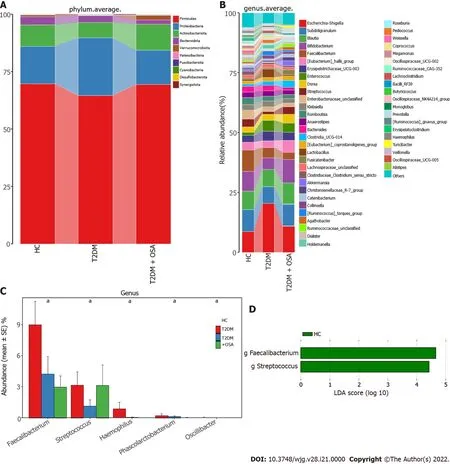
Figure 4 Average compositions and relative abundance of the bacterial community among three groups at different levels. A: Average relative abundance histogram of dominant species composition stratified by group at the phylum levels; B: Average relative abundance histogram of dominant species composition stratified by group at the genus levels; C: Histograms for genera with significant differences. Bar chart showing the mean ± SE of each group; D: Linear discriminant analysis analysis column diagram. LDA: Linear discriminant analysis. aP < 0 .05 . Significant difference shown by the Kruskal-Wallis rank-sum test.
There are several potential mechanisms by which IH mediates its effect on metabolic dysfunction. It induces macrophages to polarize toward the pro-inflammatory subtype of M1 , leading to the production of more pro-inflammatory mediators in visceral adipose tissue, such as TNF-α, IL-6 , and IL-8 , resulting in subsequent impairment of insulin signaling pathways and insulin resistance[7 ]. Here, we found that the concentration ofLachnospiraceaewas negatively correlated with that of LBP, which is one of the reference indicators of intestinal barrier disruption, suggesting that the induction of inflammatory processes may be due to the leakage of microbial metabolites into the circulation induced by IH. We found certain changes in the gut microbiota among the three groups over time; however, there were no significant differences between patients with T2 DM with and without OSAHS. Nonetheless, the concentrations of inflammatory indicators, such as CRP, TNF-α, and IL-17 , were significantly increased in T2 DM patients with OSAHS, which indicates that the changes in gut microbiota may have been delayed relative to the chronic inflammatory changes in T2 DM patients with OSAHS. On the other hand, some patients with relatively mild disease were included to prevent confounding by factors, including hyperglycemia and obesity, which affect the composition of intestinal microbiota[31 ]; as a result, the intestinal flora appeared not to have changed remarkably.
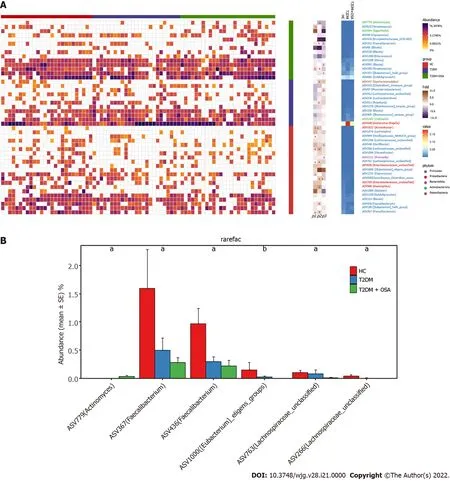
Figure 5 Amplicon sequence variants contributing to the changes in the gut microbiota in groups healthy control, type 2 diabetes mellitus, and type 2 diabetes mellitus plus obstructive sleep apnea. A: The heatmap shows the relative abundance of the 46 amplicon sequence variants (ASVs) significantly different in the three groups. The fold ratio (log2 -transformed) indicated the relative abundance of the 46 ASVs between the two different groups [P1 : Type 2 diabetes mellitus (T2 DM) + obstructive sleep apnea (OSA) vs T2 DM; P2 : T2 DM + OSA vs healthy control (HC); P3 : HC vs T2 DM]. aP < 0 .05 , bP <0 .01 , cP < 0 .001 . Significant difference shown by the Mann-Whitney U test; B: With the increase in disease components, six key ASVs showed increasing or decreasing trends. aP < 0 .05 , bP < 0 .01 .
Various respiratory diseases have been associated with dysbiosis not only in the airway microbiota but also in the intestinal microbiota[32 ,33 ]. This evidence reinforced the existence of a gut-lung axis and the close relationship between intestinal and respiratory compartments; changes at one of the two sites could impact the other[34 ]. As a minor constituent of the airway microbiota,Actinomycesis related to anaerobic enzymes through GLUT1 -dependent glucose elevation and MCT4 -dependent lactate transport[35 ,36 ]. In our study, we observed that the increase in the relative abundance ofActinomyceswas positively correlated with OSAHS severity indices and the concentration of TNF-α. We did not test for lung microbes; however, we speculate that they may be related to the gut-lung axis. Further experimental approaches to exploring causal links may be needed.
There are some limitations to our study. First, the sample size was relatively small. Second, the causal relationship between T2 DM complicated by OSAHS and the gut microbiota was unclear. Large-scale clinical trials and gnotobiotic mice model validation may be required in the future.
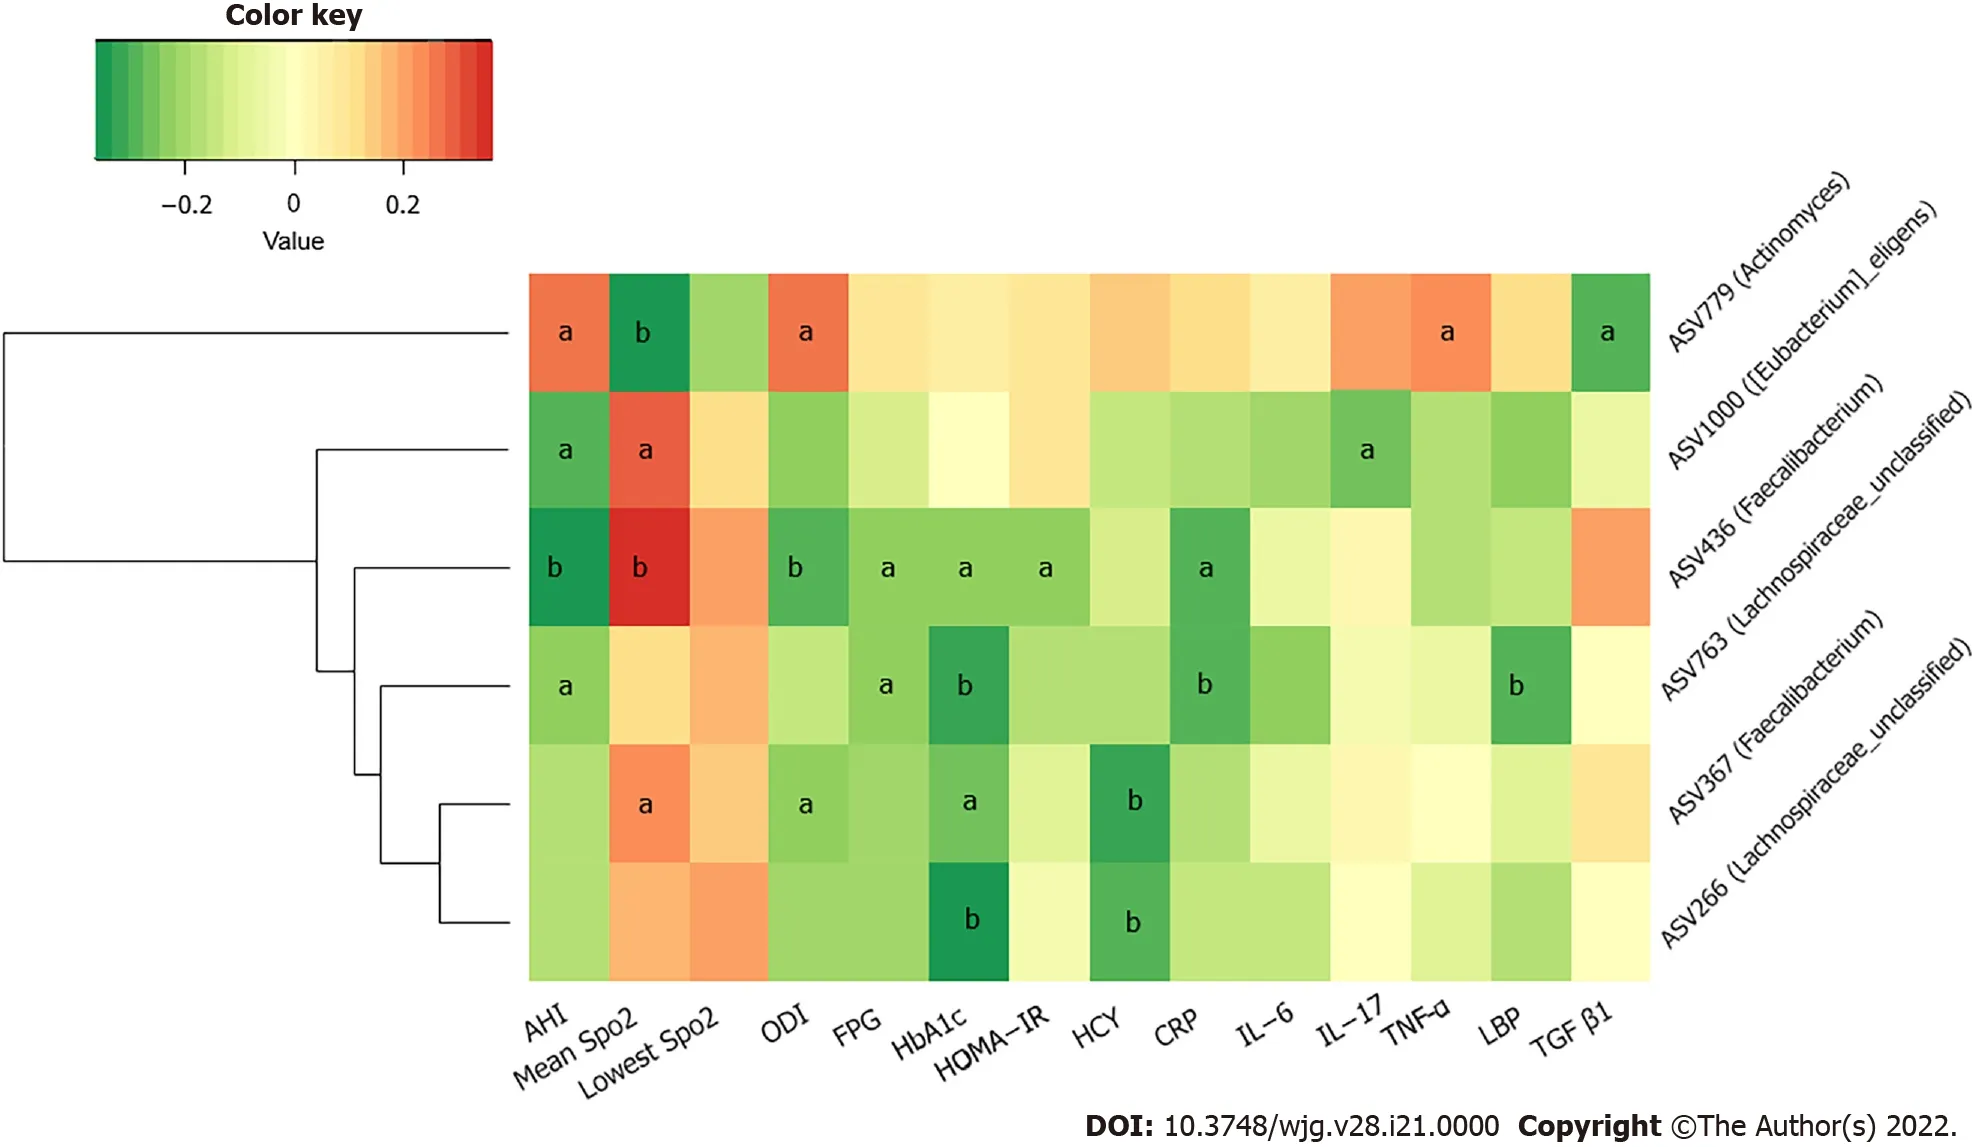
Figure 6 Heatmap of correlation among key amplicon sequence variants of gut microbiota and metabolic and inflammatory indicators.The color of the cells represents the Spearman’s correlation coefficient between each amplicon sequence variant and clinical parameter. aP < 0 .05 ; bP < 0 .01 .
CONCLUSlON
T2 DM patients with OSAHS may have a higher prevalence of gut microbial dysbiosis. IH may be involved in selective alterations of gut microbiota, which may be related to increased gut permeability and concurrent systemic inflammatory changes in patients with T2 DM complicated by OSAHS. These findings provide foundations for further studies on the mechanisms and interventional approaches aimed at restoration of the gut microbiota to prevent or to palliate the adverse effects of T2 DM patients with OSAHS.
ARTlCLE HlGHLlGHTS

Research results
Among the three groups, T2 DM + OSA group showed the most severe changes in sleep apnea parameters and increased systemic inflammatory factors. We found the decreased levels of short-chain fatty acid-relatedFaecalibacterium, Eubacterium,andLachnospiraceaeand the increased levels ofActinomycesat the amplicon sequence variant level. The changes in these gut microbiotas were closely related to clinical indicators as well.
Research conclusions
IH may be involved in the selective changes of intestinal microbiota, which may be related to the increased intestinal permeability and systemic inflammation response in T2 DM patients with OSAHS.
Research perspectives
This study shows that IH may change the state of gut microbiota and systemic inflammation, which participate in the occurrence and development of T2 MD complicated with OSAHS. In the future, largescale clinical randomized controlled prospective trials and animal trials may be needed to further explore the corresponding causality.
ACKNOWLEDGEMENTS
We would like to thank the participants involved in this study.
FOOTNOTES
Author contributions:Tang SS designed the research and conducted microbiome analysis; Liu YL conducted the research except the microbiome analysis; Tang SS and Liang CH analyzed the microbiome data and wrote the paper;all other data were analyzed by Shi XY and Deng XR with oversight by Wei W; Zhang LJ and Wang LM were responsible for the data acquisition and input and proofreading of the manuscript; Tang SS and Yuan HJ had primary responsibility for the final content; all authors have read and approved the final manuscript.
Supported byNational Natural Science Foundation of China, No. 81970705 ; and Central Plains Thousand Talents Plan, No. 204200510026 .
lnstitutional review board statement:This study was reviewed and approved by the Ethics Committee of Henan Provincial People’s Hospital (IRB No. 2019 -62 ).
lnformed consent statement:All study participants provided informed written consent before the study enrollment.
Conflict-of-interest statement:All authors declare no conflicts of interest.
Data sharing statement:Raw sequencing data and associated metadata were deposited in the NCBI short-read archive with BioProject accession number PRJNA788301 .
STROBE statement:The authors have read the STROBE Statement—checklist of items, and the manuscript was prepared and revised according to the STROBE Statement—checklist of items.
Open-Access:This article is an open-access article that was selected by an in-house editor and fully peer-reviewed by external reviewers. It is distributed in accordance with the Creative Commons Attribution NonCommercial (CC BYNC 4 .0 ) license, which permits others to distribute, remix, adapt, build upon this work non-commercially, and license their derivative works on different terms, provided the original work is properly cited and the use is noncommercial. See: https://creativecommons.org/Licenses/by-nc/4 .0 /
Country/Territory of origin:China
ORClD number:Sha-Sha Tang 0000 -0002 -1307 -3124 ; Cheng-Hong Liang 0000 -0003 -0661 -9472 ; Ya-Lei Liu 0000 -0003 -0946 -4605 ; Wei Wei 0000 -0003 -1045 -1449 ; Xin-Ru Deng 0000 -0003 -3747 -9310 ; Xiao-Yang Shi 0000 -0001 -7917 -2048 ; Li-Min Wang 0000 -0002 -6396 -390 X; Li-Jun Zhang 0000 -0003 -1401 -5775 ; Hui-Juan Yuan 0000 -0002 -0486 -0994 .
S-Editor:Fan JR
L-Editor:A
P-Editor:Yu HG
 World Journal of Gastroenterology2022年21期
- World Journal of Gastroenterology的其它文章
- Endoscopic ultrasound-guided injectable therapy for pancreatic cancer: A systematic review
- Socioeconomics and attributable etiology of primary liver cancer, 1990 -2019
- Peripancreatic paraganglioma: Lesson from a round table
- Differentiating malignant and benign focal liver lesions in children using CEUS LI-RADS combined with serum alpha-fetoprotein
- Serotonin type 3 receptor subunit gene polymorphisms associated with psychosomatic symptoms in irritable bowel syndrome: A multicenter retrospective study
- Impact of radiotherapy on the immune landscape in oesophageal adenocarcinoma