Optimal bandwidth selection for retrieving Cu content in rock based on hyperspectral remote sensing
MA Xiumei ,ZHOU Kefa ,WANG Jinlin* ,CUI Shichao ,ZHOU Shuguang ,WANG Shanshan ,ZHANG Guanbin
1 State Key Laboratory of Desert and Oasis Ecology,Xinjiang Institute of Ecology and Geography,Chinese Academy of Sciences,Urumqi 830011,China;
2 Xinjiang Key Laboratory of Mineral Resources and Digital Geology,Xinjiang Institute of Ecology and Geography,Chinese Academy of Sciences,Urumqi 830011,China;
3 Xinjiang Research Centre for Mineral Resources,Xinjiang Institute of Ecology and Geography,Chinese Academy of Sciences,Urumqi 830011,China;
4 University of Chinese Academy of Sciences,Beijing 100049,China;
5 Xinjiang Academy of Science and Technology for Development Strategy,Urumqi 830011,China
Abstract:Hyperspectral remote sensing technology is widely used to detect element contents because of its multiple bands,high resolution,and abundant information.Although researchers have paid considerable attention to selecting the optimal bandwidth for the hyperspectral inversion of metal element contents in rocks,the influence of bandwidth on the inversion accuracy are ignored.In this study,we collected 258 rock samples in and near the Kalatage polymetallic ore concentration area in the southwestern part of Hami City,Xinjiang Uygur Autonomous Region,China and measured the ground spectra of these samples.The original spectra were resampled with different bandwidths.A Partial Least Squares Regression (PLSR) model was used to invert Cu contents of rock samples and then the influence of different bandwidths on Cu content inversion accuracy was explored.According to the results,the PLSR model obtains the highest Cu content inversion accuracy at a bandwidth of 35 nm,with the model determination coefficient (R2) of 0.5907.The PLSR inversion accuracy is relatively unaffected by the bandwidth within 5-80 nm,but the accuracy decreases significantly at 85 nm bandwidth (R2=0.5473),and the accuracy gradually decreased at bandwidths beyond 85 nm.Hence,bandwidth has a certain impact on the inversion accuracy of Cu content in rocks using the PLSR model.This study provides an indicator argument and theoretical basis for the future design of hyperspectral sensors for rock geochemistry.
Keywords:hyperspectral remote sensing;Cu element;bandwidth;Partial Least Squares Regression;inversion accuracy;Kalatage polymetallic ore concentration area
1 Introduction
Mineral resources play significant roles in national economic development and guarantee national security (Xu and Wang,2011).The scarcity of mineral resources is a serious problem faced by many countries around the world,especially China.With the increasing difficulty and cost of prospecting,the development of shallow deposits has been abandoned,and efforts have gradually shifted to the exploration of concealed deposits (Cao et al.,2009).
At present,many methods are employed to detect hidden deposits,including model prospecting prediction methods,physical detection methods,chemical detection methods,etc.Rock geochemistry,which combines petrology with geochemistry,is a chemical detection method that determines the anomalous regions of ore-forming elements by detecting the contents of major elements and trace elements in rocks,which provides a basis for prospecting.However,traditional rock geochemistry has some disadvantages of being time-consuming,labor-intensive,and costly,and it is limited to the measurements of point data (Hecker et al.,2019).Nevertheless,with the continuous development of high-resolution remote sensing technology,it has been widely applied to the prediction of mineralization (Ge,2017).Hunt (1977) concluded that elements with characteristic absorption bands are limited in the visible-near-infrared (VNIR) spectral range,but include the most common mineralization indicator elements in metal mineral exploration,such as Fe,Cu,Mn,Cr,and Ni.This finding established the theoretical basis of quantitative inversion models for ore-forming elements based on reflectance spectroscopy.Due to its multiband nature,high resolution,and strong continuity,hyperspectral technology can quickly acquire the spectral information of features without destroying sample;it thus provides a powerful method for the quantitative and semiquantitative prediction of ore-forming elements.
In recent years,based on high spectral resolution data and element content data from research on element content estimation models,considerable progress has been made.Although current studies on estimation models for ore-forming elements are still in their beginning and exploratory stages,some scholars at home and abroad have leveraged the successes of soil spectral reflectance data to estimate the contents of heavy metal elements (Ben-Dor and Banin,1994;Ben-Dor,2000;Islam et al.,2003;Wu et al.,2007;Cheng et al.,2018).Hyperspectral data have many bands and high redundancy,and the Partial Least Squares Regression (PLSR) method can be applied to a continuous spectrum with many bands and serious autocorrelation,which can effectively improve the quantitative inversion accuracy of metal elements (Wang et al.,2007).Based on the PLSR method,many researchers (e.g.,Kemper and Sommer,2002;Gong et al.,2010;Liu et al.,2010;Cong et al.,2013;Yang et al.,2017) have used the characteristic bands to invert the metal element content;they focused mainly on the band position and spectral index and considered how to select the optimal band.However,these studies ignored the effect of bandwidth on the inversion accuracy.Different types of hyperspectral data have bands with different centre positions.Furthermore,the number of bands,especially their bandwidth,has a significant influence on various hyperspectral data (Wellburn,1994;Zarco-Tejada et al.,2001).At present,hyperspectral data include terrestrial non-imaging hyperspectral data and imaging hyperspectral data acquired by ground,aircraft,and satellite-mounted sensors.Bandwidth of satellite platform (such as Hyperion,Huan Jing (HJ),and other hyperspectral sensors) is 10 nm,whereas for airborne platform (such as airborne visible/infrared imaging spectrometer (AVIRIS),compact airborne spectrographic imager (CASI),and Eagle II),the bandwidth can range from 2 to 10 nm,and the Analytical Spectra Devices (ASD) spectrometer has a bandwidth of up to 1 nm on a ground-mounted platform.With the continuous development of sensor technology,the parameters of hyperspectral sensors have been greatly improved,such as the number of bands,band range,and bandwidth.However,changes in these parameters have yielded the increases in the data volume,storage burden,and computational complexity.Thus,it is imperative to choose appropriate bandwidth and accurately invert the metal element content.
The effect of bandwidth on the inversion accuracy of metal element content remains poorly understood.Huang et al.(2010) found that the optimal number of bands was 10 and that the optimal bandwidth was 32 nm when predicting Cu content.Narrowing bandwidth did not guarantee better results.In addition,the best inversion accuracy could be obtained by the PLSR method.However,previous studies focused only on selecting the optimal bandwidth for suburban soils with relatively few samples,large spectral sampling intervals,and coarse results.For rock ore,Cong et al.(2013) established a Cu content inversion model with a bandwidth of 5 nm and a wavelength of 900 nm;however,the effect was not significant.
Although the influence of soil bandwidth on the inversion effect has been roughly recognized using the spectral technique to invert the metal element content,the influence of bandwidth on the model was ignored for rocks.In addition,large areas of original rocks are covered by wind-blown sediment because of environment,making it more difficult to develop large-scale geochemical exploration.Therefore,the Kalatage polymetallic ore concentration area,where similar work has not been carried out,was selected as the study area in this research.This study will establish a PLSR model for rocks based on a small spectral sampling interval and then compare and analyze the effects of different bandwidths on the inversion results of Cu content in rocks.Combined with hyperspectral remote sensing technology,this study will provide a basis for simply and effectively predicting Cu content in rocks,establish a foundation for the inversion of regional remote sensing metal element contents across large areas,and provide a theoretical basis and demonstration for the future design of hyperspectral sensors for rock geochemistry.These contributions will help promote the development of geochemical exploration in large arid areas,such as the Gobi Desert.
2 Materials and methods
2.1 Study area
The study area is located in the Kalatage polymetallic ore concentration area,which is in the southwestern part of Hami City,Xinjiang Uygur Autonomous Region,China.The Kalatage polymetallic ore collection area was discovered in 1999,and it is 180 km away to the east of Hami City and 50 km away to the north of Kuquan Station of the Lanxin Railway.The geographical coordinates of the Kalatage polymetallic ore concentration area are between 42°35′-42°42′N and 91°30′-92°05′E,with an area of 700 km2.Many geologists have carried out various studies on this area,including its metallogenic background,metallogenesis,metallogenic regularity,and so on.The Early Paleozoic volcanogenic massive sulphide deposit of the Red Sea type was first discovered in the northern Xinjiang in 2008,which had important geological significance (Mao et al.,2017).In 2011-2012,the Yudai porphyry Cu (Au) deposit was discovered by geological prospectors in the western section of the Kalatage polymetallic ore concentration area.The Yudai porphyry Cu (Au) collection area is located in the south of the Turpan-Hami (Tuha) Basin in the northwestern part of the Kalatage uplift,which is a Paleozoic tectonic uplift belt along the margin (Long et al.,2016;Yu et al.,2016).The northern and eastern parts of the mining area are Dananhu Formation (D1d) Clastic Sedimentary Strata (Fig.1).These clastic sedimentary rocks unconformably cover a set of volcanic clastic rocks,mainly consisting of conglomerate,tuff sandstone,and powdery sandstone.The southern mine is composed of brown and aubergine andesites,basaltic andesites,dacites,andesitic-dacite agglomerates,grey basalts,pyroclastic sedimentary rocks,volcanic breccia,and tuff (Mao et al.,2017).
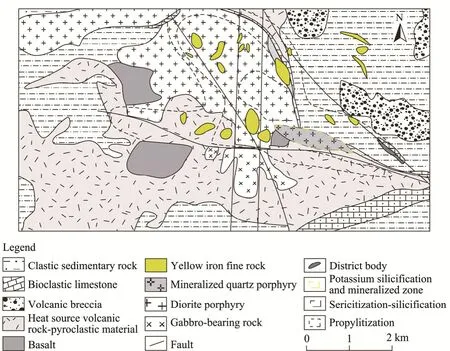
Fig.1 Geological map and alteration zone of the Yudai porphyry Cu (Au) deposit (revised according to Mao et al.(2017))
2.2 Data
2.2.1 Sample collection
Since most of the study area is covered by wind-blown sand and the surface sand is poorly representative,this study collected rock samplesin situwith little evidence of weathering and erosion in the vicinity of the Yudai porphyry Cu (Au) deposit as experimental samples in April 2018.Thirteen sampling lines were established;specifically,each sampling line was approximately 5 km long,the sampling line spacing was approximately 500 m,the point distance was approximately 200 m,and 3-5 pieces of rock debris with a diameter of 10 cm or less were collected at each point (Fig.2).A total of 338 rock samples were obtained.The collected samples were ground through a 200-mesh sieve (mesh diameter of 0.074 mm) to remove contaminated samples and small samples,and finally,258 effective samples were obtained.The analyzed samples were directly used for outdoor spectral measurements,and the sample state was consistent,which is beneficial for a comparative analysis.
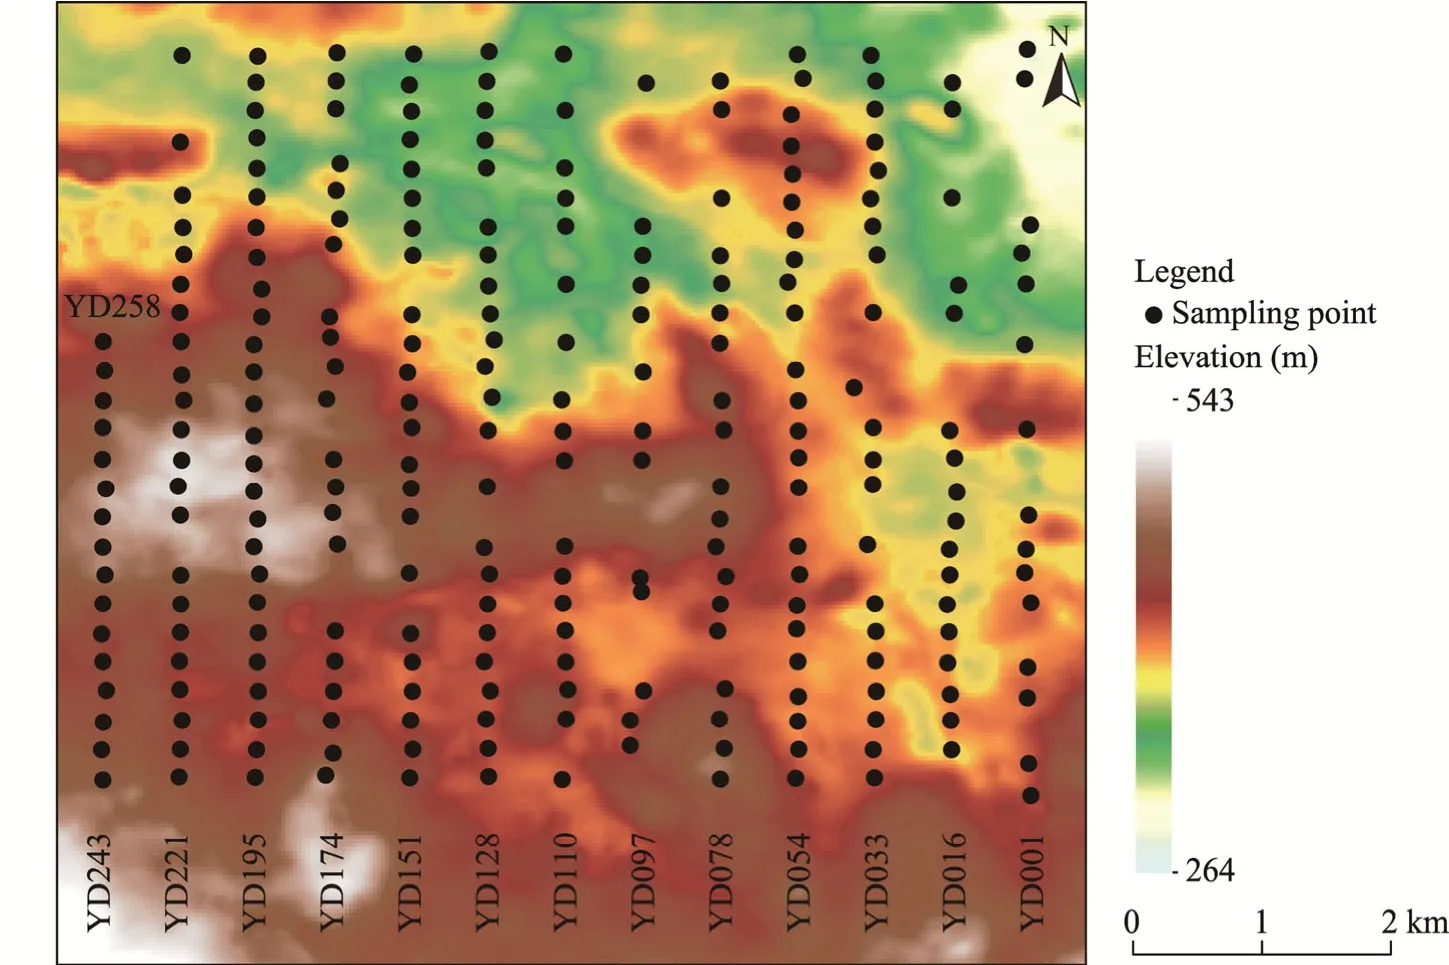
Fig.2 Distribution of sampling points.YD,Yudai.
2.2.2 Data acquisition
The field test was performed using a portable field spectrometer (FieldSpec 4 Hi-Res,LICA United Technology Limited,Beijing,China) for spectral data acquisition.The FieldSpec 4 Hi-Res instrument is a general-purpose spectroradiometer that is useful for many applications where measurements of reflectance,transmittance,radiance,or irradiance are required;it is a special type of spectrometer that can measure radiant energy (radiance and irradiance).The instrument,which is compact,portable,and precise,is specifically designed for remote sensing in a field environment to acquire VNIR and shortwave infrared (SWIR) spectra.We obtained the above information according to the manufacturer′s user manual (https://www.malvernpanalytical.com/en/).The spectral sampling interval was 1 nm in the standard mode,the spectral acquisition time was 0.2 s,the spectral resolution was 3 or 8 nm,and the wavelength range was 350-2500 nm,for a total of 2151 bands.
To use a natural light source for outdoor measurements while avoiding interference from other sources,we placed the samples a black background cloth.We further flattened the surface of the black background cloth,while loading the sample to reduce the influence of surface unevenness on spectrum.Distance between high-density dedicated probe and the rock powder sample used for ASD spectrometer measurement was controlled at approximately 2 cm.Before acquiring the measurement,a whiteboard was used to calibrate the instrument,and then,sample measurement was started.For every five samples,a whiteboard calibration was performed to ensure accuracy.A total of 258 rock powder samples were measured at a daily solar elevation angle close to vertical.The measured spectrum corresponded to the reflectance value,and each sample was measured five times to obtain five spectral curves;finally,five spectral curves were averaged to obtain a spectral curve.The data extraction for drawing and text files was performed by ViewSpecPro version 5.6 software (LICA United Technology Limited,Beijing,China).
2.3 Data preprocessing and resampling
2.3.1 Raw data correction
The measured spectral reflectance curves were automatically corrected by ASD spectrometer software ViewSpecPro.The main steps included gain calibration of each spectral data channel,wavelength correction,and dark current removal from the original data radiation intensity (Liu,2002).
2.3.2 Averaging spectral reflectance
The five spectral reflectance curves of each sample obtained by ViewSpecPro software were averaged,and the average value was taken as the spectrum of the sample.The measurement instability was evaluated by multiple measurements of the same target,making the measurements more natural and reliable while also enhancing the signal-to-noise ratio.
2.3.3 Removing the water vapour absorption band
Within wavelengths of 350-399,1301-1399,1790-1999,and 2401-2500 nm,water vapour has a significant absorption effect on spectrum,leading to the occurrence of anomalies (Fig.3a).We deleted some bands to eliminate the influence of water vapour absorption on the element content inversion,leaving 1692 effective bands (Fig.3b).
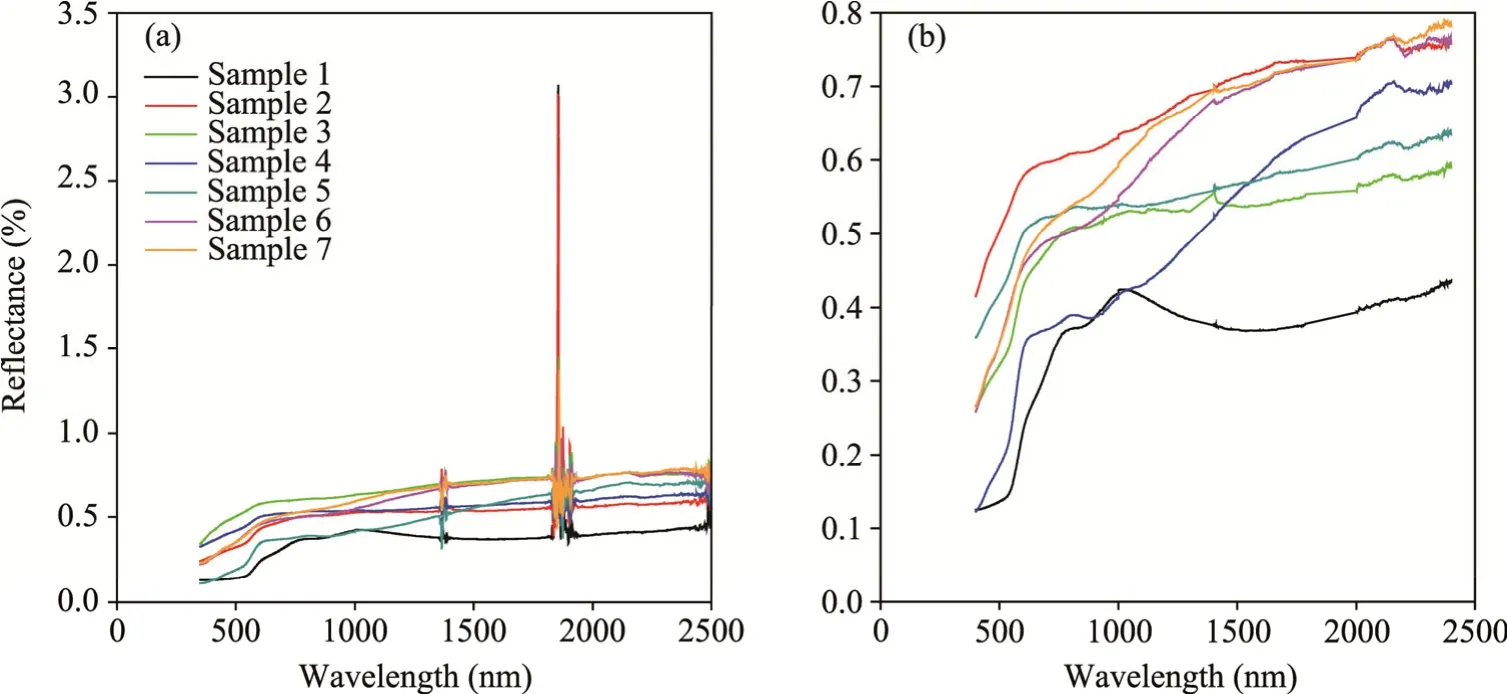
Fig.3 Original spectral curves of some rocks (a) and spectral curves of some rocks after the removal of water vapour absorption bands (b)
2.4 Spectral resampling of different bandwidths
Bandwidth,also known as the spectral resolution,refers to the recording width of the detector in the wavelength direction and is strictly defined as the wavelength width at which the instrument reaches 50% of the maximum spectral response (Dian et al.,2016).The finer the spectral resolution is,the greater the number of bands;and the higher the resolution is,the narrower the band.The water vapour absorption bands were deleted,and the influence of bandwidth on inversion precision was studied.Bandwidth was set to a variable,and the remaining factors were unchanged.The original band was resampled to spectral intervals of 5,10,15,...,100,150,and 200 nm.
Resampling was applied to downsample the high-resolution reflectivity to a lower resolution.The original VNIR bandwidth was 3 nm,and the original SWIR bandwidth was 8 nm.The spectrometer output was resampled to a spectral band of 1 nm.On this basis,we resampled the original spectrum using a custom spectral response function.In order to resampling the bandwidth to 5 nm,we resampled the original data using a 5 nm custom spectral response function in an Excel spreadsheet and ENVI 5.3 (Exelis Visual Information Solutions,Broomfield,Colorado,USA) (Fig.4a).The number of bands was 339 after resampling (Fig.4b).
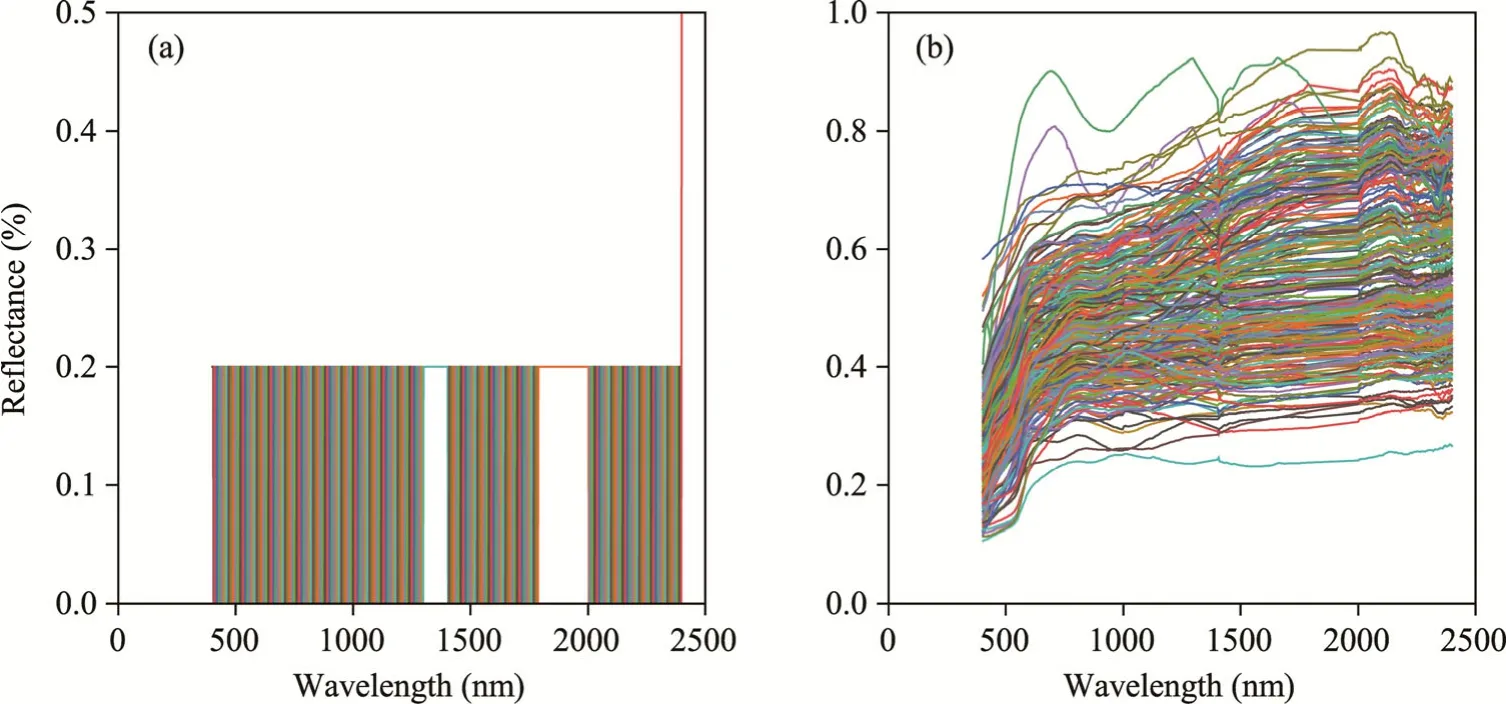
Fig.4 The 5 nm custom spectral response function (a) and spectral curves of the original rock resampled to 5 nm (b)
Finally,spectral responses of 10,15,20,25,...,100,150,and 200 nm were prepared,and the original spectral reflectance values were resampled using the corresponding spectral response functions.The numbers of bands after resampling were 169,113,85,68,...,17,12,and 9,respectively.
2.5 PLSR model and its inversion
The PLSR is a multivariate statistical analysis method first proposed by Svante Wold and Christer Albano (Wold et al.,1984).The PLSR method has been extensively used in different fields(Kawamura et al.,2010;Wang et al.,2010),because it can solve not only regression problems involving multiple dependent and independent variables but also problems of variable multicollinearity (Liu et al.,2019).The sum of the squares of errors was used to minimize the best matching function for a set of data in the PLSR method.Here,the simplest method was used to find the true value,which can minimize the sum of the squares of errors.By analogy,the optimal number of principal components was obtained using leave-one-out cross validation(LOOCV) method.Multivariate correction step in the PLSR method was employed to directly locate the target at prediction.Therefore,based on the principle and basis of the minimum prediction error sum of squares (PRESS),we determined the number of extracted principal components.The principal components (t) were a linear combination ofx,and thus,a regression model ofyandxcan be established.Variables related to the original parameters can be transformed into a set of independent orthogonal variables after conducting PLSR.In many practical applications,the orthogonality of the variable system has many advantages because the information contained in each variable is complementary.Each variable contains information without crossover,which is highly convenient for statistical information (Wang et al.,2006).
3 Results
3.1 PLSR model accuracy of different bandwidths
To establish the PLSR model and obtain a reliable and stable model,we adopted the LOOCV method to prevent the overfitting phenomenon caused by an excessive number of principal components in this study.In terms of the LOOCV method,one sample was left as a verification sample,and the rest were used as training samples;this step was continually cycled until all samples were verified.The PLSR model was built with the training samples and predicted by the verification sample,and the PRESS was recorded until all the samples were predicted (only once).The LOOCV method was used to detect the PRESS of each principal component,and the number of principal components with the minimum PRESS was selected.Values of the PRESS corresponding to the number of different principal components detected at a bandwidth of 35 nm are shown in Figure 5.The PLSR method directly locates the target of multivariate correction on the prediction,and thus,the principle of determining the number of principal components in the PLSR model is to minimize the prediction error.The prediction error value is the minimum when eight principal components are extracted;therefore,eight principal components are determined(Fig.5).
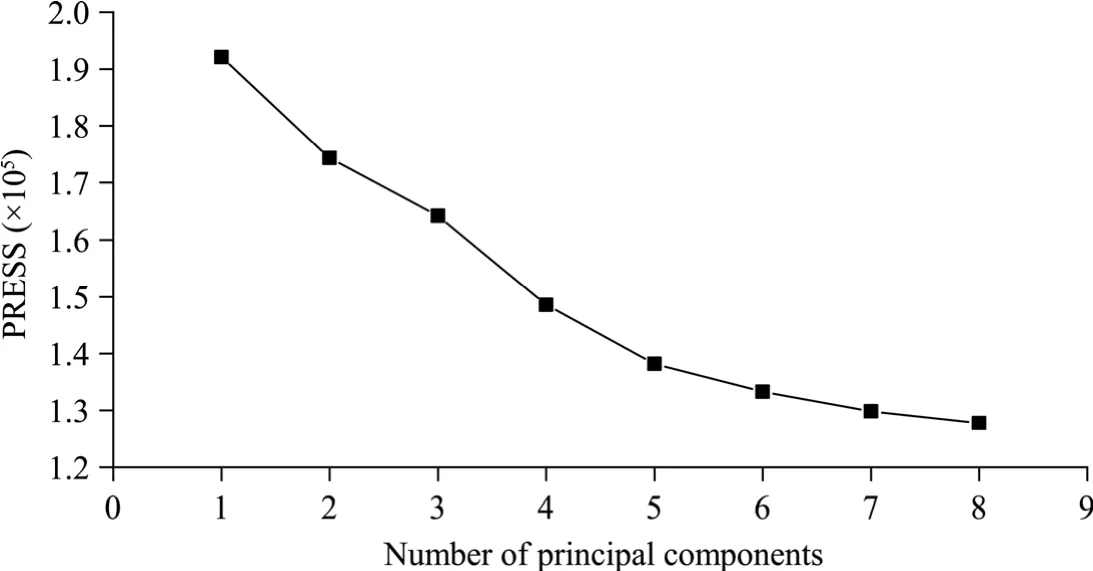
Fig.5 Values of the prediction error sum of squares (PRESS) corresponding to the number of different principal components detected at 35 nm bandwidth using the Partial Least Squares Regression (PLSR) method
To investigate the optimal bandwidth required to predict Cu content in rocks,this study applied the PLSR model for the above sample sets at all resampled resolutions.The regression results of the PLSR model are shown in Table 1.It is clearly that the accuracy of the PLSR model reaches the highest when the bandwidth is 35 nm (Table 1).
Figure 6 shows the accuracy of the PLSR model on Cu content prediction with increasing bandwidth,displaying the high volatility of the curve and an overall decreasing trend.The spectral resolution within the resampled bandwidth range is 35 nm,corresponding to the highestR2value.As bandwidth gradually increases,the accuracy of the PLSR model changes.Specifically,the accuracy of the PLSR model changes slightly before 35 nm but irregularly after 35 nm and drops sharply after 85 nm.This also means that metallic elements are resolvable at high spectral resolution,whereas the multispectral accuracy is low.
The specific PLSR model analysis results for Cu content prediction under different bandwidths included the extracted optimal number of principal components and the PRESS,in addition to the inversion model determination coefficientR2.The smaller the value of PRESS is,the smaller the fitting error (Table 1).The number of principal components extracted from the PLSR model is determined by the fitting error;when the number is eight,the resolution is the highest.The number of principal components higher or lower than eight will decrease the prediction accuracy of the PLSR model.
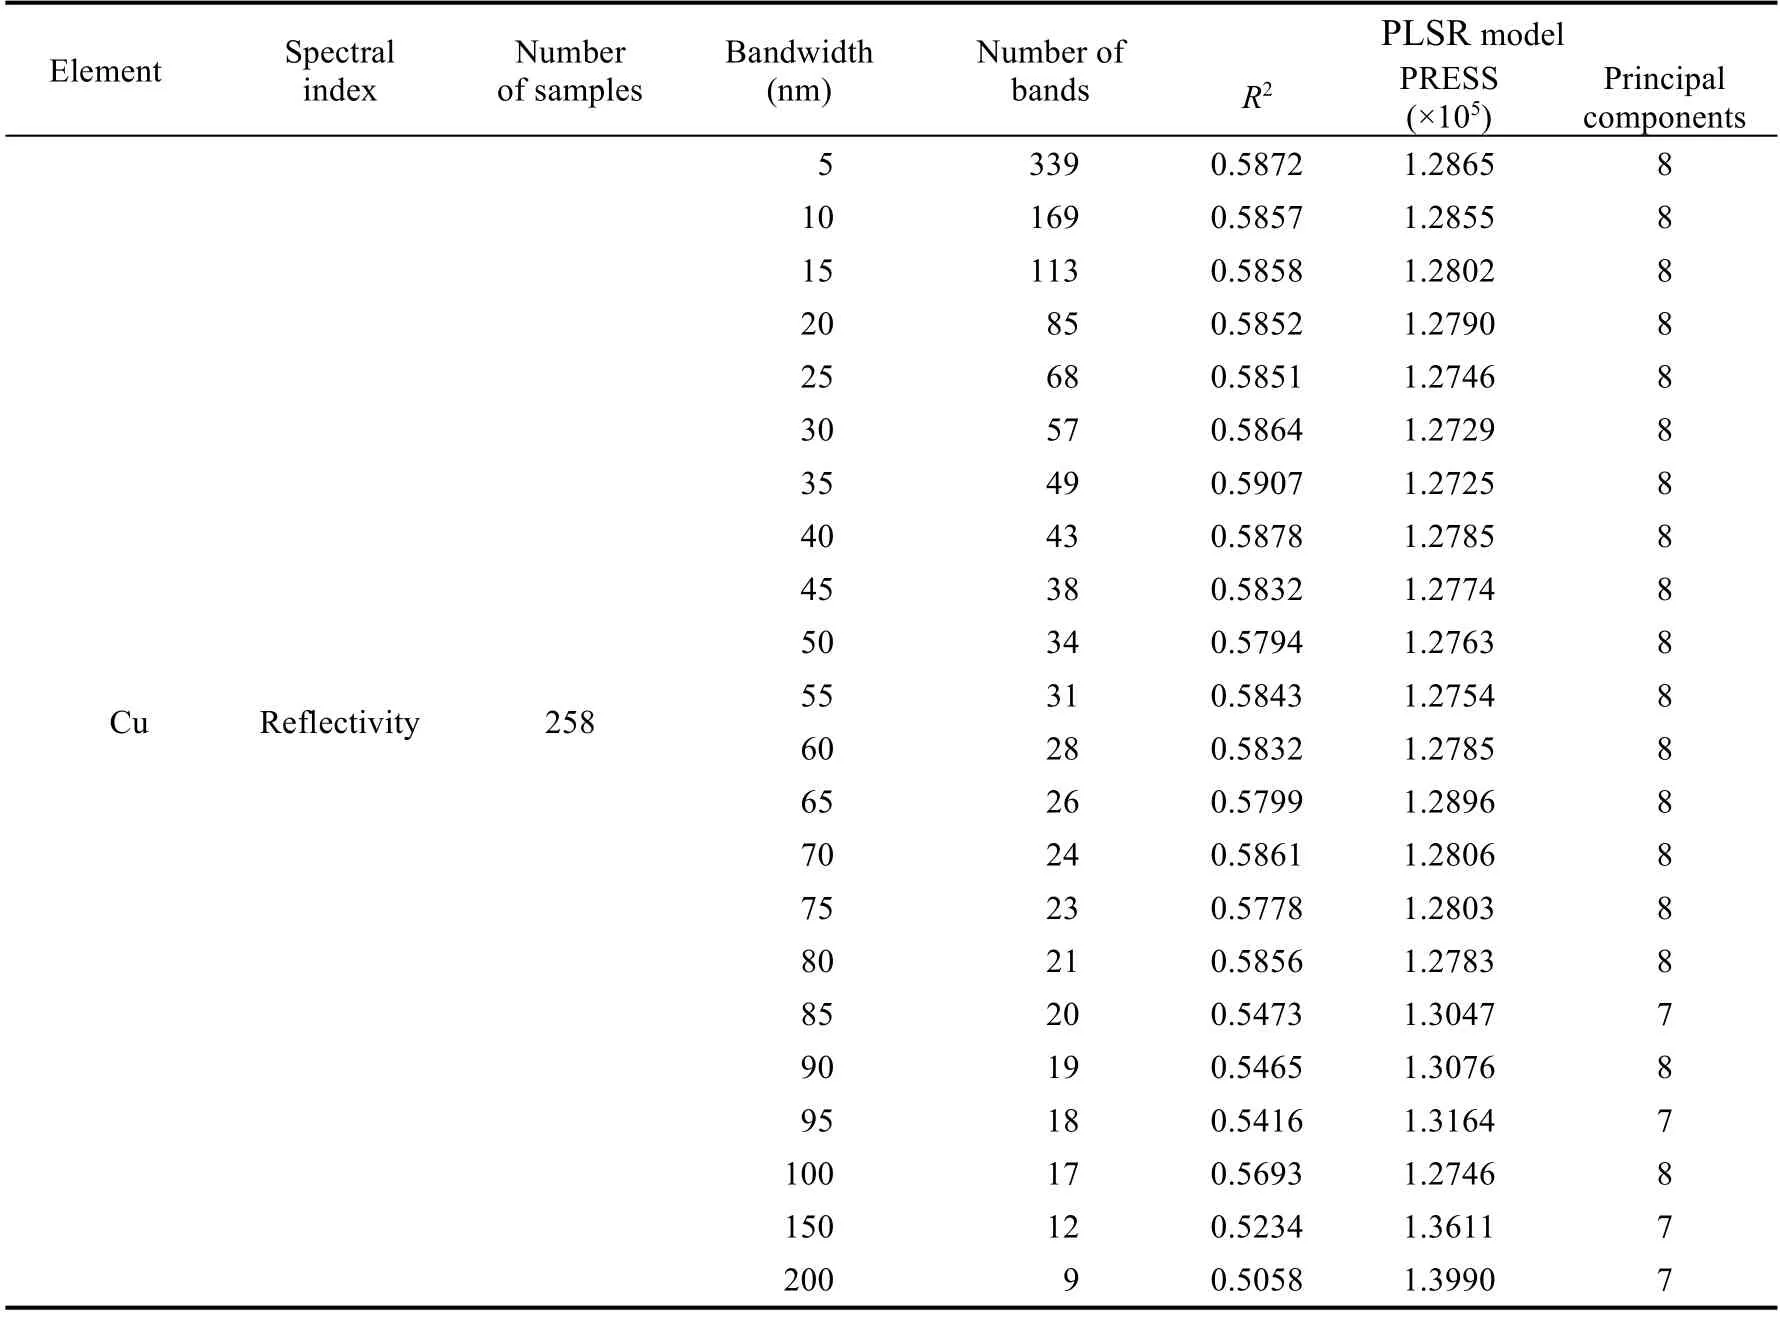
Table 1 Accuracy of Cu content prediction with different bandwidths based on the partial least squares regression (PLSR) model
When Cu content within the 258 rock samples in the mining area was inspected by the VNIR ground-measured spectrum,the influence of bandwidth on spectral reflectance data was in a small range (Table 1;Fig.6).Specifically,at 85 nm bandwidth,R2value decreased considerably;at 100 nm bandwidth,the accuracy increased again,but the overall trend continued to decline;and at 150 and 200 nm bandwidth,R2values were close and continued to decline.Thus,for Cu content detection in rocks,it is not that the smaller the spectral bandwidth is,the better the prediction result of the PLSR method.Likewise,it is also not that the larger the spectral bandwidth is,the better the prediction result.During 5-80 nm bandwidth,the inversion prediction accuracy exhibited a small amplitude fluctuation,but the best effect was found at 35 nm within the resampled bandwidth range (Fig.6).
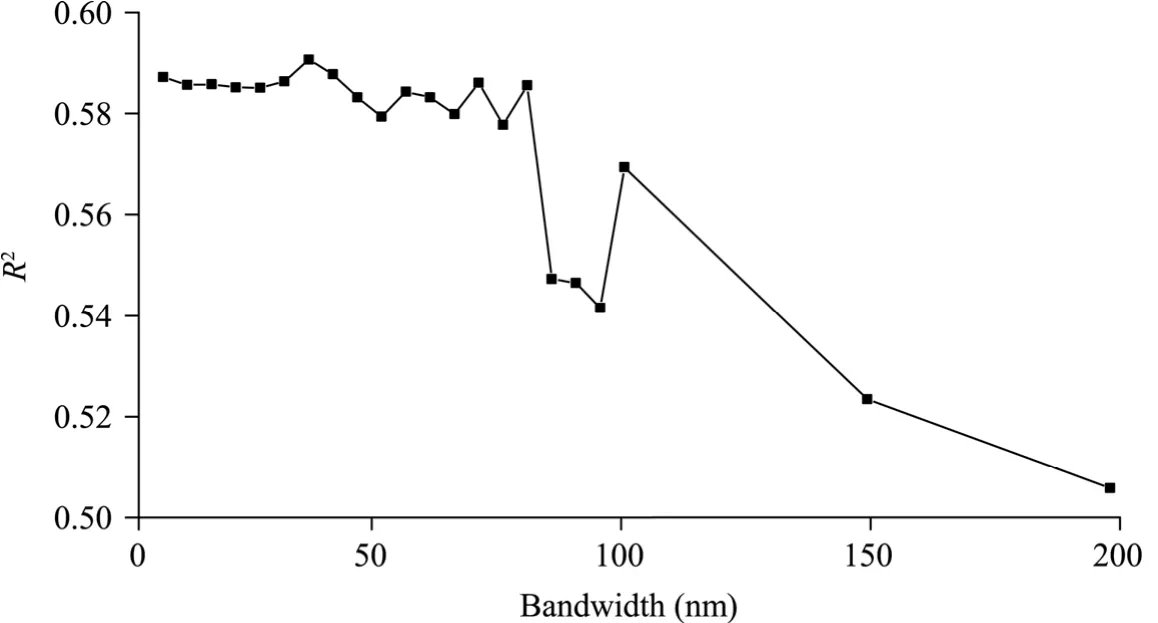
Fig.6 Accuracy curve of the PLSR model with different bandwidths for Cu content prediction
3.2 Cu content prediction by the PLSR model
We applied the PLSR model based on different bandwidths obtained from the resampled original data.Specifically,we established the PLSR model for the sample data with a bandwidth of 35 nm,and determined the optimal number of principal components as eight according to the accuracy of LOOCV method.In the PLSR calculation process,the extracted independent variabletnrepresents as much of the variation inxas possible and is associated withyas much as possible to interpret the information ofy.The variablet1had the strongest interpretation ability.In other words,the multivariate correction step in the PLSR method was used to directly locate the target on the prediction.Based on the principle and basis of the PRESS,the principal components were extracted.
Based on the optimal number of principal components determined above,we predicted the content of Cu in each experimental sample using the established PLSR prediction model.There are two ways to predict Cu content,one is the combination of PLSR model and LOOCV method,the other is the direct fitting prediction using the PLSR model,hereinafter referred to as the LOOCV prediction and partial fitting prediction (Fig.7).Then,these predicted contents and the Cu contents measured by chemical analysis were fitted (Fig.8).The prediction accuracy is expressed by the determination coefficientR2of the PLSR model.The larger the determination coefficientR2is,the better the prediction effect.Cu element content predicted by partial fitting around the measured values without a large outlier.The linear equation and fitting accuracy are shown in Figure 8,and the bias of this bandwidth (35 nm) to the fitted prediction values are depicted in Figure 9.Unlike Figure 8,Figure 9 is a fitting result by using LOOCV.It can be seen from the figure that the accurate of results fitted after cross-validation is decreased,but more convincing.Both figures show a similar distribution of points.
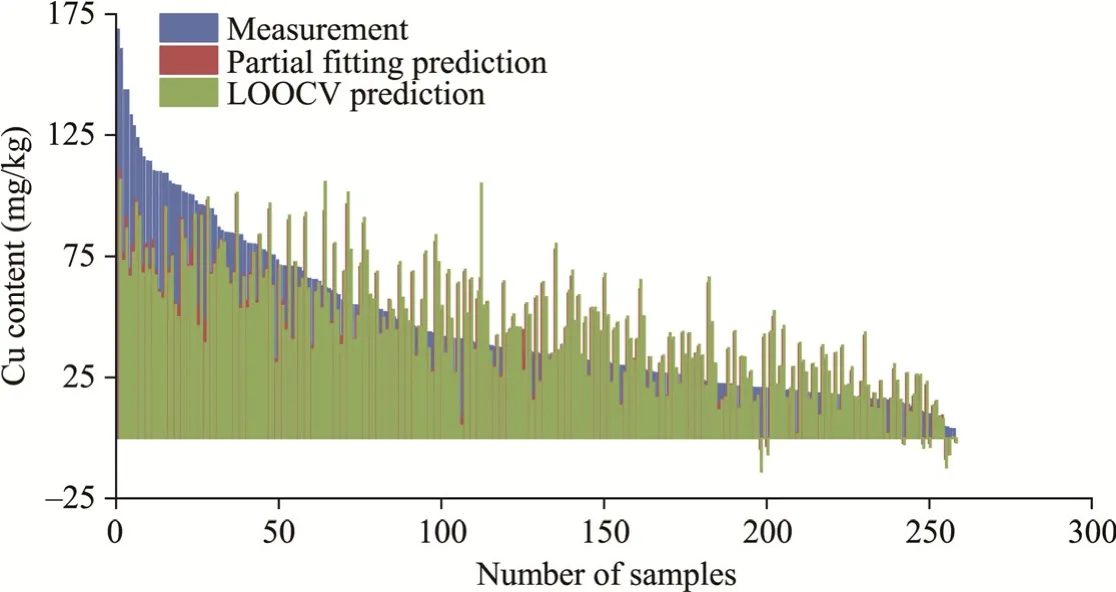
Fig.7 Cu content at a bandwidth of 35 nm.It should be noted that due to the limitations of the PLSR model,negative values of Cu content will inevitably appear.LOOCV,leave-one-out cross validation.
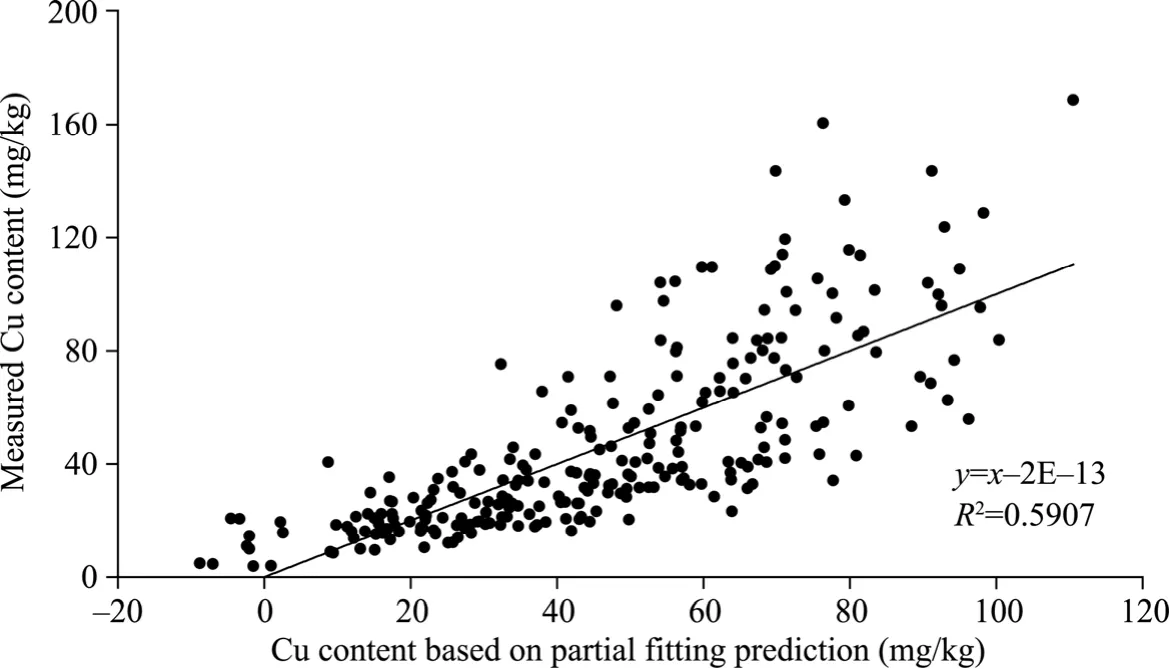
Fig.8 Equation and accuracy of Cu content predication with a bandwidth of 35 nm
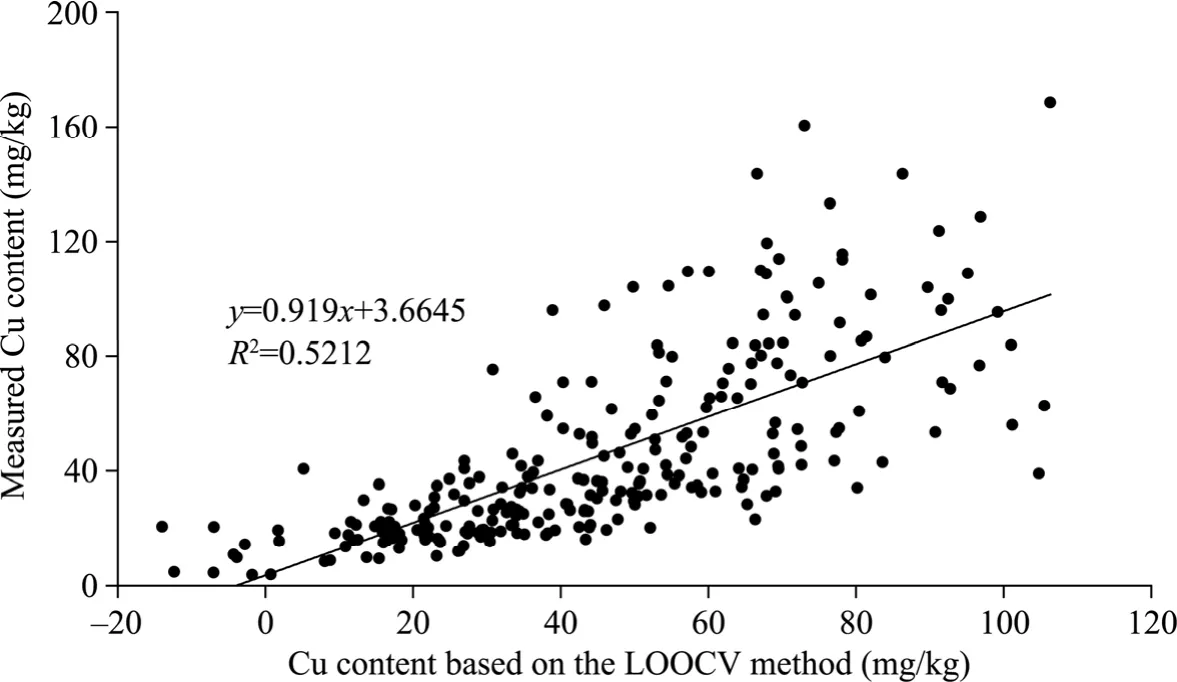
Fig.9 Accuracy and fitting results of the LOOCV method on Cu content prediction with a bandwidth of 35 nm
The distribution trends of the measured and predicted Cu contents are generally consistent (Fig.10).However,we need to use spatial interpolation to make a comparison between the measured and predicted Cu contents.Deterministic local fitting methods (such as inverse distance weighting) are needed to avoid excessive interpolation differences in order to more intuitively visualize the spatial distribution difference of Cu content.In this study,inverse distance weighting was applied to interpolate Cu contents,which were retrieved from the PLSR model established at a bandwidth of 35 nm.
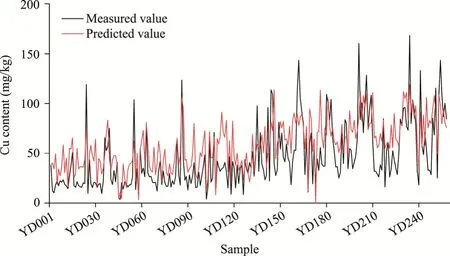
Fig.10 Trend of Cu content for different samples.The x-axis indicates the sample number.
These results indicate that when we invert Cu content in rocks using the PLSR method,the
accuracy of the results will be affected by bandwidth (Fig.6).During 5-80 nm bandwidth,the inversion precision changes are similar,and the inversion accuracy reaches the highest at 35 nm bandwidth.Inverse distance weighting interpolation can be performed based on the inversion results at 35 nm;although the accuracy is not high enough,the results can still indicate the Cu content distribution.
4 Discussion
Cu is a common metallogenic element that has certain significance as an indicator for ore prospecting.Hyperspectral remote sensing technology can help to invert element content over a large area.Due to the high resolution of hyperspectral data,different numbers of bands,wavelengths,and bandwidths correspond to different types of hyperspectral data.Therefore,how to select the optimal bandwidth with the best resolution is very important.In this study,the accuracy of inverting Cu content in rocks with different bandwidths was analyzed.
The results demonstrate that bandwidth influences the inversion results.At a bandwidth lower than 85 nm,the inversion accuracy fluctuates little.Beyond 85 nm bandwidth,however,the accuracy drops dramatically.This indicates that the inversion results are reliable as long as the bandwidth is less than 85 nm when inverting Cu content.At 35 nm bandwidth,the accuracy is the highest,and the accuracy remains almost the same at smaller bandwidths.However,the accuracy changes considerably between 35 and 85 nm (Fig.6).This implies that compared with the uncertainty in the precision variation between 35 and 85 nm,it is best to invert Cu content at a bandwidth below 35 nm.The spectral characteristics of metal elements are relatively broad,and a lower spectral resolution can increase the signal-to-noise ratio,thereby improving the prediction accuracy.This indicates that the spectral resolution should be within 80 nm when designing hyperspectral sensors for rock geochemistry in the future,if there is not necessary to require an excessively high resolution.Instead,in fine instrument design,we can refer to the design with the spectral resolution near 35 nm,but whether the most appropriate spectral resolution is 35 nm remains to be discussed.
According toR2value of the linear fitting equation,the value ofR2reaches the largest at 35 nm bandwidth within the resampled bandwidth range.This result is similar to that of Huang et al.(2010),who inverted the heavy metal Cu content in soil.The results from other researchers also show that bandwidth has a certain effect on chlorophyll in vegetation (Gitelson et al.,2006;Zhao et al.,2007;Peng et al.,2011;Dian et al.,2016).These findings demonstrate that bandwidth has an influence on ground object inversion,and the inversion does not improve as the spectral resolution increases.Different types of research objects and inversion elements will produce different results,and thus,as the selection of the optimal bandwidth for metal element content in rocks is still in its preliminary exploration stage,more comprehensive research on various metal elements is needed in the future.
In this study,the influence of bandwidth on the inversion accuracy of Cu content was discussed.Since the reflectance data is obtained by ground-based hyperspectral instruments,the water vapor absorption factor is taken into account,but other factors involving airborne and satellite hyperspectral data are not taken into consideration in this study.
5 Conclusions
In this study,we measured the ground spectra of rock powder samples collected near the Yudai porphyry Cu (Au) deposit in the Kalatage polymetallic ore concentration area,and investigated the accuracy of Cu content inversion at different bandwidths.The results show that the accuracy of metal element content inversion near a bandwidth of 80 nm is small,but the inversion result is superior at 35 nm bandwidth.The inversion model precision shows a sharp decline at 85 nm bandwidth.The application of metal elements content inversion in soil by reflection spectroscopy has received considerable attention,and thus,the related techniques tend to be mature.However,due to the heterogeneity of chemical compositions in rocks and the numerous types of rocks,the complexity of ground spectra will lead to some difficulties in the inversion of element contents using reflection spectra.This study provides a basis for the future design of hyperspectral sensors for rock geochemistry and provides ideas for further research on rock reflection spectra.
The subject of this study is the ground spectra measurement of rock powders in a mining area,and we explore only the influence of bandwidth on the PLSR method.Future studies should consider other driving factors,such as characteristic band and band position.Additionally,aerial hyperspectral remote sensing is the focus and difficulty of future research.
Acknowledgements
This work was supported by the Science and Technology Major Project of Xinjiang Uygur Autonomous Region,China (2021A03001-3),the Key Area Deployment Project of the Chinese Academy of Sciences(ZDRW-ZS-2020-4-30),and the National Natural Science Foundation of China (U1803117).
- Journal of Arid Land的其它文章
- Journal of Arid Land
- Neoproterozoic I-type granites in the Central Tianshan Block (NW China): geochronology,geochemistry,and tectonic implications
- Spatial variability of leaf wetness under different soil water conditions in rainfed jujube (Ziziphus jujuba Mill.) in the loess hilly region,China
- Lithic soils in the semi-arid region of Brazil:edaphic characterization and susceptibility to erosion
- Isotope implications of groundwater recharge,residence time and hydrogeochemical evolution of the Longdong Loess Basin,Northwest China
- Ecological environment quality evaluation of the Sahel region in Africa based on remote sensing ecological index

