
Prediction of genetic alterations from gastric cancer histopathology images using a fully automated deep learning approach
2021-12-06 08:52:58HyunJongJangAhwonLeeJunKangInHyeSongSungHakLee
World Journal of Gastroenterology 2021年44期
Hyun-Jong Jang, Ahwon Lee, Jun Kang, In Hye Song, Sung Hak Lee
Abstract
Key Words: Gastric cancer; Mutation; Deep learning; Digital pathology; Formalin-fixed paraffin-embedded
INTRODUCTION
Molecular tests to identify specific mutations in solid tumors have improved our ability to stratify cancer patients for more selective treatment regimens[1 ]. Therefore,molecular tests to detect various mutations are recommended for some tumors,including EGFR mutations in lung cancer, KRAS in colorectal cancer, and BRAF in melanoma. However, it is not routinely applied to cancer patients because molecular tests are not cost- and time-efficient[2 ]. Furthermore, the clinical significance of many mutations is still not well understood. For example, mutation profiling of gastric cancer (GC) is still proceeding, and the meaning of each mutation is not clearly understood[3 ]. GC is the fifth most common cancer and the third leading cause of cancer-related deaths worldwide[4 ]. It is important to evaluate the relationship between the mutational status and clinical characteristics of GC to improve the clinical outcomes of GC patients. Furthermore, many targeted drugs for treating various tumors are not effective in GC therapy because GC is not enriched with known driver mutations[5 ]. Therefore, research to characterize the roles of GC-related genes on the clinical behavior of tumors and the potential response to targeted therapies will have immense importance for the improvement of treatment response in GC[6 ]. A cost- and time-effective method to determine the mutational status of GC patients is necessary to promote these studies.
Recently, deep learning (DL) has been increasingly implemented to predict the mutational status from hematoxylin and eosin (H and E)-stained tissue slides of various cancers[7 -11 ]. The H and E-stained tissue slides were made for almost all cancer patients for basic diagnostic studies by pathologists[12 ]. Therefore, mutation prediction from the H and E-stained tissue slide based on a computational method can be a cost- and time-effective alternative tool for conventional molecular tests[13 -15 ].Although it has long been recognized that the morphological features of tissue architecture reflect the underlying molecular alterations[16 ,17 ], the features are not easily identifiable by human evaluators[18 ,19 ]. DL offers an alternative solution to overcome the limitations of a visual examination of tissue morphology by pathologists.By combining feature learning and model fitting in a unified step, DL can capture the most discriminative features for a given task directly from a large set of tissue images[20 ]. Digitization of tissue slides has been rapidly increasing after the approval of digitized whole-slide images (WSIs) for diagnostic purposes[21 ]. Digitized tissue data are rapidly accumulating with their associated mutational profiles. Therefore, the DLbased analysis of tissue slides for the mutational status of cancer tissues has immense potential as an alternative or complementary method for conventional molecular tests.
Based on the potential of DL for the detection of mutations from digitized tissue slides, in a previous study, we successfully built DL-based classifiers for the prediction of mutational status of APC, KRAS, PIK3 CA, SMAD4 , and TP53 genes in colorectal cancer tissue slides[11 ]. This study investigated the feasibility of classifiers for mutations in the CDH1 , ERBB2 , KRAS, PIK3 CA, and TP53 genes in GC tissues. First,the classifiers were trained and tested for GC tissue slides from The Cancer Genome Atlas (TCGA). The generalizability of the classifiers was tested using an external dataset. Then, new classifiers were trained for combined datasets from TCGA and external datasets to investigate the effect of the extended datasets. The results suggest that it is feasible to predict mutational status directly from tissue slides with deep learning-based classifiers. Finally, as the classifiers for KRAS, PIK3 CA, and TP53 mutations for both colorectal and GC were available, we also analyzed the generalizability of the DL-based mutation classifiers trained for different cancer types.
MATERIALS AND METHODS
Part I: Tests with The Cancer Genome Atlas whole-slide image datasets
Patient cohort:The Cancer Genome Atlas (TCGA) provides extensive archives of digital pathology slides with multi-omics test results to test the possibility of tissuebased mutation detection[22 ]. After a carefully review of all the WSIs in the TCGA GC dataset (TCGA-STAD), we eliminated WSIs with poor scan quality and very small tumor contents. We selected slides from 25 , 19 , 34 , 64 , and 160 patients, which were confirmed to have mutations in CDH1 , ERBB2 , KRAS, PIK3 CA, and TP53 genes,respectively. There were more than two slides for many patients in the TCGA dataset,with a maximum of four slides for some patients. However, in many cases, one or two slides contained only normal tissues. We excluded normal slides and selected a maximum of two tumor-containing slides per patient. The final number of frozen tissue slides was 34 , 26 , 50 , 94 , and 221 and that of formalin-fixed paraffin-embedded(FFPE) tissue slides was 27 , 19 , 34 , 66 , and 174 for CDH1 , ERBB2 , KRAS, PIK3 CA, and TP53 genes, respectively. We selected 183 patients with wild-type CDH1 , ERBB2 ,KRAS, PIK3 CA, and TP53 genes. Therefore, the same patients with wild-type genes for CDH1 , ERBB2 , KRAS, PIK3 CA, and TP53 can be involved in the training of every classifier as a non-mutated group. This may help the comparison of the different classifiers more standardized because they all have the same group of patients as the wild-type group. The TCGA IDs of the patients in each group are listed in Supplementary Table 1 . Our previous studies recognized that a DL model cannot perform optimally for both training and testing unless the dataset is forced to have similar amounts of data between classes[23 ]. Therefore, we limited the difference in patient numbers between the mutation and wild-type groups to less than 1 .4 fold by random sampling. For example, only 35 of the 183 wild-type patients were randomly selected as the CDH1 wild-type group because there were only 25 CDH1 mutated patients. Ten-fold cross-validation was performed based on these randomly sampled wild-type patients. However, the classifiers yielded better results when the tumor patches from all wild-type patients other than the test sets were randomly sampled to match the 1 .4 fold data ratio of wild-type/mutation groups for training, as this strategy could include a greater variety of tissue images. Therefore, we included all wild-type patients other than the test sets during training and randomly selected patients during testing.
Deep learning model:In general, a WSI is too large to be analyzed simultaneously using a deep neural network. Therefore, the analysis results for small image patches are integrated for conclusion. We divided a WSI into non-overlapping patches of 360 ×360 pixel tissue images at 20 × magnification to detect mutational status. To make the classification process fully automated, artifacts in the WSIs such as air bubbles,compression artifacts, out-of-focus blur, pen markings, tissue folding, and white background should be removed automatically. A simple convolutional neural network(CNN), termed as tissue/non-tissue classifier, was trained to discriminate these various artifacts all at once. The structure of the tissue/non-tissue classifier was described in our previous study[11 ]. The tissue/non-tissue classifier could filter out almost 99 .9 % of the improper tissue patches. Then, tissue patches classified as“improper” by the tissue/non-tissue classifier were removed, and the remaining“proper” tissue patches were collected. For the tumor or mutation classifiers described below, only proper tissue patches were analyzed (Figure 1 ).
Morphologic features reflecting mutations in specific genes might be expressed mainly in tumor tissues rather than normal tissues[24 ,25 ]. Therefore, tumor tissues should be separated from the WSI to predict the mutational status of the WSI. In a previous study, we successfully built normal/tumor classifiers for various tumors,including GC[26 ]. We concluded that frozen and FFPE slides should be separately analyzed using a deep neural network due to their different morphologic features.Thus, we adopted the normal/tumor classifiers for frozen and FFPE tissue slides from a previous study to delineate the normal/tumor gastric tissues for the frozen and FFPE slides of the TCGA-STAD dataset in the present study. Mutation classifiers were trained separately for the selected tumor patches for frozen and FFPE tissues. We selected tumor patches with a tumor probability higher than 0 .9 to collect tissue patches with evident tumor features. We adopted a patient-level ten-fold crossvalidation to completely characterize the TCGA-STAD dataset. Therefore, patients in each mutation/wild-type group for the five genes were separated into ten different folds, and one of the ten folds was used to test the classifiers trained with data from the other nine folds. Therefore, ten different classifiers were trained and tested for each group. The same label for all tumor tissue patches in a WSI as either ‘wild-type’ or‘mutated’ were assigned based on the mutational status of the patient. Thereafter, the Inception-v3 model, a widely used CNN architecture, was trained to classify the tumor patches into ‘wild-type’ or ‘mutated’ tissues, as in our previous study on mutation prediction in colorectal cancer[11 ]. We fully trained the network from the beginning and did not adopt a transfer-learning scheme. The average probability of all tumor patches in a WSI was calculated to determine the slide-level mutation probability of a WSI. The Inception-v3 model was implemented using the TensorFlow DL library (http://tensorflow.org), and the network was trained with a mini-batch size of 128 and cross-entropy loss function as a loss function. For training, we used the RMSProp optimizer, with an initial learning rate of 0 .1 , weight decay of 0 .9 , momentum of 0 .9 ,and epsilon of 1 .0 . Ten percent of the training slides were used as the validation dataset, and training was stopped when the loss for the validation data started to increase. Data augmentation techniques, including random horizontal/vertical flipping and random rotations by 90 °, were applied to the tissue patches during training. Color normalization was applied to the tissue patches to avoid the effect of stain differences[27 ,28 ]. At least five classifiers were trained on each fold of mutation for the frozen and FFPE WSIs separately. The classifier with the best area under the curve (AUC) for the receiver operating characteristic (ROC) curves on the test dataset was included in the results. The ROC curves for fold with the lowest AUC, highest AUC, and the concatenated results for data from all ten folds are shown in the figures.
In summary, a WSI is analyzed as follows: 1 . The whole slide is split into nonoverlapping 360 × 360 pixel tissue patches, 2 . Proper tissue patches are selected by tissue/non-tissue classifier, 3 . Only tumor patches with tumor probability higher than 0 .9 are selected, 4 . High probability tumor patches are classified by each wildtype/mutation classifier, 5 . The probabilities of tumor patches are averaged to obtain the slide-level mutation probability. The number of tissue patches used for the training of all mutation prediction models is summarized in Supplementary Table 2 . The average number of training epochs for each classifier is summarized in Supplementary Table 3 .
Part II: Tests on the external cohorts
Patient cohort:GC tissue slides were collected from 96 patients who had previously undergone surgical resection at Seoul St. Mary’s Hospital between 2017 and 2020 (SSMH dataset). An Aperio slide scanner (Leica Biosystems) was used to scan the FFPE slides. The Institutional Review Board of the College of Medicine at the Catholic University of Korea approved this study (KC19 SESI0787 ).
Mutation prediction on SSMH dataset:For CDH1 , ERBB2 , KRAS, PIK3 CA, and TP53 genes, 6 , 6 , 12 , 11 , and 39 patients were confirmed to have the mutations, respectively.Thirty-eight patients had wild-type genes for all five genes. For CDH1 , ERBB2 , KRAS,and PIK3 CA genes, we selected the number of wild-type patients to be 1 .4 times that of mutated patients. For TP53 , all 38 patients with wild-type genes were enrolled. The normal/tumor classifier for TCGA FFPE tissues was also used to discriminate the tumor tissue patches of SSMH WSIs. Our previous study showed that the normal/tumor classifier for TCGA-STAD was valid for SSMH FFPE slides[29 ]. First,the mutational status of the SSMH slides was analyzed by classifiers trained on TCGASTAD FFPE WSIs. Subsequently, new classifiers were trained using both TCGA and SSMH FFPE tissues. Patient-level three-fold cross validation was applied to the SSMH datasets because the number of mutated patients was not sufficient for ten-fold crossvalidation.
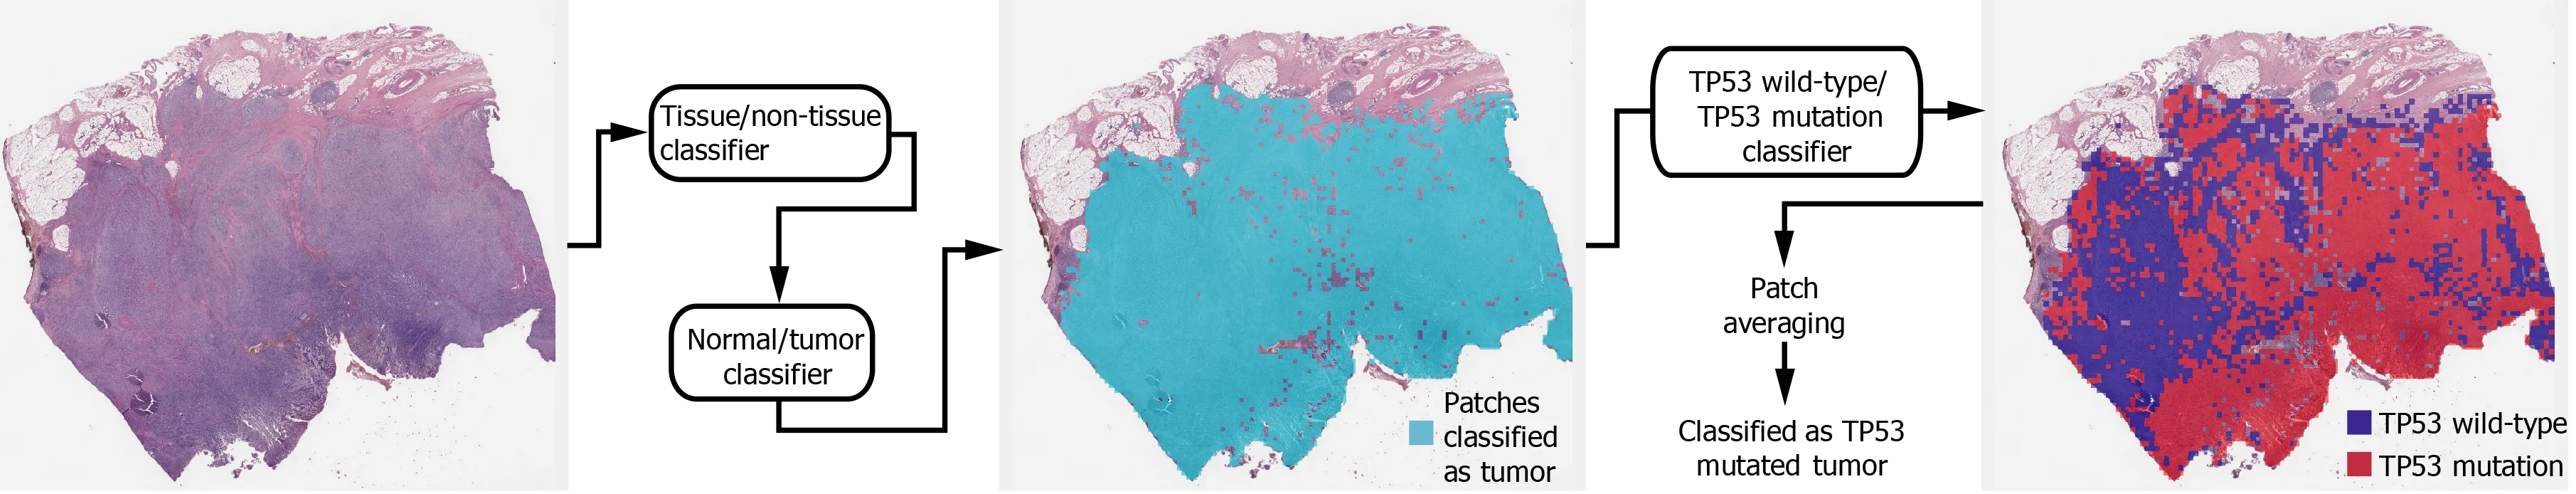
Figure 1 Workflow for the fully automated prediction of mutation. Tissue image patches with tumor probability higher than 0 .9 were selected by sequential application of the tissue/non-tissue and normal/tumor classifiers. Then the tumor patches were classified into the wild-type or mutated patches. The patchlevel probabilities of mutation are averaged to yield the slide-level probability.
Statistical analysis
To demonstrate the performance of each classifier, the ROC curves and their AUCs are presented in the figures. For the concatenated results from all ten folds, 95 %confidence intervals (CIs) were also presented using the percentile bootstrap method.In addition, the accuracy, sensitivity, specificity, and F1 score of the classification results of mutation prediction models with cutoff values for maximal Youden index(sensitivity + specificity - 1 ) were presented. We used a permutation test with 1000 iterations to compare the differences between the two paired or unpaired ROC curves when a comparison was necessary[30 ]. Statistical significance was set at P < 0 .05 .
RESULTS
Tissue patches with high tumor probability were automatically collected from a WSI by sequentially applying the tissue/non-tissue and normal/tumor classifiers to 360 ×360 pixels tissue image patches (Figure 1 ). Then, classifiers to distinguish the mutational status of CDH1 , ERBB2 , KRAS, PIK3 CA, and TP53 genes in the tumor tissue patches from the TCGA-STAD frozen and FFPE WSI datasets were separately trained with a patient-level ten-fold cross-validation scheme.
The classification results of the TCGA-STAD WSIs are presented in Figures 2 to 6 for CDH1 , ERBB2 , KRAS, PIK3 CA, and TP53 genes. Results for the frozen and FFPE tissues are presented in the upper and lower part of each figure, respectively. Panels A and C demonstrated the representative binary heatmaps of tissue patches classified as wild-type or mutated tissues. The WSIs with gene mutation correctly classified as mutation, with wild-type gene correctly classified as wild-type, with gene mutation falsely classified as wild-type, and with wild-type gene falsely classified as mutation are presented from left to right for panels A and C. The binary heatmaps were drawn with the wild-type/mutation discrimination threshold set to 0 .5 . We simply set the threshold to 0 .5 , because every classifier for different folds had different optimal thresholds. Slide-level ROC curves for folds with the lowest and highest AUCs are presented to demonstrate the differences in the performance between folds (left and middle ROC curves in each figure). Finally, the slide-level ROC curves for the concatenated results from all ten folds were used to infer the overall performance (right ROC curves). The results for the CDH1 gene are shown in Figure 2 . The AUCs per fold ranged from 0 .833 to 1 .000 for frozen WSIs and from 0 .833 to 1 .000 for FFPE WSIs. The AUCs for the concatenated results were 0 .842 (95 %CI: 0 .749 -0 .936 ) and 0 .781 (95 %CI:0 .645 -0 .917 ) for frozen and FFPE WSIs, respectively. For ERBB2 (Figure 3 ), the lowest and highest AUCs per fold were 0 .667 and 1 .000 , respectively, for both frozen and FFPE WSIs. The concatenated AUCs were 0 .751 (95 %CI: 0 .631 -0 .871 ) and 0 .661 (95 %CI:0 .501 -0 .821 ), respectively. For the KRAS gene (Figure 4 ), the AUCs per fold were between 0 .775 and 1 .000 for frozen WSIs and between 0 .750 and 1 .000 for FFPE WSIs.The concatenated AUCs were 0 .793 (95 %CI: 0 .706 -0 .879 ) and 0 .858 (95 %CI: 0 .738 -0 .979 )for frozen and FFPE WSIs, respectively. For the PIK3 CA gene (Figure 5 ), the concatenated AUC for the frozen WSIs was 0 .862 (95 %CI: 0 .809 -0 .916 ), with a range of 0 .705 to 0 .990 . For FFPE WSIs, the lowest and highest AUCs per fold were 0 .675 and 1 .000 ,respectively, yielding a concatenated AUC of 0 .828 (95 %CI: 0 .750 -0 .907 ). Lastly, the results for the TP53 gene are presented in Figure 6 . The AUCs per fold were between 0 .666 to 0 .810 for frozen WSIs and between 0 .702 to 0 .847 for FFPE WSIs. The concatenated AUCs were 0 .727 (95 %CI: 0 .683 -0 .771 ) and 0 .727 (95 %CI: 0 .671 -0 .784 ) for frozen and FFPE WSIs, respectively. For the colorectal cancer dataset from TCGA, mutation classification results for frozen tissues were better than those for FFPE tissues in some genes[11 ]. However, there were no significant differences between the frozen and FFPE tissues in the TCGA-STAD dataset (P= 0 .491 , 0 .431 , 0 .187 , 0 .321 , and 0 .613 between the concatenated AUCs for the frozen and FFPE tissues by Venkatraman’s permutation test for unpaired ROC curves for CDH1 , ERBB2 , KRAS, PIK3 CA, and TP53 genes, respectively. For a clearer assessment of the performance of each model,the accuracy, sensitivity, specificity, and F1 score of the classification results are presented in Table 1 .

Figure 2 Classification results of CDH1 gene in the The Cancer Genome Atlas gastric cancer dataset. A: Representative whole slide images(WSIs) of the frozen slides with CDH1 gene mutation correctly classified as mutation, with wild-type gene correctly classified as wild-type, with gene mutation falsely classified as wild-type, and with wild-type gene falsely classified as mutation, from left to right; B: Receiver operating characteristic (ROC) curves for the fold with lowest area under the curve (AUC), for the fold with highest AUC, and for the concatenated results of all ten folds, from left to right, obtained with the classifiers trained with the frozen tissues; C and D: Same as A and B but the results were for the formalin-fixed paraffin-embedded WSIs. CDH1 -M: CDH1 mutated, CDH1 -W:CDH1 wild-type.
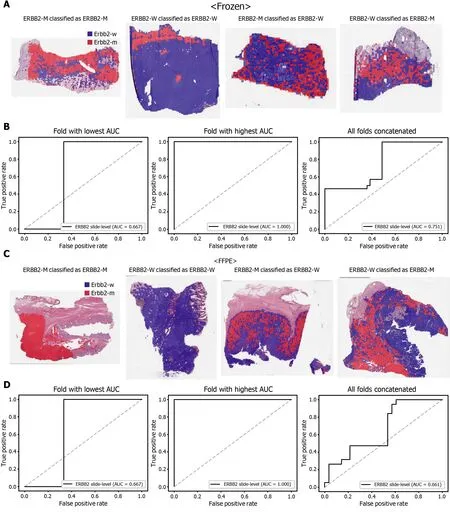
Figure 3 Classification results of ERBB2 gene in the The Cancer Genome Atlas gastric cancer dataset. The configuration of the figure is the same as in Figure 2 . A and B: Upper panels are results for the frozen tissue and lower panels; C and D: Results for the formalin-fixed paraffin-embedded tissues.ERBB2 -M: ERBB2 mutated, ERBB2 -W: ERBB2 wild-type.
The performance of a DL model on an external dataset should be tested to validate the generalizability of the trained model. Therefore, we collected GC FFPE WSIs with matching mutation data from Seoul St. Mary’s Hospital (SSMH dataset). The normal/tumor classifier for TCGA-STAD FFPE tissues was also applied to select tissue patches with high tumor probabilities. Thereafter, the mutation classifier for each genetrained on the TCGA-STAD FFPE tissues was tested on the SSMH dataset. The slidelevel ROC curves for the CDH1 , ERBB2 , KRAS, PIK3 CA, and TP53 genes are presented in Supplementary Figure 1 . The AUCs for CDH1 , ERBB2 , KRAS, PIK3 CA, and TP53 genes were 0 .667 , 0 .630 , 0 .657 , 0 .688 , and 0 .572 , respectively. For the KRAS, PIK3 CA,and TP53 genes, the performance of the TCGA-trained mutation classifiers on the SSMH dataset were worse than that of the TCGA dataset (P= 0 .389 , P = 0 .849 , P < 0 .05 ,P< 0 .05 , and P < 0 .05 for CDH1 , ERBB2 , KRAS, PIK3 CA, and TP53 genes, respectively,by Venkatraman’s permutation test for unpaired ROC curves). These results demonstrate that the mutation classifiers trained with TCGA-STAD WSI datasets had limited generalizability. It is of interest if the performance can be enhanced by training the classifiers with expanded datasets, including both TCGA and SSMH datasets.Cancer tissues from different ethnic groups can show different features[16 ,19 ];therefore, the performance of the classifiers can be improved by mixing the datasets.When the classifiers trained with the mixed datasets were used, the performance on the SSMH dataset was generally improved because the SSMH data were included in the training data in this setting (Figures 7 and 8 ). The AUCs became 0 .778 , 0 .833 , 0 .838 ,0 .761 , and 0 .775 for CDH1 , ERBB2 , KRAS, PIK3 CA, and TP53 genes, respectively (P=0 .234 , P < 0 .05 , P < 0 .05 , P = 0 .217 , and P < 0 .05 between the ROCs of classification results by classifiers trained on the TCGA-STAD dataset and mixed dataset for CDH1 ,ERBB2 , KRAS, PIK3 CA, and TP53 genes, respectively, by Venkatraman’s permutation test for paired ROC curves). Furthermore, the performance on the TCGA-STAD FFPE dataset was also generally improved by the new classifiers trained on both datasets,except for the PIK3 CA gene, which showed worse results (Supplementary Figure 2 ).The AUCs were 0 .918 , 0 .872 , 0 .885 , 0 .766 , and 0 .820 for the CDH1 , ERBB2 , KRAS,PIK3 CA, and TP53 genes, respectively (P < 0 .05 , P < 0 .05 , P = 0 .216 , P < 0 .05 , andP<0 .05 compared with the TCGA-trained classifiers by Venkatraman’s permutation test for paired ROC curves). The accuracy, sensitivity, specificity, and F1 score of the classification results of mutation prediction models trained with both SSMH and TCGA datasets are presented in Supplementary Table 4 .

Table 1 Accuracy, sensitivity, specificity, and F1 score of the classification results of mutation prediction models for the The Cancer Genome Atlas datasets
Another interesting question is whether the DL-based classifiers for mutational status can be compatible with other types of cancers. We already built the mutation classifiers for KRAS, PIK3 CA, and TP53 genes in the colorectal cancer dataset of TCGA in a previous study[11 ]. Therefore, we tested whether the classifiers trained on colorectal cancer can distinguish the mutational status in GC. As shown in Figure 9 ,the classifiers trained to discriminate the mutational status of KRAS, PIK3 CA, and TP53 genes in the FFPE tissues of colorectal cancer approximately failed to distinguish the mutational status in the FFPE tissues of the TCGA-STAD dataset, with AUCs of 0 .458 , 0 .550 , and 0 .538 for the KRAS, PIK3 CA, and TP53 genes, respectively. The results indicate that the tissue morphologic features reflecting the wild-type and mutated genes are relatively different between cancers originating from different organs.
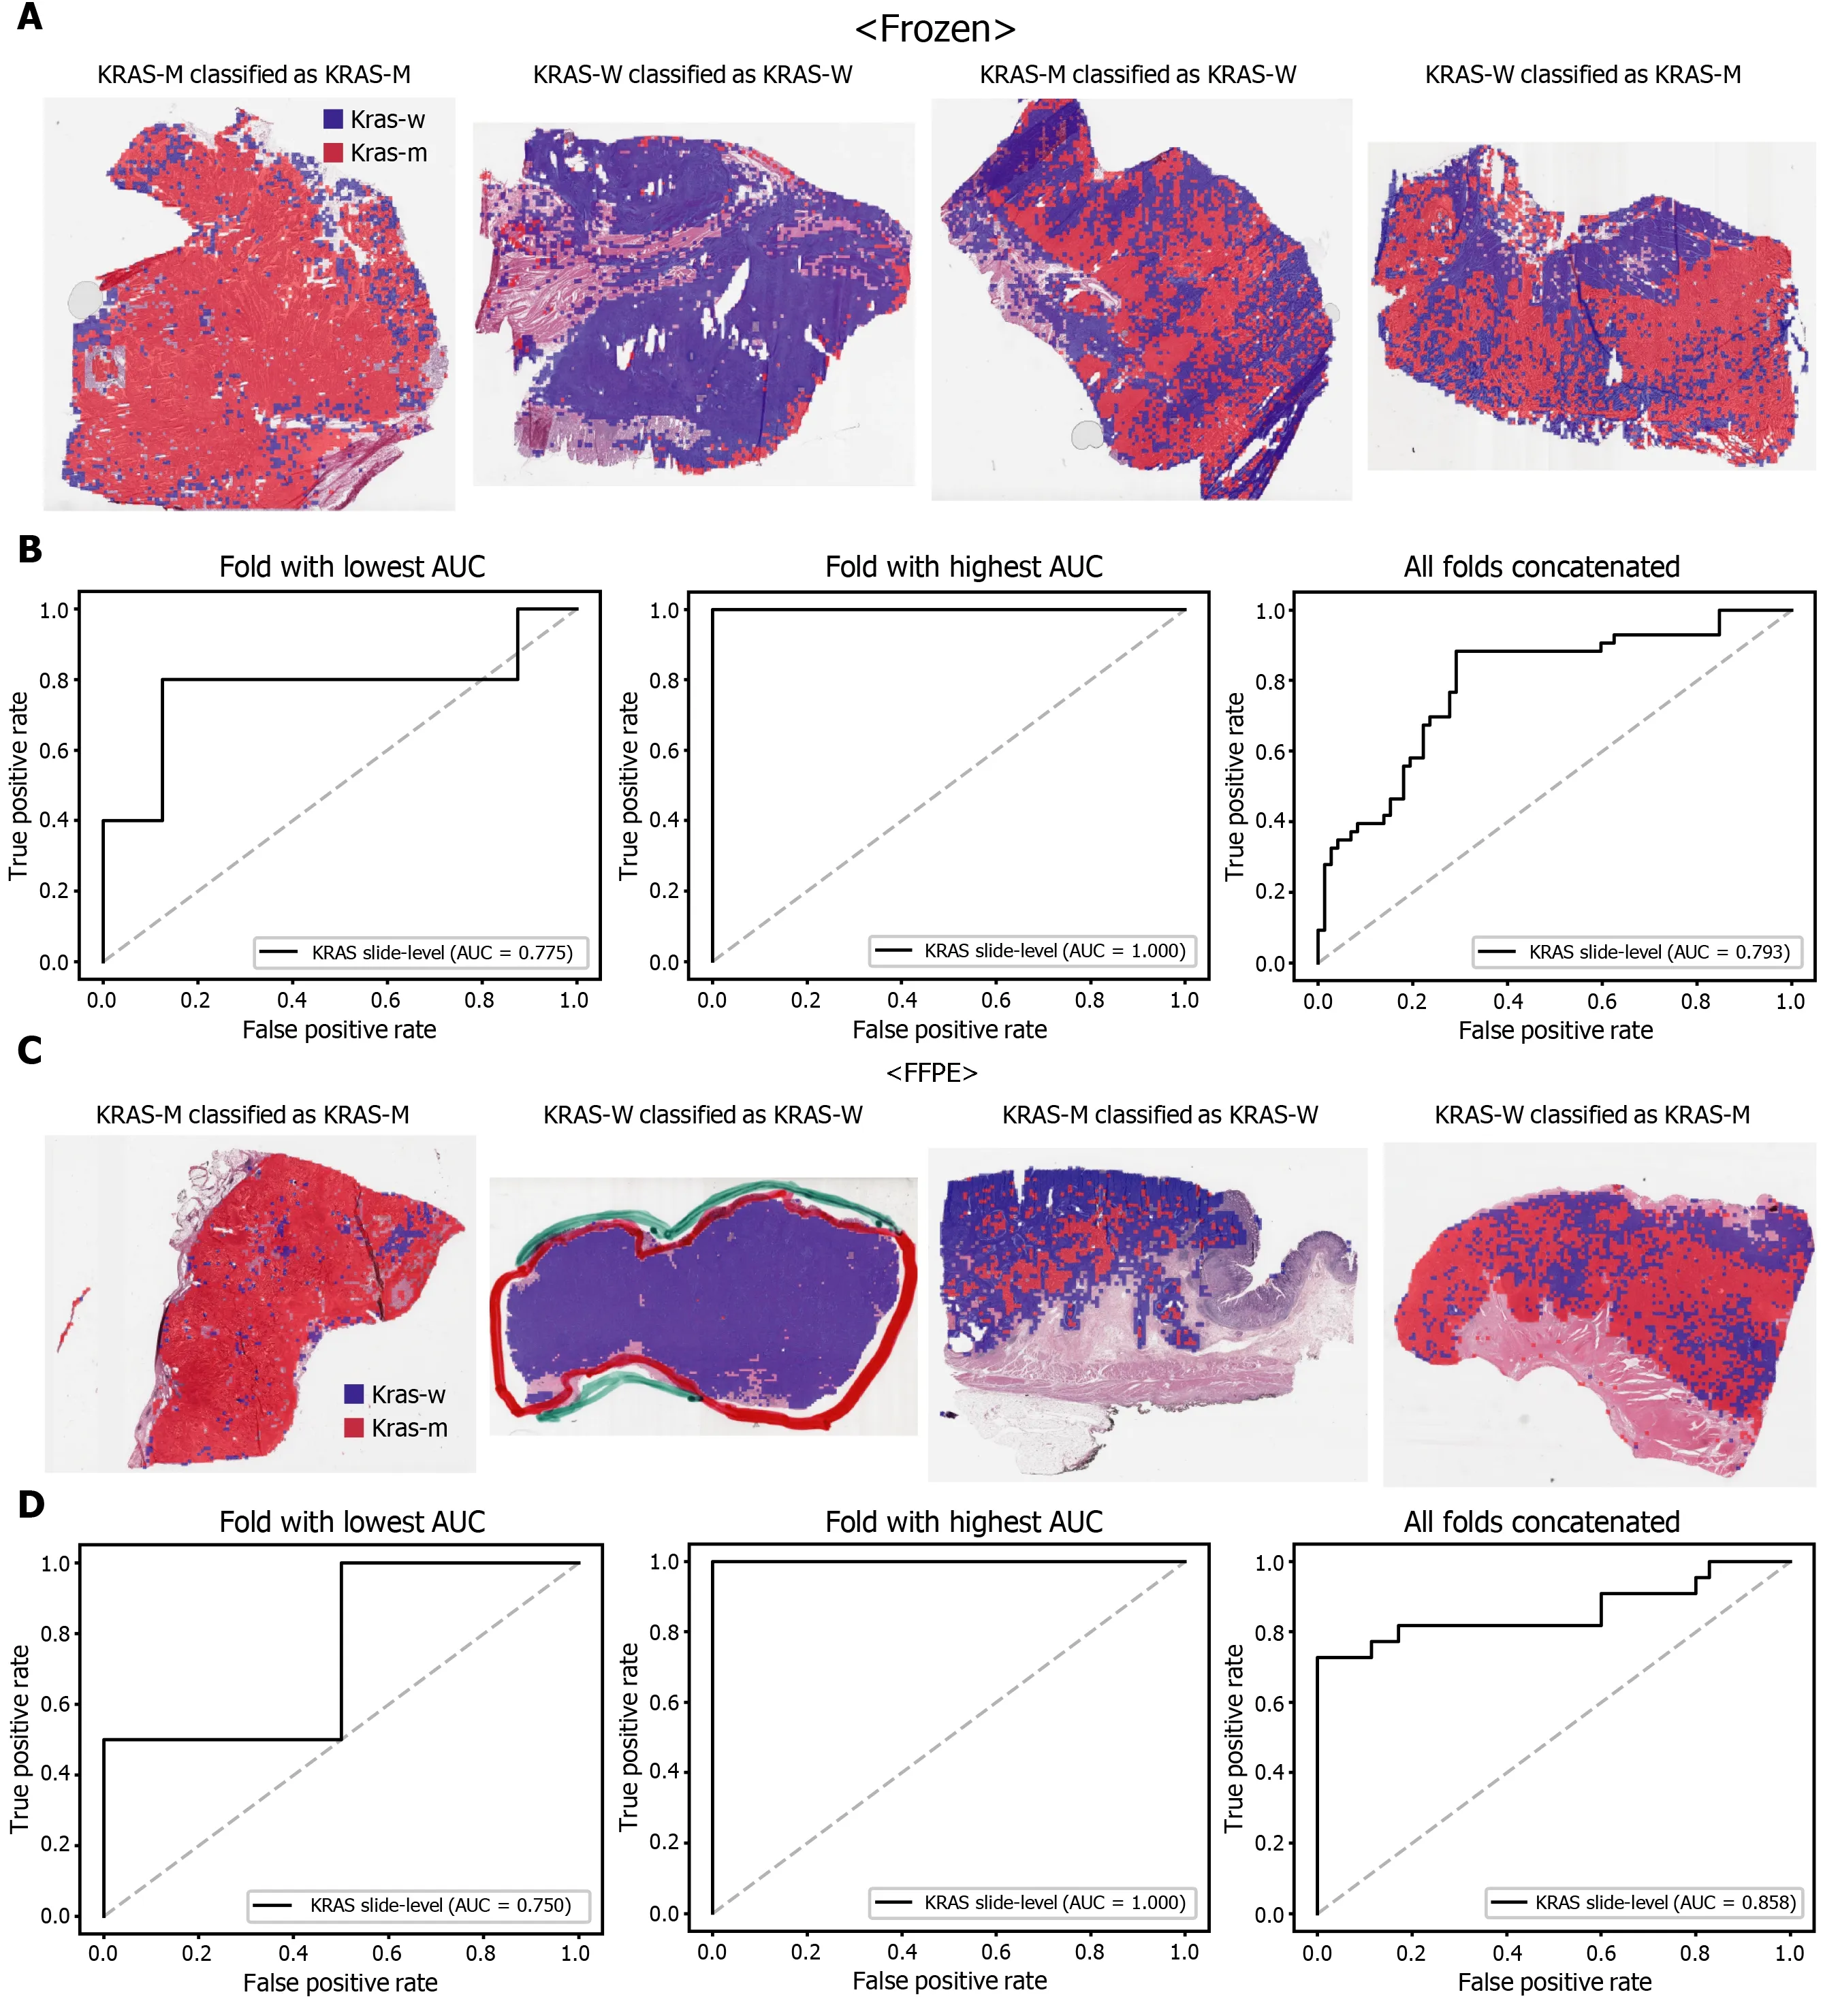
Figure 4 Classification results of KRAS gene in the The Cancer Genome Atlas gastric cancer dataset. The configuration of the figure is the same as in Figure 2 . A and B: Upper panels are results for the frozen tissue and lower panels; C and D: Results for the formalin-fixed paraffin-embedded tissues. KRAS-M:KRAS mutated, KRAS-W: KRAS wild-type.
DISCUSSION
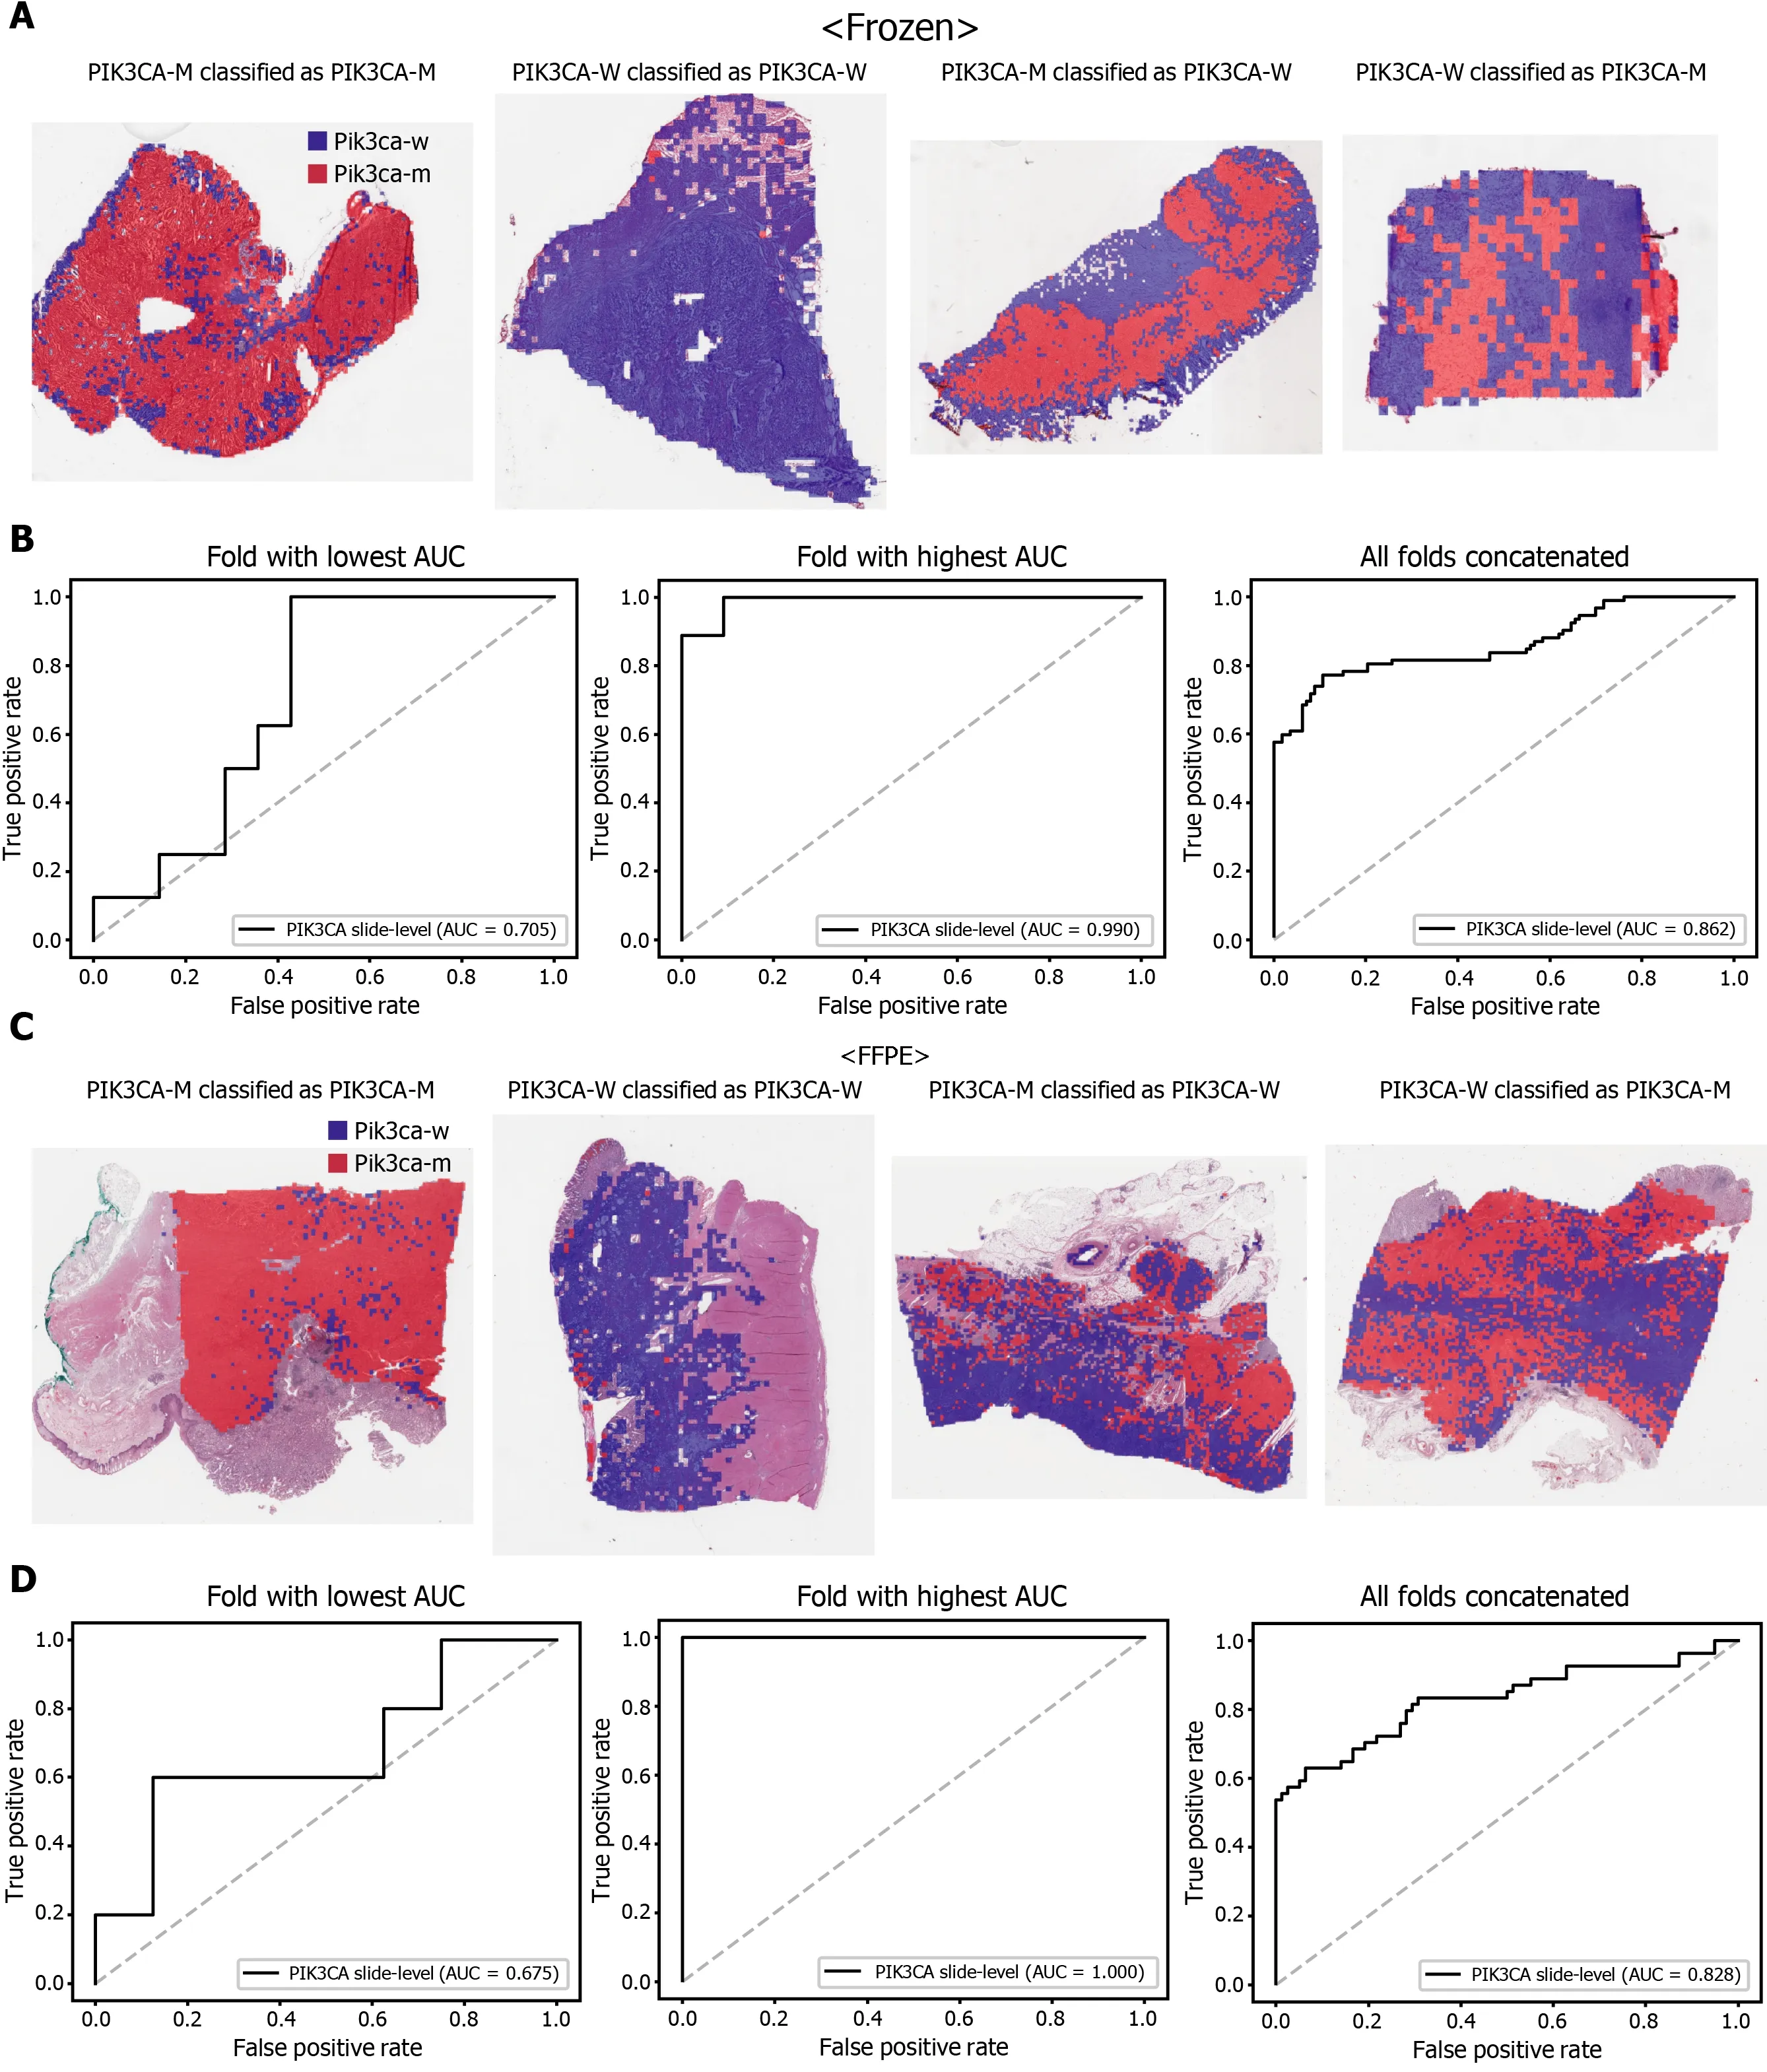
Figure 5 Classification results of PIK3 CA gene in the The Cancer Genome Atlas gastric cancer dataset. The configuration of the figure is the same as in Figure 2 . A and B: Upper panels are results for the frozen tissue and lower panels; C and D: Results for the formalin-fixed paraffin-embedded tissues.PIK3 CA-M: PIK3 CA mutated, PIK3 CA-W: PIK3 CA wild-type.
Recently, many drugs targeting specific biological molecules have been introduced to improve the survival of patients with advanced GC[31 ]. However, patient stratification strategies to maximize the treatment response of these new drugs are not yet well established. Targeted therapies can yield different responses depending on the mutational status of genes in patients with cancer[32 ]. To overcome this complexity,clinical trials for new drugs have begun to adopt the umbrella platform strategy,which assigns treatment arms based on the mutational status of cancer patients[6 ,33 ].Therefore, data regarding the mutational status of cancer patients is essential for patient stratification in modern-day medicine. However, molecular tests to detect gene mutations are still not affordable for all cancer patients. If cost- and time-effective alternative methods for mutation detection can be introduced, it will promote prospective clinical trials and retrospective studies to correlate the treatment response with the mutational profiles of cancer patients, which can be retrospectively obtained from clinical data and stored tissue samples. Therefore, the new cost- and timeeffective methods will help to establish molecular stratification of cancer patients that can be used to determine effective treatment and improve clinical outcomes[34 ].
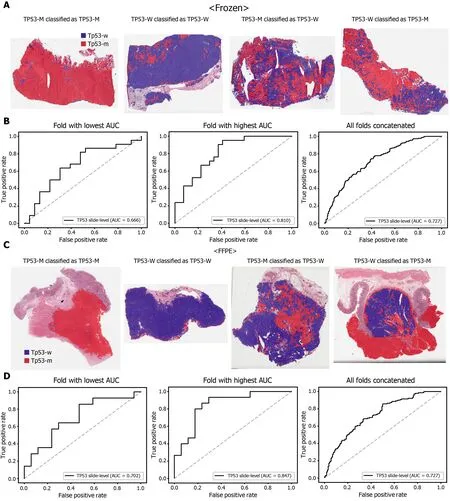
Figure 6 Classification results of TP53 gene in the The Cancer Genome Atlas gastric cancer dataset. The configuration of the figure is the same as in Figure 2 . A and B: Upper panels are results for the frozen tissue and lower panels; C and D: Results for the formalin-fixed paraffin-embedded tissues. TP53 -M:TP53 mutated, TP53 -W: TP53 wild-type.
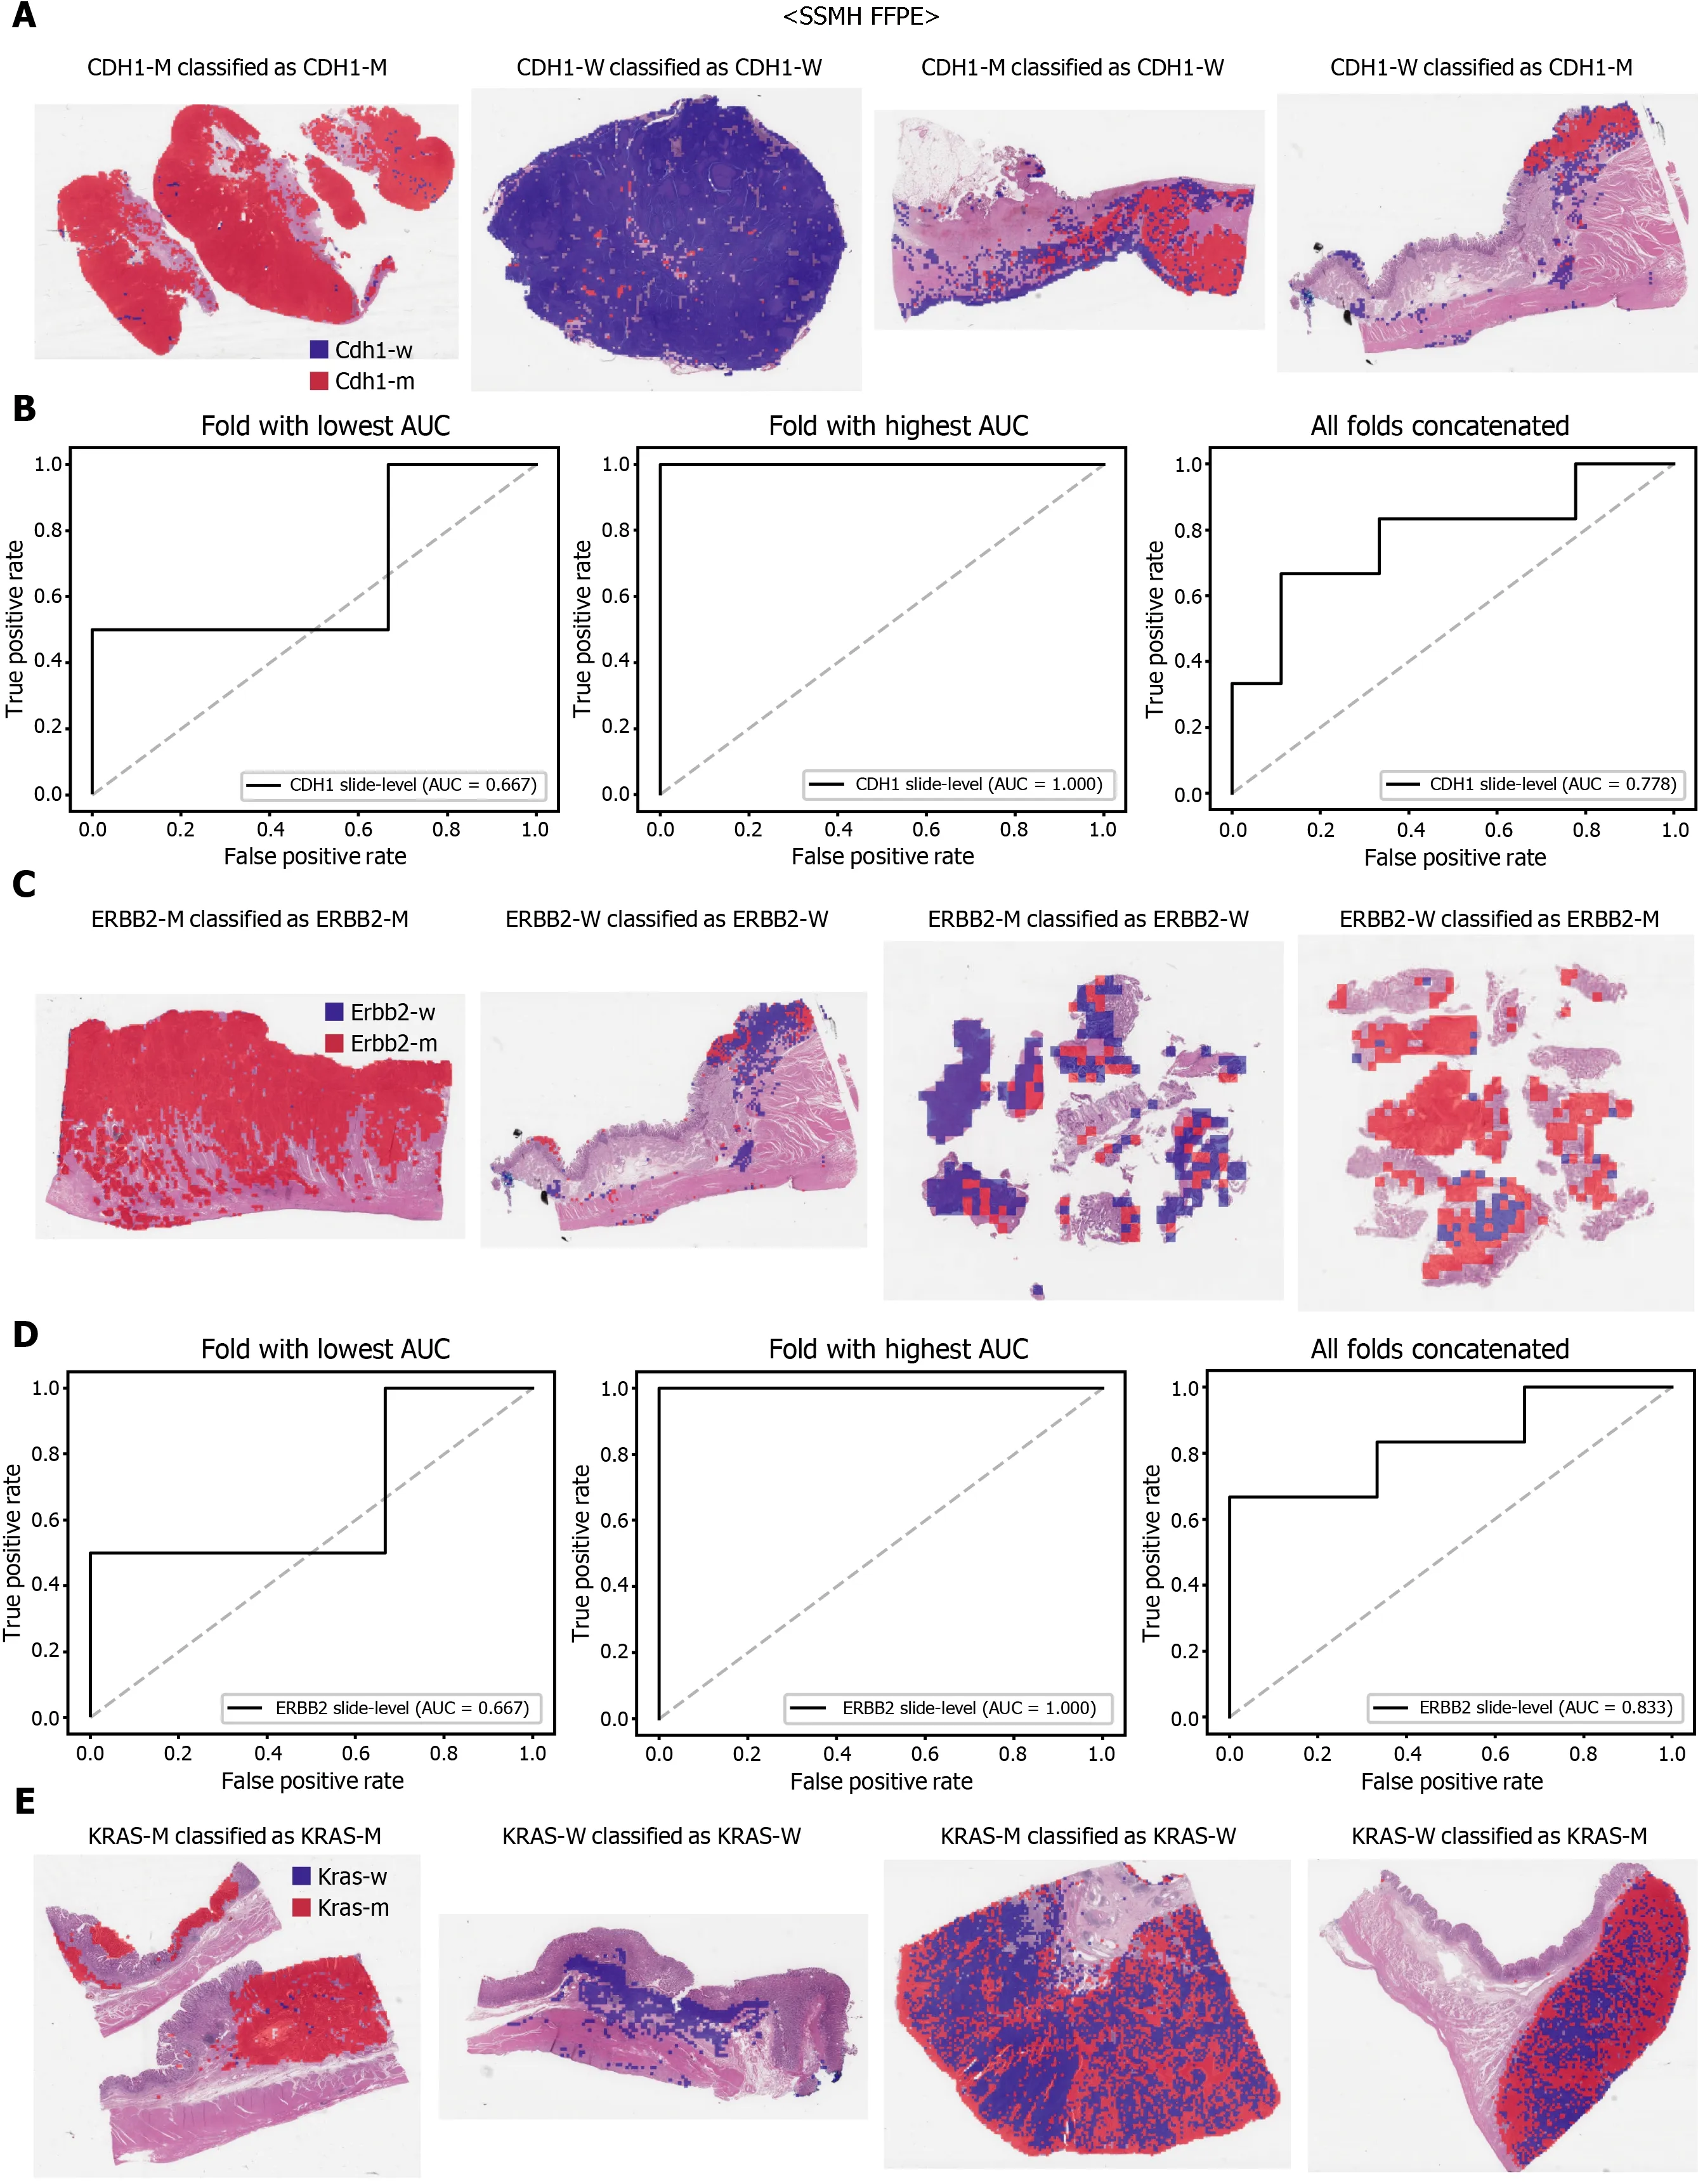

Figure 7 The classifiers trained with both The Cancer Genome Atlas and SSMH data were used to predict the mutation of CDH1 (A and B),ERBB2 (C and D), and KRAS (E and F) genes. Representative binary heatmaps of the whole slide images (WSIs) correctly classified as mutation, correctly classified as wild-type, falsely classified as wild-type, and falsely classified as mutation were presented. Receiver operating characteristic curves for the folds with the lowest and highest area under the curve and the concatenated ten folds were also presented for each gene. CDH1 -M: CDH1 mutated, CDH1 -W: CDH1 wild-type,ERBB2 -M: ERBB2 mutated, ERBB2 -W: ERBB2 wild-type, KRAS-M: KRAS mutated, KRAS-W: KRAS wild-type.
Cancer tissue slides are made and stored for most cancer patients. As a result, DLbased mutation prediction from the tissue slides can be a good candidate for alternative methods. It has been well recognized that the molecular alterations are manifested as morphologic changes in tissue architecture[35 ]. For example, some morphological features in GC tissues have been associated with specific mutations,including CDH1 and KRAS genes[36 ,37 ]. Although it is impractical to quantitatively assess these features for the detection of mutations by visual inspection, DL can learn and distinguish subtle discriminative features for mutation detection in various cancer tissues[7 -11 ]. This study demonstrated the feasibility of DL-based prediction of mutations in CDH1 , ERBB2 , KRAS, PIK3 CA, and TP53 genes, which are prevalent in both the TCGA and SSMH GC datasets, from tissue slide images of GC. Other studies have also shown that mutations in these genes are frequently observed in GC[3 ,5 ].Furthermore, many studies have attempted to evaluate the prognostic value of these mutations[3 ,5 ,38 ]. However, the clinical relevance of these mutations for prognosis and treatment response has not been completely determined because the studies often presented discordant results. Various factors, including the relatively low incidence of mutation, small study size, and ethnicity of the studied groups, may have contributed to the inconsistent study results. Although it is still unclear how specific mutations are involved in the prognosis and treatment response in GC patients, further studies for the fine molecular stratification of patients based on mutational status are ongoing[6 ].DL-based mutation prediction from the tissue slides could provide valuable tools to support these efforts because the mutational status can be promptly obtained with minimal cost from the existing H and E-stained tissue slides.
Furthermore, DL-based classifiers can provide important information for the study of tumor heterogeneity[39 ]. The heatmaps of classification results overlaid on the tissue images in figures showed that mutated and wild-type regions are aggregated into separated regions. For example, the rightmost tissues in Figure 6 C showed clear demarcation between TP53 -mutated and wild-type regions. These results indicated that a tumor tissue can contain molecularly heterogeneous regions which can be easily visualized with the help of DL-based classifiers. The clear demarcation of molecularly heterogeneous regions in a tissue slide is an important advantage of a DL-based system and it can help the studies for the understanding of the prognostic and therapeutic values of the tumor heterogeneity without the application of the very expensive molecular tests such as multi-point single-cell sequencing.
However, further studies are needed to build practical DL classifiers for mutation prediction. Our data showed that the performance was still unsatisfactory for verifying mutational status. The AUCs ranged from 0 .661 to 0 .862 for the TCGA dataset. The frequency of mutation in GC TCGA dataset was relatively low. The average mutation rate for CDH1 , ERBB2 , KRAS, PIK3 CA, and TP53 genes was 8 .28 %.In our previous study for the mutation prediction in colorectal cancer TCGA dataset,the average mutation rate for APC, KRAS, PIK3 CA, SMAD4 , and TP53 genes was 39 .18 %[11 ]. Furthermore, the classifiers showed limited generalizability to the external dataset. Because DL critically depends on data for learning prominent features, it is generally recommended to build a large multinational dataset[1 ,2 ]. Therefore, to test whether the expanded dataset can improve the performance of the classifiers, new classifiers were trained using mixed data from the TCGA and SSMH datasets. As a result, the AUCs generally increased with the larger multinational datasets. These results suggest that we could improve the performance of DL-based mutation classifiers if a large multi-national and multi-institutional dataset can be built. One exception was the PIK3 CA gene, which showed worse performance for the TCGA FFPE slides by a classifier trained with the mixed dataset. Although the reason for the decreased performance is unclear, we speculate that there are some different tissue features for the wild-type and mutated PIK3 CA gene between the two datasets due to different ethnicities, which could negatively affect the feature learning process for the TCGA dataset. In addition, the numbers of patients with PIK3 CA mutations were different; 64 and 11 for the TCGA and SSMH datasets, respectively. The different numbers of patients also hamper proper feature learning for the mixed dataset because data imbalance usually negatively affects the learning process. Furthermore, the studied tissues carry many additional mutations other than CDH1 , ERBB2 , KRAS,PIK3 CA, and TP53 genes. Because every tissue presented a different combination of mutations, the confounding effect of a mixture of different mutations on the tissue morphology would hamper the effective learning of features for the selected mutation.This factor also necessitates larger tissue datasets for proper learning of morphological features of specific mutations, irrespective of coexisting mutations. In our opinion, the datasets are still immature for building a prominent classifier for mutation prediction.Therefore, efforts to establish a larger tissue dataset with a mutation profile will help to understand the potential of DL-based mutation prediction systems. Recently, many countries have started to build nationwide datasets of pathologic tissue WSIs with genomic information. Therefore, we expect that the performance of DL-based mutation prediction can be greatly improved.
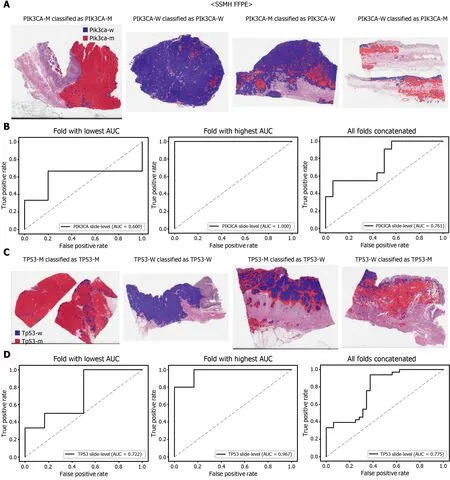
Figure 8 Mutation prediction of PIK3 CA (A and B) and TP53 (C and D) genes for the SSMH gastric cancer tissue slides by the classifiers trained with both The Cancer Genome Atlas and SSMH data. The configuration of the figure is the same as in figure 7 . PIK3 CA-M: PIK3 CA mutated,PIK3 CA-W: PIK3 CA wild-type, TP53 -M: TP53 mutated, TP53 -W: TP53 wild-type.
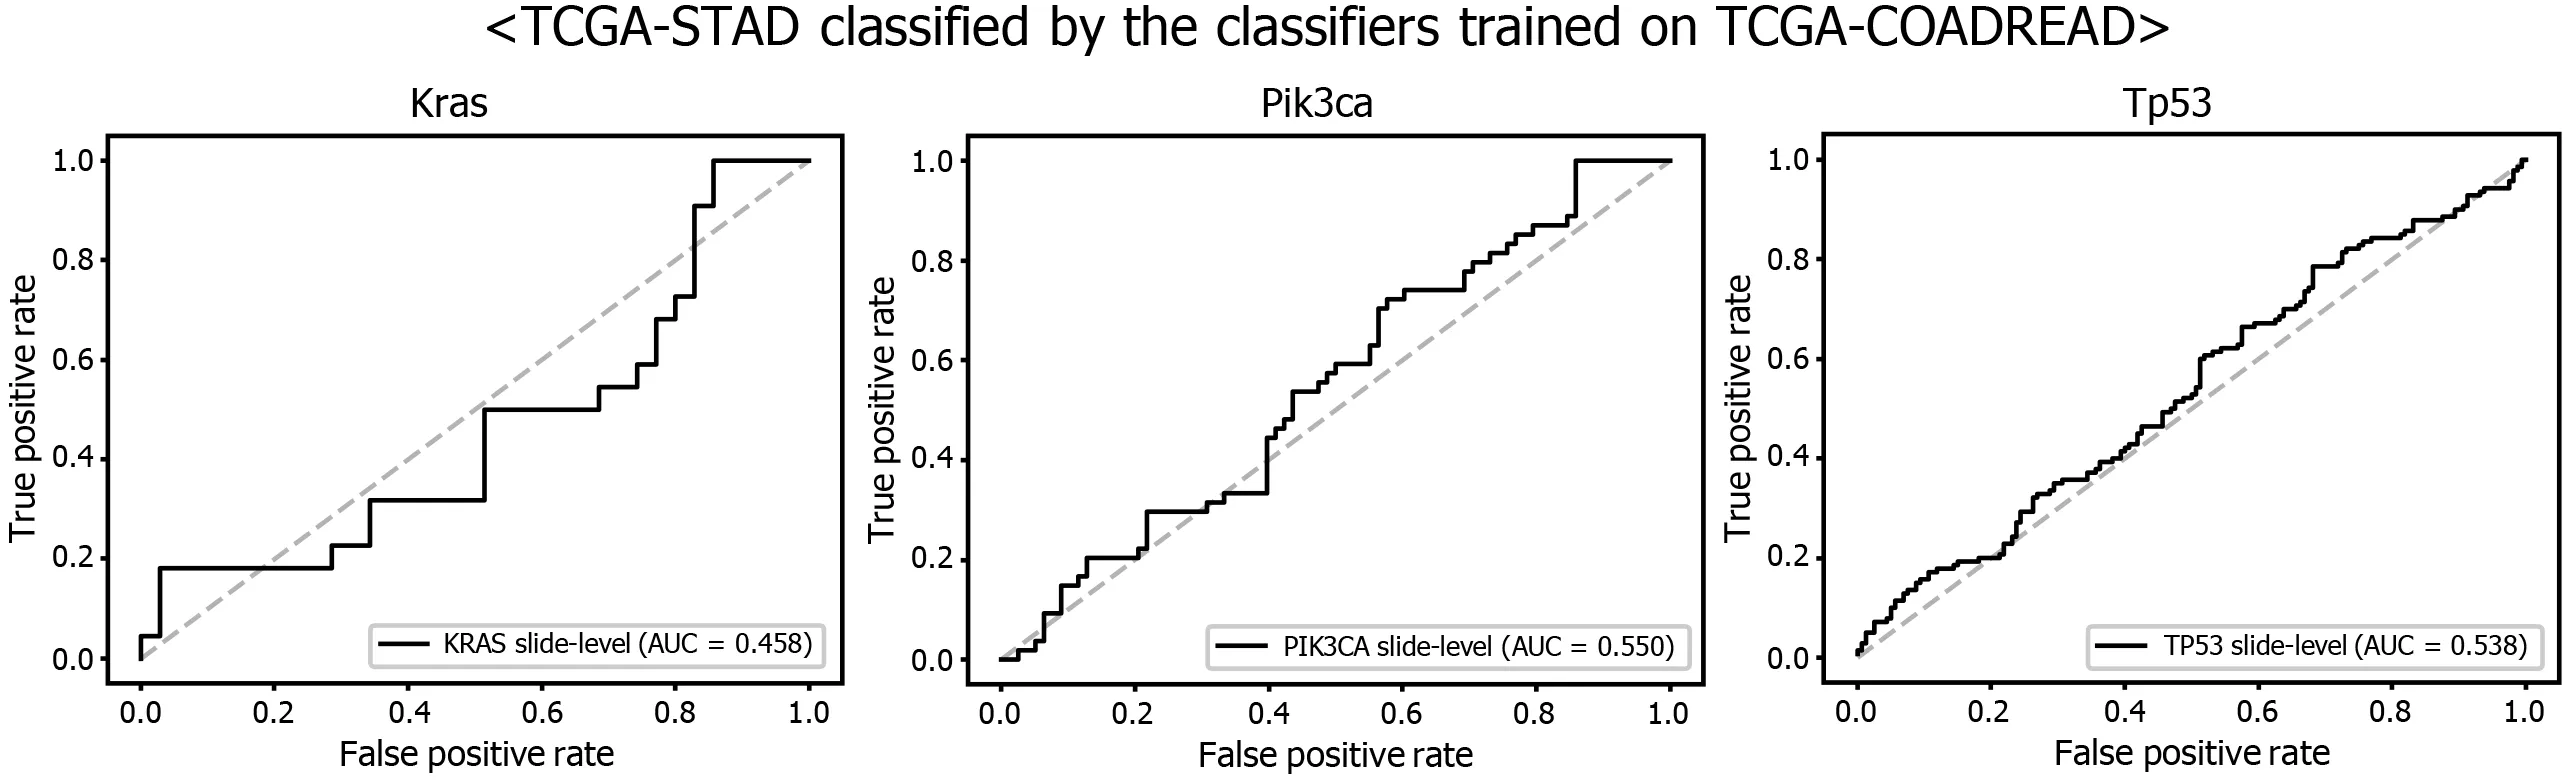
Figure 9 Mutation prediction of KRAS, PIK3 CA, and TP53 genes for the The Cancer Genome Atlas gastric cancer tissue slides by the classifiers trained with The Cancer Genome Atlas colorectal cancer tissues. Receiver operating characteristic curves of the classification results for each gene were presented.
Although we argued for the potential of DL-based mutation classifiers, there are important barriers to the adoption of DL-based assistant systems. First, the ‘black box’nature of DL limits the interpretability of DL models and remains a significant barrier in their validation and adoption in clinics[18 ,40 ,41 ]. We could not trust a decision made by a DL model before we could clearly understand the basis of the decision.Therefore, a method for visualizing the features that determine the behavior of a DL model should be developed. Another barrier is the need for an individual DL system for an individual task. As described, separate systems should be built for tasks such as the classification of normal/tumor tissues for frozen and FFPE tissues. The classifier for each mutation should also be built separately. Furthermore, as shown in Figure 9 ,there was no compatibility between the different cancer types for the classification of genetic mutations. Therefore, many classifiers should be built to achieve optimal performance. It requires time to build many necessary classifiers to renovate current pathology workflows.
CONCLUSION
Despite these limitations, DL has enormous potential for innovative medical practice.It can help capture important information by learning features automatically from the data that are waiting to be explored in the vast database of modern hospital information systems. This information will be used to determine the best medical practice and improve patient outcomes. The tissue slides of cancer patients contain important information on the prognosis of patients[42 ]; therefore, DL-based analysis of tissue slides has enormous potential for fine patient stratification in the era of precision medicine. Furthermore, its cost- and time-effective nature could help save the medical cost and decision time for patient care.
ARTICLE HIGHLIGHTS

Research objectives
To predict the mutational status of CDH1 , ERBB2 , KRAS, PIK3 CA, and TP53 genes from the H and E-stained WSIs of GC tissues with DL-based methods.
Research methods
DL-based classifiers for the CDH1 , ERBB2 , KRAS, PIK3 CA, and TP53 mutations were trained for the The Cancer Genome Atlas (TCGA) datasets. Then, the classifiers were validated with our own dataset. Finally, TCGA and our own dataset were combined to train a new classifier to test the effect of extended data on the performance of the classifiers.
Research results
The area under the curve (AUC) for receiver operating characteristic (ROC) curves were between 0 .727 and 0 .862 for the TCGA frozen WSIs and between 0 .661 and 0 .858 for the TCGA formalin-fixed paraffin-embedded WSIs. Furthermore, the results could be improved with the classifiers trained with both TCGA and our own dataset.
Research conclusions
This study demonstrated that mutational status could be predicted directly from the H and E-stained WSIs of GC tissues with DL-based methods. The performance of the classifiers could be improved if more data can be used to train the classifiers.
Research perspectives
Current molecular tests for the mutational status are not feasible for all cancer patients because of technical barriers and high costs. Although there is still room for much improvement, the DL-based method can be a reasonable alternative for molecular tests. It could help to stratify patients based on their mutational status for retrospective studies or prospective clinical trials with very low cost. Furthermore, it could support the decision-making process for the management of patients with GCs.
 World Journal of Gastroenterology2021年44期
- World Journal of Gastroenterology的其它文章
- Proton pump inhibitors and colorectal cancer: A systematic review
- Autosomal recessive 333 base pair interleukin 10 receptor alpha subunit deletion in very early-onset inflammatory bowel disease
- Treatment of Helicobacter pylori infection in the presence of penicillin allergy
- Challenges in the diagnosis of intestinal neuronal dysplasia type B: A look beyond the number of ganglion cells
- COVID-19 : Effect on gastroenterology and hepatology service provision and training: Lessons learnt and planning for the future
- Role of early transjugular intrahepatic portosystemic stent-shunt in acute variceal bleeding: An update of the evidence and future directions