
3DPhenoFish:Application for two-and threedimensional fish morphological phenotype extraction from point cloud analysis
2021-08-16 08:10:00YuHangLiaoChaoWeiZhouWeiZhenLiuJingYiJinDongYeLiFeiLiuDingDingFanYuZouZenBoMuJianShenChunNaLiuShiJunXiaoXiaoHuiYuanHaiPingLiu
Zoological Research 2021年4期
Yu-Hang Liao ,Chao-Wei Zhou ,Wei-Zhen Liu ,Jing-Yi Jin ,Dong-Ye Li ,Fei Liu ,Ding-Ding Fan,Yu Zou,Zen-Bo Mu,Jian Shen,Chun-Na Liu,Shi-Jun Xiao,,,*,Xiao-Hui Yuan,*,Hai-Ping Liu,*
1 Department of Computer Science, Wuhan University of Technology, Wuhan, Hubei 430070, China
2 Institute of Fisheries Science, Tibet Academy of Agricultural and Animal Husbandry Sciences, Lhasa, Tibet 850000, China
3 Key Laboratory of Freshwater Fish Reproduction and Development (Ministry of Education), College of Fisheries, Southwest University,Chongqing 402460, China
4 Jiaxing Key Laboratory for New Germplasm Breeding of Economic Mycology, Jiaxing, Zhejiang 314000, China
5 Huadian Tibet Energy Co., Ltd, Lhasa, Tibet 851415, China
6 China Institute of Water Resources and Hydropower Research, Beijing 100038, China
ABSTRACT Fish morphological phenotypes are important resources in artificial breeding,functional gene mapping,and population-based studies in aquaculture and ecology.Traditional morphological measurement of phenotypes is rather expensive in terms of time and labor.More importantly,manual measurement is highly dependent on operational experience,which can lead to subjective phenotyping results. Here,we developed 3DPhenoFish software to extract fish morphological phenotypes from three-dimensional (3D) point cloud data. Algorithms for background elimination,coordinate normalization,image segmentation,key point recognition,and phenotype extraction were developed and integrated into an intuitive user interface.Furthermore,18 key points and traditional 2D morphological traits,along with 3D phenotypes,including area and volume,can be automatically obtained in a visualized manner.Intuitive fine-tuning of key points and customized definitions of phenotypes are also allowed in the software.Using 3DPhenoFish,we performed high-throughput phenotyping for four endemic Schizothoracinae species,including Schizopygopsis younghusbandi,Oxygymnocypris stewartii,Ptychobarbus dipogon,and Schizothorax oconnori.Results indicated that the morphological phenotypes from 3DPhenoFish exhibited high linear correlation (>0.94) with manual measurements and offered informative traits to discriminate samples of different species and even for different populations of the same species.In summary,we developed an efficient,accurate,and customizable tool,3DPhenoFish,to extract morphological phenotypes from point cloud data,which should help overcome traditional challenges in manual measurements.3DPhenoFish can be used for research on morphological phenotypes in fish,including functional gene mapping,artificial selection,and conservation studies.3DPhenoFish is an open-source software and can be downloaded for free at https://github.com/lyh24k/3DPhenoFish/tree/master.
Keywords: Fish; Phenomics; Morphology;Point cloud; 3D scanning
INTRODUCTION
Fish morphology provides valuable data for fishery conservation management,genome association research,and artificial breeding (López-Fanjul & Toro,2007).In association studies,both genotypes and phenotypes are important data in functional gene identification. The emergence and development of high-throughput genomic sequencing has made it easy to obtain the genotypes of millions of fish;however,phenotyping based on traditional manual measurement is a limiting step in such studies and costly in terms of labor and time.More importantly,phenotyping results may be subjective as manual measurement requires training and experience.The lack of monitoring during and after manual measurement can also lead to potential phenotyping batch effects and biases (Fernandes et al.,2020).Therefore,there is great demand for a high-throughput and intelligent technique to automatically extract morphological phenotypes for fish studies.
The advancement of computer vision technology enables morphological phenotypes to be obtained from twodimensional (2D) images using a monocular camera(Hartmann et al.,2011).Imaging techniques have been applied in fish recognition (Spampinato et al.,2010) and counting (Aliyu et al.,2017;Spampinato et al.,2008) using limited 2D morphological phenotypes (mainly body length)(Hao et al.,2015;Shah et al.,2019).For more comprehensive morphological information,IMAFISH_ML (Navarro et al.,2016) uses multiple cameras to capture images from two directions for morphological phenotype measurements.Still,this requires the fish to be frozen and fins to be trimmed,causing irreversible damage to the fish.However,several noninvasive methods have been developed for living fish.For instance,Wang et al.(2019) developed a contour-based method for measuring the length of living fish in water.Fernandes et al.(2020) used a monocular camera and computer vision technique to measure body area,length,and height in tilapia.However,these studies were designed for specific fish species using 2D images,and morphological phenotypes extracted via these tools are still limited.
Although 2D features provide valuable data for phenotypes,fish are three-dimensional (3D) in nature and exhibit more elaborate and complex phenotypes,such as head volume and body conformation,which are difficult to capture by 2D imaging processes.These 3D traits provide informative phenotypes to describe conformation features (Zermas et al.,2020).However,3D phenotypes,such as surface area and volume,are difficult to measure manually.With the continued development of computer vision technology,sensor-based 3D reconstruction methods have been increasingly used in life sciences and agriculture (Comba et al.,2018),as well as in plant and livestock research.For example,mango and apple size measurement (Gongal et al.,2018;Wang et al.,2017)and guava detection and pose estimation (Lin et al.,2019)have been solved using 3D computer vision techniques.In addition,several techniques have been applied in livestock.For example,Le Cozler et al.(2019) scanned 3D images of an entire cow’s body and estimated six phenotypes:i.e.,height,heart girth,chest depth,hip width,backside width,and ischial width,which showed high correlation with manual measurements.Light detection and ranging (LiDAR) and cameras with depth information have been used to construct 3D images and calculate body conformation phenotypes in cows (Pezzuolo et al.,2018),cattle (Batanov et al.,2019;Huang et al.,2018),and horses (Pérez-Ruiz et al.,2020).These studies highlight the feasibility of using 3D information to obtain more comprehensive phenotypes for animals;however,the application of 3D imaging for morphological phenotypes in fish is limited,largely due to the lack of fishspecific tools to provide comprehensive 2D and 3D phenotype data.
In the current study,we developed 3DPhenoFish software for morphological phenotype extraction using 3D point cloud information for fish species.Its structured pipeline includes background filtering,fish segmentation,key point recognition,and phenotype extraction.Both 2D and 3D morphological phenotypes represented by body length,surface area,and volume,can be automatically extracted. In addition,3DPhenoFish also allows users to adjust key points and define new phenotypes in an intuitive visualized manner.We used endemic Schizothoracinae fish species from Tibet to validate the 3DPhenoFish phenotyping,which showed high correlation (>0.94) to manual measurements.This software could be used to discriminate samples of different species and even different populations of the same species.
MATERIALS AND METHODS
3DPhenoFish extracts the morphological phenotypes of fish from 3D point cloud data.The following points (Figure 1)describe the main data analysis pipeline steps integrated in 3DPhenoFish:
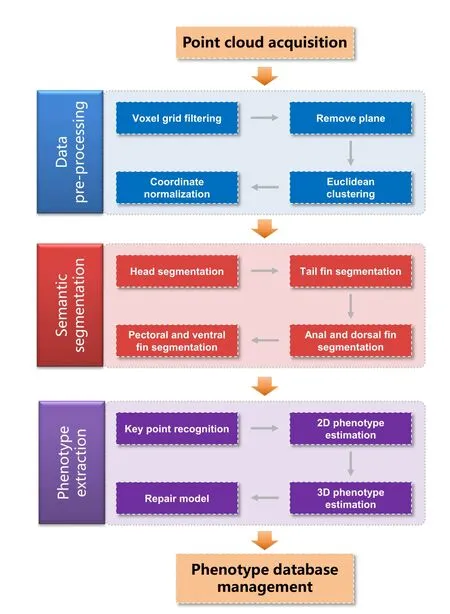
Figure 1 Workflow scheme in 3DPhenoFish for point cloud analysis and morphological phenotype extraction
1.Data acquisition:This step uses an industrial 3D scanner to obtain OBJ or PCD files as input for 3DPhenoFish.
2.Data pre-processing:This step removes background and outliers.
3.Semantic segmentation:This step deals with the segmentation of the fish head,body,and fins.
4.Morphological phenotype extraction:This step recognizes key points and extracts morphological phenotypes.
5.Phenotype management:This step involves defining custom phenotypes and key points,which are then stored in the database.
Data acquisition
The first step in using 3DPhenoFish involves scanning 3D point cloud data of fish samples.Many industrial 3D scanners can produce a full-color point cloud with an accuracy of 0.1 mm or higher,which satisfies the input data requirements for 3DPhenoFish.We used a GScan 3D scanner (http://en.zg-3d.com/fullcolor/131.html),which uses white-light grating stripe projection technology for surface scanning to obtain original point cloud data of fish (Supplementary Figure S1).Marking labels were applied to a yellow board that served as a scanning background.After anesthetization with MS-222,fish were placed on the board for scanning (see Supplementary Figure S1).
Data pre-processing
Point cloud filtering:Point cloud filtering is the first step in 3D point cloud pre-processing and influences subsequent semantic segmentation and morphological phenotype extraction.This step involves point cloud down-sampling,planar background removal,and outlier elimination (Figure 2).
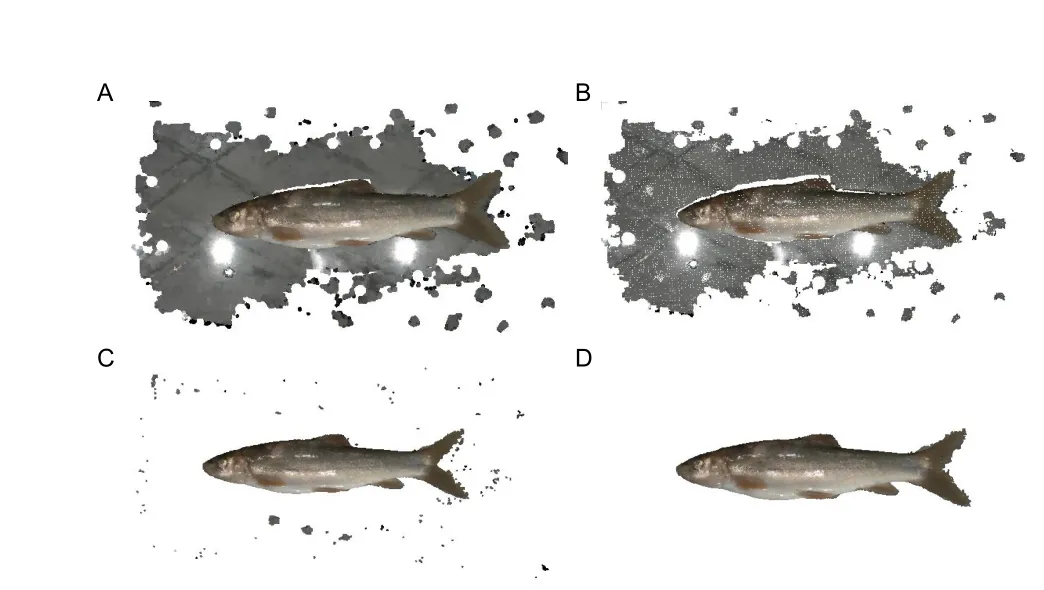
Figure 2 Point cloud filtering for fish point clouds
First,point cloud down-sampling is performed to reduce point cloud density and computational burden while maintaining conformation features.In 3DPhenoFish,downsampling is performed with the voxel grid filter method (Orts-Escolano et al.,2013).In brief,3D voxel grids,i.e.,collections of 3D cubes in space,are generated from the point cloud data,and the geometric center of the points in one voxel is used to represent the voxel overall.The default size to generate the 3D cubes is 1 mm3.
Second,sparse and discrete non-fish outliers are removed from the point cloud data.The Statistical Outlier Removal Filter (SORF) (Balta et al.,2018) is used to calculate the average distance from each point to its adjacent points.Assuming the average distances follow Gaussian distribution,points with an average distance beyond the threshold are regarded as outliers and eliminated.
Third,point data from the background plane are removed.As background points are in the same plane,the background can be removed using Random Sample Consensus(RANSAC) (Schnabel et al.,2007),with the number of random extractions of the point cloud sample set to 100 and the distance between the target point and plane set to 0.8.However,as the tail fin is close to the background plane,RANSAC-based fitting to the plane may result in tail fin removal.To solve this problem,the boundary of the fish point cloud is detected,and points on the boundary are used as seed points to grow outward based on constraints of normal difference,color difference,and spatial distance difference,thus making segmentation of the background and tail fin more accurate.Finally,taking advantage of the weak connections among sparse and discrete noisy points after removal of the background plane,distances between the target point and its neighbors are calculated,and Euclidean clustering (Wu et al.,2016) is employed to eliminate these sparse and discrete point data.
Coordinate normalization:After background and noisy point filtering,the point cloud coordinates of target fish are normalized. As the coordinate system may influence subsequent phenotype extraction,the normalized coordinates for the fish point cloud are defined as follows:the geometric center of the fish point cloud is the coordinate origin;and the X-,Y-,and Z-axes,conforming to the right-hand rule,are consistent with the directions of body length,body height,and body width,respectively.The Z-axis is perpendicular to the background,the Y-axis points to the dorsal fin,and the X-axis points to the fish tail,as shown in Figure 3.The Z-axis is the axis with the smallest angle to the normal vector of the plane point cloud extracted above.Principal component analysis(PCA) of point coordinates is employed for automatic coordinate normalization (Pezzuolo et al.,2018),and the Xaxis is the axis represented by the feature vector with the largest eigenvalue.A transformation matrix from the local coordinate system to the global coordinate system is obtained,and initial coordinate normalization is performed (Figure 3).
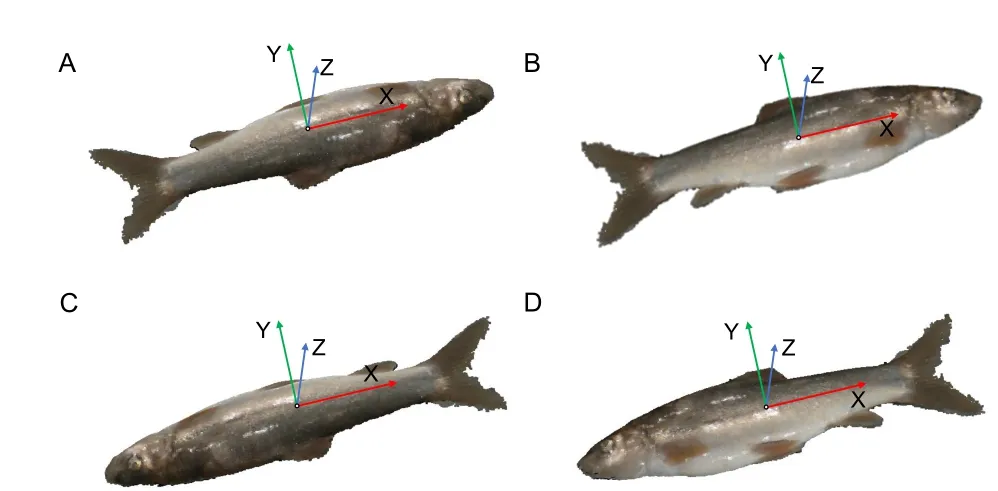
Figure 3 Coordinate normalization for fish point cloud
Although the above normalization could lay fish length along the X-axis,we still need to normalize the orientation of the head and dorsal fin.First,the point cloud is transferred so that the X-axis points to the fish tail.As the tail fin is generally closer to the background plane,the point cloud for the head shows a higher standard deviation of the Z-axis coordinate compared to that for the tail fin.Therefore,we can distinguish the head and tail by comparing coordinates of cloud points within two 15% end regions along the fish’s total length;the point cloud with a larger standard deviation of the Z-axis coordinate is the fish head.In this way,the fish coordinates can be normalized so that the X-axis points to the fish tail(Figure 3C,D).Second,the point cloud is transferred so that the Y-axis points to the dorsal fin.Given that the fish body near to the dorsal fin is darker than the belly of the fish,body colors of the cloud points can be compared in the positive and negative Y-axis regions.The larger average gray value is in the direction of the dorsal fin,and thus the fish coordinates can finally be normalized on the Y-axis (Figure 3D).
After the background is eliminated and fish coordinates are normalized,we can take advantage of symmetric features to complement the fish model.3DPhenoFish scans the fish in planes perpendicular to the X-axis with a step size of 1.For each plane,two end points on the Y-axis are selected,and a plane that crosses two end points and is parallel to the X-axis is used as the plane of symmetry to complete the fish point cloud model.Finally,point cloud data are generated to construct a symmetric complement to the fish model.
Semantic segmentation
Head segmentation based on template matching:After data pre-processing,the fish head is recognized in the point cloud.The template matching method (B?r et al.,2012) is then applied for fish head segmentation.First,we randomly choose the head of a fish of the same species as a template.The fish head template is aligned to the target point cloud using the Sample Consensus Initial Alignment (SAC-IA) algorithm (Chen et al.,2017) and Iterative Closest Point (ICP) algorithm (Besl& McKay,1992) for coarse and fine registration,respectively;thus,we obtain the approximate orientation of the head.
Fish eye segmentation based on curvature:Based on the fish head segmentation above,we can calculate and obtain 200 points with the top curvature value in the fish head region.Considering the circular shape of the fish eye,RANSAC is applied to segment the circular part of the fish as the eye.
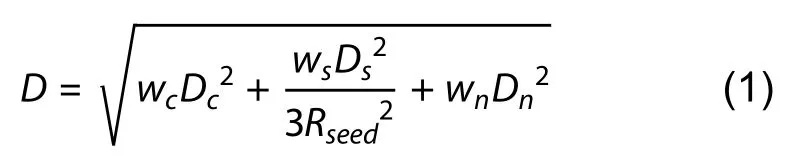
Fin segmentation based on super voxel region growth:A super voxel-based region growth segmentation method is used to separate the point cloud for fish fins.As an initial step,the super voxel method (Li & Sun,2018) is used to presegment the point cloud.First,the point cloud is voxelized to obtain a voxel cloud.We can then construct a mesh of the voxel space using resolutionRseedand select the voxel closest to the center of the mesh as the initial seed voxel.We then calculate the number of voxels in the neighborhood radiusRsearchof the seed voxel,and seed voxels with a number less than the threshold (four as default) are deleted.DistanceDof a seed voxel to its neighboring voxels within the radius ofRseedis then calculated using equation 1,whereDcis the Euclidean distance in normalized RGB space,Dsis the Euclidean distance between two voxels,Dnis the normal angle between two voxels,andwc,ws,andwnare the weights for distances.The neighboring voxel with the smallestDvalue is considered as the super voxel,and the neighboring voxels of this voxel are added to the search queue.All other seed voxels are grown simultaneously using the above method until the number of super voxels exceeds the threshold (1 800 as default),or all neighboring points have been clustered.Finally,we obtain a pre-segmentation result for the point cloud(Figure 4A).
Based on the pre-segmentation results,the fins are segmented by an adaptive weighted region growth segmentation method (Vo et al.,2015).First,we select the super voxel with the smallest mean curvature as the seed facet and build a seed facet queue.We then calculate theDmbetween the seed facet and its neighboring facets according to equation 2,whereGfis the difference in average gray value between two super voxels,Dfis the difference in normal angle difference between two super voxels,andλandμare weights.

If theDmof a facet is smaller than the threshold,the facet is clustered with the seed facet,marked as used,and queued as a seed facet.The facets in the seed queue are used until the seed queue is empty and all facets are marked as used.In addition,the color weight threshold and normal angle weight threshold need to be set.If the difference in spatial features between two facets is very large,the value ofμshould increase;if the difference in spatial features is small but the difference in color features is large,the value ofλshould increase. The pseudocode for facet region growth is presented in Algorithm 1.The segmentation results are shown in Figure 4B.

Algorithm 1 Adaptive weighted super voxel region growth segmentation
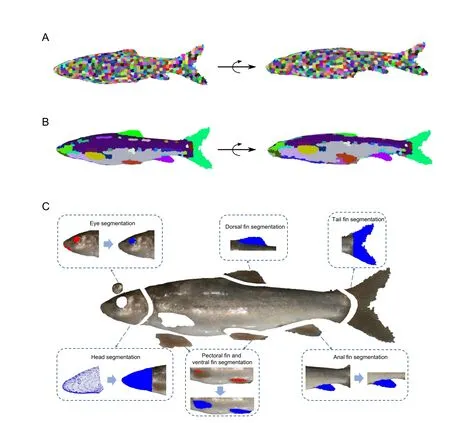
Figure 4 Semantic segmentation for fish point cloud
Based on the fish body segmentation,the semantic assignment of the tail and dorsal fin is accomplished using their relative spatial coordinates.The clusters with the largest average X-coordinate and largest average Y-coordinate are recognized as the tail and dorsal fin,respectively.The cloud points between the tail and dorsal fin are analyzed,and the cluster with the smallest average Y-coordinate in the region is recognized as the anal fin.For semantic assignment of the pectoral and ventral fin,the belly of the fish is defined as the cloud points between the head and anal fin with a negative Ycoordinate.The top 100 points with the largest curvatures are then clustered into two groups using theK-means method;these clusters are assigned as the pectoral and ventral fin,according to their relative position to the head.
Morphological phenotype extraction
Based on the semantic segmentation results,key points on the fish body are recognized according to their relative position on the fish point cloud.Thus,we obtain 18 key points on the fish point cloud (Figure 5A).Here,we summarize these key points.

Figure 5 Key point recognition and phenotype extraction
The snout point (A) is the point with the smallest Xcoordinate of the head.The front point of the eye (B) and back point of the eye (C) are the points with the smallest and largest X-coordinates,respectively.The external point of the opercular (D) is the point closest to the right-middle point of the head bounding box.The starting point of the pectoral fin(E) is the point closest to the left-top point of the pectoral fin bounding box.The end point of the pectoral fin (F) is the point with the largest X-coordinate of the pectoral fin.The lowest point of the ventral margin (G) is the point with the smallest Ycoordinate of the fish body after the fin is removed.The starting point of the ventral fin (H) is the point closest to the left-top point of the ventral fin bounding box.The end point of the ventral fin (I) is the point closest to the right-top of the ventral fin bounding box.The starting point of the anal fin (J) is the point with the smallest X-coordinate of the anal fin.The end point of the anal fin (K) is the point closest to the right-top of the anal fin bounding box.The upper (O) and lower points of the caudal peduncle (L) are the points with the largest and smallest Y-coordinates,respectively.The end point of the coccyx (M) is the point closest to the left-middle point of the tail fin bounding box.The end point of the tail fin (N) is the point with the largest X-coordinate of the tail fin.The key points of the caudal peduncle (O and L) are the two points with the smallest difference in the Y-coordinate under the same X-coordinate of the caudal peduncle.The end point of the dorsal fin (P) is the point with the largest X-coordinate of the dorsal fin.The starting point of the dorsal fin (Q) is the point with the smallest X-coordinate of the dorsal fin.The highest point of the dorsal margin (R) is the point with the largest Y-coordinate of the fish body after the fin is removed.
Traditional 2D morphological phenotypes are defined and calculated as distances among these key points.Figure 5A shows the full length (SV),body length (SU),dorsal snout distance (SX),head length (ST),body height (WY),anal ventral distance (HJ),caudal peduncle height (OL),caudal peduncle length (ZU),dorsal length (QP),pectoral length (EF),ventral length (HI),anal length (JK),tail length (UV),snout length (AB),eye diameter (BC),head behind eye length (CD),and dorsal tail distance (XU).In addition,3D phenotypes from the point cloud are also calculated,such as body surface (BS),head volume (HV),body volume (BV),height of head arc(HAH),width of head arc (HAW),length of head arc (HAL),height of dorsal arc (DAH),width of dorsal arc (DAW),length of dorsal arc (DAL),height of caudal peduncle arc (CAH),width of caudal peduncle arc (CAW),and length of caudal peduncle arc(CAL) (Figure 5B).The Poisson surface reconstruction method and VTK library are used to construct the closed triangular mesh model and calculate the surface area and volume,respectively.
Phenotype management
After calculating the phenotypes,the user can click the“phenotype management” icon in the toolbar to call up the phenotype management dialog box.This module stores the phenotype computing time,file path of the segmented point cloud,typical key points,and phenotypic information.Key point coordinates and morphological phenotypes can be downloaded as a CSV file for subsequent analysis and data sharing.(Supplementary Figure S2)
Main interface development
3DPhenoFish has an intuitive user interface embedded with the aforementioned analytical functions and enables the user to visualize the point clouds,key points,and phenotypes.The interface was written in Visual C++in Microsoft Visual Studio 2015 and runs under Microsoft Windows 10.The core algorithm was based on the open-source Point Cloud Library(PCL) (Rusu & Cousins,2011) and Open-Source Computer Vision Library (OpenCV) (Bradski & Kaehler,2008).The graphical user interface (GUI) was created with Qt 5.12 framework (The Qt Company Ltd.). Functions of 3D visualization and view rendering were based on the opensource Visualization Toolkit (VTK) (Schroeder et al.,2000).
Key point and phenotype customization
Although system-default key points and phenotypes are automatically recognized and extracted in 3DPhenoFish,we added functions to customize key points and phenotypes for greater flexibility.For key points,a user can adjust their precise location and even add new key points by simple mouse operations.The user can also double-click on the key point name in the key point list (Figure 6;Supplementary Figure S3);the corresponding key points in the visualization window are then highlighted in green.The position of a key point can be moved by mouse while holding down “shift” on the keyboard.Modified points are colored blue.3DPhenoFish also allows the user to customize a phenotype definition by the “custom phenotype” function listed in the toolbar (Figure 6;Supplementary Figure S3).New phenotypes can be defined by assigning the system-default and user-defined key point name in the combo box.Length between two points,angle between three points,and area among three points can be defined as new phenotypes in 3DPheoFish.
3DPhenoFish validation
To validate the accuracy and feasibility of 3DPhenoFish,we compared phenotype automatically extracted from the software to manual measurements for identical samples.To this end,119 fish from four major genera in Schizothoracinae,i.e.,59Schizopygopsis younghusbandi,11Oxygymnocypris stewartii,19Ptychobarbus dipogon,and 30Schizothorax oconnori,were collected from the Lhasa and Yarlung Zangbo rivers in Tibet.The 3D point clouds for these samples were obtained using GScan and the above 2D and 3D phenotypes were extracted using 3DPhenoFish.In addition,the 2D phenotypes were also manually measured by traditional methods.Correlation analysis for the 3DPhenoFish and manual measurements was performed to evaluate the accuracy of automatic phenotype extraction.The 2D and 3D phenotypes were used to discriminate samples in terms of species and populations using linear discriminant analysis(LDA) (Balakrishnama & Ganapathiraju,1998) in Python(Oliphant,2007).The significance of phenotype differences was tested using studentt-test in the R package.
RESULTS
According to the flow chart in Figure 1,we collected point clouds and extracted morphological phenotypes for 119 fish from four major genera in Schizothoracinae.The 3D point clouds for the same fish samples were obtained using GScan.As a result,the data obtained for each fish consisted of about 0.7 million vertices and 1.4 million faces,which were used to verify the feasibility of 3D data model construction and automatic extraction of morphological phenotypes.
First,30 fish samples were randomly selected to evaluate the accuracy of the extracted phenotypes.Eighteen key points were automatically recognized for all samples,and 2D morphological phenotypes were extracted and compared to traditional manual measurements (Supplementary Table S1).The Pearson correlation coefficient (r) between the calculated and measured phenotypes was higher than 0.94 (Figure 7;Supplementary Table S1),thus verifying the reliability of the extracted morphological phenotypes by 3DPhenoFish.
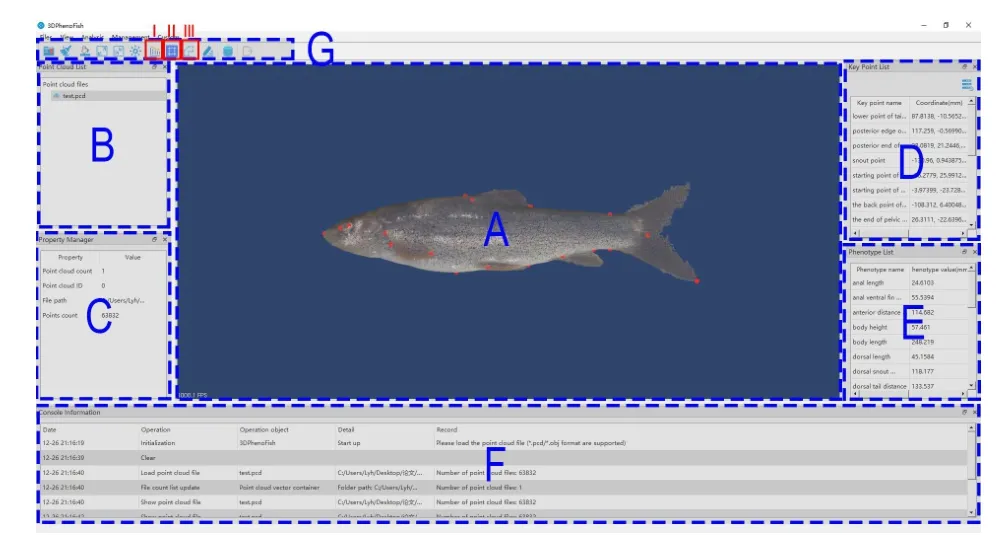
Figure 6 Main interface of 3DPhenoFish
Using the 19 default morphological phenotypes extracted by 3DPhenoFish,we then performed fish sample clustering analysis.As shown in Figure 8A,theO.stewartiiandS.oconnorisamples were obviously separated;however,theS.younghusbandisamples exhibited significant overlap with theP.dipogonsamples.To improve the resolution of species separation,we added 3D phenotypes for sample clustering,which resulted in more obvious discrimination between samples from different species (Figure 8B).We also observed that morphological traits related to the head and dorsal fin exhibited significant differences among species.The head height and head length ratios ofO.stewartiiandP.dipogonwere significantly smaller than those ofS.younghusbandiandS.oconnori(P<2e-16 based on analysis of variance (ANOVA),Figure 9A),thereby indicating that the head is relatively narrow forO.stewartiiandP.dipogon.In addition,the dorsal snout distance and body length ratio forO.stewartiiandS.oconnoriwas significantly larger (P<2e-16 for ANOVA,Figure 9B),indicating that the position of the dorsal fin in these two species was significantly different from that ofS.younghusbandiandP.dipogon.Interestingly,we found that 2D and 3D phenotypes extracted from 3DPhenoFish could also discriminateS.younghusbandisamples from populations in the Lhasa River,Yarlung Zangbo River Saga section,and Yarlung Zangbo River Zhongba section (Figure 8C,D).Remarkably,several phenotypes,e.g.,dorsal arc width and caudal arc width ratio (P=3.6e-11 for ANOVA,Figure 9C) and head volume and head length ratio (P=0.002 6 for ANOVA,Figure 9D),exhibited significant differences among populations.For instance,the dorsal and caudal arc width ratio was higher forS.younghusbandisamples from the Yarlung Zangbo River than from the Lhasa River,indicating thatS.younghusbandifrom the Lhasa River is slimer.Whether the phenotype differentiation is related to adaptation to the local environment requires further investigation.
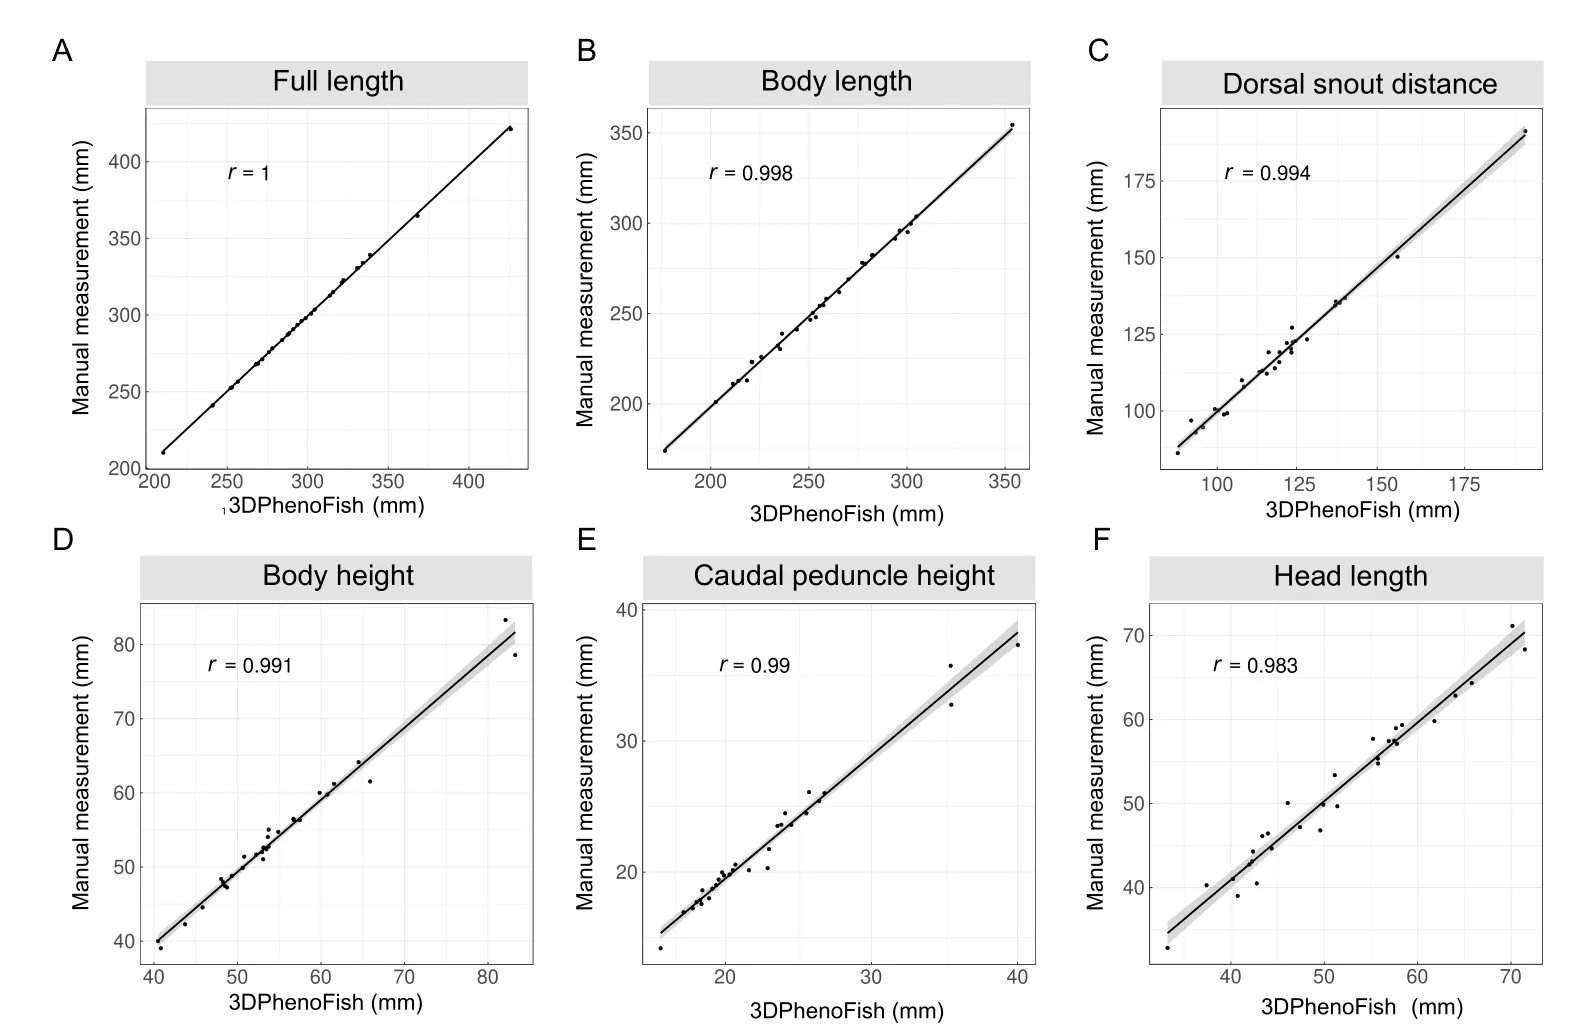
Figure 7 Linear correlation analysis of morphological phenotypes from 3DPhenoFish and manual measurement
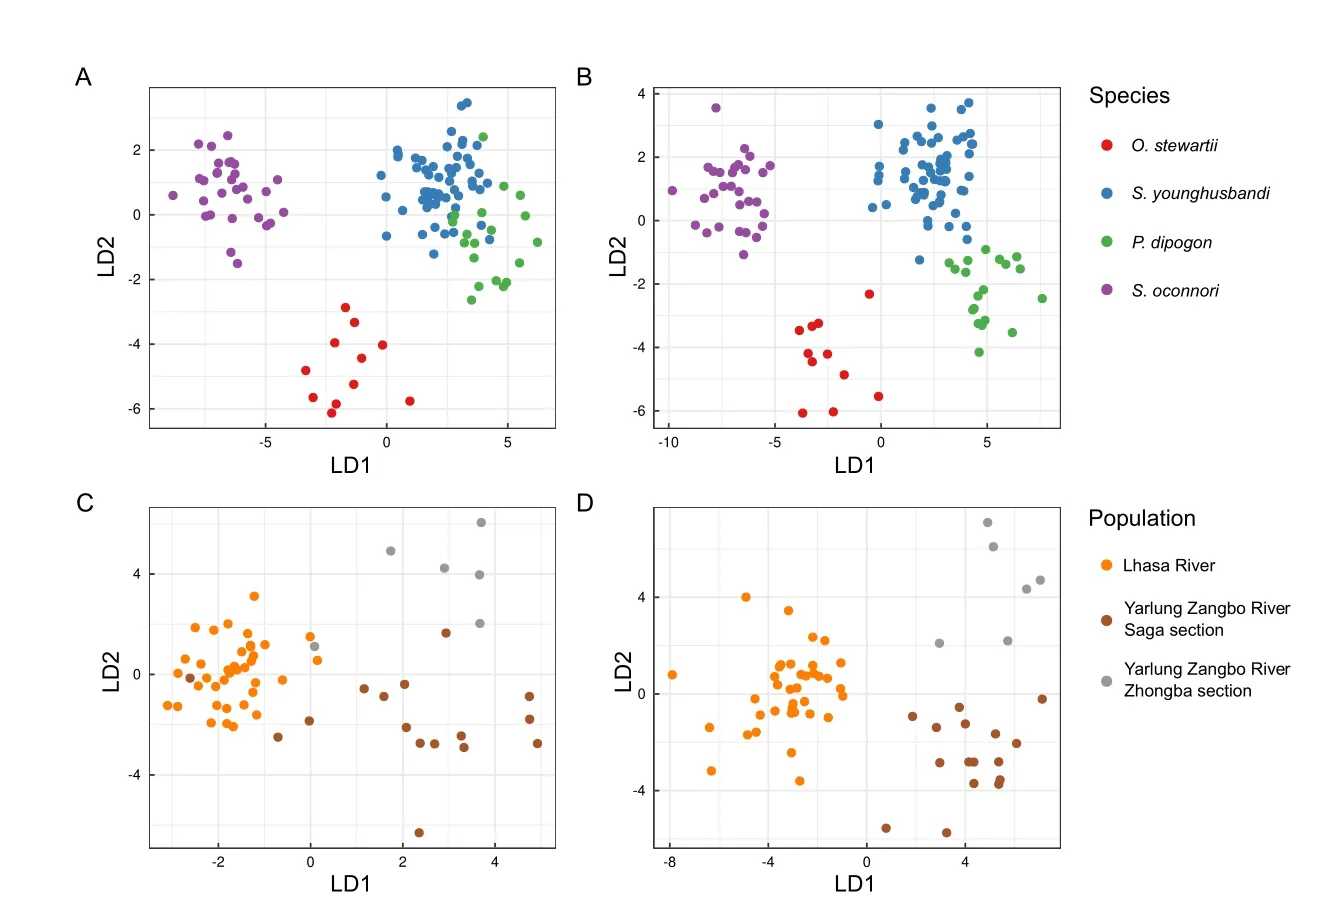
Figure 8 Phenotype-based clustering of sample classifications of species and populations using linear discriminant analysis
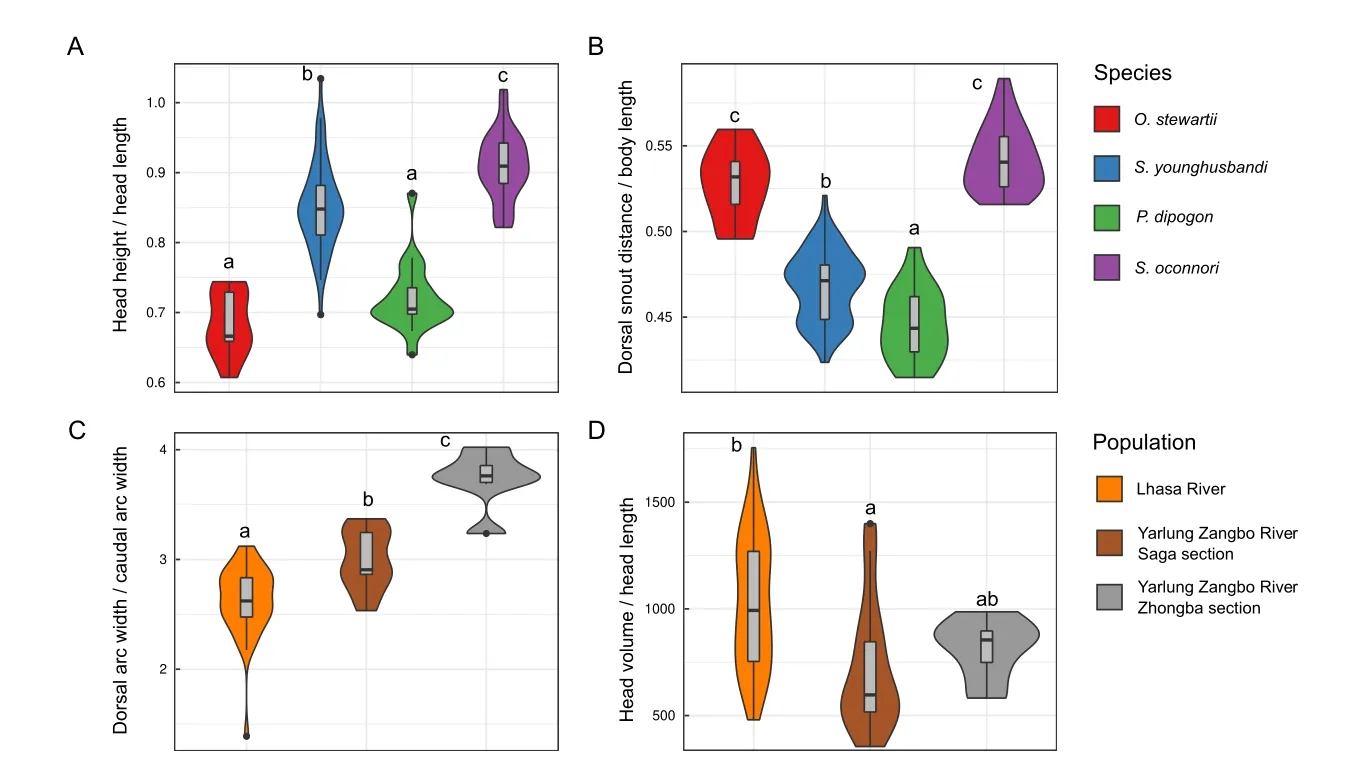
Figure 9 Morphological phenotypes exhibited significant differences among species and Schizopygopsis younghusbandi populations
DISCUSSION
In this work,we developed a practical application,3DPhenoFish,to extract fish morphological phenotypes from point cloud data. The features of 3DPhenoFish are summarized as follows:
1.Easy to use:The structured pipeline for point cloud data analysis was developed and embedded in the 3DPhenoFish interface,thereby lowering the barrier to morphological phenotyping for users without programing skills or biological backgrounds.
2.Objective:The automatic phenotyping ensures objective results and prevents inconsistency in phenotype definitions across users.
3.Efficient:Whole scanning and phenotyping for a Schizothoracinae fish usually takes 40–50 s,which is significantly faster than the 5–6 min required for traditional manual measurements. This efficient phenotyping also alleviates stress on the fish.
4.Accurate:Comparison of 3DPhenoFish and manual measurements confirmed the accuracy of the automatic phenotyping result.
5.Customizable:The automatically recognized key points can be adjusted,and new key points can be added.Customized phenotypes from the relative position of existing key points can also be defined.
6.Accessible:The phenotype and sample data are accessible by the phenotype management module,which can be downloaded and shared for the further analysis.
Here,3DPhenoFish application for Tibetan Schizothoracinae fish species exhibited good performance for phenotype extraction.We showed that 2D and 3D phenotypes could be obtained in a throughput manner and could be used for species and population discrimination in wild fish resource management.The 3D phenotypes provided data for sample discrimination,and morphological traits related to the head and dorsal fin exhibited significant differences among species.However,3DPhenoFish is still under development,and there remain several limitations in its application. Firstly,3DPhenoFish only supports OBJ files and PCD files containing full-color information.In addition,point cloud scanning requires fish to keep still on the plane background,and therefore,anesthetization may be necessary for stresssensitive fish species.Finally,3DPhenoFish provides a general framework for fish species;therefore,it is necessary to validate image segmentation and phenotyping results before large-scale application to other species.
CONCLUSIONS
In this paper,we proposed a novel strategy to extract morphological 2D and 3D phenotypes from 3D point cloud data.To achieve intelligent phenotyping,algorithms for point cloud pre-processing,semantic segmentation,key point recognition,morphological phenotype extraction were developed.As an easy-to-use visual tool for fish phenotype analysis,3DPhenoFish was developed by embedding those functions in a user-friendly interface. Basic phenotype extraction in 3DPhenoFish requires no user knowledge of programming or biology.Advanced functions for fine-tuning key points and defining new phenotypes are available for expert users.
We employed the proposed technique for phenotype analysis of Tibetan endemic fish species:i.e.,S.younghusbandi,O.stewartii,P.dipogon,andS.oconnori.Comparing our results to manual measurements,3DPhenoFish exhibited high accuracy for traditional morphological phenotypes.The phenotypes were used in clustering analysis of the fish samples.We demonstrated that the 2D and 3D phenotypes enabled good discrimination among species and even samples for the same species but from different populations.
3DPhenoFish presents an efficient and accurate technique to obtain 2D and 3D phenotypes for fish species.The point cloud scanning is easy and fast,reducing the stress on fish during operation.More importantly,the strategy requires no knowledge of programing or biology;therefore,it could be applied in large-scale fish phenotyping surveys in aquaculture and conservation studies.
SUPPLEMENTARY DATA
Supplementary data to this article can be found online.
COMPETING INTERESTS
The authors declare that they have no competing interests.
AUTHORS’ CONTRIBUTIONS
H.P.L.,X.H.Y.,and S.J.X.designed the research.Y.H.L.,C.W.Z.,Z.B.M.,F.L.,D.D.F.,Y.Z.,and J.S.collected samples and performed point cloud scanning.Y.H.L.,D.Y.L.,J.Y.J.,S.J.X.,W.Z.L.,and C.N.L.developed the application.Y.H.L.and C.W.Z.performed manual phenotyping and comparison.Y.H.L.,S.J.X,H.P.L.,and X.H.Y.wrote the manuscript.All authors read and approved the final version of the manuscript.

- Zoological Research的其它文章
- Melatonin relieves heat-induced spermatocyte apoptosis in mouse testes by inhibition of ATF6 and PERK signaling pathways
- Genome and population evolution and environmental adaptation of Glyptosternon maculatum on theQinghai-Tibet Plateau
- A new snake species of the genus Gonyosoma Wagler,1828 (Serpentes:Colubridae) from Hainan Island,China
- Inhibition of mTOR signaling by rapamycin protects photoreceptors from degeneration in rd1 mice
- A bright future for the tree shrew in neuroscience research:Summary from the inaugural Tree Shrew Users Meeting
- PINK1 gene mutation by pair truncated sgRNA/Cas9-D10A in cynomolgus monkeys