
Associations between measures of pediatric human resources and the under-five mortality rate: a nationwide study in China in 2014
2021-07-15 01:41:34XiZhangJianWangLiSuHuangXinZhouJulianLittleThereseHeskethYongJunZhangKunSun
World Journal of Pediatrics 2021年3期
Xi Zhang· Jian Wang· Li-Su Huang· Xin Zhou· Julian Little· Therese Hesketh· Yong-Jun Zhang· Kun Sun
Abstract Background To quantify the associations between the under-five mortality rate (U5MR) and measures of pediatric human resources, including pediatricians per thousand children (PPTC) and the geographical distribution of pediatricians.Methods We analyzed data from a national survey in 2015-2016 in 2636 counties, accounting for 31 mainland provinces of China.We evaluated the associations between measures of pediatric human resources and the risk of a high U5MR (≥ 18 deaths per 1000 live births) using logistic regression and restricted cubic spline regression models with adjustments for potential confounders.PPTC and pediatricians per 10,000 km 2 were categorized into quartiles.The highest quartiles were used as reference.Results The median values of PPTC and pediatricians per 10,000 km 2 were 0.35 (0.20-0.70) and 150 (50-500), respectively.Compared to the counties with the highest PPTC (≥ 0.7), those with the lowest PPTC (< 0.2) had a 52% higher risk of a high U5MR, with an L-shaped relationship.An inverted J-shaped relationship was found that the risk of a high U5MR was 3.74 [95% confidence interval (CI) 2.55-5.48], 3.07 (95% CI 2.11-4.47), and 2.25 times (95% CI 1.52-3.31) higher in counties with < 50, 50-149, and 150-499 pediatricians per 10,000 km 2 , respectively, than in counties with ≥ 500 physicians per 10,000 km 2 .The joint association analyses show a stronger association with the risk of a high U5MR in geographical pediatrician density than PPTC.Conclusion Both population and geographical pediatrician density should be considered when planning child health care services, even in areas with high numbers of PPTC.
Keywords China · Human resources for health · Inequality · National survey · Pediatrician
Introduction
Despite considerable progres s over the past few decades, children's health remains a major global challenge [1- 3].The global under-five mortality rate (U5MR) has been halved since 1990, but remains high in many low- and middle-income countries [1- 3].Economic factors, such as gross domestic product (GDP) per capita, are related to the U5MR.However, the relationship between GDP and the U5MR is highly inconsistent, even in adjacent areas of the same country [4].
The distribution of medical human resources, especially the quantity of pediatricians, may contribute to discrepancies in child mortality rate.It seems intuitive that increasing the supply of pediatricians, which increases the availability of health workers, would reduce poor health outcomes in children, particularly among those that require the specialized expertise of pediatricians.However, the few studies that have been conducted on this topic have produced inconsistent results regarding whether of the number of pediatricians is associated with reductions in infant mortality rate or U5MR [5- 8].As we know, the quantity of pediatricians is a basic factor of health systems; however, the number of pediatricians alone is not sufficient for accessibility of health service.They must be reasonably allocated and accessible to the customer population to provide quality service [9, 10].Especially in cases of a severe pandemic disease outbreak, such as the coronavirus disease 2019 infection of this year, the reasonable and effective distribution of medical resources plays a critical role.However, there is limited evidence on the relationship between distribution of human resources and health outcomes.
The unequal distribution of pediatricians is a persistent barrier to health care access in children worldwide.China has a high degree of geographic variation in the availability of local pediatricians [11], largely due to its vast size, large population and diverse economic levels.In 2010, the U5MRs in eastern, central, and western China were 4.58, 5.62, and 9.81, respectively [12].Our previous data showed that the number of pediatricians per thousand children (PPTC) was 1.0 in eastern China and 0.30 in western China [13]; these data, together with the 2010 U5MR data, are consistent with an association between PPTC and U5MR.Similarly, recent data from the U.S.population from 2005 to 2015 found a negative association between physician supply and mortality [14].However, high PPTC do not always indicate a low mortality.For example, Hainan province with a relatively high PPTC in China still has high U5MR.This might be caused by the inequalities in geographic access to health care services.However, even more limited evidences were focused on the relationship geographic distribution of human resource and health outcomes.
Therefore, we used the dataset from a hospital-based national survey to assess whether the risk of high U5MRs is associated with pediatric human resource measures, including number of hospitals per thousand children and geographical pediatrician density.We used the data from a national survey of hospitals in China, a unique dataset on the distribution of national pediatricians and hospitals, which provides the unique opportunity to assess the relationship between a variety of human resources and the U5MR [13].
Methods
Study design and population
We extracted the data from a national cross-sectional hospital survey conducted in 2015-2016 that covered 2636 counties from 31 provinces in mainland China.The current study was commissioned by the National Health and Family Planning Commission and was conducted by two organizations: The Society of Pediatrics of the Chinese Medical Association and the Pediatric Society of Chinese Medical Doctors Association.The study design has been described in a previous article [13].In brief, a total of 54,214 hospitals identified from central government records were invited to participate in the national survey; these included all children's hospitals, all maternal and child healthcare hospitals, and all tertiary and secondary general hospitals with pediatric departments.In total, 91.76% (response rate) hospitals completed the survey.Because of the large number of primary care facilities, a complex, multistage, probability sampling design was used to select the primary care hospitals.Based on the sample weights, 4623 of the total 45,648 primary care hospitals were included.In the current study, we combined hospital-level data to obtain countylevel data for analysis.
Characteristics of the pediatricians and hospitals
As described in our previous article, data were provided by senior hospital personnel between June 2015 and October 2016 using an online questionnaire.The pediatrician was identified as those pediatricians and assistant pediatricians with certification, no matter what their education backgrounds.For every healthcare facility, data were collected on the type and location of the institution, on the number of and training received by pediatric care personnel, on the number of pediatric beds, and on the pediatric care workload.The pediatric care workloads were classified as high if the annual number of outpatient visits per hospital was greater than the median level of 76,993 visits/year and if the number of emergency visits was greater than the median of 9800 visits/year.Pediatrician characteristics, including age, highest education level (postgraduate, undergraduate, junior college, or polytechnic school), and professional title (none, resident, and attending or staffphysician), also were reported.The data reported were based on values and information from 2014.The structured questionnaire was developed by expert epidemiologists, pediatricians, hospital directors, and government officials, and the questionnaire was pilot tested at the authors institute to assess its validity and reliability.Additionally, well-trained staffwere responsible for study implementation.
Measures of pediatric human resources
We calculated the number of PPTC per county according to the child population from the 2014 population census [11].The geographic density of pediatricians in each county was calculated as the ratio of the total number of pediatricians to the county's area in units of 10,000 km2.
Adjustment factors
Data on county size, including its area in km2, whether it is urban or rural, its GDP per capita, its climate type, its altitude, the number or proportion of the population engaged in agricultural work, and the total population were extracted from the statistical yearbook of each county by two researchers independently.
Mortality rates
The U5MRs in 2012 were used and computed by the national Annual Report System on Maternal and Child Health [15].In brief, the U5MRs were calculated after correction for completeness of reported U5MRs and after addition of excess mortality due to natural disasters, such as the 2008 Sichuan earthquake, using a validated small area estimation method combined with spatiotemporal regression and Gaussian process regression to deal with stochastic fl uctuation in death numbers over time in counties.The primary outcome for this analysis was high U5MR, which was defined as 18 deaths per 1000 live births, the highest quartile [15].
Statistical analyses
In this study we excluded 18 counties for which we were unable to obtain mortality information and 79 counties for which were unable to obtain child population information.A total of 2636 counties were included in the current analyses.
We described the characteristics of the hospitals and pediatricians in each county, including the geographical density of pediatricians, the proportions of pediatricians with professional titles (resident, attending physician, staffphysician), the ages (< 35 years, 35-45 years, 45-60 years) and education levels of the pediatricians (postgraduate degree, undergraduate degrees, junior college or lower degrees), number of tertiary and secondary hospitals per 10,000 km2, proportions of each level of hospital (primary hospitals, undergraduate degrees, junior college or lower degrees), the number of specialized hospitals (children's hospitals and maternal and child health hospitals), and the number of high-workload hospitals, for the entire cohort of counties and counties stratified by PPTC quartiles.
We used logistic regression to evaluate the associations of the risk of a high U5MR at the county level with the number of PPTC, geographical pediatrician density, proportion of pediatricians with a Master's level or higher education, measures of hospital density, and proportion of hospitals with emergency services.The odds ratios (ORs) and their 95% confidential intervals (CIs) were calculated.In each model, we adjusted for county size, GDP per capita, climate type, altitude, proportion of the population engaged in agriculture, and the child population.All counties with missing values for any variable were deleted from the regression analysis.Additionally, to avoid collinearity effects, different groups of predictive variables were entered into the model separately.We fitted restricted cubic spline regression models with adjustment for the above mentioned factors to explore a possible nonlinear or linear relationship between three measures of pediatric human resources (PPTC, geographical density of pediatricians and geographical density of tertiary and secondary hospitals) and the risk of a high U5MR.Also, the histogram for PPTC, geographical density of pediatricians and geographical density of tertiary and secondary hospitals were conducted.
We further constructed logistic regression models to evaluate the joint associations of PPTC with both geographical density of pediatricians and geographic density of tertiary and secondary hospitals on the risk of a high U5MR after stratification by PPTC quartiles and geographical density of pediatricians or PPTC and geographical density of tertiary and secondary hospitals.
Pairwise deletion was used for missing values in the analyses.All statistical analyses were performed using SAS (version 9.4; SAS Institute) software.A 2-tailedPvalue < 0.05 was considered statistically significant.
Results
Distribution characteristics of the pediatricians and hospitals
Across the entire 2014 dataset, the median number of PPTC was 0.35 (P25-P75: 0.20-0.70) and 150 per 10,000 km2(P25-P75: 50-500) (Table 1).Counties with a high number of PPTC also had a relatively high geographical density of pediatricians.Among the regions with the highest PPTC, there were more than 0.7 pediatricians per 1000 children, and the geographical density of pediatricians was 1074 pediatricians per 10,000 km2(P25-P75: 310-3544), whereas in the regions in which the number of PPTC was less than 0.2, there was a median of 57.9 pediatricians per 10,000 km2(P25-P75: 24.8-124.0).Regarding the overall number of hospitals per 10,000 km2, on average there were 75.3 hospitals (P25-P75: 15.7-250.0) with pediatric departments, 14.0 tertiary/secondary hospitals (P25-P75: 7.0-46.0), 11.3 primary hospitals (P25-P75: 4.9-32.2), and 2.73 specialized children's hospitals (P25-P75: 0-7.45) (these data were not shown in the Tables).
To illustrate the differences in the geographical densities of pediatricians, we provide three very different examples: Zhejiang Province in East China (a high-GDP region), Ningxia Hui Autonomous Region in West China (a low-GDP region), and Jiangxi Province in Central of China (Supplementary Table 1).
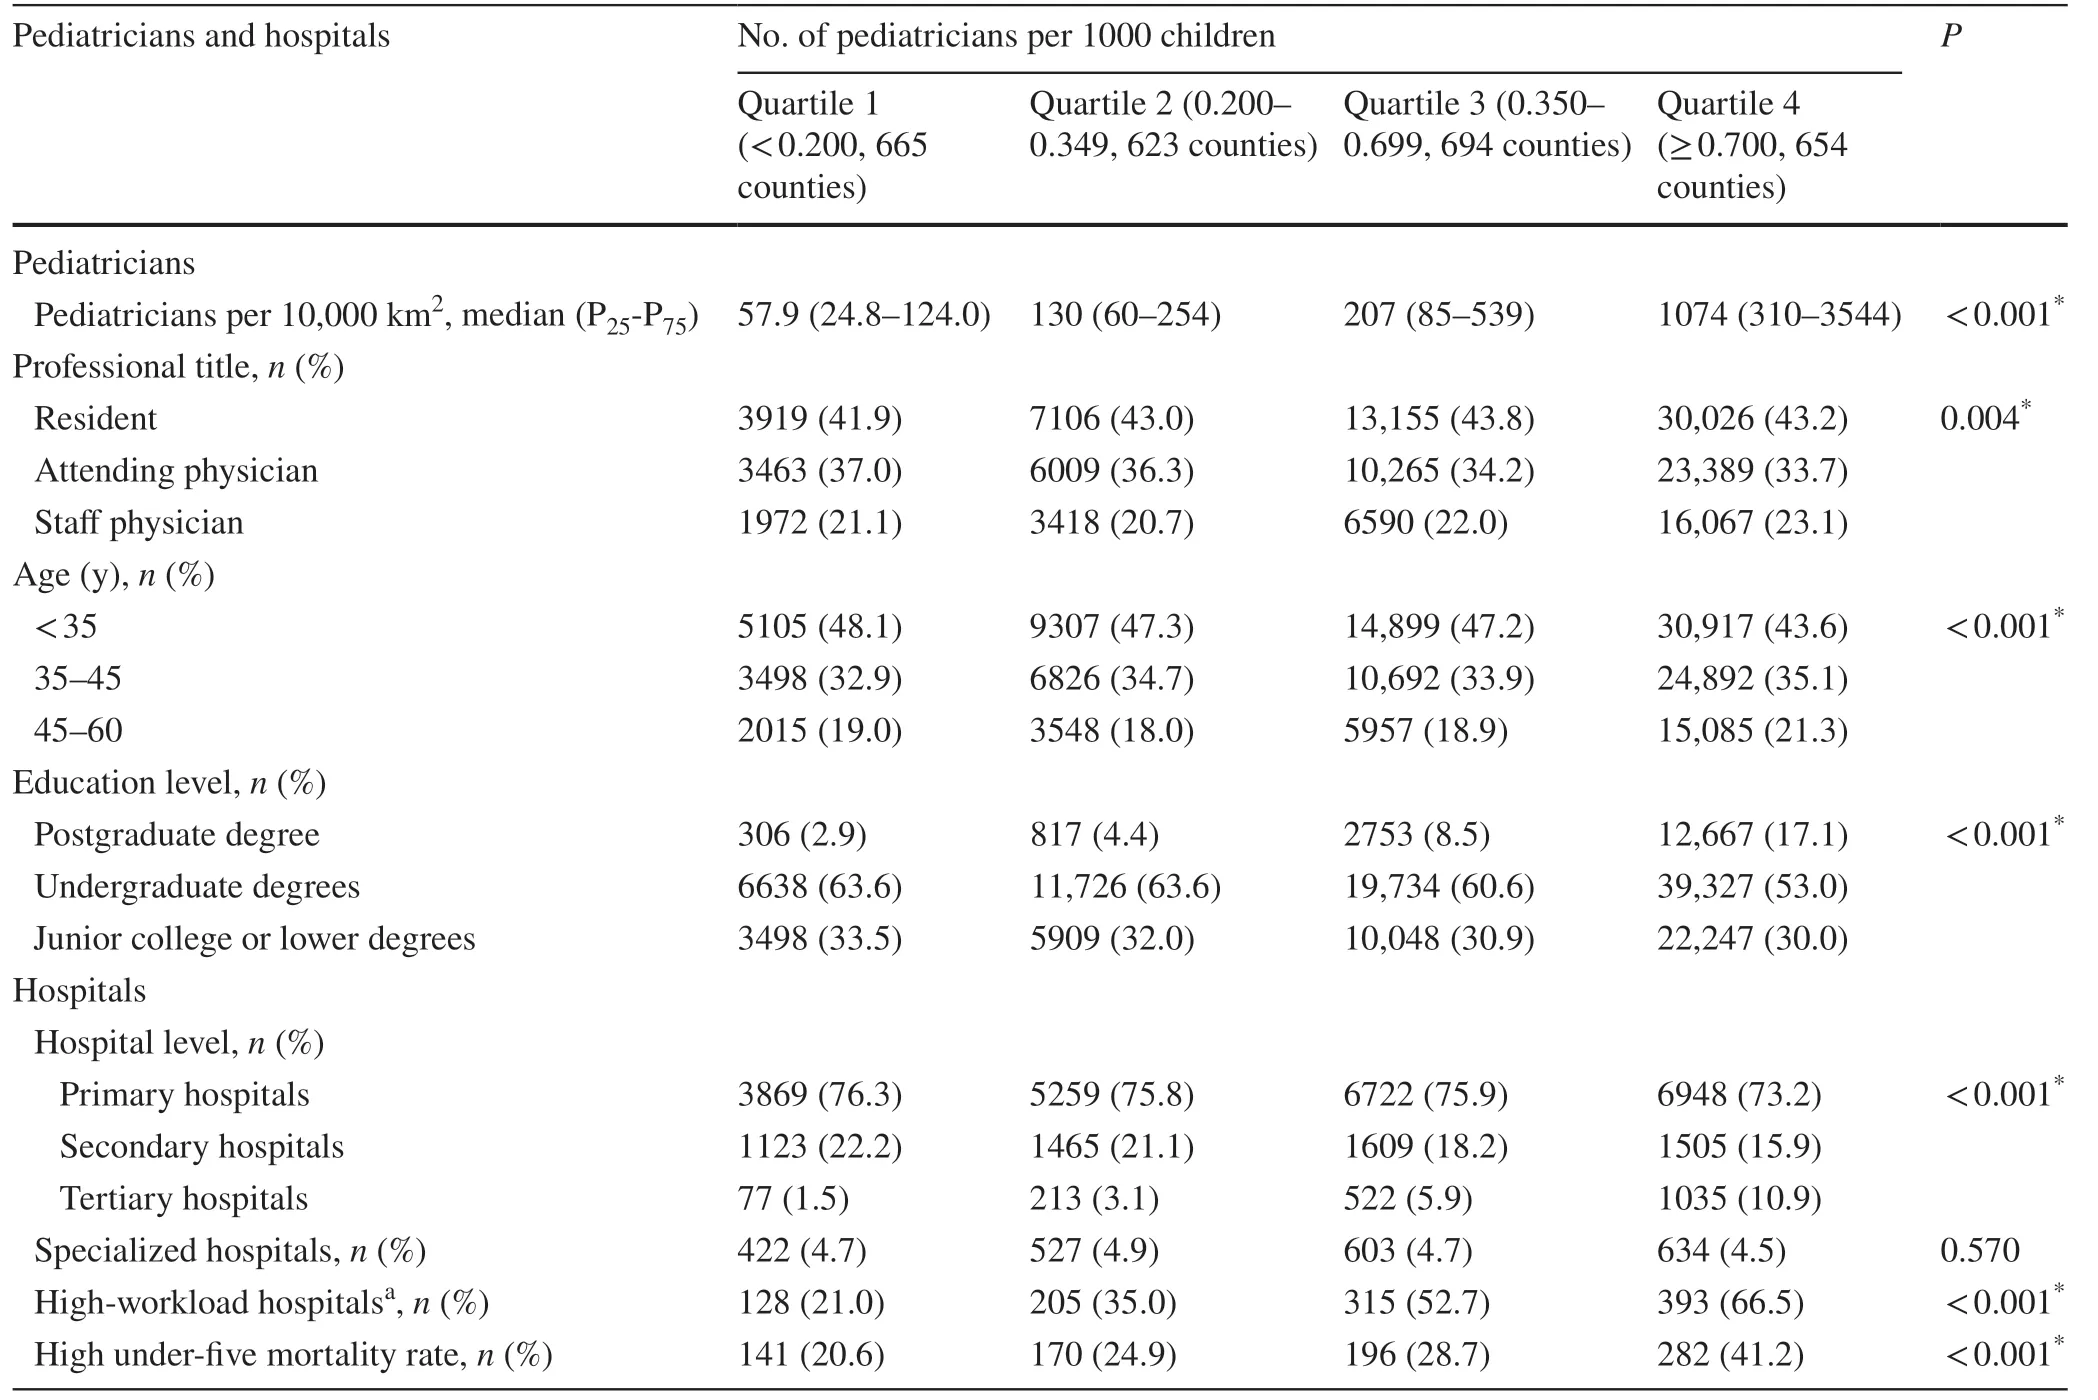
Table 1 Pediatrician and hospital characteristics and under-five mortality rates of counties in China stratified by the number of pediatricians per thousand children
Pediatricians and the U5MR
The median U5MR was 13.0‰ (P25-P75: 9.6‰-18.3‰).The distribution of county-level U5MRs shows a clear gradient of increased U5MR in the central and western regions compared to the eastern region and the inverse pattern in the county-level geographical distribution of pediatricians.The median U5MR of eastern, central and western region were 9.2, 12.5, and 19.3 deaths per 1000 live births; and the median PPTC were 0.43, 0.34, and 0.33, respectively.A low number of PPTC, a low pediatrician geographic density, a low number of well-educated (higher or equal to Master's degree) pediatricians and a low proportion of pediatricians with a professional title (higher or equal to attending pediatrician) were signifi-cantly associated with a high U5MR, defined as ≥ 18 deaths per 1000 live births, after controlling for potential confounders (Table 2).Compared with the counties in which the number of PPTC was higher than 0.7, counties with the lowest PPTC (< 0.2) had a 52% (OR 1.52, 95% CI 1.09-2.13) increased risk of a high U5MR, whereas a nonsignificant association was found among the counties with PPTC higher than 0.2, yielding an L-shaped relationship.This L-shaped association between the number of PPTC and the risk of a high U5MR was confirmed by our cubic spline model after adjusting for potential confounders (Fig.1 a).An increase in the risk of a high U5MR was observed when there were less than 0.5 pediatricians per 1000 children.
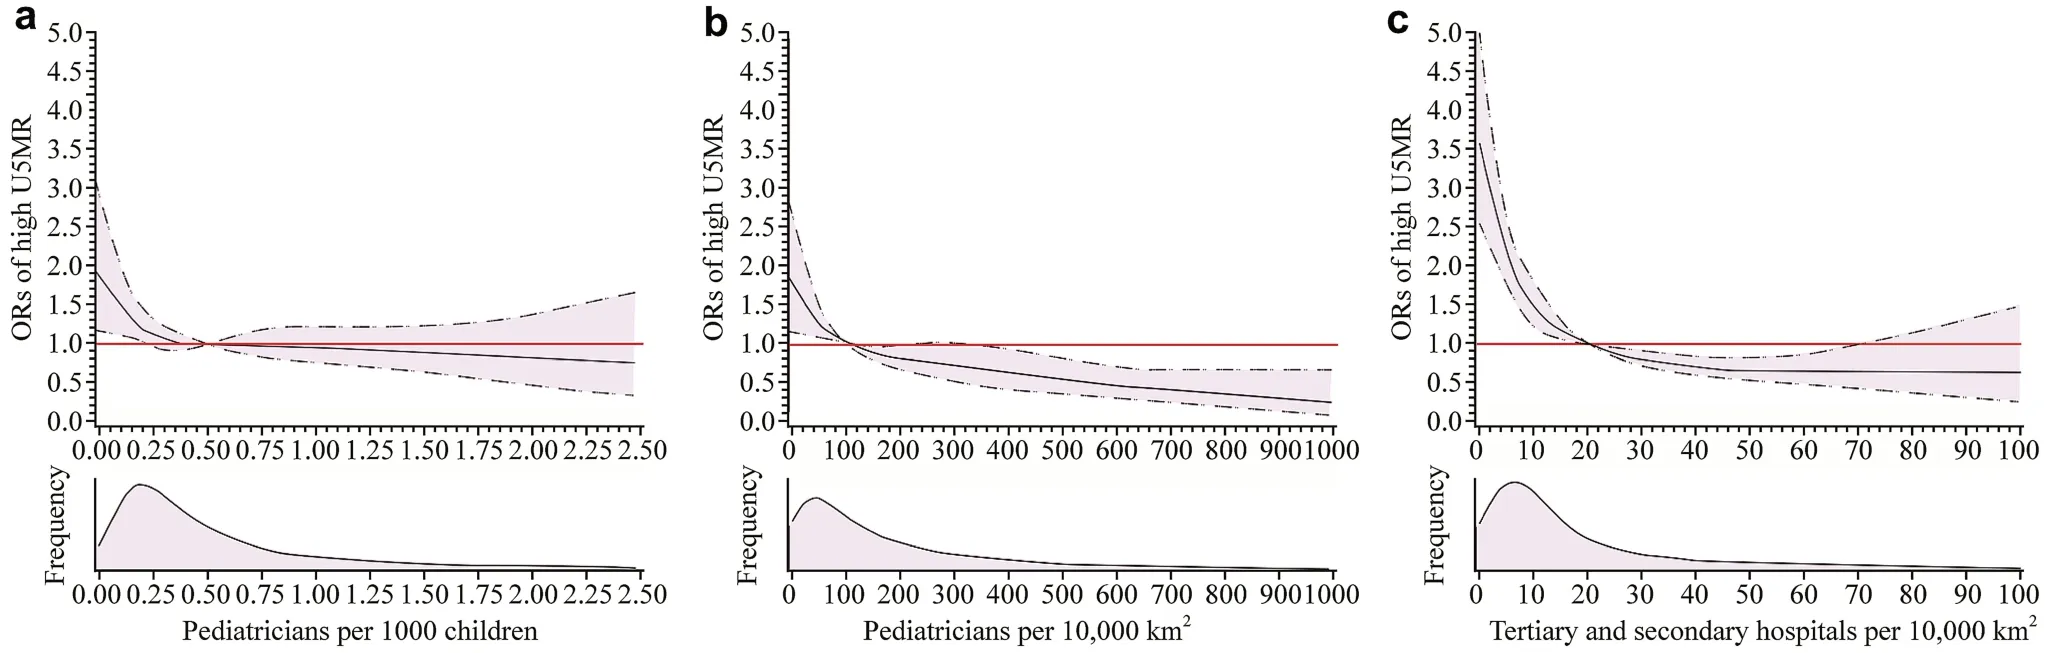
Fig.1 Adjusted ORs of high U5MRs (≥ 18‰) in China in 2014.The solid curve represents the multivariate-adjusted ORs calculated by restricted cubic splines.The reference value (red line: OR = 1.0) was set at 0.50 for PPTC ( a), 100 for pediatricians per 10,000 km 2 ( b), and 20 for tertiary and secondary hospitals per 10,000 km 2 ( c).ORs for high U5MRs were estimated using logistic regression models adjusted for gross domestic product per capita, surface area, child population (except PPTC), type of climate, altitude, and proportion of the population engaged in agriculture.OR odds ratio, PPTC pediatricians per thousand children, U5MR under-five mortality rate
Geographical density of pediatricians also showed a significant association with U5MR.Compared to counties with the highest densities (> 500 pediatricians per 10,000 km2), counties with the lowest densities (< 50 pediatricians per 10,000 km2) had a nearly four times higher risk (OR 3.74, 95% CI 2.55-5.48) of high U5MRs (Table 2).As density increased, the risk of high U5MR decreased; the OR was 3.07 (95% CI 2.11-4.47) in counties with a density of 50-149 pediatricians per 10,000 km2and 2.25 (95% CI 1.52-3.31) in counties with a density of 150-499 pediatricians per 10,000 km2.Our cubic spline model showed a significant inverted J-shaped association between a high U5MR risk and the geographic density of pediatricians afteradjusting for potential confounders (Pnonlineartrend= 0.001) (Fig.1 b).A significantly elevated risk of a high U5MR was detected when the total number of pediatricians was less than 100 per 10,000 km2.
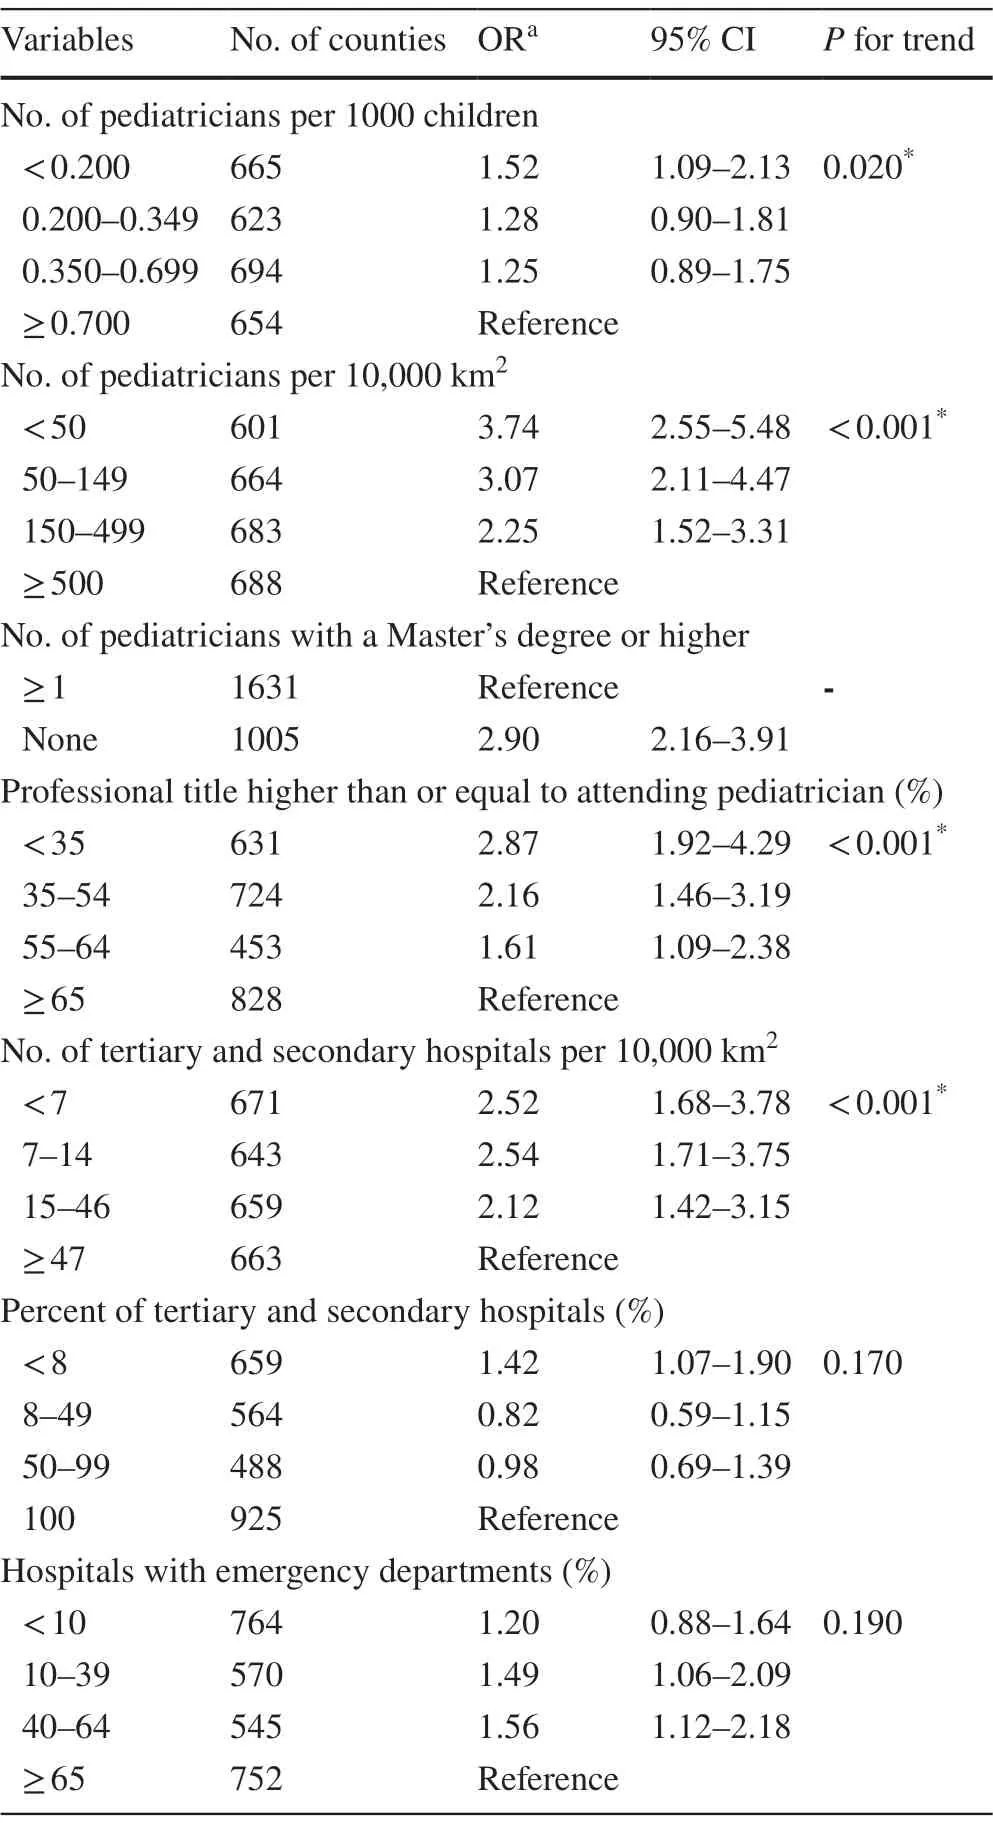
Table 2 Associations between pediatrician/hospital characteristics and risk of a high U5MR
Hospitals and the U5MR
The distribution of pediatricians is necessarily dependent on hospital distribution, especially the distribution of high-level hospitals; therefore, we further evaluated the association of the risk of a high U5MR with the geographic density of secondary and tertiary hospitals.Consistent with the above results for PPTC and geographical density of pediatricians, a low geographic density of secondary and tertiary hospitals was significantly associated with the risk of a high U5MR.For example, counties with less than seven secondary and tertiary hospitals per 10,000 km2had a 2.52 times higher risk of a high U5MR than counties with 47 or more hospitals per 10,000 km2(95% CI 1.68-3.78).We also observed an L-shaped association between the risk of a high U5MR and the geographic density of secondary and tertiary hospitals in the cubic spline models adjusted for GDP per capita, the proportion of the population involved in agriculture, and the total child population (Pnonlineartrend< 0.001, Fig.1 c).An increased risk of U5MR was observed when the number of secondary and tertiary hospitals was less than 20 hospitals per 10,000 km2.
Combined impact of PPTC and geographical densities on high U5MR risk
After stratification by quartiles of PPTC and geographical density of pediatricians (pediatricians per 10,000 km2), a significant combined effect of PPTC and geographical density of pediatricians on the risk of a high U5MR was observed (Pinteraction< 0.001).The 3-D bar chart shows that the risk of high U5MR increased as the number of PPTC increased and the geographical density of pediatricians decreased; the OR decreased from 6.481 (95% CI 2.80-15.00) for counties with fewer than 50 pediatricians per 10,000 km2and PPTC ≥ 0.70 to 0.380 for counties with ≥ 500 pediatricians per 10,000 km2and < 0.20 PPTC (95% CI 0.04-3.88; reference: pediatricians per 10,000 km2< 50 and PPTC ≥ 0.7) (Fig.2 a).We can see that geographical density showed a stronger association with risk of a high U5MR.Additionally, a significant joint effect of pediatrician population density and geographical hospital density on a high U5MR (P< 0.001) was also observed (Fig.2 b).
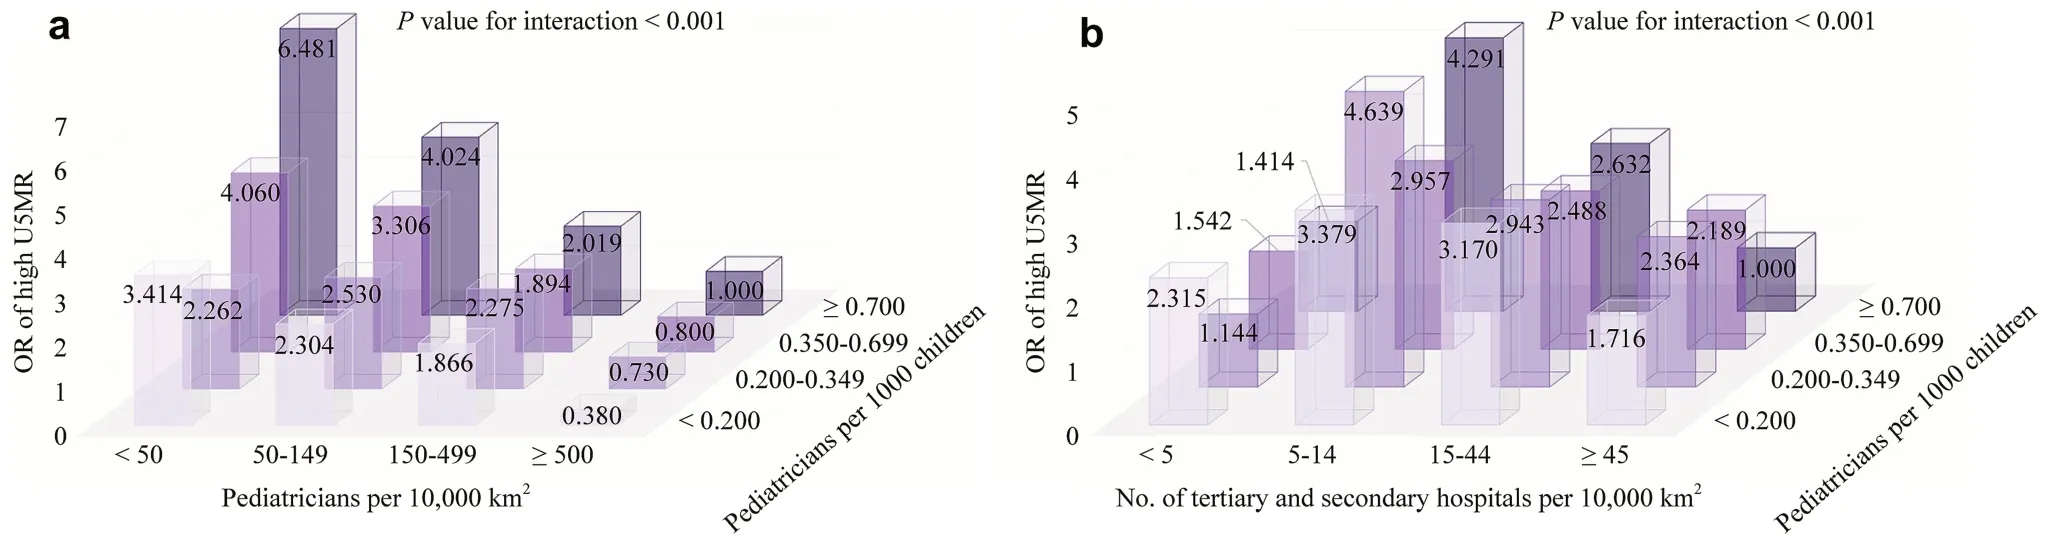
Fig.2 Combined associations of pediatricians per 1000 children and pediatricians per 10,000 km 2 ( a) and number of tertiary and secondary hospitals per 10,000 km 2 ( b) at risk of a high U5MR.ORs for high U5MRs were estimated using logistic regression models adjusted for gross domestic product per capita, surface area, child population size, type of climate, altitude, and proportion of population engaged in agriculture.OR odds ratio, U5MR under-five mortality rate
Discussion
In this analysis of data from a national survey of pediatric human resources in China, we found an L-shaped association of PPTC with a high U5MR, but an inverted J-shaped association between the geographical density of both pediatricians and secondary and tertiary hospitals and the risk of a high U5MR.The results of the joint association analysis showed that geographical density showed a stronger association with the U5MR than the number of PPTC.
Many health service-related factors, including patterns of service, provider utilization, health policies, distribution of the health workforce, and organizational efficiency, affect health outcomes among children [16- 18].However, according to the characteristics of universal health coverage pertaining to health care human resources [9], among all these factors, availability of and accessibility to pediatric health care services may be the most important becausethey affect the opportunity for timely treatment [19].For example, heavy pediatric workloads leading to a pediatrician shortage and inadequate service may result in increased child mortality due to inadequate and untimely treatment [7, 20- 22].However, there is limited and inconsistent evidence of the associations between factors associated with pediatric human resources and health outcomes in children [23- 25].The relative impact of these factors on U5MR remains unclear.In this study, using unique national survey data, we found that an increased number of pediatricians lowered the risk of a high U5MR; however, this association was significant only in the counties with the lowest numbers of pediatricians.This finding suggests that simply increasing the number of pediatricians to address high U5MR is not necessarily a sustainable solution.An untargeted increase in the number of pediatricians might not benefit health outcomes in children and may even result in a waste of medical resources.
Access to health services is a direct determinant of health outcomes [19].Both the absolute number of pediatricians and geographical distance to health care services are key factors in health service accessibility.For residents in geographically remote areas with a low geographic density of health services, timely access to health care for severe conditions, especially emergency situations, is largely dependent on distance and transport options [21, 26].Dejardin et al.found that the health outcomes of colorectal cancer patients were mainly determined by distance from the nearest local cancer treatment site [26].Lagarde et al.proposed that geographic variability in the number of health workers contributes to severe health outcomes in rural populations [27].Consistently, we found that increasing the number of pediatricians per unit of geographical area reduced the U5MR regardless of the local pediatrician density per thousand children.Even if the geographical density of pediatricians was relatively high, for example, higher than 100 pediatricians per 10,000 km2, an increase in pediatrician number in each unit area was still associated with a reduction in the U5MR.For example, in Qinghai Province, the total number of PPTC was high (0.48), but the geographical density was low, at 11.60 pediatricians per 10,000 km2, due to its low overall population density; accordingly, its U5MR was quite high.
Variability in the geographic distribution of pediatricians has been a long-term problem worldwide.While governments have attempted to increase the total number of pediatricians during the last few decades, the variability in health access has increased [28, 29].A potential explanation for this discrepancy is that the geographic densities of pediatricians have not improved.Therefore, policy makers should consider geographic pediatrician density and adopt a targeted location-based allocation strategy when recruiting new pediatricians to minimize inequalities in health care access and to balance the supply and demand [23].The largest barrier is that working in rural and remote areas is not appealing to most pediatricians.In the short term, active deployment or the temporary shifting of current human resources may help address this challenge.For example, general physicians in primary care facilities could be retrained in pediatrics.Because China is extremely diverse, a one-size-fits-all approach is inappropriate.The management and distribution of pediatric human resources should consider specific local needs and conditions.
Education level, one of the indexes of pediatric care quality, has significantly improved in China during the past 30 years, and a large number of well-educated pediatricians have been trained.In counties with a sufficient number of pediatricians, a benefit of highly educated pediatricians on child health outcomes has been reported [30, 31].Currently, one of the advantages of the Chinese medical educational system is that one can become qualified as an independent practitioner after a short period of training.The relatively efficient and fast nature of medical training in China is thus well suited for medical staffpracticing in rural and less developed areas, which have limited financial resources and a high demand for pediatricians.
Our study has several limitations.First, although the U5MR is the most commonly used indicator of child health status at the population level, other indicators may also be helpful, such as morbidity (e.g., pneumonia rates, growth, and development).Additionally, the U5MRs calculated from routine surveillance data may be underestimated owing to under-reporting.Second, although we included many potential confounders, residual confounding may still exist.Third, we excluded some counties, including some with low numbers of pediatricians and high U5MRs, so the strength of the association may have been underestimated.Fourth, there is a small-time lap between U5MR (2012) and survey of pediatricians (2014).However, according to the data from the National Bureau of Statistics [Statistical and Monitoring Report of the Program for the Development of Chinese Children (2011-2020)], the U5MRs from 2012 to 2014 were slightly increased from 13.2‰ to 11.7‰ [32].The changes in U5MR are not large.Fifth, the measurements used in this study, including population density and geographical density, might only refl ect an average of the accessibility of the health service.These measures might be biased when the health service and population show an aggregative distribution and centralizes several key urban areas.Finally, we did not consider migrant workers.No data were available to estimate the migrant proportion of the population at the county level.Because migrants generally move from rural to urban areas or from less developed to more developed regions, the workload in the western regions may have been slightly overestimated.However, only a minority of migrants are accompanied by children, as most are left behind to live with relatives [33]; so the number of migrant children is relatively small and is unlikely to have infl uenced the analysis.In addition, due to population mobility, many people, even from poor areas, access services at secondary and tertiary hospitals in China.Therefore, access to medical facilities may be even more important in countries with poor transport infrastructure.
In conclusion, our findings suggest that both the number and geographical density of pediatricians should be taken into consideration when establishing health service priorities.In particular, the geographical density of pediatricians directly infl uences accessibility to medical care for children and may lead to an increased U5MR.Our findings warrant confirmation in future, well-designed prospective studies, especially to generalize the geographical density of pediatricians to other countries.
Supplementary InformationThe online version of this article ( https:// doi.org/ 10.1007/ s12519- 021- 00433-0) contains supplementary material, which is available to authorized users.
AcknowledgementsWe would like to thank Prof.Zhu Jun (National Office for Maternal and Child Health Surveillance of China, West China Second University Hospital, Sichuan University) and his colleagues for access to the data collected by the National Annual Report System on Maternal and Child Health.
Author contributionsZX, WJ.HLS, and ZX (Xin Zhou) contributed equally to this work (co-first author).ZX searched the literature, collected and analyzed the data, and prepared the first draft of the manuscript.WJ searched the literature, and prepared the first draft of the manuscript.HLS searched the literature, collected and analyzed the data, and prepared the first draft of the manuscript.ZX (Xin Zhou) searched the literature and revised the manuscript.LJ revised the manuscript.HT revised the manuscript.ZYJ conceptualized and designed the study, and revised the manuscript.SK conceptualized and designed the study, and revised the manuscript.All authors interpreted the data and approved the final draft of the manuscript.
FundingThis work was supported by the Shanghai Municipal Commission of Health and Family Planning (2016ZB0103).
Compliance with ethical standards
Ethical approvalThis study is a hospital-based survey, and there are not any individual and human information.We only ask the numbers and characteristics of hospitals.The ethical approval is not applicable for this study.
Conflict of interestThe authors declared that there is no confl ict of interest.
Data availabilityThe datasets generated during and/or analysed during the current study are available from the corresponding author on reasonable request.
 World Journal of Pediatrics2021年3期
- World Journal of Pediatrics的其它文章
- COVID-19 ocular findings in children: a case series
- Genetic etiologies associated with infantile hydrocephalus in a Chinese infantile cohort
- Hedgehog signaling pathway gene variant influences bronchopulmonary dysplasia in extremely low birth weight infants
- Causes of severe neonatal hyperbilirubinemia: a multicenter study of three regions in China
- Maternal mental health and well-being during the COVID-19 pandemic in Beijing, China
- Distinctive clinical and laboratory features of COVID-19 and H1N1 infl uenza infections among hospitalized pediatric patients