
Genome-Wide Association Study of Nitrogen Use Efficiency and Agronomic Traits in Upland Rice
2021-07-13 10:20:14TatianaRakotosonJulieDusserrePhilippeLetourmyJulienFrouinIsabelleRamontaRatsimialaNoronirinaVictorineRakotoarisoaTuongVicaoKirstenVomBrockeAlainRamanantsoanirinaNourollahAhmadiLouisMarieRaboin
Rice Science 2021年4期
Tatiana Rakotoson, Julie Dusserre, Philippe Letourmy, Julien Frouin, Isabelle Ramonta Ratsimiala, Noronirina Victorine Rakotoarisoa, Tuong-Vicao, Kirsten Vom Brocke, Alain Ramanantsoanirina Nourollah Ahmadi, Louis-Marie Raboin
Research Paper
Genome-Wide Association Study of Nitrogen Use Efficiency and Agronomic Traits in Upland Rice
Tatiana Rakotoson1,3, Julie Dusserre4,7, Philippe Letourmy4,7, Julien Frouin5,7, Isabelle Ramonta Ratsimiala2, Noronirina Victorine Rakotoarisoa2, Tuong-Vicao5,7, Kirsten Vom Brocke1,6,7, Alain Ramanantsoanirina1, Nourollah Ahmadi5,7, Louis-Marie Raboin4,7
()
Genome-wide association study (GWAS) was performed for 16 agronomic traits including nitrogen use efficiency (NUE) and yield-related components using a panel of 190 mainlyrice varieties and a set of 38390 singlenucleotide polymorphism (SNP) markers. This panel was evaluated under rainfed upland conditions in Madagascar in two consecutive cropping seasons with two contrasted nitrogen input levels. Using another set of five grain traits, we identified previously known genes (,,and), thus validating the pertinence and accuracy of our datasets for GWAS. A total of 369 significant associations were detected between SNPs and agronomic traits, gathered into 46 distinct haplotype groups and 28 isolated markers. Few association signals were identified for the complex quantitative trait NUE, however, larger number of quantitative trait loci (QTLs) were detected for its component traits, with 10 and 2 association signals for nitrogen utilization efficiencyand nitrogen uptake efficiency, respectively. Several detected association signals co-localized with genes involved in nitrogen transport or nitrogen remobilization within 100 kb. The present study thus confirmed the potential of GWAS to identify candidate genes and new loci associated with agronomic traits. However, because of the quantitative and complex nature of NUE-related traits, GWAS might have not captured a large number of QTLswith limited effects.
genome-wide association study; nitrogen use efficiency; agronomic trait; upland rice
Increasing crop production to ensure food security for a global population that will continue to grow in the next four decades is a major challenge (Godfray et al, 2010). Given the competition for land, alarming alteration of natural ecosystems and loss of biodiversity (Cardinale et al, 2012), we need to produce more from the same amount of (or even less) land, water and nutrients, i.e. improve crop productivity and resource use efficiency. Plant breeding is expected to contribute significantly to these challenges. The development of new high-throughput genotyping, phenotyping and breeding methods would help explore available genetic diversity and accelerate crop improvement (Tester and Langridge, 2010). These objectives apply particularly to upland rice, a subsistence crop in the sub-Saharan Africa mostly cultivated in low-input cropping systems under high biotic and abiotic constraints.
Nitrogen (N) is a key element of proteins and nucleicacids, and thus crucial for crop growth and development. Improvement of nitrogen use efficiency (NUE) is a concern in high input agriculture to reduce nitrogen loss, the associated environmental damage and economic losses (Raun and Johnson, 1999). Increasing crop yield and protein content is also important in low-input agriculture (Dawson et al, 2008). NUE is a complex quantitative trait involving N uptake, translocation, assimilation and remobilization, all interacting with environmental factors (Garnett et al, 2015). Many genes involved in NUE have already been characterised in rice (Li et al, 2017). For instance, nitrate transporter gene, variation between theandsubspecies, is associated with enhanced nitrogen uptake and root-to-shoot transport. The transfer of theallele ofinto a wide range ofbackgrounds confirms the interest of this gene for crop breeding (Hu et al, 2015). More generally, for breeding purposes, there is a need to explore the allelic diversity that contributes to the phenotypic variability observed for NUE and its components within each rice subspecies.
Genome-wide association study (GWAS) is a powerful way to mine potentially interesting alleles in collections of crop germplasm (Zhu et al, 2008). GWAS relys on linkage disequilibrium (LD) to detect associations between phenotypic variations and DNA sequence variations (single nucleotide polymorphisms,SNPs). The power and resolution of association mapping depend on the extent of LD in the target population. A self-pollinating species like rice, in which LD extends over more than 100 kb, is thus ideally suited for GWAS (Mather et al, 2007). The drawback is that the identification of causal polymorphisms for phenotypic variations is not straightforward and requires follow-up analyses to sort the candidate genes (Han and Huang, 2013). Population structure and cryptic relatedness can result in false positive associations between markers and phenotypes because population admixture creates LD between unlinked loci. Methodological issues related to the implementation of GWAS are extensively presented and discussed in a dedicated book (Gondro et al, 2013). GWAS has been successfully used to dissect a very large diversity of complex qualitative and quantitative traits in rice (Zhang et al, 2016).
Several linkage-based quantitative trait locus (QTL) mapping studies have been performed in multiple rice populations for NUE-related traits, but very few genes have been identified (Obara et al, 2001; Shan et al, 2005; Cho et al, 2007; Senthilvel et al, 2008; Li et al, 2010; Wei et al, 2011; Zhou et al, 2017). Liu et al (2016) focussed on plant height (PH), tiller number and grain length (GL)measured under low and standardN conditions. Tang et al (2019) succeeded in identifying seven NUE-related genes using GWAS, including a NAC42-activated nitrate transporter.
Here, we presented GWAS-based QTL mapping for NUE and NUE-related traits performed on a worldwide diversity panel of 190 accessions mainly oforigin using 38390 SNPs. The diversity panel was phenotyped in a rainfed upland cropping system for 16 traits related to NUE and yield components under two contrasted levels of nitrogen input and over two consecutive cropping seasons.
Results
Phenotypic variability for NUE and NUE-related agronomic traits
The phenotypic variation has been studied for a total of 21 measured and calculated traits (Table S1).The analysis of variance across the two-year experiment showed a significant genotype effect for all traits(Table S2). A significant interaction was observed between year and genotype for all traits except grain N content (GNC) and grain pilosity (GP). A significant interaction was also observed between year and the N level for all traits except for GP and GL. Likewise, a significant interaction between genotype and N level was observed for most traits. Given these interactions, an analysis of variance was also performed for each year separately. Overall, nine association analyses per marker-trait combination were performed using average best linear unbiased predictor (BLUP) in LN (low nitrogen, 0 kg/hm2N) and HN (high nitrogen, 120 kg/hm2N) conditions over the two years combined or for each year separately.
Distance-based clustering of the 190 accessions of our panel is presented in a neighbour-joining tree (Fig. 1). Genetic structure is mainly limited to-differentiation, given the presence in the panel of a few accessions withbackground. Theaccessions originating from the same breeding programme tended to cluster together. Clustering of accessions may be due to kinship relationships between accessions that partly or completely share the same parents. Neighbour-joining tree constructed with data from the 190 accessions of the panel and the accessions of the 3K project is presented in Fig. S1. The great majority of the accessions in the panel clustered into thesubspecies accessions of the 3Kproject, and most of them were the tropical and subtropical group of thesubspecies, while only one was related to thegroup. The subtropical group is composed mainly of upland rice varieties bred for the cold conditions of Madagascar highlands (Raboin et al, 2014). In our panel, 2 accessions were clearly related to thesubspecies, and about 30 accessions were in an intermediate position betweenandsubspecies (admixed).
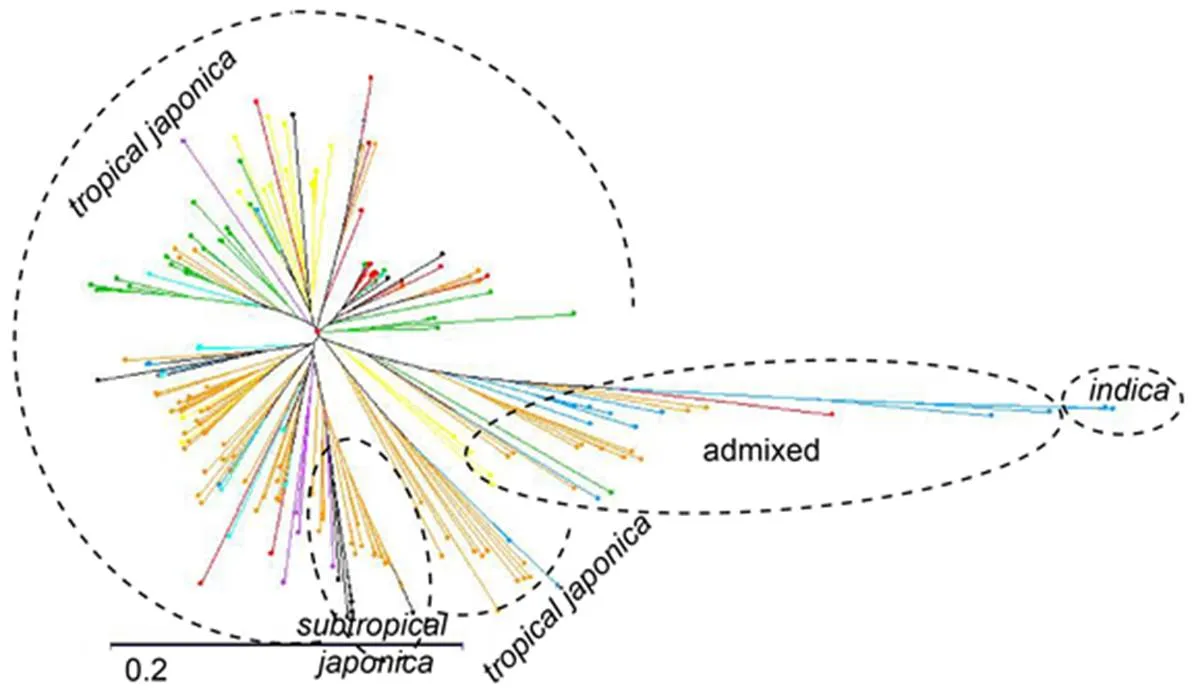
Fig. 1. Neighbour joining tree of the 190 accessionsbased on 38 390 single nucleotide polymorphisms (SNPs).
Accessions are coloured according to the breeding center from which they originate. FOFIFA (National Center for Applied Research on Rural Development)/CIRAD (French Agricultural Research Centre for International Development) in Madagascar (Orange); CIAT (International Center for Tropical Agriculture) in Colombia (Yellow); EMBRAPA (Brazilian Agricultural Research Corporation) in Brazil (Red); CIRAD in Brazil (Blue); CIRAD in Ivory coast (Light blue); Africa rice in Ivory coast (Green); Yunnan Academy of Agricultural Sciences in China (Violet).
On average, across all chromosomes, LD reached half of its original value at around 300 kb, while it was less than 200 kb in a worldwide reference panel ofaccessions (Raboin et al, 2016). LD dropped to an2value of 0.2 in 1000 kb in our panel compared to 400 kb in the reference panel (Fig. 2). Given this level of LD, and even if LD varies among genomic regions (Zhang et al, 2016), the marker density of one SNP (every 11 kb in our panel) should be suitable for the detection of most marker-trait associations using GWAS. The drawback of this large extent of LD may be a rather low resolution.
GWAS validation using grain traits
To assess the potential of GWAS to identify causative genes of measured phenotypic variation in our panel, we performed GWAS on some grain traits, with genes previously identified for awn length (AL), GP, GL and grain width (GW) (Fig. S2). No gene for grain thickness (GT) was identified.
Concerning AL, we detected 63 SNPs extending from 14.16 to 18.94 Mb on chromosome (Chr.) 4 at-value ≤10-4, surrounding thegene (), which controls awn elongation in rice (Luo et al, 2013). The distance betweenand themost significant SNP (Chr4_17466245,-value=4.84 ×10⁻⁸) was 733 kb (Fig. S2-A).
Concerning GP, a region was identified on Chr. 5 encompassing 44 significant SNPs atvalue≤10-4over 600 kb. This region includes thegene (; Chr5_977812), involved in glabrousness of rice glumes (Angeles-Shim et al, 2012). The distance betweenand themost significant SNP (Chr5_1061537,-value=3.23×10⁻⁹) was 83 kb (Fig. S2-B).
Concerning GL, the region coincided withon Chr. 3 was detected (Fan et al, 2006). The most significant SNP (Chr3_16790082,value =7.76×10⁻⁷) was located 94 kb from(; Chr3_16695922), explaining 13% of GL variation(Fig. S2-C).

Fig. 2. Comparison of linkage disequilibrium (LD) decay in panel of 190 accessions used in this study (in red) and the worldwidereference panel (in blue).
The curves represent the average2 among the 12 chromosomes over the whole length of the chromosome (main frame) or in 10 kb bins for LD decay plot over a maximum distance of 1000 kb (zoomed frame). Each circle corresponds to the average LD between marker pairs in 100 kb bins.
Concerning GW, a region on Chr. 5 displayed strong association signals around geneinvolved in grain size (Shomura et al, 2008). The most significant SNP (Chr5_5391748), detected at-value of 3.29×10⁻⁷, was located 26 kb from(; Chr5_5365520), and explaining 11.7% of GW variation. One of the significant SNP was localized within, but it was not the most significant SNP(Fig. S2-D).
Thus, we were able to detect marker-trait associations close to four previously characterized genes. However, depending on local LD in the vicinity of each gene, the distance between the peak association signals and the putative causative genes varied from 26 to 733 kb. This level of accuracy will make it difficult to unequivocally identify causative genes associated with the detected signals.
GWAS on NUE and related agronomic traits
Genome-wide Manhattan and QQ plots were presented for genotype BLUPs calculated over two years and in HN orLN conditions. A total of 369 SNPs were involved in significant associations (-value ≤10-4) (Table 1). Among those SNPs, 180 were located on putative genes (MSU rice genome annotation project release 7, http://rice.plantbiology.msu.edu/cgi-bin/gbrowse/rice/).
Four significant SNPs were detected for NUE corresponding to two haplotype groups and one isolated SNP on Chrs. 6, 7 and 11, explaining 9.5%, 9.6% and 10.4% of phenotypic variations, respectively. Larger numbers of associations were detected for the two component traits, nitrogen uptake efficiency (NUPE; 5 significant SNPs) and nitrogen utilization efficiency (NUTE; 28 significant SNPs). The SNPs associated with NUPE belonged to two haplotype groups on Chrs. 5 and 6, explaining 8.1% and 9.3% of phenotypic variations, respectively. The SNPs associated with NUTE belonged to nine haplotype groups on Chrs. 1, 3, 6, 9, 10 and 11 and two isolated markers on Chrs.4 and 9, explaining the phenotypic variationsof 8.0% and 11.5%. Many significant SNPs were also detected for the N-related traits, GNC, N harvest index (NHI) and total N uptake (TNUP). Twenty-six SNPs for GNC belonged to five haplotype groups and four isolated markers on Chrs. 1, 4, 5, 10, 11 and 12. Thirty-one SNPs for NHI belonged to nine haplotype groups and three isolated markers on Chrs. 1, 4, 5, 6, 9, 11 and 12. Ten SNPs for TNUP belonged to three haplotype groups on Chrs. 1, 5 and 6. The number of significant SNPs was only two for straw N content (SNC), each on Chrs. 1 and 9.
Association analysis was performed on four yield components, including number of panicles per m2(PANM2), number of spikelets per panicle (SPIPAN), percentage of filled grains (FG) and 1000-grain weight (TGW). For PANM2, 57 SNPs were significant at-value ≤10-4.These associations corresponded to three haplotype regions on Chrs. 2, 4 and 6, and two isolated SNPs on Chrs. 1 and 7. The haplotype region on Chr. 4 encompassed 53 SNPs and extended from 31.05 to 33.31 Mb. The most significant SNP (Chr4_31258594) explained 12% of PANM2 variation. For SPIPAN, three isolated significant SNPs were found on Chrs. 2, 4 and 12. For FG, 18 SNPs were detected on Chrs. 1, 2, 3, 4, 9 and 11, corresponding to 7 haplotype groups and 2 isolated markers. For TGW, 26 SNPs were found to be significantly associated. These associations corresponded to seven haplotype regions and one isolated SNPs on Chrs. 2, 3, 6, 10, 11 and 12. Although a total of 104 SNP-trait associations were revealed by GWAS for the four yield components, only four SNPs were significantly associated with grain yield (GY) as such. These belonged to two haplotype groups on Chrs. 6 and 11, explaining up to 9.9% and 11.6% of GY variation, respectively. Within these two haplotypes, only one SNP was associated with a yield component trait out of the total of 104 such associations. Three grain size traits (GL, GW and GT) related to TGW were also studied. Overall, 65 marker-trait associations were detected belonging to 11 haplotype groups (Table 2).
Association analysis was performed on three indicators of vegetative biomass, straw yield (SY), PH and harvest index (HI). Nine SNPs (four haplotype groups and one isolated marker) were significantly associated with SY, located on Chrs. 1, 2, 8 and 11. For PH, 24 significant SNPs (eight haplotype groups and one isolated marker) were detected on Chrs. 3,4,5,7 and 10. For HI, which measures the partition between vegetative and grain biomass, 49 significant association signals (12 haplotype groups and six isolated markers) were detected on Chrs. 1, 3, 4, 5, 6, 7, 8, 9, 10 and 11.
Days to flowering (DTF) was associated with 12 SNPs.These associations corresponded to four haplotypes on Chrs. 1, 2 and 3 and one isolated marker on Chr. 3. The region on Chr. 3 revealed the strongest association signal in this study (-value= 1.56×10⁻⁹at Chr3_1424348) and corresponded to a major effect explaining up to 21.9% of the phenotypic variation.
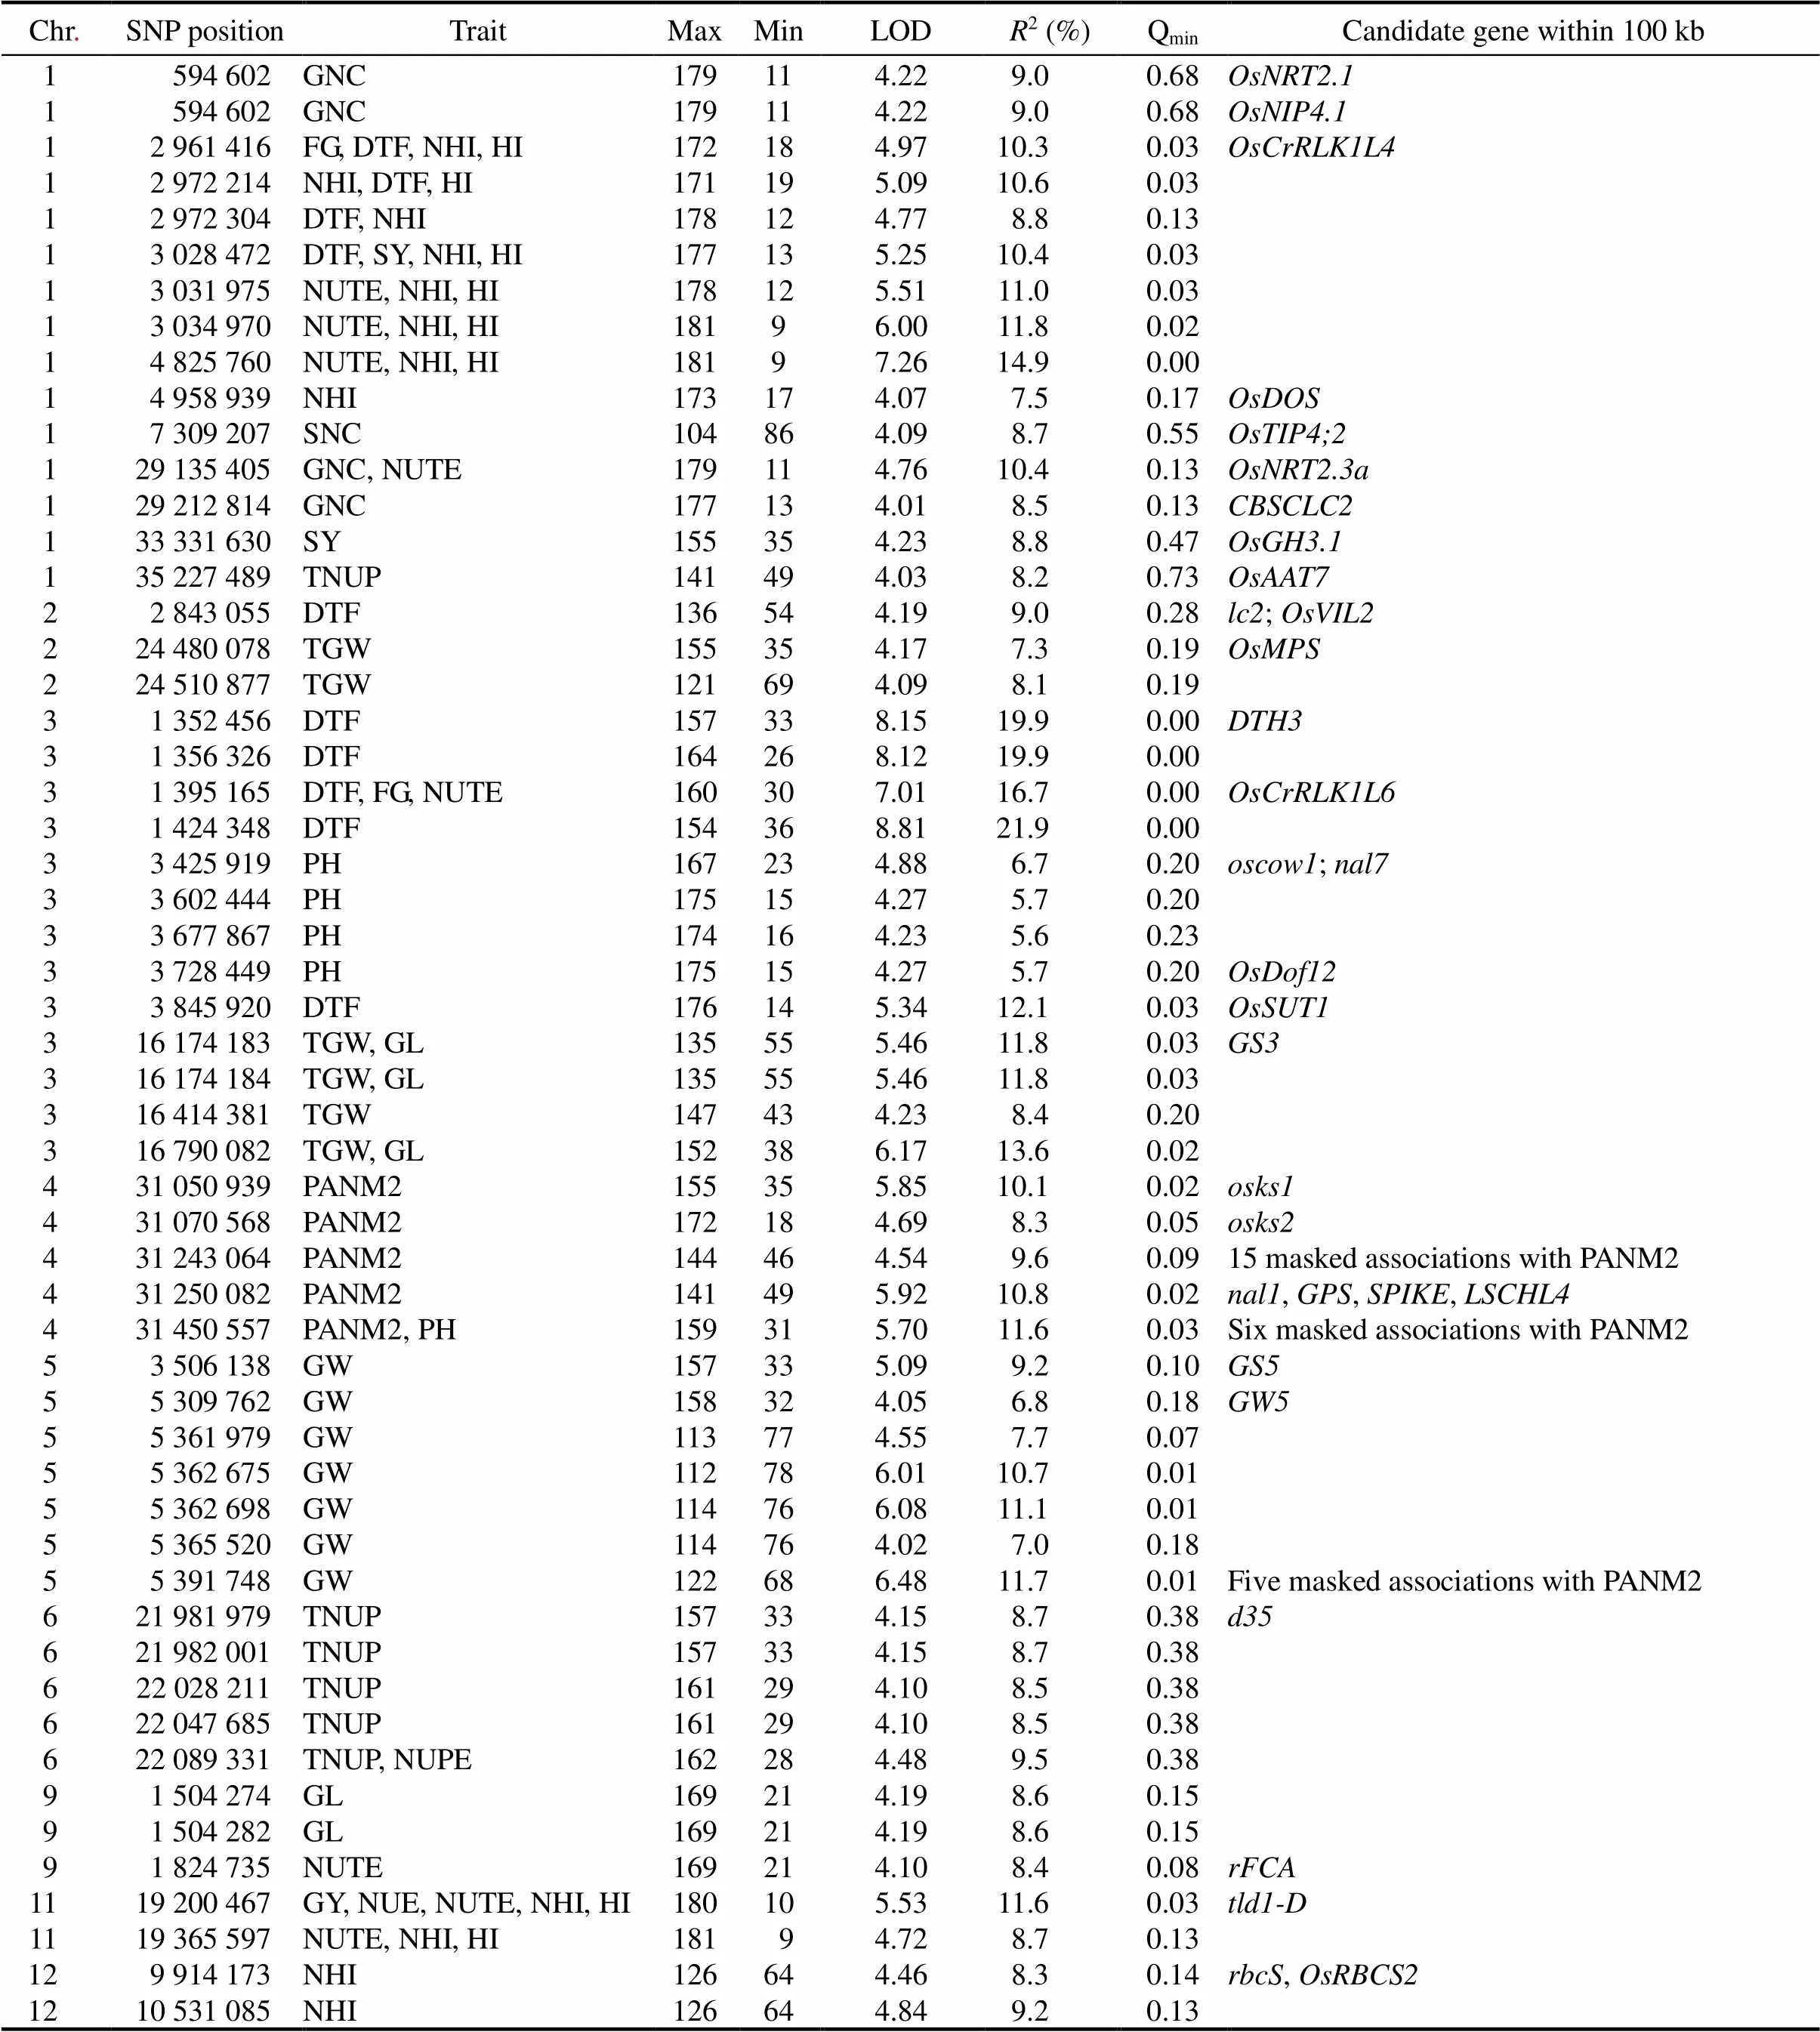
Table 1. Results of genome-wide association analysis for SNPs from haplotypes close to relevant putative genes.
Chr., Chromosome; SNP, Single nucleotide polymorphism; GNC, Grain nitrogen content; FG, Filled grain; DTF, Days to flowering; NHI, Nitrogen harvest index; HI, Harvest index; SY, Straw yield; NUTE, Nitrogen utilization efficiency; SNC, Straw nitrogen content; TNUP, Total plant nitrogen uptake; TGW, 1000-grain weight; PH, Plant height; GL, Grain length; PANM2, Number of panicles per m2; GW, Grain width; NUPE, Nitrogen uptake efficiency; GY, Grain yield; NUE, Nitrogen use efficiency; Max, Number of occurrence of Major allele; Min, Number of occurrence of Minor allele; LOD, Logarithm of odds;2,Coefficient of determination; Qmin,,Minimum Q-value.

Table 2. Results of counting significant SNPs or haplotypes shared by traits.
SNP, Single nucleotide polymorphism; GY, Grain yield; PANM2, Number of panicles per m2; SPIPAN, Number of spikelets per panicle; FG, Filled grain; TGW, 1000-grain weight; DTF, Days to flowering; GL, Grain length; GW, Grain width; GT, Grain thickness; PH, Plant height; SY, Straw yield; HI, Harvest index; NUE, Nitrogen use efficiency; NUPE, Nitrogen uptake efficiency; NUTE, Nitrogen utilization efficiency; SNC, Straw nitrogen content; GNC, Grain nitrogen content; TNUP, Total plant nitrogen uptake; NHI, Nitrogen harvest index.
Values above the diagonal are the number of SNPs shared by two traits; and values under the diagonal are the number of haplotypes shared by two traits.
The 369 significant associations reported above corresponded to 254 individual SNPs. Among the 254 SNPs, 209 were associated with only one trait. The remaining 45 SNPs were associated with two to five traits (Table 2). Some of these SNPs shared by two traits, involved strongly correlated traits. This was the case, for instance, HI and NHI had 21 significant shared SNPs, belonged to six haplotype groups, and NUTE and HI (or NHI) had four shared haplotype groups (six significant SNPs). The correlation observed between HI and NHI, between NUTE and NHI, and between NUTE and HI was 0.90, 0.73 and 0.79, respectively. Association signals for NUTE and FG coincided in four haplotype groups. Three haplotypes shared by NUTE and GNC (13 significant SNPs). We observed that among the 12 significant SNPs associated with DTF, six SNPs were also involved in associations with several other agronomic traits including HI, FG and NUTE. DTF and FG coincided in four haplotype groups but with opposite effects because late varieties (DTF) presented lower fertility (FG), and low FG resulted in lower NUTE. Only two haplotypes were associated with complex quantitative traits (GY and NUE), whereas a greater number of haplotypes were associated with their component traits. This highlighted the interest of decomposing complex traits into simpler and more heritable component traits.
Three large haplotypes were deserved to be highlighted for their pleiotropic effects. One was located on Chr. 1 (2.92 to 4.96 Mb) and encompassed significant marker-trait associations detected for DTF, NHI, HI, FG, SY and NUTE. The second was located on Chr. 6 (21.46 to 27.02 Mb) and encompassed marker-trait associations detected for GY, NUE, HI, TNUP, NUPE and PANM2. The third one was located on Chr. 11 (19.20 to 22.30 Mb) and encompassed marker-trait associations detected for GY, NUE, NUTE, NHI, HI and GNC. Interestingly, the only four signals detected for GY were found in two of these pleiotropic haplotypes on Chrs. 6 and 11.
Discussion
The primary objective of this study was to explore the genetic bases of NUE in upland rice using GWAS. The average extent of LD in our panel implied variable power of resolution for gene identification, as demonstrated by dissecting GWAS signals around,,and. Using apanel of comparable size (176 accessions) and of slightly lower level of LD (445 kb with2≥ 2.0), Yano et al (2016) identified new genes influencing agronomic traits, but Gordon and Finch (2005)used a higher marker density (over 400K SNP), which improved the power of GWAS. Given the extent of LD in our panel, we looked for the colocalization of the significant associations between SNP and NUE- related traits with candidate genes,considering an interval of 200 kb around each significant SNP (100 kb downstream and 100 kb upstream). This is a rather stringent interval considering the average LD decay distance of around 300 kb measured in our panel.
Colocalization of GWAS signals associated with NUE components and candidate genes
Several SNPs significantly associated with NUE and NUE component traits colocalized with genes involved in N metabolism or in growth and development processes. For instance, the SNP Chr11_19365597,located on the pleiotropic segment of Chr. 11, is located 7kb downstream of the rubisco chain precursor. The SNP Chr12_9914173, associated with NHI, is located 166 kb upstream of(), a gene involved in rubisco synthesis (Ogawa et al, 2011). Rubisco is an enzyme involved in key physiological trade-offs between N remobilization and yield increase during leaf senescence. Rubisco, together with other proteins linked with photosynthesis, is a main source of N from leaves during the remobilization process and accounts for 50% of the total soluble protein content in the leaves of C3 plants (Masclaux et al, 2010). Chr1_4958939 associated with NHI was located only 10 kb downstream of() involved in N remobilization, delaying leaf senescence in rice (Kong et al, 2006). Chr1_594602 associated with GNC was located 39 kb upstream of(), a high affinity nitrate transporter (Yan et al, 2011). Increased expression ofimproves NUE in rice (Chen et al, 2016). Chr1_29135405 and Chr1_29212814 associated with GNC and NUTE were located respectively 53 kb upstream and 23 kb downstream from()(Tang et al, 2012). Overexpression ofhas been shown to improve rice yield and NUE (Fan et al, 2016). Chr1_594602 associated with GNC and Chr1_7309207 associated with SNC were located 51 kb upstream and 6 kb downstream of two aquaporin genes,and, respectively. Aquaporins are involved in waterflow and ammonium uptake (Gao et al, 2018). Chr1_29212814 associated with GNC was located 4 kb upstream of a chloride channel family gene () involved in nitrate transport into vacuoles (Zifarelli and Pusch, 2010). Lastly, Chr1_35227489 associated with TNUP was located 95 kb upstream of, a gene involved in amino acid transport (Lu et al, 2012).
Two SNPs, associated with NUE and NUE components, were colocalized with genes involved in growth and development. Chr6_22028211, which was located on the above described pleotropic-effect segment of Chr. 6 and associated with TNUP, was located 7 kb downstream of thegene () corresponding to a gibberellin biosynthesis enzyme, in which a defect leads to a semi-dwarf stature (Itoh et al, 2004). Chr11_19200467 associated with NUE and NUTE was located 16 kb downstream of(), a gene involved in auxin synthesis whose mutation increases the number of tillers and leads to dwarfism (Zhang et al, 2009). Bothandgenes have pleiotropic effects on plant morphology and productivity.
Colocalization of GWAS signals associated with yield components and candidate genes
Several SNPs were significantly associated withGY components colocalized with genes that were involved in growth and development processes or in grain characteristics. For instance, the haplotype on Chr. 4 spanning more than 2 Mb encompassed 53 significant associations for PANM2, including the pleiotropic gene,, involved in leaf width and length, PH and the number of tillers (Jiang et al, 2015). The number of tillers in themutant of Nipponbare was 240% higher than that in wild type. The most significant SNP of this haplotype (Chr4_31243064) was located 57 kb from this gene. In line with the putative pleiotropic effect of, the haplotype also encompasses seven marker-trait associations for PH. Concerning grain characteristics, in addition to the colocalization of the GWAS signals associated with grain size, asand, three other occurrences of colocalizationwere identified. Chr2_24510877 associated with TGW was located 71 kb upstream of() involved in reproductive development, and that may, among other effects, induce variations in grain size and grain weight (Schmidt et al, 2013). Chr3_13604676 associated with GT was located in, which codes for a protein of the IQ calmodulin-binding motif family like(although it presents limited sequence homology with). Chr5_3506138 associated with GW was located 67 kb downstream of, a gene that regulates grain size ()(Liet al, 2011).
Colocalization of GWAS signals associated with flowering date and candidate genes
DTF plays a determining role in adaptation to a specific cropping system, especially in the harsh climatic conditions that prevail in the medium elevation area of Madagascar. We identified four haplotype groups associated with DTF on Chrs. 1, 2 and 3. One haplotypeon Chr. 3 explained up to 22% of the phenotypic variation.The first SNP in this haplotype, Chr3_1352456, was located 82 kb from(), a gene involved in heading date (Lee et al, 2004). The second SNP (Chr3_1395165) of the same haplotype was located only 6 kb from the candidate gene(). Interestingly, the haplotype on Chr. 1 associated with DTF also colocalized with a member of TKL_IRAK family,(). The colocalization involved five SNPs between Chr1_2958149 and Chr1_3028472, the closest one being located 13 kb from the gene. The receptor kinasegene (receptor like kinase) has been shown to be involved in many biological processes. In,, a gene belonging to the CrRLK1L family, is involved in flowering time (Gachomo et al, 2014).In, using a phylogenomic approach, Nguyen et al (2015) identified 16 homologs ofpresenting Gigantea-mediated circadian regulation of their expression. These authors proposed a functional model for the role ofin the regulation of the flowering time signaling pathway or circadian rhythms. Two other SNPs associated with DTF were located close to candidate genes involved in flowering control: Chr2_2843055 at 38kb from()(Yang et al, 2013) and Chr3_3845920 at 47 kb from()(Ishimaruet al, 2001) or 107 kb from() (Li et al, 2009).
We detected 369 SNPs belonging to 46 distinct haplotype groups and 28 associated-SNPs (-value ≤10-4) with GY, NUE and their component traits. However, few associations were detected for GY and NUE. Overall, a small number of haplotypes/QTLs with small effects were detected considering the large number of traits. In addition, associations with a rather large effect (up to 21.9%) were detected for the less complex trait DTF. This finding confirms the complex quantitative nature of GY and NUE traits, involving very large number of QTL with small effects that could be captured only in GWAS experiments based on a very large number of accessions. Such experiments are difficult to achieve in a medium size breeding programme. Beyond the feasibility issue, the large number of QTLs involved would limit the effectiveness of the conventional marker-assisted selection for NUE. In this context, genomic selection should be consideredfor breeding rice varieties with improved NUE because it embraces all marker information and may thus better capture variations caused by small effect QTLs.
methods
Rice materials
The diversity panel was composed of 190 rice accessions, most of which belonged to thegenetic group (Fig. 1) and originated from different breeding programmes: CIAT (International Center for Tropical Agriculture) in Colombia, IAC (Instituto Agron?mico de Campinas) and EMBRAPA (Empresa Brasileira de Pesquisa Agropecuária) in Brazil, FOFIFA(FOimbempirenena momba ny FIkarohana ampiharina amin’ny Fampandrosoana ny eny Ambanivohitra; http://www.fofifa.mg/)/CIRAD (French Agricultural Research Centre for International Development; https://www.cirad.fr/)in Madagascar, CIRAD in Brazil and Africa Rice (Table S3). It represented the working collection of the upland rice breeding programme conducted in Madagascar by FOFIFA and CIRAD. As such, all accessions have been screened for adaptation to rainfed upland (i.e. aerobic) cropping in the Mid-West region of Madagascar.
Field experiments and phenotyping
The field trials were conducted at Ivory in the Mid-West region of Madagascar (19o33′27′′ S, 46o24′43′′ E, 960 m) over two cropping seasons (2014–2015 and 2015–2016), hereafter referred to as year-1 and year-2. In each year, the experimental design was a split-block built on an alpha lattice with two replications (Fig. S3). Each replication contained 14 blocks. Each block comprised 16 accession plots including 14 tested accessions and two control accessions. Each block was split into two sub-blocks in order to evaluate two levels of mineral nitrogen fertilization: LN (0 kg/hm2N) and HN (120 kg/hm2N). Thus, the plot for each accession was split into two adjacent subplots, one under LN and the other under HN. In year-1, the size of each subplot was 1.8 m × 2.4 m (108 hills or holes made for sowing seeds) for the first replication and 1.4 m × 2.0 m (70 hills) for the second replication. In year-2, the size of each subplot was 1.8 m × 1.6 m (72 hills) in the first replication and 1.2 m × 1.6 m (48 hills) in the second replication.
Field preparation started with ox plowing followed by hand surfacing of the soil. Four to six rice seeds were sown per hill with 20 cm×20 cm spacing between the hills. Right before sowing, the same base dressing of cattle manure (5 000 kg/hm2), triple superphosphate (69 kg/hm2P2O5), potassium sulfate (62.4 kg/hm2K2O) and dolomite (500 kg/hm2) was applied to each hill in all the plots. In the HN plots, nitrogen was applied in the form of urea (46% N) at a rate of 120 kg/hm2split into three equal applications at the emergence, tillering and booting stages. In order to protect the crop from white grubs (the larval stage of scarab beetles) that feed on rice roots and adult black beetles that feed on seedlings, rice seeds were treated with a systemic insecticide (35% imidacloprid +10% thiram, at 2.5 g/kg of seeds) before sowing. The rice crop was hand-weeded whenever needed. Fungicides were applied twice a week to protect the crop from rice blast disease starting from the appearance of the first blast lesions up to harvest, using by turns Carbendazime and Propineb.
Twenty-one traits were measured in each elementary plot. DTF was recorded at the 50% flowering stage. At maturity, PH was measured on six hills (0.24 m2) located in the middle of each plot. Then, whole plants from the six hills were uprooted and their roots were cut off and discarded. Plant aboveground biomass was separated into straw and panicles. The panicles were counted and hand-threshed, and filled grains were separated from unfilled grains. The dry weights of filled grains and unfilled grains were determined after oven-dried at 60 oC for 72 h. Filled grains were used to estimate GY. Two sub-samples of 200 filled grains and 200 unfilled grains were weighed to calculate the total number of filled and unfilled grains and TGW. PANM2, SPIPAN and FG were calculated. Straw samples were oven-dried at 60 oC for 72 h and weighed to estimate SY. HI was then calculated from GY and SY. GNC and SNC were measured by near-infrared spectroscopy on dried samples (oven-dried at 60 oC for 72 h), ground to 1 mm, using available calibration equations (Rakotoson et al, 2017). TNUP was calculated as (×/100) + (×/100), and NHI as×/(100 ×). According to Moll et al(1982), NUE was estimated as/supply, NUPE as/N supply, and NUTE as/. In the LN treatment, soil N supply was estimated as the maximum plant N uptake among all individual plots in a given block. In the HN treatment, soil N supply was calculated as the sum of soil N supply of the corresponding block in LN plus the amount of inorganic N applied. During the post-harvest period, five traits related to grain morphology were measured either quantitatively for GL, GW and GT or qualitatively, using a 1–9 scale, for GP (1, glabrous to 9, very hairy) and AL (1, absence of awn to 9, a very long awn). These traits were used to validate the association mapping approach in our panel through the localization of known genes for grain traits.
Analysis of variance was conducted using a Mixed Model. Accession effect was separated in two components: a type of accession factor (with three levels: 1st control, 2nd control and tested accessions) and a genotype factor nested in the type of accession (with 196 tested accessions). Type factor was a fixed effect, and genotype factor was a random effect. Block effect was nested in year and replication. In fact, genotype, genotype × year, genotype × nitrogen, genotype × nitrogen × year, sub-blocks (ie: nitrogen × block) and whole-plot (ie: genotype × block) were considered as random effects in the model. We used the PROC Mixed procedure in the SAS/STAT statistical analysis package (version 9.4, SAS Institute Inc., Cary, NC, USA). BLUPswere calculated for each genotype and for each genotype × nitrogen interaction. Given the existence of a genotype × year interaction, data from each year were also analyzed separately, and BLUPs were calculated for each genotype and for each genotype × nitrogen interactions. All the BLUPs were used for the association analyses. Broad-sense heritability (2) for all traits was calculated from the variance components obtained using the REML option in SAS PROC VARCOMP.
Seeds of each accession were cultivated at the Cirad Montpellier laboratory in CIRAD, Francefor DNA extraction and genotyping. Genomic DNA was extracted from the leaf tissue of a single plant of each accession using the MATAB method (Risterucci et al, 2000) and then diluted to100 ng/μL. Each DNA sample was digested separately with the ApekI restriction enzyme. Each library was single-end sequenced in a single-flow cell channel (i.e., 96-plex sequencing) (Elshire et al, 2011) using an Illumina, Inc. HiSeqTM2000. Libraries sequence reads were aligned to the rice reference genome (Os-Nipponbare-Reference-IRGSP-1.0) (Kawahara et al, 2013) with Bowtie2 (default parameters). SNP calling was performed using the Tassel GBS pipeline v5.2.37 (default parameters) (Glaubitz et al, 2014). SNPs, with a call rate < 80%, a heterozygosity rate > 20% or a minor allele frequency (MAF) < 2.5%, were all discarded. The remaining heterozygotes were converted into missing data. The missing data were imputed using Beagle v4.0 (Browning and Browning, 2007). After imputation, markers with a MAF< 4.2% (8 out of 190) were discarded. The final resulting matrix comprised 190 individuals and 38390 SNP markers.
The genetic structure of the diversity panel was analyzed using the distance-based method proposed in DARwin 6.0.14 (https://darwin.cirad.fr/). We calculated simple matching dissimilarities between all pairwise combinations of accessions. The matrix of pairwise dissimilarities was then used to build neighbour- joining trees. The analysis was first performed on the 190 accessions of the panel using all the 38390 SNPs. Another analysis was performed by merging our panel of 190 accessions with the worldwide panel of the 3K Rice Genomes Project (Li et al, 2014) in order to position our diversity panel within the worldwide rice diversity. This analysis was performed using 27326 SNPs shared by the 3K project data set and our own data set.
We used Tassel 5.2.31 software(Trait Analysis by Association, Evolution and Linkage) to calculate pairwise LD of all markers for each chromosome. Local LD between SNPs within genomic regions containing candidate genes was visualized using the LD heatmap R package (Shin et al, 2006). LD values were also used to define haplotypes. All adjacent SNPs in strong LD and significantly associated with the different traits studied were grouped into haplotypes.
We used the software TASSEL 5.2.31 to perform association analysis (Bradbury et al, 2007) using a Mixed Linear Model with control of population structure (Q) and kinship to avoid spurious associations (Yu et al, 2006; Zhang et al, 2010). The structure was taken into account through a principal component analysis of the genotypic data (Price et al, 2006) computed with Tassel. We retained the first five principal components to build the Q matrix. The kinship matrix was also computed with Tassel using the Centered-Identity by Statemethod. The mixed model analysis was conducted with the optimum compression option and the P3D option to estimate the variance component. Association analyses were performed in each year and across the two years using average BLUP values of genotypes and BLUP values of genotypes under LN and HN conditions to account for interactions with the year and the N level (nine association analyses per marker-trait combination). The threshold for declaring an association significant and for further presentation and discussion of the results was set at-value ≤10-4. Marker-trait associations were retained when one at least of the nine association analyses had a-value ≤10-4. The-value estimating the false discovery rate was also computed using the-value R package (Storey and Tibshirani, 2003).
Acknowledgements
The authors thank the National Center for Applied Research on Rural Developmentfield staff in the Madagascar for their excellent work. This work was supported jointly by Cariplo(Italia) and Agropolis (France)Foundations (Grant No. 1201-006).
SUPPLEMENTAL DATA
The following materials are available in the online version of this article at http://www.sciencedirect.com/journal/rice-science; http://www.ricescience.org.
Fig. S1. Neighbour joining tree based on 27 326 genotyping- by-sequencing single nucleotide polymorphisms.
Fig. S2. Manhattan plot and pattern of linkage disequilibrium on awn length, grain pilosity, grain size and grain width.
Fig. S3. Layout for one replication of our experimental design.
Table S1. Description of 21 measured and calculated traits.
Table S2. Analysis of variance of factorial design combining year, genotype and nitrogen level of 21 traits.
Table S3. List of 190 rice accessions used for genome-wide association study.
Angeles-Shim R B, Asano K, Takashi T, Shim J, Kuroha T, Ayano M, Ashikari M. 2012. A wuschel-related homeobox 3B gene,(), confers glabrousness of rice leaves and glumes., 5(1): 28.
Bradbury PJ, Zhang Z W, Kroon D E, Casstevens T M, Ramdoss Y, Buckler E S. 2007. TASSEL: Software for association mapping of complex traits in diverse samples., 23(19): 2633?2635.
Browning S R, Browning B L. 2007. Rapid and accurate haplotype phasing and missing data inference for whole genome association studies by use of localized haplotype clustering., 81(5): 1084?1097.
Cardinale B J, Duffy J E, Gonzalez A, Hooper D U, Perrings C, Venail P, Narwani A, Mace G M, Tilman D, Wardle D A, Kinzig A P, Daily G C, Loreau M, Grace J B, Larigauderie A, Srivastava D S, Naeem S. 2012. Biodiversity loss and its impact on humanity., 486: 59?67.
Chen J G, Zhang Y, Tan Y W, Zhang M, Zhu L L, Xu G H, Fan X R. 2016. Agronomic nitrogen-use ef?ciency of rice can be increased by drivingexpression with thepromoter.,14: 1705?1715.
Cho Y I, Jiang W Z, Chin J H, Piao Z Z, Cho Y G, McCouch S R, Koh H J. 2007. Identified QTL associated with physiological nitrogen use efficiency in rice., 23(1): 72?79.
Dawson J C, Huggins D R, Jones S S. 2008. Characterizing nitrogen use efficiency in natural and agricultural ecosystems to improve the performance of cereal crops in low-input and organic agricultural systems., 107(2): 89?101.
Elshire R J, Glaubitz J C, Sun Q, Poland J A, Kawamoto K, Buckler E S, Mitchell S E. 2011. A robust, simple genotyping-by-sequencing (GBS) approach for high diversity species., 6(5): e19379.
Fan C C, Xing Y Z, Mao H L, Lu T T, Han B, Xu C G, Li X H, Zhang Q F. 2006., a major QTL for grain length and weight and minor QTL for grain width and thickness in rice, encodes a putative transmembrane protein., 112(6): 1164?1171.
Fan X R, Tang Z, Tan Y W, Zhang Y, Luo B B, Yang M, Lian X M, Shen Q R, Miller A J, Xu G H. 2016. Overexpression of a pH-sensitive nitrate transporter in rice increases crop yields., 113: 7118?7123.
Gachomo E W, Baptiste L J, Kefela T, Saidel W M, Kotchoni S O. 2014. The() gene encoding a novel receptor-like protein kinase regulates cell morphogenesis, flowering time and seed production., 14: 221.
Gao L M, Lu Z F, Ding L, Guo J J, Wang M, Ling N, Guo S W, Shen Q R. 2018. Role of aquaporins in determining carbon and nitrogen status in higher plants, 19(1): 35.
Garnett T, Plett D, Heuer S, Okamoto M. 2015. Genetic approaches to enhancing nitrogen-use efficiency (NUE) in cereals: Challenges and future directions., 42(10): 921?941.
Glaubitz J C, Casstevens T M, Lu F, Harriman J, Eshire R J, Sun Q, Buckler E S. 2014. TASSEL-GBS: A high capacity genotyping by sequencing analysis pipeline., 9(2): e90346.
Godfray H C J, Beddington J R, Crute I R, Haddad L, Lawrence D, Muir J F, Pretty J, Robinson S, Thomas S M, Toulmin C. 2010. Food security: The challenge of feeding 9 billion people., 327: 812?818.
Gondro C, van der Werf J, Hayes B. 2013. Methods in Molecular Biology: Genome-Wide Association Studies and Genomic Prediction. Springer: Humana Press: 1019.
Gordon D, Finch S J. 2005. Factors affecting statistical power in the detection of genetic association., 115(6): 1408?1418.
Han B, Huang X H. 2013. Sequencing-based genome-wide association study in rice., 16(2): 133?138.
Hu B, Wang W, Ou S J, Tang J Y, Li H, Che R H, Zhang Z H, Chai X Y, Wang H R, Wang Y Q, Liang C Z, Liu L C, Piao Z Z, Deng Q Y, Deng K, Xu C, Liang Y, Zhang L H, Li L G, Chu CC. 2015. Variation incontributes to nitrate-use divergence between rice subspecies.,47(7): 834?838.
Ishimaru K, Hirose T, Aoki N, Takahashi S, Ono K, Yamamoto S, Wu J Z, Saji S, Baba T, Ugaki M, Matsumoto T, Ohsgugi R. 2001. Antisense expression of a rice sucrose transporterin rice (L.)., 42(10): 1181?1185.
Itoh H, Tatsumi T, Sakamoto T, Otomo K, Toyomasu T, Kitano H, Ashikari M, Ichihara S, Matsuoko M. 2004. A rice semi-dwarf gene,(), encodes the gibberellin biosynthesis enzyme, ent-kaurene oxidase., 54(4): 533?547.
Jiang D, Fang J J, Lou L M, Zhao J F, Yuan S J, Yin L, Sun W, Peng L X, Guo B T, Li X Y. 2015. Characterization of a null allelic mutant of the ricegene reveals its role in regulating cell division., 10(2): e0118169.
Kawahara Y, de la Bastide M, Hamilton J P, Kanamori H, McCombie W R, Ouyang S, Schwartz D C, Tanaka T, Wu J Z, Zhou S G, Childs K L, Davidson R M, Lin H N, Quesada-Ocampo L, Vaillancourt B, Sakai H, Lee S S, Kim J, Numa H, Itoh T, Buell C R, Matsumoto T. 2013. Improvement of theNipponbare reference genome using next generation sequence and optical map data., 6:4.
Kong Z S, Li M N, Yang W Q, Xu W Y, Xue Y B. 2006. A novel nuclear-localized CCCH-type zinc finger protein, OsDOS, is involved in delaying leaf senescence in rice., 141(4): 1376?1388.
Lee S, Kim J, Han J J, Han M J, An G. 2004. Functional analyses of the flowering time gene, the putative suppressor of overexpression of() ortholog in rice., 38(5): 754?764.
Li D J, Yang C H, Li X B, Gan Q, Zhao X F, Zhu L H. 2009. Functional characterization of rice., 229: 1159?1169.
Li H, Hu B, Chu C C. 2017. Nitrogen use efficiency in crops: Lessons fromand rice, 68(10): 2477?2488.
Li J Y, Wang J, Zeigler R S. 2014. The 3000 rice genomes project: New opportunities and challenges for future rice research., 3(1): 8.
Li Y B, Fan C C, Xing Y Z, Jiang Y H, Luo L J, Sun L, Shao D, Xu C J, Li X H, Xiao J H, He Y Q, Zhang Q F. 2011. Natural variation inplays an important role in regulating grain size and yield in rice., 43(12): 1266?1269.
Li Y F, Li M M, Cao G L, Han L Z. 2010. Effects of genetic background on expression of QTL for nitrogen efficiency in irrigated rice and upland rice., 43(21): 4331?4340. (in Chinese with English abstract)
Liu Z Y, Zhu C S, Jiang Y, Tian Y L, Yu J, An H Z, Tang W J, Sun J, Tang J P, Chen G M, Zhai H Q, Wang C M, Wan J M. 2016. Association mapping and genetic dissection of nitrogen use efficiency-related traits in rice (L.)., 16(3): 323?333.
Lu Y E, Song Z Y, Lü K, Lian X M, Cai H M. 2012.Molecular characterization, expression and function analysis of the amino acid transporter gene family () in rice., 34: 1943?1962.
Luo J H, Liu H, Zhou T Y, Gu B G, Huang X H, Shangguan Y Y, Zhu J J, Li Y, Zhao Y, Wang Y C, Zhao Q, Wang A H, Wang Z Q, Sang T, Wang Z X, Han B. 2013.encodes a basic helix-loop-helix protein that regulates awn development, grain size, and grain number in rice., 25(9): 3360?3376.
Masclaux-Daubresse C, Daniel-Vedele F, Dechorgnat J, Chardon F, Gaufichon L, Suzuki A. 2010. Nitrogen uptake, assimilation and remobilization in plants: Challenges for sustainable and productive agriculture., 105(7):1141?1157.
Mather K A, Caicedo A L, Polato N R, Olsen K M, McCouch S, Purugganan M D. 2007. The extent of linkage disequilibrium in rice (L.)., 177: 2223?2232.
Moll R H, Kamprath E J, Jackson W A. 1982. Analysis and interpretation of factors which contribute to efficiency of nitrogen utilization., 74: 562?564.
Nguyen Q N, Lee Y S, Cho L H, Jeong H J, An G, Jung K H. 2015. Genome-wide identi?cation and analysis ofRLK1-like kinases in rice., 241(3): 603?613.
Obara M, Kajiura M, Fukuta Y, Yano M, Hayashi M, Yamaya T, Sato T. 2001. Mapping of QTL associated with cytosolic glutamine synthetase and NADH-glutamate synthase in rice (L.)., 52: 1209?1217.
Ogawa S, Suzuki Y, Yoshizawa R, Kanno K, Makino A. 2011. Effect of individual suppression of RBCS multigene family on Rubisco contents in rice leaves., 35(3): 546?553.
Price A L, Patterson N J, Plenge R M, Weinblatt M E, Shadick N A, Reich D. 2006. Principal components analysis corrects for stratification in genome-wide association studies., 38(8): 904?909.
Raboin L M, Randriambololona T, Radanielina T, Ramanantsoanirina A, Ahmadi N, Dusserre J. 2014. Upland rice varieties for smallholder farming in the cold conditions in Madagascar’s tropical highlands.,169: 11?20.
Raboin L M, Ballini E, Tharreau D, Ramanantsoanirina A, Frouin J, Courtois B, Ahmadi N. 2016. Association mapping of resistance to rice blast in upland field conditions., 9: 59.
Rakotoson T, Dusserre J, Letourmy P, Ramonta I R, Cao T V, Ramanantsoanirina A, Roumet P, Ahmadi N, Raboin L M. 2017. Genetic variability of nitrogen use efficiency in rainfed upland rice., 213: 194?203.
Raun W R, Johnson G V. 1999. Improving nitrogen use efficiency for cereal production., 91(3): 357?363.
Risterucci A M, Grivet L, N’goran J A K, Pieretti I, Flament M H, Lanaud C. 2000. A high-density linkage map ofL., 101: 948?955.
Schmidt R, Schippers J H M, Mieulet D, Obata T, Fernie A R, Guiderdoni E, Mueller-Roeber B. 2013. MULTIPASS, a rice R2R3-type MYB transcription factor, regulates adaptive growth by integrating multiple hormonal pathways., 76(2): 258?273.
Senthilvel S, Vinod K K, Malarvizhi P, Maheswaran M. 2008. QTL and QTL × environment effects on agronomic and nitrogen acquisition traits in rice., 50(9): 1108?1117.
Shan Y H, Wang Y L, Pan X B. 2005. Mapping of QTL for nitrogen use efficiency and related traits in rice (L.)., 10: 721?727.
Shin J H, Blay S, McNeney B, Graham J. 2006. LDheatmap: An R function for graphical display of pairwise linkage disequilibria between single nucleotide polymorphisms., 16(3): 1?10.
Shomura A, Izawa T, Ebana K, Ebitani T, Kanegae H, Konishi S, Yano M. 2008. Deletion in a gene associated with grain size increased yields during rice domestication., 40(8): 1023?1028.
Storey J D, Tibshirani R. 2003. Statistical significance for genome-wide studies., 100(16): 9440?9445.
Tang W J, Ye J, Yao X M, Zhao P Z, Xuan W, Tian Y L, Zhang Y Y, Xu S, An H Z, Chen G M, Yu J, Wu W, Ge Y W, Liu X L, Li J, Zhang H Z, Zhao Y Q, Yang B, Jiang X Z, Peng C, Zhou C, Terzaghi W, Wang C M, Wan J M. 2019. Genome-wide associated study identifies NAC42-activated nitrate transporter conferring high nitrogen use efficiency in rice., 10(1): 5279.
Tang Z, Fan X R, Li Q, Feng H M, Miller A J, Shen Q R, Xu G H. 2012. Knockdown of a rice stelar nitrate transporter alters long-distance translocation but not root influx., 160(4): 2052?2063.
Tester M, Langridge P. 2010. Breeding technologies to increase crop production in a changing world., 327: 818?822.
Wei D, Cui K H, Pan J F, Ye G Y, Xiang J, Nie L X, Huang J L. 2011. Genetic dissection of grain nitrogen use efficiency and grain yield and their relationship in rice., 124(3): 340?346.
Yan M, Fan X R, Feng H M, Miller A J, Shen Q R, Xu G H. 2011. Riceinteracts with,andnitrate transporters to provide uptake over high and low concentration ranges., 34(8): 1360?1372.
Yang J L, Lee S, Hang R L, Kim S R, Lee Y S, Cao X F, Amasino R, An G. 2013. OsVIL2 functions with PRC2 to induce flowering by repressingin rice., 73(4): 566?578.
Yano K, Yamamoto E, Aya K, Takeuchi H, Lo P C, Yamasaki M, Yoshida S, Kitano H, Hirano K, Matsuoka M. 2016. Genomewide association study using whole-genome sequencing rapidly identi?es new genes in?uencing agronomic traits in rice., 48: 927?934.
Yu J M, Pressoir G, Briggs W H, Bi I V, Yamasaki M, Doebley J F, McMullen M D, Gaut B S, Nielsen D M, Holland J B, Kresovich S, Buckler E S. 2006. A unified mixed-model method for association mapping that accounts for multiple levels of relatedness., 38(2): 203?208.
Zhang P, Zhong K Z, Qasim S M, Tong H. 2016. Association analysis in rice: From application to utilization., 7: 1202.
Zhang S W, Li C H, Cap J, Zhang Y C, Zhang S Q, Xia Y F, Sun D Y, Sun Y. 2009. Altered architecture and enhanced drought tolerance in rice via the down-regulation of indole-3-acetic acid byactivation., 151: 1889?1901.
Zhang Z, Ersoz E, Lai C Q, Todhunter R J, Tiwari H K, Gore M A, Bradbury P J, Yu J, Arnett D K, Ordovas J M, Buckler E S. 2010. Mixed linear model approach adapted for genome-wide association studies., 42: 355?360.
Zhou Y, Tao Y J, Tang D N, Wang J, Zhong J, Wang Y, Yuan Q M, Yu X F, Zhang Y, Wang Y L, Liang G H, Dong G C. 2017. Identification of QTL associated with nitrogen uptake and nitrogen use efficiency using high throughput genotyped CSSLS in rice (L.)., 8: 1166.
Zhu C S, Gore M, Buckler E S, Yu J. 2008. Status and prospects of association mapping in plants., 1: 5?20.
Zifarelli G, Pusch M. 2010. CLC transport proteins in plants., 584(10): 2122?2127.
4 April 2020;
2 November 2020
Copyright ? 2021, China National Rice Research Institute. Hosting by Elsevier B V
This is an open access article under the CC BY-NC-ND license (http://creativecommons.org/licenses/by-nc-nd/4.0/)
Peer review under responsibility of China National Rice Research Institute
http://dx.doi.org/10.1016/j.rsci.2021.05.008
Louis-Marie Raboin (louis-marie.raboin@cirad.fr)
(Managing Editor: Wang Caihong)
- Rice Science的其它文章
- Development of Chromosome Segment Substitution Lines and Genetic Dissection of Grain Size Related Locus in Rice
- Water Management for Improvement of Rice Yield, Appearance Quality and Palatability with High Temperature During Ripening Period
- Effect of Milling and Parboiling Processes on Arsenic Species Distribution in Rice Grains
- iTRAQ-Based Proteomics Investigation of Critical Response Proteins in Embryo and Coleoptile During Rice Anaerobic Germination
- A New Approach to Select Doubled Haploid Rice Lines under Salinity Stress Using Indirect Selection Index
- OsbZIP09, a Unique OsbZIP Transcription Factor of Rice, Promotes Rather Than Suppresses Seed Germination by Attenuating Abscisic Acid Pathway