
Slowed driving-reaction time following concussion-symptom resolution
2021-03-19 10:22:58LndonLempkeRoertLynllNioleHoffmnHnnesDevosJulinneShmidt
Lndon B.Lempke,Roert C.Lynll,Niole L.Hoffmn,Hnnes Devos,Julinne D.Shmidt,*
a UGA Concussion Research Laboratory,Department of Kinesiology,University of Georgia,Athens,GA 30602,USA
b School of Kinesiology and Recreation,Illinois State University,Normal,IL 61790,USA
c Laboratory for Advanced Rehabilitation Research in Simulation,Department of Physical Therapy and Rehabilitation Science,University of Kansas Medical Center,Kansas City,KS 66160,USA
Abstract
Keywords: Mild traumatic brain injury;Motor vehicle;Neurocognitive function;Response time;Return to driving
1. Introduction
Concussion is a diffuse brain injury affecting millions of athletes,1,2military service members,3and the general public each year.4Clinical concussion hallmarks include transient symptom burden along with inhibited postural control and neurocognitive deficits.5,6Clinicians frequently employ standardized symptom,postural control,and neurocognitive assessments collectively to provide the strongest concussion diagnostic accuracy and monitor recovery.5,7However, clinical assessments may not truly assess performance in everyday functional activities8such as driving a motor vehicle.Limited research has examined driving performance following concussion and,consequently,no guidelines have been set forward to determine when it is safe for an individual to drive a motor vehicle.This is of concern because a growing amount of research has identified lingering deficits beyond symptom resolution9-12that may pose major safety risks for driving post-concussion.
Emerging methodologies involving dual-task(i.e.,completing a motor and cognitive task simultaneously) gait assessments9-11have identified inhibited motor function up to 2 months post-concussion, indicating that lingering deficits beyond symptom resolution may have implications for driving performance. A recent meta-analysis identified reaction time(RT)impairments,a frequently assessed clinical measure,13up to 2 months following concussion.12The Hazard Perception Test is a computerized test that shows real-life traffic scenarios and measured responses to them, and it has been employed in Australia as of 2020 for graduating from a learner’s permit to a provisional driver’s license.14Healthy young adults who fail the Hazard Perception Test (i.e., have slow RT) have a 1.8 times higher crash risk,15suggesting that rapid reactiveness is critical for responding to dangerous on-road scenarios.
Post-concussion RT is commonly examined using computerized neurocognitive testing(CNT)12and may serve as a critical and easily implemented clinical measure to aid in return-todriving decision making post-concussion.RT has been identified as a robust and lingering post-concussion deficit,12moderately predicting symptom resolution16and moderately correlating with driving performance in the general population.17Drivingrelated RT impairments have been identified following concussion but are limited to investigations using computerized tests via mouse and keyboard to measure driving RT.18-21Empirical evidence assessing post-concussion driving performance through driving simulation or on-road driving is limited to mixed samples across the traumatic brain-injury severity spectrum that do not parse out concussed individuals’ performance.22-25To our knowledge, no studies have examined concussed individuals using direct driving measures,greatly limiting our understanding of driving safety following concussion.
Limited post-concussion driving performance outcomes are problematic because individuals who may still be impaired can continue to operate a vehicle without restrictions, thereby potentially placing patients and others using roadways at heightened motor vehicle crash risk. Only 58% of concussed patients are instructed by a health care provider to refrain from driving a motor vehicle.26This is concerning because patients have demonstrated that they are significantly more likely to restrict their driving after a concussion but only if they were advised against driving.27In order to ensure patient safety and provide clinicians with return-to-driving assessments and guidelines, more research examining post-concussion driving is critical to fully understanding driving safety and crash risk.
Clinicians are tasked with implementing evidence-based assessments, which can be challenging because of limited time, personnel, or financial resources. CNT has been widely implemented among health care professionals and assesses numerous psychometric domains, including RT.13,28Commonly assessed neurocognitive domains and simulated driving performance among asymptomatic concussed individuals29and those with more severe neurologic impairments17,30vary considerably. Findings from these studies suggest that CNT assessing multiple neurocognitive domains may be clinically useful in assessing driving performance, but the true clinical utility is still unknown. The paucity of research examining concussed individuals limits our insights into whether CNT serves as an important and valid driving-performance surrogate for clinicians. Determining whether CNT can serve as a valid proxy for driving performance may help both researchers and clinicians to gain valuable insight into on-road driving safety and return-to-driving decision making.
The purpose of our study was to(1)examine differences in driving RT during simulated on-road driving scenarios in a cohort of asymptomatic concussed individuals and healthy,matched controls and (2) examine the relationship between CNT testing domains and driving-RT outcomes.Based on previous research,8,12,29we hypothesized that (1) asymptomatic concussed individuals would elicit slower RTs than matched controls overall and (2) CNT domains would display low to moderate correlations with driving-RT outcomes.
2. Methods
The current sample and study protocol have been described elsewhere previously.29Fourteen individuals who were asymptomatic after a recent concussion (15.9 ± 9.8 days post-concussion, mean ± SD) and 14 controls matched for age, sex, and years of driving experience were drawn from a large public university. All participants completed a demographic form, graded symptom checklists, a driving simulation, and CNT. Ten of the 14 concussed participants experienced a sports-related concussion mechanism. All participants possessed a valid Class C driver’s license,with 1 concussed participant and a matched control possessing a Class B commercial driver’s license. Potential participants were excluded for any of the following self-reported criteria:history of any neurological disorder or injury (except concussion),current medication use causing drowsiness, or heavy alcohol or drug use. Control participants were also excluded if they had had a previous concussion within the past 2 years. This study was approved by the University of Georgia’s Institutional Review Board, and informed written consent was obtained prior to data collection.Following study completion,an honorarium was provided to all participants for their time.
Control participants were recruited using flyers posted on campus. A health care professional not involved in the study independently diagnosed concussed participants in accordance with the 2013 Consensus Statement on Concussion in Sport.31Concussed participants were recruited after an initial clinical laboratory referral from the University Health Center,and they completed the study protocol within 48 h of symptom resolution.29All participants were encouraged to maintain their normal routines, including caffeine consumption and hours of sleep, on the day of testing in order to minimize factors influencing the assessments.
Symptom resolution, also described as asymptomatic in the present study, was confirmed by administering, with 2 sets of instructions, a graded symptom checklist,32which consisted of an 18-item list of common concussion symptoms scored on a 7-point Likert scale (0=no symptom; 1=mild symptom;6=severe symptom).29,33The first administration instructed concussed individuals to indicate the symptoms they experienced on a regular basis(≥3 times/week)before their injury.This administration served as a baseline symptom proxy and was compared to a second, graded symptom checklist given with traditional instructions(symptoms experienced within the past 48 h).Individuals were deemed to have symptom resolution (i.e., be asymptomatic) when their current total symptom severity score was <10 of their baseline proxy and then scheduled for their asymptomatic timepoint.33For example,a participant reporting a symptom severity score of 2 on the baseline proxy would trigger scheduling for the asymptomatic timepoint if the current symptom severity score was between 0 and 12.
2.1. Driving assessment
Driving performance was assessed using a driving simulator(STISIM drive,Version 3;System Technology Inc.,Hawthorne,CA, USA).29Driving simulator scenarios were displayed on three 25-inch computer monitors with a 145?horizontal field of view.Steering wheel,accelerator pedal,and brake pedal driving controls(Logitech G27;Logitech,Lausanne,Switzerland)were used to perform the simulated driving.29All participants first completed a 5-min simulator familiarization drive to learn and become comfortable with the driving simulator’s scenarios and controls. Participants then completed a standardized 20.5-km driving simulation task lasting 14.43 ± 1.30 min. The task involved driving in traffic experienced in daily life in urban,suburban, and rural areas on straight, curved, 2- and 4-lane roads and while overtaking, adapting speed, and stopping for other vehicles,pedestrians,stop lights,and stop signs.29The simulator sickness questionnaire34was administered after each driving simulation scenario to assess participants for symptoms associated with simulator adaptation syndrome, but no participants experienced simulator discomfort throughout the study protocol.
Our previous study29examined the software driving simulator performance metrics generated in a standard report and compared the concussed group’s metrics with the control group’s metrics. Our current study presents novel driving-RT metrics derived from the simulated driving scenarios and calculated from the raw time-series data(event stimulus presentation,steering wheel,brake pedal,accelerator pedal)recorded at 10 Hz.In real-life driving, practice and multiple attempts do not occur when a hazardous situation occurs. Therefore, we simulated 3 different driving scenarios with 1 trial each that appeared in the following order without any warning: (1) a stoplight changing colors from green to yellow to red, (2) evading a rapidly approaching vehicle,and(3)a pedestrian running out in front of the vehicle. These 3 scenarios were used because they provide time-stamped events, and clear responses could be determined regardless of an individual’s driving style(Figs.1-3).
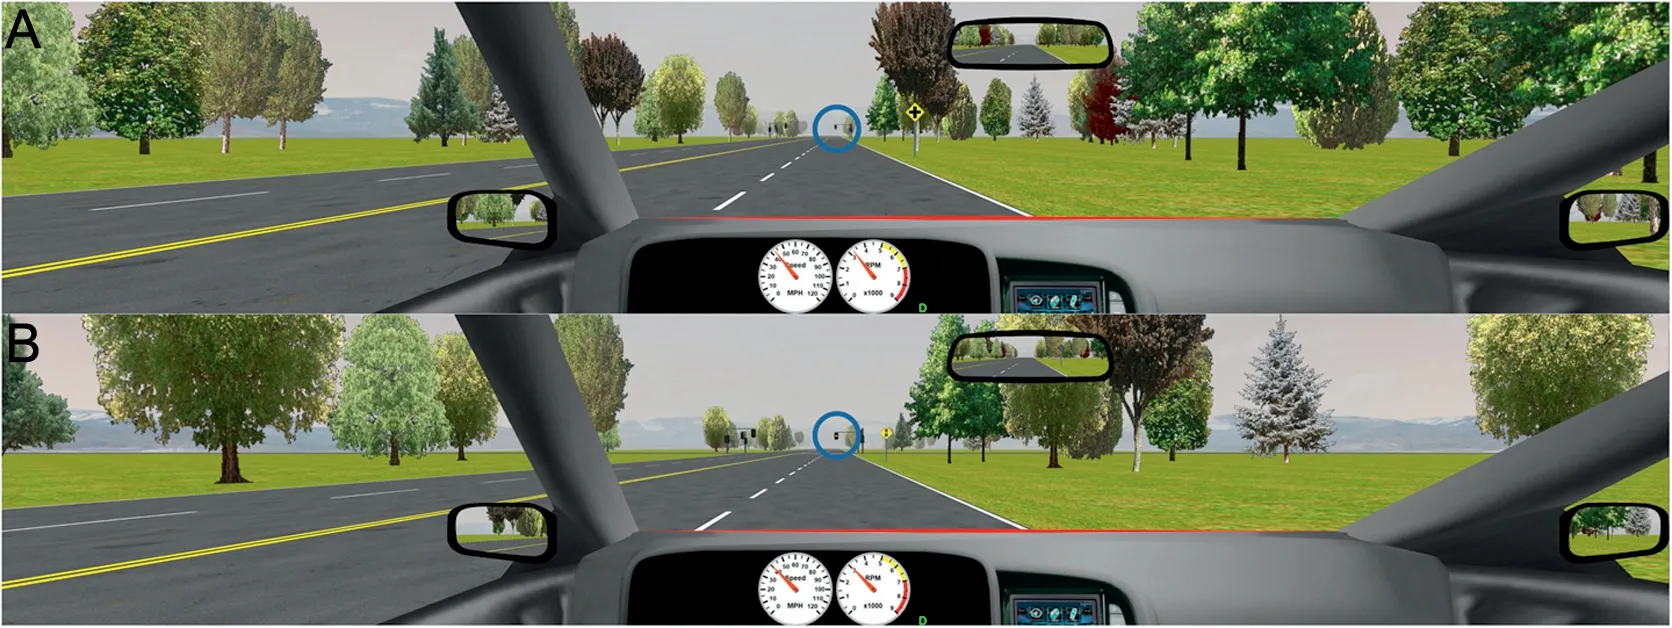
Fig. 1. Stoplight driving scenario. Participant’s view of the stoplight driving scenario across the 3 curvilinear monitors.(A)The stoplight was presented in front of the vehicle.(B)The stoplight turned from green to yellow(lasting 5 s)when the vehicle was 7 s away from the stoplight.
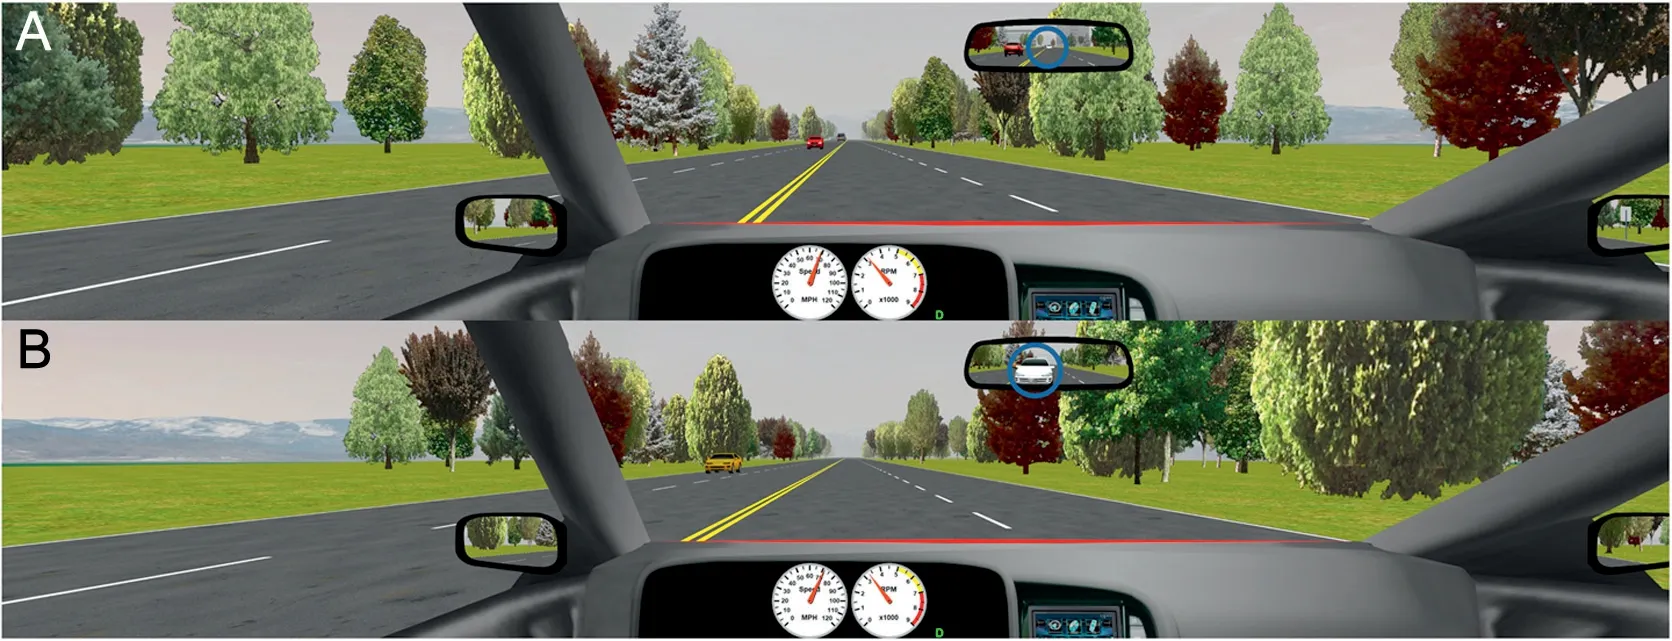
Fig. 2. Vehicle collision evasion scenario. Participant’s view of the vehicle collision evasion driving scenario across the 3 curvilinear monitors. (A) A white, computer-driven vehicle appeared behind the vehicle in the same lane and(B)rapidly approached and would collide with the participant-driven vehicle unless the participant evaded the collision.

Fig. 3. Pedestrian driving scenario. Participant’s view of the pedestrian driving scenario across the 3 curvilinear monitors. (A) A pedestrian initially appeared 5.5 m to the right and 57.9 m in front of the vehicle and(B)ran across the roadway at 17.6 km/h when the vehicle was 2 s away from the pedestrian’s position.
2.1.1. Stoplight RT
All participants approached a stoplight with a 72.4-km/h speed limit during the driving simulation. The stoplight was illuminated green until the vehicle was 7 s away from the stoplight(Fig.1A),at which point the stoplight changed to yellow,lasting 5 s (Fig. 1B) and then to red, lasting 6 s. Stoplight RT was calculated based on this scenario. Stoplight RT (ms) was calculated as the time from initial yellow light presentation to either increased or decreased brake or accelerator pedal raw input signals,whichever occurred first.Both brake and accelerator pedal input increase or decrease were examined because drivers having varying driving styles may have responded by either accelerating when they saw the yellow light or immediately stepping on the brake. Pedal input must have met or exceeded 2 times the range from the mean input 0.5 s prior to light change.This range was selected due to the small variance observed(i.e.,accelerator pedal input while driving straight at a relatively constant speed) or no variance observed (i.e., no brake pedal input while driving), which provided a conservative but definitive RT identification that was standard across all participants.
2.1.2. Evasion RT
During the vehicle collision-evasion scenario, participants drove on a straight, 4-lane road with a 112.7-km/h speed limit and no other vehicles going the opposite direction. A white,computer-driven vehicle appeared at a constant distance on the road in the same lane behind the driving participant (Fig. 2A)and then rapidly approached and would collide with the participant vehicle in 3 s,regardless of the participant’s previous driving speed,unless the participant evaded the collision(Fig.2B).Participants could have effectively used the steering wheel,accelerator,brake,or any combination of these controls to avoid collision.Therefore,evasion RT(ms)was calculated as the time from when the computer-driven vehicle appeared to either steering wheel,brake,or accelerator input(whichever occurred first)being ≥2 times that respective input’s range from its mean input 0.5 s prior to the computer-driven vehicle’s appearance.
2.1.3. Pedestrian RT
Participants drove on a straight,2-lane road with a 56.3-km/h speed limit and no other simulated vehicles on the road during this scenario. A pedestrian initially appeared 5.5 m to the right of the roadway when the vehicle was 57.9 m away from the pedestrian’s location (Fig. 3A). When the participant’s vehicle was 2 s away from the pedestrian,the pedestrian ran across the roadway at 17.6 km/h in front of the vehicle(Fig.3B).Participants could have effectively used the steering wheel, accelerator,brake,or any combination of these controls to avoid hitting the pedestrian.Therefore,pedestrian RT(ms)was calculated as the time from when the pedestrian initially ran across the road to either steering wheel, brake, or accelerator input (whichever occurred first)meeting or exceeding 2 times the range from the mean input 0.5 s prior to the pedestrian’s movement.
2.1.4. Driving-RT composite score
A driving-RT composite score (ms) was also calculated by taking the average RT across all 3 driving scenarios (stoplight,evasion,pedestrian)separately for each individual.The driving-RT composite score was used to provide an overall driving-RT summary and reduce RT variance that may have occurred by collecting 1 trial each from the 3 driving scenarios.
2.2. Computerized neurocognitive testing assessment
All participants completed the reliable and valid CNT via CNS Vital Signs,28,35and the following standard cognitive domains were assessed:verbal memory and visual memory,psychomotor speed, RT, simple and complex attention, processing speed,cognitive flexibility,executive function,and motor speed.All cognitive domains were derived from previously described28psychometrically valid subtests and are presented as raw outcome scores. Greater cognitive domain scores represent better performance for all domains,except RT and complex attention,where lower scores represent better performance.
The RT cognitive domain is derived from the Stroop Task subtest, which employs 3 conditions (simple, complex, and Stroop), and participants were also examined individually in order to explore thoroughly the relationship between CNT RT and driving RT outcomes.The Stroop Task subtest displayed a series of color words (i.e., red, yellow, blue, green) in a random order. Participants were instructed to press the spacebar immediately after each word was presented in its specified correct format. Simple RT was calculated from trials where all color words were in black font(e.g.,the word“red”was written in black), complex RT was calculated from trials where color words were displayed in the same color font (e.g., the word “blue” was written in blue), and Stroop RT was calculated from trials where color words were not written in the same color font(e.g.,the word“green”was written in yellow,blue, or red).8,28Simple, complex, and Stroop RT (ms) were calculated as the average time between word appearance and spacebar input.
2.3. Data processing and statistical analysis
All driving-simulator scenario data were imported into MATLAB (Version R2017a; The MathWorks, Natick, MS,USA)and were analyzed to calculate the RTs for each driving scenario as described. Descriptive statistics were calculated among participant demographics and driving-RT outcomes.However, CNT domains were not calculated because they have been reported previously.29
Independent t tests and Hedges d effect sizes36—a conservative, small-sample, bias-adjusted Hedges g calculation—were used to examine significant between-group differences and their magnitudes among all driving-RT outcomes. Mean difference and 95% confidence intervals (95%CIs) were also calculated. General linear model assumptions were assessed with Quantile-Quantile (Q-Q) plots and the Shapiro-Wilks test,with significant violations observed among all driving-RT variables. All normality violations were corrected using natural logarithmic transformation, successfully met normality before statistical analysis, and were back-transformed for reporting findings.37,38Hedges d effect sizes were interpreted according to conventional statistical guides, with <0.21,0.21-0.79,and >0.79 used as thresholds for small-,medium-,and large-magnitude effects,respectively.39
Pearson correlation coefficients (r) were used to examine the relationship between all CNT cognitive domains and the driving-RT outcomes separately for concussed and control groups. All correlations were interpreted as negligible, low, moderate, high,or strong at <0.31, 0.31-0.50, >0.50-0.70, >0.70-0.90, and>0.90,respectively.40All outcomes were examined for potential outliers,with none present following log transformation.Because of the multiple statistical tests conducted,the false-discovery rate was controlled for the independent t tests and Pearson correlations separately via Benjamini-Hochberg procedures.41,42The Benjamini-Hochberg adjusted p values are presented. Statistical analyses were performed using the R Project for Statistical Programming (Version 3.4.3;the R Foundation for Statistical Computing,Vienna,Austria),with α=0.05 a priori.
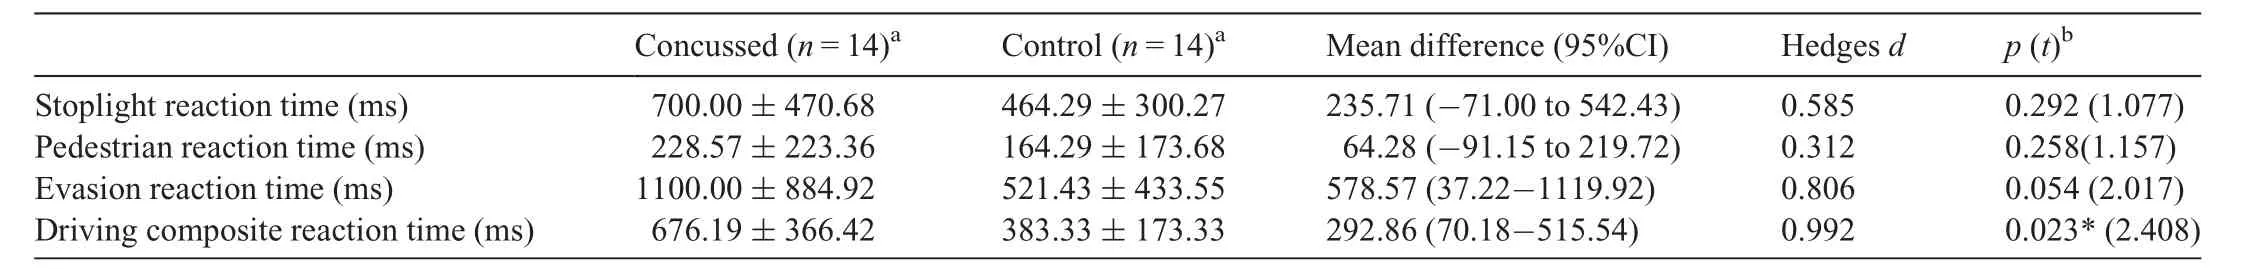
Table 1 Driving reaction time outcomes between cohorts.
3. Results
The concussed group did not differ significantly from the control group based on self-reported age(20.2±0.9 years vs.20.4±1.1 years;p=0.607),concussion history(0.9±1.0 concussions vs. 0.3 ± 0.8 concussions; p=0.075), years of education (12.9 ± 1.1 years vs.13.2± 1.4 years; p=0.544), driving experience (4.4 ± 1.0 years vs. 4.1 ± 1.1 years; p=0.545),motor vehicle crash history (0.3 ± 0.5 crashes vs. 0.3 ± 0.6 crashes; p=1.000), driving violation history (0.3 ± 0.6 violations vs. 0.4 ± 0.5 violations; p=0.737), or total symptom severity score (4.6 ± 4.5 vs. 3.2 ± 4.3; p=0.423).29The total symptom-severity threshold used to initiate the asymptomatic timepoint scheduling was <10 total symptom severity points of their baseline proxy.Due to time delays between scheduling and the actual testing visit, the average total symptom difference between the baseline proxy and traditional symptom checklist was-0.79±3.04,median=0(range:-9 to 3),indicating that all participants were at <3 symptom severity points of their retrospective baseline. The CNS Vital Signs cognitive domain score group comparisons have been published elsewhere previously and did not statistically differ between concussed and control cohorts(p ≥0.096).29
3.1. Group differences in driving RT
Driving-RT group comparisons and effect sizes are presented in Table 1 and Fig.4.Significant group differences were observed for driving composite RT(mean difference=292.86 ms;95%CI:70.18-515.54; p=0.023), with slower performance in the concussed cohort. No statistically significant group differences were observed for stoplight,pedestrian,or evasion driving RT following false-discovery rate corrections(p ≥0.054),but moderate to large effects were present for all driving-RT outcomes(Hedges d range:0.312-0.992)(Table 1).
3.2. The relationship between driving RT and CNT
The concussed cohort’s Pearson correlations between all driving-RT and CNT domain outcomes are presented in Fig. 5A. No concussed-group driving-RT outcomes statistically correlated with any other CNT outcomes following falsediscovery rate correction (r-range:-0.51 to 0.55; p >0.05)(Fig.5A).The healthy,matched-control cohort’s Pearson correlations between driving-RT and CNT domain outcomes are displayed in Fig. 5B, and driving-RT outcomes did not statistically correlate with any CNT outcomes(r-range:-0.64 to 0.72;p >0.05).
4. Discussion
This study provides critical insight into driving RT among asymptomatic concussed individuals and their relationship to traditional CNT.We identified slowed driving RT and moderate to high deficit effects among asymptomatic concussed individuals,which raises concerns about driving reactiveness and overall driving safety. We also observed moderate, but nonsignificant,correlations between a few driving-RT and CNT outcomes.The abundance of nonsignificant correlations indicates current CNT is not a perfect surrogate for measuring driving RT.Our findings provide valuable awareness for clinicians and researchers making post-concussion recommendations and demonstrate that current clinical assessments are likely to be missing critical functional outcomes not currently being examined.
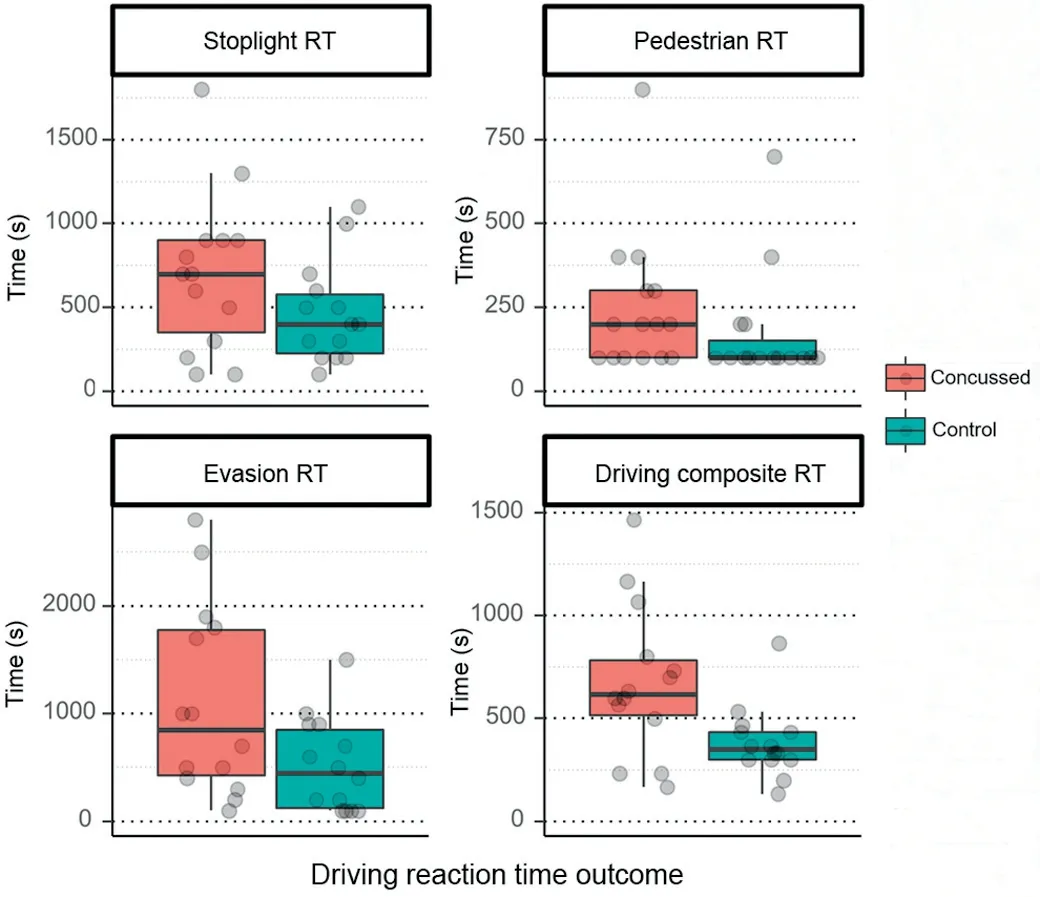
Fig. 4. Driving reaction differences between concussed and control groups.Driving-RT differences between concussed(n=14)and control(n=14)groups.Each participant’s RT during each assessment is plotted via jittered,transparent dots. The thick black line in the box plots represents median values; the box widths represent the 1st (25%) and the 3rd (75%) quantiles, and the whiskers represent box quantiles±1.5×interquartile range.RT=reaction time.
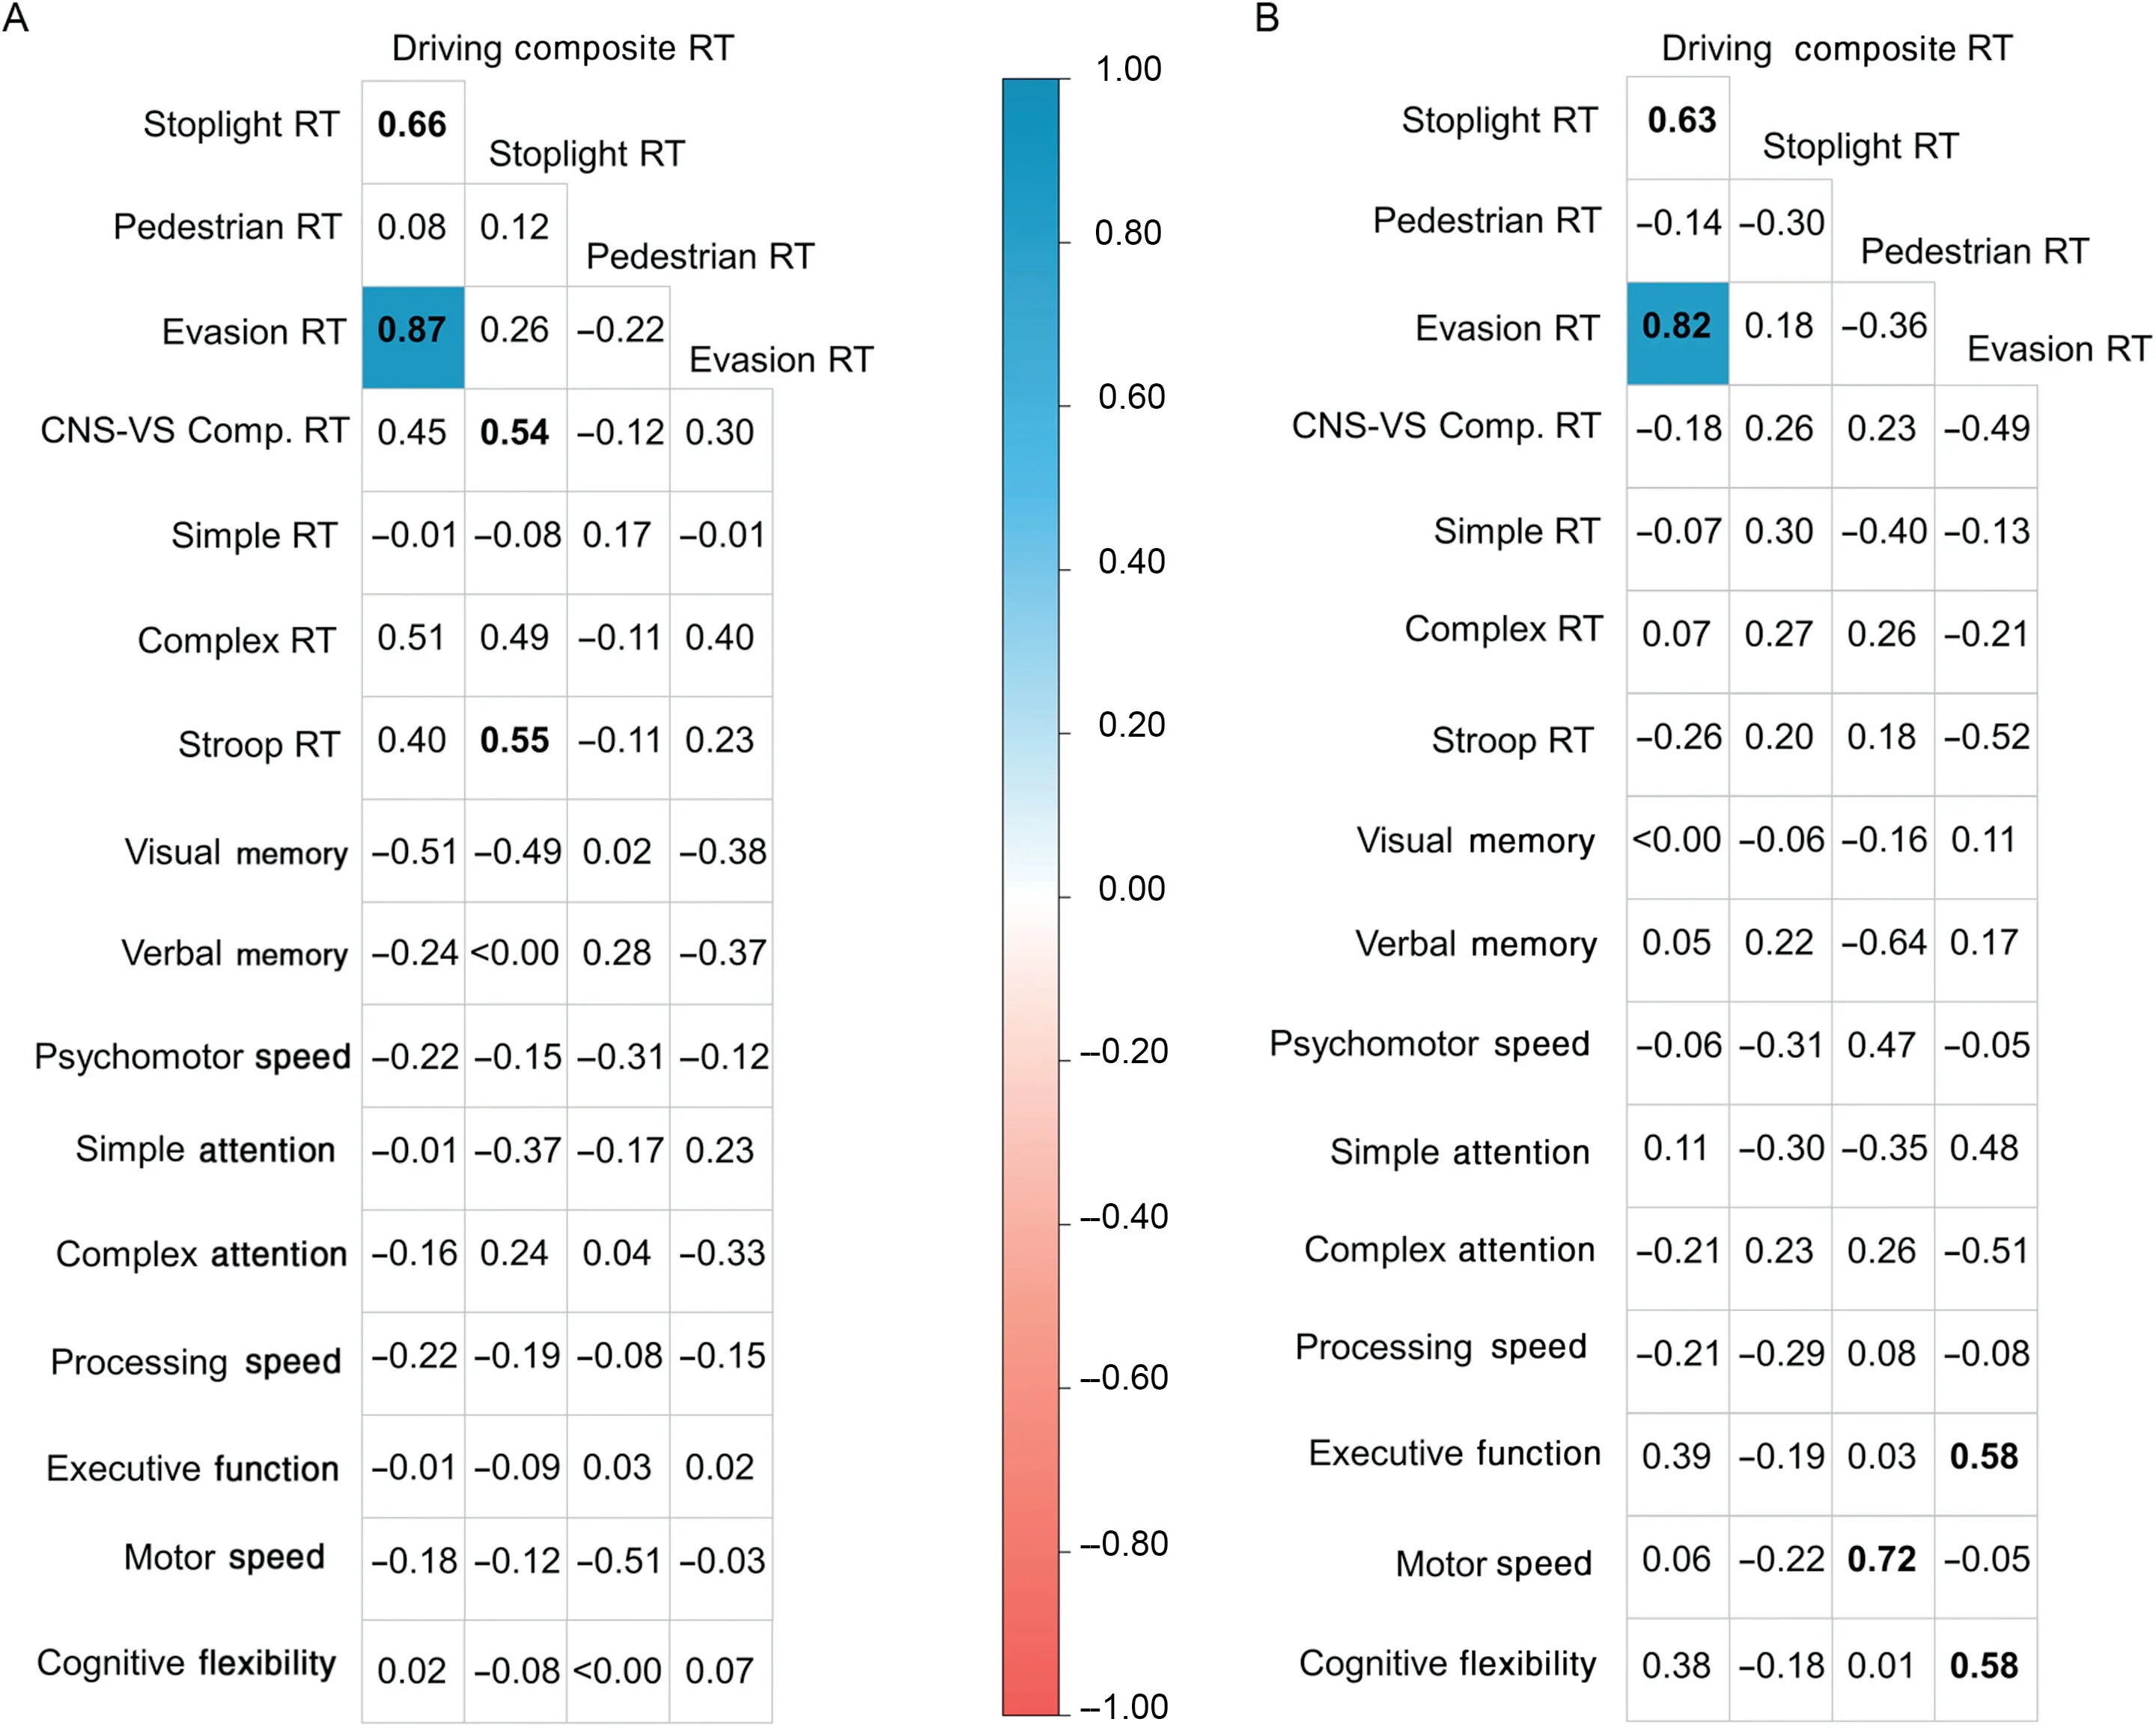
Fig. 5. Driving reaction time and computerized neurocognitive testing domain correlation matrix. Correlation matrices presented separately for (A) the asymptomatic concussed cohort(n=14)and(B)the healthy matched control cohort(n=14).Only correlations with p ≤0.05 after false discovery rate correction via Benjamini-Hochberg procedures are colored according to the correlation level.Non-bolded values indicate non-significant correlations from uncorrected p values(p >0.05),and bolded values with white cells indicate significant p values from uncorrected correlations.CNS-VS Comp.=CNS-Vital Signs Composite Score;RT=reaction time.
4.1. Post-concussion driving-RT deficits
We employed 3, single-trial driving scenarios (stoplight,evasion, pedestrian) (Figs. 1-3) to model real-life, hazardous driving RT among the concussed and healthy cohorts. We observed significantly slowed RT on the driving composite RT(mean difference=292.86 ms) and clinically meaningfully slowed evasion RT (mean difference=578.57 ms) among asymptomatic concussed individuals, but not on the stoplight and pedestrian assessments (Table 1). Converting the mean RT differences to additional distance traveled (distance=speed×time) provides direct clinical applicability to our findings.This conversion reveals the concussed cohort collectively required an additional 18.11-m (59.40 ft) when traveling 112.7 km/h during the evasion RT scenario and 6.55 m(21.48 ft) for the driving-RT composite score when traveling at the averaged scenario driving speed (80.47 km/h) to react than the healthy cohort required. The additional distance needed to react by the concussed cohort is considerable and does not account for the additional time needed to actually slow or move the vehicle away from the hazard. Impaired RT in our asymptomatic concussed cohort may partially explain the findings in a previous study that identified a higher percentage of concussed individuals’ (8.2%) reporting more car crashes in the previous 6 months than did healthy individuals(2.7%).21It is important to note, however, that not all concussed individuals displayed slowed RT compared to controls(Fig.4).Variable RT deficits pose a challenge for determining who has driving impairments and may need driving restrictions following concussion.
All driving-RT outcomes had moderate to high effects for concussed deficits. A recent meta-analysis examined post-concussion RT deficits among various clinical assessment techniques and identified moderate deficits at 4-17 days postinjury (Hedges d=0.57; 95%CI: 0.44-0.70).12Our present findings are consistent with and expand on the meta-analysis by highlighting that deficits are still present in an important functional activity of daily living when concussed individuals are asymptomatic. These cumulative driving-RT deficits indicate that meaningful group differences are still likely to be present, even in the absence of statistical differences across all outcomes.p values represent the statistical probability of group differences due to chance and are heavily influenced by sample size, whereas effect sizes examine the magnitude of group differences and are negligibly influenced by sample size.43,44The sample size in our study was relatively small (n=14 in each cohort) and is likely to be a key driver for evasion, stoplight, and pedestrian RT, displaying moderate to high effect sizes but no statistically significant differences.
Slowed RT is a critical impairment for driving safety,with consequences present for the individual and others on the road.Crash risk has been reported to be 1.8 times greater among young healthy individuals who fail (i.e., have slow RT) the Hazard Perception Test, suggesting that impaired RT should not go unnoticed.15Previous work using computerized tests via mouse,keyboard,or touchscreen as a substitution for driving simulation or on-road driving performance have consistently demonstrated acutely impaired RT among concussed individuals.18-21Our findings provide greater insight into RT deficits when participants are asymptomatic and suggest that slowed RT is still present and may potentially increase crash risk. Future research must aim to explore thoroughly driving performance and crash history throughout concussion recovery in order to determine when it is safe for individuals to return to driving.
4.2. The relationship between driving and CN
Clinicians often use computerized neurocognitive testing following concussion, but it is only one of a growing number of clinical assessment techniques employed.13Determining when it is safe for individuals to drive is a critical question that remains unanswered, but 1 option is to use current clinical assessments as proxies for driving performance.We examined the relationship between driving RT,one of numerous drivingperformance metrics, and CNT domains in order to determine whether any meaningful associations existed. No correlations were statistically significant following false-discovery rate corrections between driving and CNT testing among concussed or healthy individuals when examined separately(Fig.5).There were also no common correlation domain similarities between concussed and healthy individuals prior to correlations’being corrected for false-discovery rate,suggesting that CNT is not a valid driving-RT surrogate. Although one correlation (motor speed and pedestrian RT) among healthy individuals had a nonsignificant, but high-magnitude,correlation (r=0.72), it is important to note that this correlation has a coefficient of determination (i.e., R2value) of 0.52 and shows that even the highest correlation observed would have left 48% of the inter-measurement variance to be explained.Our observed correlation strengths,however,are in line with previous research identifying small- to moderatemagnitude computerized and paper-and-pencil neurocognitive testing relationships with driving performance.22,29,30The previous findings of small to moderate correlations coupled with our present work suggest that current neurocognitive assessments might not be optimal surrogates for assessing driving RT.
CNT is recommended to be performed in quiet, isolated environments so that individuals can exert maximal effort and focus on the test.45Driving a vehicle is probably more complex than CNT because individuals must make reactive changes to multiple, force-sensitive vehicle controls in distracting, attention-divided environments. Recent work has shown that CNT RT measures are not correlated with functional jumping, hopping, or cutting RTs used in sport.8Our study findings presented here are similar in theme and cumulatively indicate that current clinical assessments may not fully translate to performance in functional activities such as walking,9,10sport-like jumping, hopping, or cutting,8and, as seen in this study,driving.
The lack of statistical correlation between CNT and driving-RT measures may have driving-safety implications.Approximately 40%-49% of clinicians provide driving recommendations or restrictions following concussion,26,46with CNT and RT measures being widely used to determine return-to-driving clearance.26,47However, our findings and the findings of others22,29,30suggest that CNT might not be an optimal proxy for driving RT. Clinicians and researchers should be aware of these potential discrepancies and work to identify clinically feasible and accurate measures of driving performance.
4.3. Limitations
We examined a relatively small sample of college students from a large university; therefore, our findings may not be generalizable to more experienced drivers or the general population.We also controlled for type I errors in our study via the Benjamini-Hochberg procedure,41,42but this may inadvertently have masked clinically meaningful findings from the correlation analysis due to the limited statistical power associated with our small sample size. The driving-RT calculations in our study were calculated from one trial rather than from numerous RT trials(as is often performed),and this may have contributed to the relatively high variance observed among outcomes. However, this limitation may be important to consider when aiming to assess on-road driving naturally, where hazardous scenarios do not present with warnings or allow for multiple trial attempts. Far less variance was also observed among controls than among concussed individuals, and this may indicate that the use of a single trial was a negligible factor (Fig. 4). Because of the clinical evaluation process employed in our study and the lack of feasibility of assessing college students at standardized times, our study did not standardize the time of day when assessments were completed,nor did it restrict the use of caffeine by participants,and these limitations may have confounded the RT outcomes.Last,the driving simulator sampling frequency (10 Hz) was also relatively low and did not allow for high temporal resolution.The limited temporal resolution likely contributed to the observed variance as well.However,even with a small sample size and high variance, we nevertheless observed meaningful group differences and large effects,indicating asymptomatic concussed individuals may still have lingering driving-RT deficits that warrant further exploration among larger samples.
5. Conclusion
Slowed driving RTs were identified in asymptomatic concussed individuals, which further raises concerns about post-concussion driving safety. A small number of low- to moderate-strength,but not statistically significant,correlations existed between CNT and driving-RT measures, suggesting that current assessments do not adequately reflect driving performance metrics. Our findings cumulatively point toward evaluating driving performance using on-road, simulated, or validated driving proxies to ensure the safety of both the patients and the general public when they use the roadways.Additional work is needed to fully understand driving performance throughout concussion recovery in order to establish return-to-driving safety recommendations.
Acknowledgments
We thank Diana Robertson (University of Georgia) for her assistance in data processing. This study was funded by the Office of the Vice President of Research at the University of Georgia.
Authors’contributions
LBL carried out the driving-RT calculations,performed the statistical analysis, and drafted the manuscript; RCL and HD assisted in the driving-RT calculations,participated in the statistical analysis,and helped draft the manuscript;NLH participated in the study design and coordination, collected all the data described, participated in the statistical analysis,and helped draft the manuscript; JDS conceived the original study, participated in its design and data collection, participated in the statistical analysis, and helped draft the manuscript.All authors have read and approved the final version of the manuscript,and agree with the order of presentation of the authors.
Competing interests
The authors declare that they have no competing interests.
 Journal of Sport and Health Science2021年2期
- Journal of Sport and Health Science的其它文章
- Concussion research:Moving beyond the natural history
- Author biographies
- Learners’motivational response to the Science,PE,&Me!curriculum:A situational interest perspective
- Effects of chronic decaffeinated green tea extract supplementation on lipolysis and substrate utilization during upper body exercise
- Training load characteristics and injury and illness risk identification in elite youth ski racing:A prospective study
- Effects of flexibility and strength training on peak hamstring musculotendinous strains during sprinting