
Polar Gini Curve: A Technique to Discover Gene Expression Spatial Patterns from Single-cell RNA-seq Data
2021-02-24 03:06:10ThanhMinhNguyenJacobJohnJeevanNuoXuJakeChen
Thanh Minh Nguyen, Jacob John Jeevan, Nuo Xu, Jake Y. Chen,
1Informatics Institute, the University of Alabama at Birmingham, Birmingham, AL 35294, USA
2Collat School of Business, the University of Alabama at Birmingham, Birmingham, AL 35294, USA
Abstract In this work,we describe the development of Polar Gini Curve,a method for characterizing cluster markers by analyzing single-cell RNA sequencing (scRNA-seq) data. Polar Gini Curve combines the gene expression and the 2D coordinates (“spatial”) information to detect patterns of uniformity in any clustered cells from scRNA-seq data. We demonstrate that Polar Gini Curve can help users characterize the shape and density distribution of cells in a particular cluster,which can be generated during routine scRNA-seq data analysis.To quantify the extent to which a gene is uniformly distributed in a cell cluster space,we combine two polar Gini curves(PGCs)—one drawn upon the cell-points expressing the gene (the “foreground curve”) and the other drawn upon all cell-points in the cluster (the “background curve”). We show that genes with highly dissimilar foreground and background curves tend not to uniformly distributed in the cell cluster—thus having spatially divergent gene expression patterns within the cluster. Genes with similar foreground and background curves tend to uniformly distributed in the cell cluster—thus having uniform gene expression patterns within the cluster. Such quantitative attributes of PGCs can be applied to sensitively discover biomarkers across clusters from scRNA-seq data.We demonstrate the performance of the Polar Gini Curve framework in several simulation case studies.Using this framework to analyze a real-world neonatal mouse heart cell dataset,the detected biomarkers may characterize novel subtypes of cardiac muscle cells.The source code and data for Polar Gini Curve could be found at http://discovery.informatics.uab.edu/PGC/or https://figshare.com/projects/Polar_Gini_Curve/76749.
KEYWORDS Single-cell gene expression;Polar Gini curve;Spatial pattern;Biomarker discovery
Introduction
High-dimensional single-cell gene expression data embeds rich spatial information that can help biomedical researchers understand how cells or genes relate to each other in complex biosystems [1]. In the physiological context,spatial information refers to the relative spatial organization of individual cells to one another and how they organize into tissues or organs from single cells. Spatial transcriptomic research[2–4]aims to map individual cells to a reference tissue [5–7]. Tissue reference images, therefore,may provide a 2D or 3D“spatial template”with which one may map the original location of cells.This template allows the reconstruction of 2D distributions (a “spatial pattern”)of gene expressions of each cell within a physiological space. Examples of the reconstruction techniques include:comparing the spatial patterns of different “marker genes” [8], drawing “contour lines” among subsets of cell populations sharing similar spatial patterns[9],or detecting“outliners” from the cell populations. Spatial information can also be present in the non-physiological context. For example,dimensional reduction and embedding techniques[10–14] help researchers visualize all cells in a lowdimensional 2D/3D projected space, which do not readily map to the cell’s original physiological spatial location to one another. Instead, the gene expression spatial patterns here refer to shared “gene expression pattern similarity”.The more in common two cells share with each other their n-dimensional gene expression vectors,the more likely they are placed closely together in the 2D/3D space by the embedding and other projection techniques. The less in common two cells share with each other their n-dimensional gene expression vectors, the less likely they are placed closely together in the 2D/3D space. Even though spatial patterns of cells in an embedded space do not confer cellular organization patterns, integrating spatial patterns of cells and their gene expression patterns in what we refer to as“gene expression spatial patterns” can further help us characterize gene expression heterogeneity, even within a given cell subpopulation(“cluster”).
In this work, we are interested in characterizing the spatial patterns of the expression of any geneXover a population of cells in an embedded space.Here,we introduce several useful concepts.First,there are two primary types of spatial patterns to be considered,i.e., the background pattern and the foreground pattern. For the “background pattern”,we refer to the spatial gene expression pattern for all cells in a particular cell population. For the “foreground pattern”,we refer to the spatial gene expression pattern for only cells expressing the particular geneXor a set of predefined genes in the same population of the background.Second, we consider spatial gene expression patterns primarily on two aspects,i.e.,the cell population shape and the density distribution of cells in the population.For the“cell population shape”, we refer to the convex hull (or equivalent smoothed curve)encapsulating all points(“cells”)in a 2D embedding space.For the“density distribution”of cells,we refer to the count of all binned cells (either in the background or in the foreground) in the 2D embedding space project along an axis at a given angle. Third, we are interested in comparing spatial gene expression patterns by defining spatial gene expression pattern similarities among genes.For similar spatial gene expression patterns between two genes,we refer to genes,e.g.,XandY,being expressed in a given population with similar spatial gene expression patterns relative to the background.Fourth,we are interested in applying the new analytic framework to the identification of marker genes for a given cell population. For marker genes, we refer to genes with similar spatial gene expression patterns between the foreground and the background in particular but not all cell subpopulation(s). With spatial gene expression pattern information available in the single-cell gene expression data, this new conceptual framework can enhance well-established nonparametric [15]and parametric[16–20]for identifying marker genes.
Based on this set of new concepts,we developed a novel analytical framework to process spatial gene expression patterns from single-cell expression data.In this framework,we incorporate into a new visual analytic tool called Polar Gini Curve,which takes into account of both cell population(or a cluster)shapes and cell density distribution within the cluster from 360-degree angles in the embedding space.Our strategy was to project the single-cell 2D cluster onto 360-degree angle-axes to explore all viewing angles of the cluster. On each viewing angle, the polar curve is derived from a calculation based on the Gini coefficient [21] between the foreground and the background, which measure inequality of cell-point distribution along the axis at the given viewing angle. We applied this framework first to detect spatial gene expression similarities between genes within the same single-cell cluster. Before our proposed solution,this problem has been challenging[22]due to data heterogeneity [19,23,24], the low sensitivity of standard bulk-expression techniques[25–28],and single-cell pipeline noise, particularly in embedding [12,17,29] and clustering[30–32].Then,we demonstrated the feasibility of using this framework to detect gene expression spatial pattern similarities in several simulation case-studies.Last,applying our framework to analyzing neonatal mouse heart single-cell data [33], we were able to detect new marker genes characteristic of novel subtypes of cardiac muscle cells.
Method
Constructing polar Gini curves for one set of cell-points
Figure 1demonstrates the workflow to compute two polar Gini curves (PGCs): one is for all cluster cell-points(background),and the other is for one gene in a cell cluster from the single-cell expression data (foreground). Our approach used the 2D embedding [29] and clustering results from single-cell expression data as the input.Starting from the 2Dx-yembedding space, for an arbitrary angle θ, the pipeline projects thex-ycoordinate[34]for every cell-point onto the θ-axis (zscore)
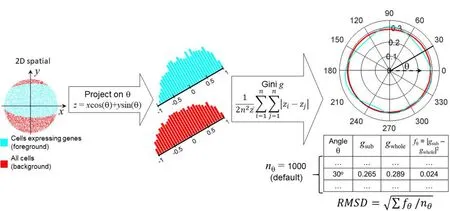
Figure 1 Overall workflow to compute RMSD metric for one gene in one cluster of cellsData points,histogram,and PGCs for cells expressing the gene(foreground)and all cells(background)are shown in cyan and red,respectively.PGC,polar Gini curve; RMSD, root mean square deviation.

We subtracted the z scores generated from Equation 1 with the smallestzto ensure that allzscores are non-negative,which is the requirement for computing the Gini coefficient.Then, it computed two Gini coefficientsgsubandgwholeto measure the inequality among thezscores. Thegsubcoefficient only used the distribution ofzscores obtained from cells expressing the gene. Thegwholecoefficient would use the distribution of allzscores. The equation for Gini
coefficient is described previously in[21].
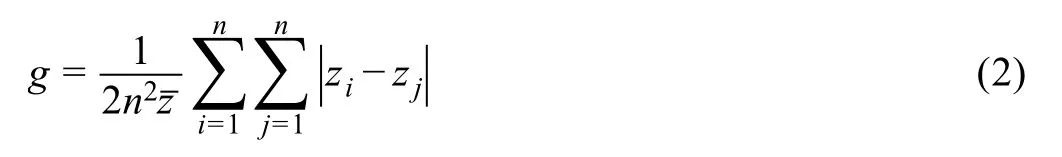
whereiandjare arbitrary indices in the lie of thesezscores,andnis the size of thezscore list. Repeating Equations 1 and 2 for multiple angles θ spanning from 0 to 2π would yield the corresponding lists betweengand θ, as shown in the bottom-right table in Figure 1.By default,there are 1000 angles (nθ= 1000): 0, π/500, 2π/500, …, 999π/500. This would lead to two polar curves for Gini coefficients,one for the cell-points expressing the gene in the cluster,and one for all cell-points in the cluster.
Identifying biomarkers using Polar Gini Curve
We hypothesize that the two curves would be closer in the marker-gene scenario than in the non-marker gene scenario.Therefore,we used the root mean square deviation(RMSD)metric, which is popular in computing fitness in bioinformatics field[35],to determine whether a gene is a marker in the cluster.
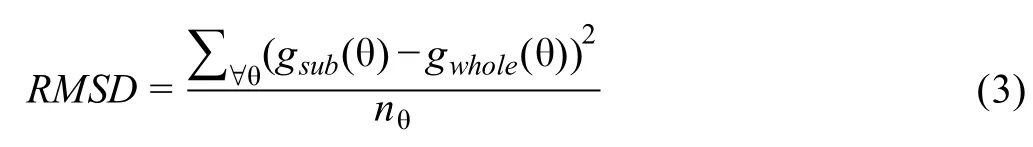
Here,nθ,also called the resolution,is the number of angles θ for which we repeat Equations 1 and 2.
To compute the RMSD statisticalPvalue for each gene in each cluster, first, we normalized (scaled) the RMSD computed in Equation 3 by its empirical cumulative distribution over all RMSD. This could be done by dividing RMSD for each gene (as in Equation 3) by the largest RMSD among all genes in each cluster. Then, we applied the estimatedPvalue calculation in[36]to assign aPvalue for each gene in each cluster. Briefly, we computed the meanμand standard deviationσof the 200 uniformly simulated RMSDs, such that the simulated cluster shapes,number of points, percentage of expressing genes are the same to the real gene-cluster. Then, thePvalue for each gene in the cluster is
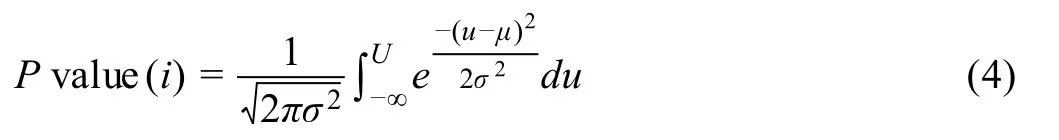
whereUstands for the normalized RMSD.
We uniformly simulated the RMSD with the same cluster shapes,number of points,percentage of expressing genes as follows.1)From the cluster 2Dx-yembedded cell-point,we extracted the boundary points.These boundary points form the polygon representing the cluster shape (https://www.mathworks.com/help/matlab/ref/boundary.html). 2) To uniformly generate a random point inside the polygon, we applied the Monte-Carlo‘randomizing by rejection’method described in[37].Briefly,we uniformly choose a point(x,y)inside the rectangle covering the polygon. Then we used Matlab‘inpolygon’function(https://www.mathworks.com/help/matlab/ref/inpolygon.html) to check and accept if the point is inside the polygon.We repeat this process until the number of accepted points is the same as the number of points in the real cluster. This would create a uniformly simulated cluster with the same shape and number of points to the original cluster.3)We randomly selected the number of points equal to the number of ‘cell expressing genes’.From these, we can compute a simulated RMSD.
Setting up simulations to demonstrate Polar Gini Curve
In this work, to demonstrate how the Polar Gini Curve functions,we set up two simulations.In the first simulation,the cell cluster in thex-yembedding space had 5000 points,which were uniformly generated in the unit circlex2+y2≤1.In the second simulation, the 2D visualization of cell clusters had the shape identical to the real-world cluster obtained from visualizing the mouse fetal lung single-cell data [33] using tSNE [38]. We applied the sampling-byrejection technique [37] to generate these cluster points as follows. In the first simulation, we randomly generated a point whose coordinates are between ?1 and 1 using uniform sampling,then accepted the point if it hadx2+y2≤1.In the second simulation using mouse fetal lung single-cell data [33] (http://bis.zju.edu.cn/MCA), the random point coordinates were within the cluster coordinate range. We extracted the cluster boundary points,compute the polygon from these boundary points, which allowed deciding whether a point was inside the polygon using Matlab (https://www.mathworks.com/help/matlab/ref/inpolygon.html,https://www.mathworks.com/help/matlab/ref/boundary.html)as mentioned above.In each simulation,we randomly chosempercentage of points (m= 5, 10, 15, …, 95) and assumed that they represent the cells expressing the gene.For eachmpercentage,we repeat the simulation 1000 times.In each simulation, we compute the RMSD between the‘foreground’and the‘background’ curves(Equation 3).
Besides, to evaluate how the performance of Polar Gini Curve would change in dropout scenario, we modified the single-cell data simulator previously reported [39] as follows.First,we use the default parameters[39]to synthesize 2 clusters,such that each cluster has 6000 cells,250 markers(total 500 cluster markers),and other 4500 genes.For each cluster marker, the average expression fold change when comparing two clusters was between 4 and 1000. We assigned the dropout probability for each gene from 0, 0.05,0.10, …, to 0.45 such that there were 25 markers for each dropout probability.Then,in each cell,we randomly change the expression of marker genes to 0 according to their dropout probability. For each of the 4500 non-cluster markers,their expression in each cell was randomly between 0 and 500. We assigned the sparsity—defined as the percentage of non-expressing cells (expression)—for each non-cluster marker from 0, 5%, 10%, …, to 95%. In each cell, we randomly changed the expression of non-cluster marker gene to 0 according to its sparsity.We used the area under the curve(AUC)metric to evaluate whether the RMSD score could differentiate the 500 cluster-markers: whether each marker is specific for the first or the second clusters.
Identifying cardiac muscle cell clusters and markers in neonatal mouse heart single-cell dataset
We obtained the neonatal mouse heart single-cell case-study from the Mouse Cell Atlas [33] (http://bis.zju.edu.cn/MCA).We processed the data as specified previously[33].After preprocessing, the dataset covered the expression of 19,494 genes in 5075 cells. We use tSNE [38] (without dimensional reduction) to embed the dataset into the 2D space.We used the density-based clustering algorithm[40]implemented in Matlab(https://www.mathworks.com/help/stats/dbscan.html) to identify 9 cell clusters. In the implementation,we chose the clustering parameters epsilon=4,minpts=40.There were 788,397,2966,156,288,123,76, 125, 87 cell-points in cluster 1, 2, …, 9, correspondingly.There were 69 cell-points for which the algorithm is unable to assign them to any clusters(visit https://figshare.com/articles/dataset/Supplemental_Data_3_Neonatal_Heart_Simulation/11933520 for more details).
We computed the percentage of expressing cells (the na?ve approach) and RMSD score for all genes in all clusters.We removed genes expressing in less than 10%of the cluster cells.For comparison,in the na?ve approach,in each cluster, we selected the top genes sorted by the highest percentage of expressing cells as the cluster markers.In the Polar Gini Curve approach, we selected genes with the smallest RMSD andP<0.05 as the cluster markers.In this work, we focused on identifying the heart muscle cell clusters and their markers. We manually examined the distribution of cells expressing the well-known heart muscle cell markers includingMyh7,Actc1, andTnnt2[41–48].
Setting up the cluster ID re-identification
To compare the robustness of our Polar Gini Curve markers with other approaches, we set up the cluster ID re-identification as follows.From the visual coordinates and 9 clusters of 5075 cells in [33], we randomly divided the dataset into the training set(4060 cells;80%)and the test set(1015 cells;20%), such that the set has samples of all 9 clusters.Using the training set and marker expression found according to the RMSD score,in comparison with other approaches,we applied the neural network algorithm [49] to train models that identify cluster ID.We evaluated these models in the test set and recorded the classification accuracy and AUC.Here,we hypothesized that the‘better’markers would yield higher classification accuracy and AUC.
The other approaches being compared with Polar Gini Curve are listed below.The first is baseline approach.In this approach, we would train the classification models using expression of all genes. The second is the differential expression approach. In this approach, we use Fisher’s exact test [50], which computes the likelihood of a gene being expressed(raw expression>0)in a cluster and compares to the likelihood of the gene being expressed outside the cluster. In this work, we select the differentially expressed gene (DEG) markers in each cluster according to the following criteria: odds ratio > 5 and the percentage of expressing cells(m)>50%.The third one is the SpatialDE[3] approach. SpatialDE finds the gene with high variance regarding the distribution of‘point’on the spatial 2D space.The ‘null’ hypothesis in this approach is that the gene distribution in the ‘spatial space’ follows a multivariate normal distribution. The marker is selected if the gene expression distribution is significantly different from the null distribution,recorded in thePvalue.In this work,we select the SpatialDE marker according to the following criteria:qvalue(adjustedPvalue)<0.05 and percentage of expressing cell(m)>50%.In both the DEG and SpatialDE approaches,we sort the markers according to the decreasing order ofm.To make a fair comparison, we use the same number of markers,ranging from 5 to 100,found by Polar Gini Curve,DEG,and SpatialDE,to train the classification models.
Results
In Polar Gini Curve, the RMSD value is strongly correlated with the percentage of expressing cells in a cluster
InFigure 2, we show that the fitness between the cluster PGC and the subcluster PGC is strongly correlated with the percentage of expressing cells (‘subcluster’;m) in the circle-shaped simulation. Also, asmincreases, the RMSD variance decreases. We represented the fitness by the RMSD as shown in the Method section. As indicated in Figure 2, for eachm(ranging from 5 to 95), we randomly generated 1000 subclusters and their PGCs. The detailed result of this simulation could be found at https://figshare.com/articles/dataset/Supplemental_Data_1_Circle-shaped_Simulation/11933421.
In addition, we observed a similar correlation when experimenting with mouse fetal lung single-cell data [33].Figure 3A shows the dataset clusters visualized using tSNE [38] and the chosen cluster. To synthesize a 3000-point cluster with the same shape to the chosen cluster,we still applied the random-by-rejection [37] as presented in Method section. Figure 3B still shows a strong correlation betweenmand RMSD. The detailed result of this simulation could be found at https://figshare.com/articles/dataset/Supplemental_Data2_Neonatal_Mouse_Lung_Simulation/11933475.
On the other hand,the Polar Gini Curve approach has the potential to answer whether the marker could identify subpopulations of cells in a cluster.Figure 4A demonstrates the 30,000-point cluster with ring shape 0.25 ≤x2+y2≤1;here, this ring is defined as the subcluster. In this case,m=75.In this example,RMSD=0.033(Figure 4B),which is greater than the RMSD distribution computed from the random and uniformly distributed cluster with the samem(Figure 4C). Here, when the cluster is random and uniformly distributed, RMSD is less than 2×10⁻³.
Figure 5shows a decrease of Polar Gini Curve performance in the dropout scenario. Briefly, the synthetic data has 2 clusters, 250 distinct markers for each cluster. Each gene has a specific dropout rate as presented in the Method section.Using the RMSD scores in each cluster to differentiate these 500 cluster-specific markers,we observed a very high AUC (> 0.95) when the dropout probability is small(≤0.05). However, AUC decreases significantly with the increase in dropout probability(Figure 5A).This phenomenon further demonstrates the strong association between RMSD and the percentage of expressing cells. When the dropout rate increases, the percentage of expressing cells decreases; therefore, RMSD may mischaracterize a highdropout marker as non-marker.
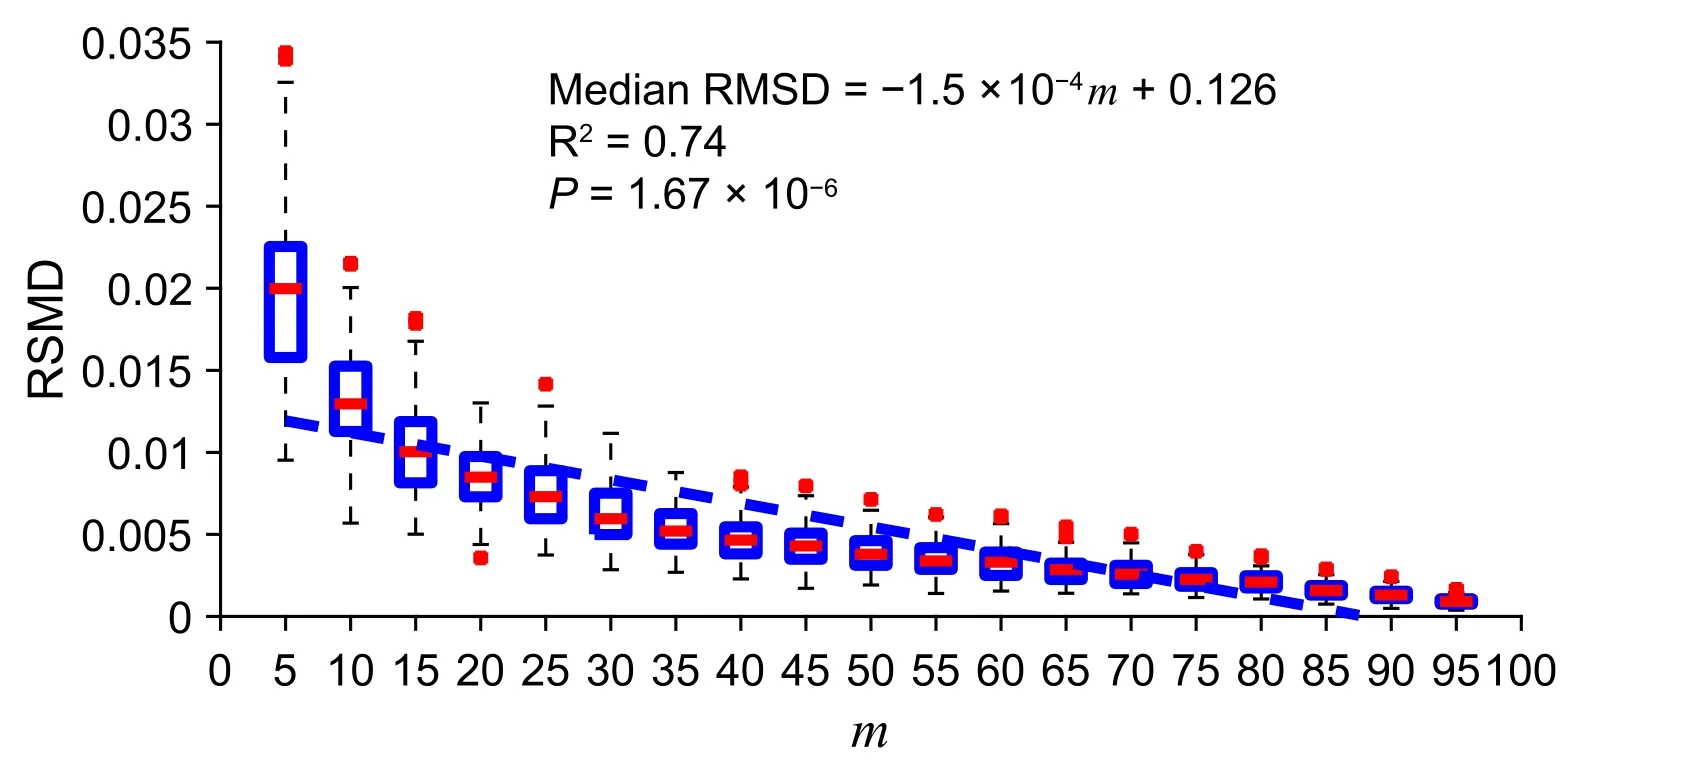
Figure 2 A strong correlation between subcluster percentage and cluster–subcluster PGC fitness in a simulated uniformly-distributed and circular clusterFitness between the cluster PGC and the subcluster PGC is represented by RMSD and m indicates the percentage of expressing cells in a subcluster.In the boxplot,‘+’represents the data point that are beyond the 5%–95%percentile.The simulated data and source code are presented in Supplemental Data 1.
Case-study: Polar Gini Curve identifies heart muscle cell in neonatal mouse heart single-cell dataset
Polar Gini Curve detects markers to support cell-type identification in single-cell mouse neonatal heart dataFigure 6summarizes the neonatal mouse heart single-cell data [33] and its 9-cluster markers. Figure 6A visualizes these 9 clusters with tSNE. In total 258 genes were identified based on RMSD scores by Polar Gini Curve,which is the union of 100 genes with the smallest RMSD(100-PCGRMSD)found in each cluster,marking these clusters(Data S3). Figure 6B and C showed that the gene-cluster marker association reflects the underlying gene expression in the scRNA-seq data. In these heatmaps, each row corresponds to one gene.
We identified the muscle cell clusters 1, 4,and 9 by the expression ofMyh7,Actc1, andTnnt2, which strongly express in muscle cell type[41–48](Figure 7).Compared to the na?ve method using the percentage of expressing cells,our Polar Gini Curve approach is significantly better by detectingActc1, which are missed by the na?ve approach(Figure 8). Furthermore, our approach identifiedMgrn1[51,52],Ifitm3[53],Myl6b[54] marking cluster 1, which could play important roles in cardiac muscle functionality,heart failure, and heart development. These genes are not identified using the na?ve approach, which was based only on the highest percentages of cells expressing the genes(Figure 8). On the other hand, among genes having a high percentage of expressing cells,results obtained using Polar Gini Curve suggest thatNdufa4l2,Mdh2, andAtp5g1may not be heart muscle cell markers. However, they could suggest a subtype of heart muscle cells (Figure 9). The percentage of expressing cells, RMSD, statisticalPvalue,and ranks for all genes could be found at https://figshare.com/articles/dataset/Supplemental_Data_3_Neonatal_Heart_Simulation/11933520.

Figure 3 Demonstration of Polar Gini Curve in mouse fetal lung single-cell dataA. The UMAP plot showing the cluster selected for the experiment reported in [29]. B. Correlation between subcluster percentage and Polar Gini Curve fitness. Fitness between the cluster PGC and the subcluster PGC is represented by RMSD and m indicates the percentage of expressing cells in a subcluster.
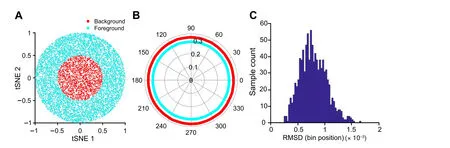
Figure 4 Demonstration of Polar Gini Curve characteristics using the ring-shape simulation studyA. Visualization of the cluster with ring shape, which was generated from a simulated dataset. The ring is defined as the subcluster (m = 75). B. Two separated polar curves generated by applying Polar Gini Curve to the simulated dataset(RMSD=0.033).C.Distribution of RMSD.Data were extracted from Figure 2 with m = 75, with the subcluster uniformly distributed on the cluster area.
Re-identifying the cell cluster ID from markers
We observe that the markers found by the Polar Gini Curve approach achieve better performance than the similar SpatialDE [3] markers and similar performance to the DEG when being used to re-identify cell cluster ID.Briefly,after computing the visual coordinates and cluster IDs of all cells,we randomly split the dataset [33] into the training (80%)and test(20%)sets.We only applied the baseline Polar Gini Curve,SpatialDE,and DEG approaches to find the markers and built machine learning models to predict the cell cluster IDs from the markers in the training set.In this experiment,we used all genes to train the predictor in the baseline approach. A detailed description of this experiment could be found in the Method section. Evaluating the prediction models in the test set, the Polar Gini Curve approach performs close to the DEG; both have cluster ID prediction accuracy > 0.9 and AUC > 0.95 on average (Figure 10).These two approaches significantly outperform SpatialDE,whose accuracy is just above the baseline. The detailed results for this analysis,which belong to Supplemental Data 3, are available at https://figshare.com/account/projects/76749/articles/11933520?file=21907953 and https://figshare.com/account/projects/76749/articles/11933520?file=21907956.
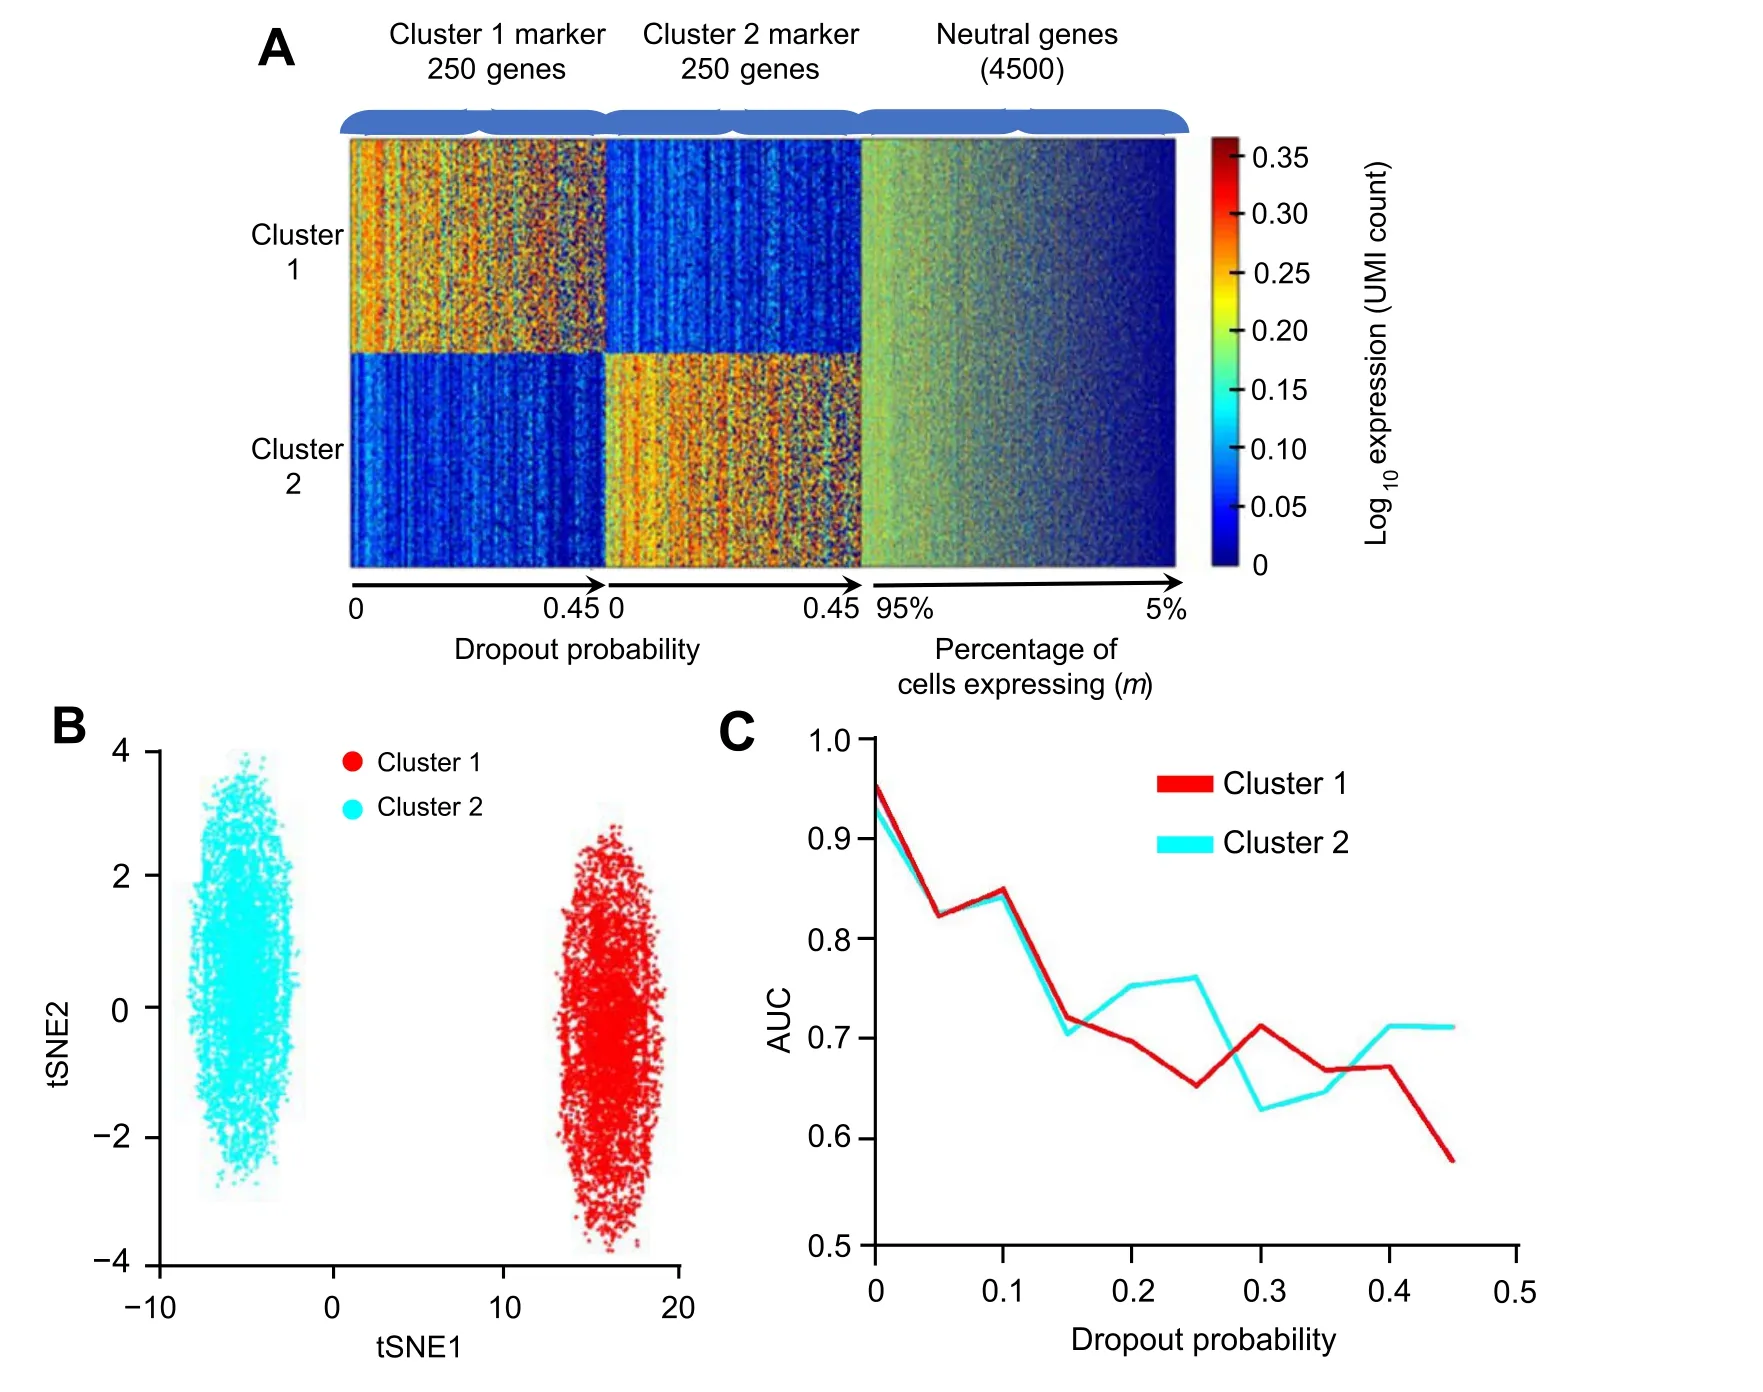
Figure 5 Recalling cluster marker in dropout simulation based on RMSDA.Heatmap showing the simulation design of 500 markers(250 cluster 1 genes and 250 cluster 2 genes)and 4500 neutral genes,with dropout probability ranging 0–0.45 and percentage of cells expressing ranging 5%–95%,respectively.B.2D visualization of the simulation data.C.Correlation between AUC and dropout probability.
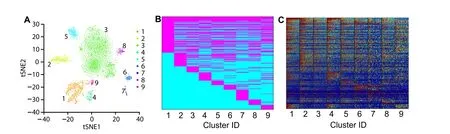
Figure 6 Characterizing cell clusters and identifying cluster cell type by applying Polar Gini Curve to mouse neonatal heart scRNA-seq datasetA. tSNE plot showing 9 cell clusters for a mouse neonatal heart scRNA-seq dataset [29]. B. Gene-cluster relationship for 258 genes identified based on RMSD,representing the union of 100 genes with the smallest RMSD found in each cluster.Genes identified as cluster markers are indicated in magenta and genes as non-markers are indicated in cyan. C. Expression heatmap for the 258 genes as indicated in (B).
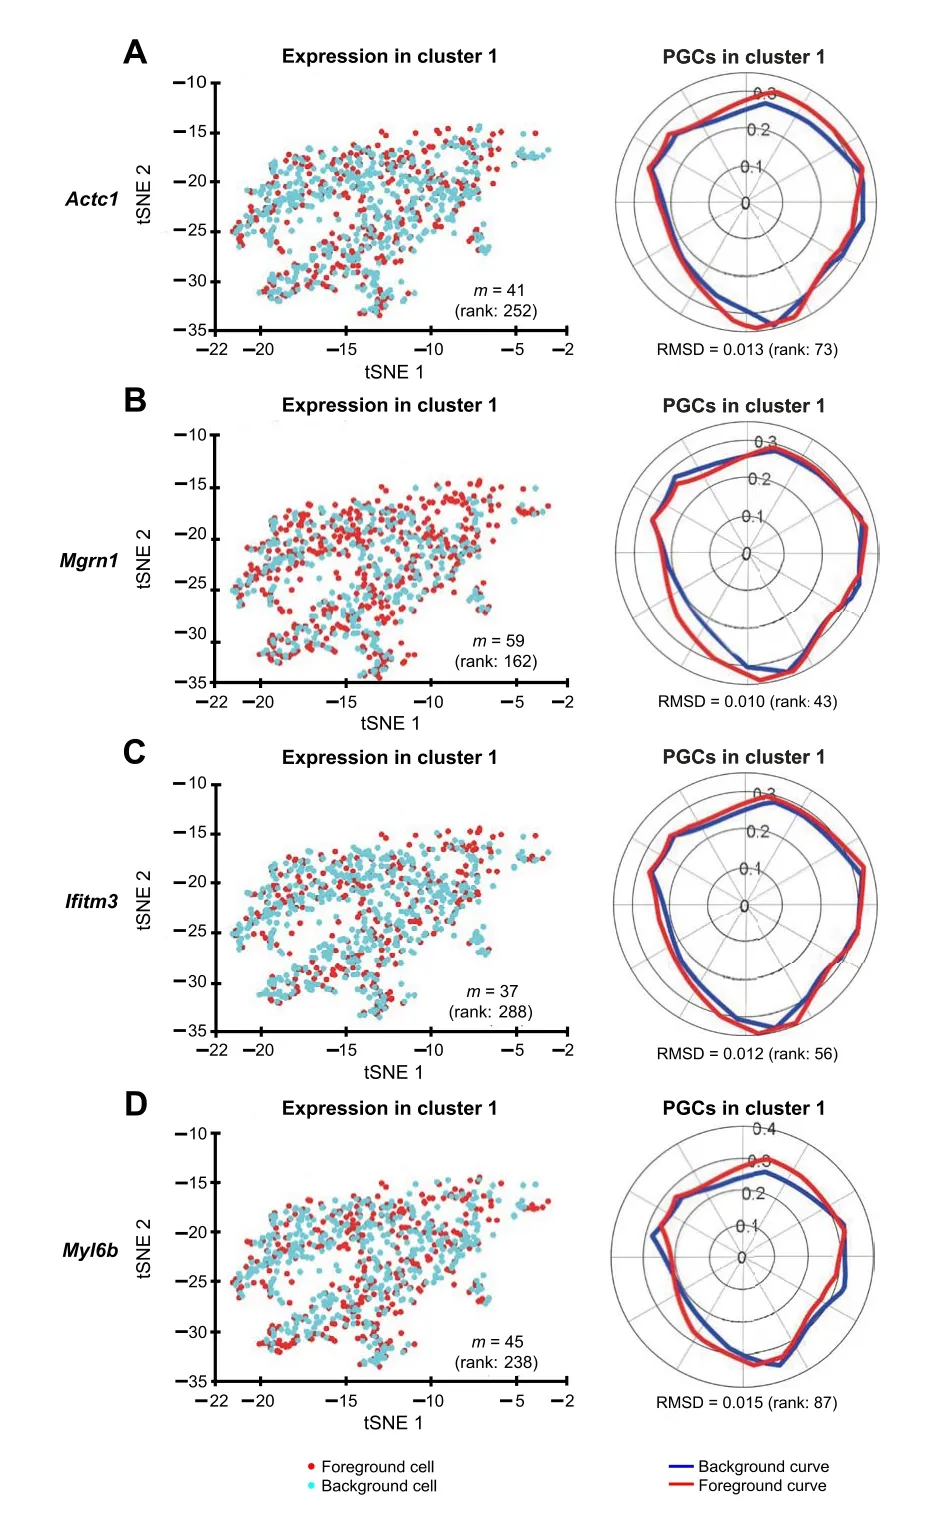
Figure 8 Polar Gini Curve highlights cluster 1 makers that do not have high percentage of expressing cellstSNE plots showing the expression of cluster 1 marker genes Actc1 (A),Mgrn1(B), Ifitm3 (C), and Myl6b (D) are presented on the left and their respective PGCs are presented on the right. Number in the parenthesis indicates the rank of the respective gene in cluster 1. Genes are ranked based on the percentage of expressing cells (from the highest to the lowest,with low rank number indicating high percentage)on the left,and RMSD value (from the lowest to the highest, with low rank number indicating low RMSD value) on the right, respectively.
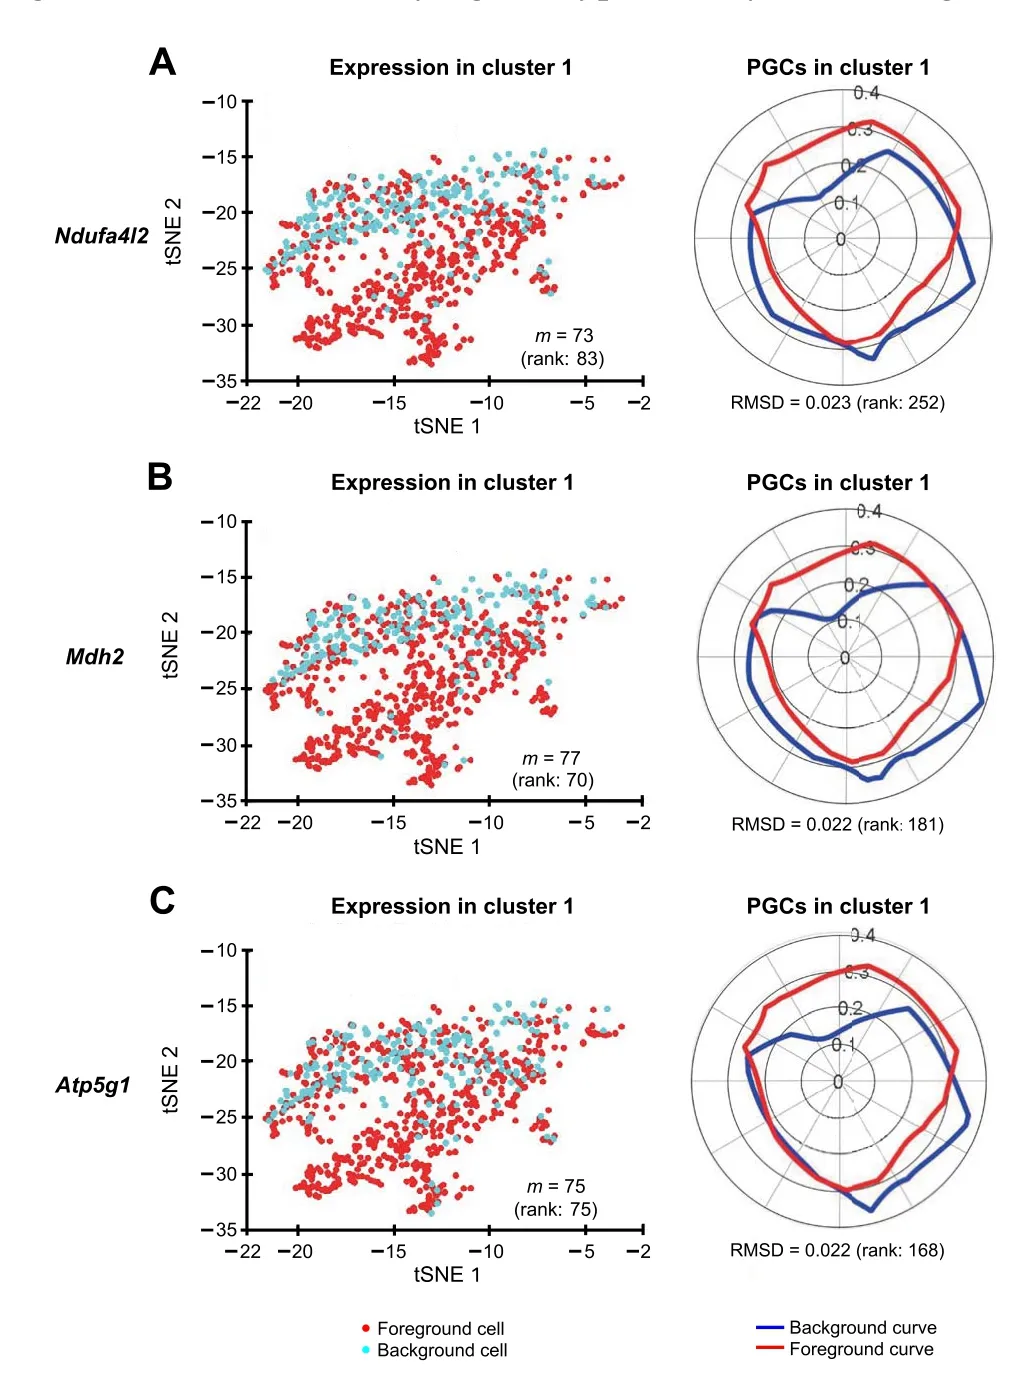
Figure 9 Polar Gini Curve shows that genes having high percentage of expressing cells may not be markers in cluster 1tSNE plots show the expression of genes Ndufa4l2 (A), Mdh2 (B), and Atp5g1(C).Genes appearing to highlight a local subcluster are presented on the left, and their respective PGCs are presented on the right. Number in the parenthesis indicates the rank of the respective gene in cluster 1.Genes are ranked based on the percentage of expressing cells (from the highest to the lowest, with low rank number indicating high percentage)on the left, and RMSD value (from the lowest to the highest, with low rank number indicating low RMSD value) on the right, respectively.
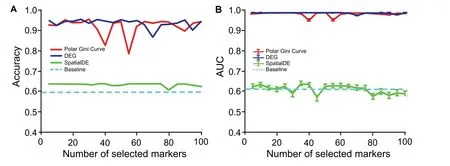
Figure 10 Performance in re-identifying cell cluster ID with Polar Gini Curve, SpatialDE, and DEGA.Accuracy in cell cluster prediction.B.Average AUC of 9 cell clusters predicted.The x-axis shows the number of top-significant markers being selected to train the prediction models. For Polar Gini Curve, markers were ranked from the lowest to the highest RMSD values (low rank number indicates low RMSD value), while for DEG and SpatialDE approaches (baseline), markers were ranked from the lowest to the highest P values (low rank number indicates low P value;P<0.05 indicates statistical significance).Data were obtained from[3].More details are provided in the section for“Setting up the cluster ID re-identification”.
Discussion
In this work, we show that integrating the embedded information, which does not often have a deterministic relationship with gene expression and is primarily for clustering a visualization, could lead to new insights into biomarker discovery in single-cell data. In the mouse neonatal heart case study, our Polar Gini Curve approach could recallActc1as the marker characterizing heart muscle cells.Meanwhile,the approach using the percentage of expressing cells may fail to recall because a large percentage of cells does not captureActc1transcript. Therefore, our proposed technique has the potential to handle analytical issues due to single-cell data quality, such as short read length and low sequencing depth [55–57]. On the other hand,for genes having high percentage of expressing cells,the Polar Gini Curve approach could further show that these genes may characterize novel cardiac muscle cell subtypes for future studies,such asMdh2andMyl6b.Therefore,we suggest that the biomarker discovery problem could be divided into two subproblems: the ‘global markers’ specify cell types, and the ‘local markers’ specify subtypes. We could solve these two subproblems by the appropriate integration of gene expression and visual information.
In this work, we primarily demonstrate how Polar Gini Curve detects markers for a single cluster, which does not need the gene expression information from other clusters in the dataset.The approach could be extended to incorporate the‘global’expression as follows.First,a Polar Gini Curve analysis can be performed with marker cells as the foreground and all cells(regardless of their cluster assignments)as the background.Second,a Polar Gini Curve analysis can be performed for each cluster in the dataset independently and compare among the cluster marker lists.In the neonatal mouse heart case study, this approach shows two types of marker: one expressed globally in all clusters, which are likely heart-tissue specific; the other expressed locally in one or some specific cluster, which are likely cell-type specific.
In addition to our proposed Polar Gini Curve approach,we could apply several alternative strategies to integrate the gene expression and visual information to solve the singlecell biomarker discovery problem.For example,the fractal dimension analysis strategies [58,59], which focus on evaluating the uniformity of cell-point distribution,could be applied to identify markers in which the expressing cells distribute more densely than they are in the overall cluster.Also, we could also customize the statistical texture analysis in image processing, such as homogeneity and integrity [60,61], to analyze the difference between the overall cluster cell-point and cell-expressing gene point as the metric to determine markers. On the other hand,choosing the appropriate visual approaches depends on the nature of the data and the problem.Our experiment with the rei-dentifying cluster ID shows that the well-established SpatialDE [3] does not outperform our approach and the DEG approach. One explanation is that in our scenario, a good marker for identifying cell type usually follows a good‘default’ distribution over the visual space; meanwhile,SpatialDE aims to find markers that are expressed significantly different from a default distribution.
The major limitation of our proposed Polar Gini Curve approach is the long computational time, especially when compared to the DEG approach. This is similar to SpatialDE,which also uses visual information to detect marker genes. The DEG approach may only need to compute one statistical test to determine whether a gene is a marker for all clusters. Meanwhile, to draw the curves, Polar Gini Curve would need to compute hundreds to thousands of Gini coefficients,which depends on the desired curve resolution,to characterize one gene in one cluster. Due to the long computational time, we were not able to create multiple simulations, which is the ideal approach, and run to compute the statistical [36]Pvalue for the RMSD score.Therefore, we decided to reapply the estimation presented to compute thePvalue. This approach is computationally more efficient but may not well reflect the statistical characteristic of the single-cell data. Besides, we have not fully tackled the problem of choosing the right threshold to determine whether a gene is expressed in a cell.Because of the strong association between RMSD score and the percentage of expressing cells, we expect that the result would be significantly different when choosing a different threshold to determine whether a gene is expressed in a cell. In this work, choosing 0 as the threshold still yields good performance because of the high sparsity in the real dataset.
Conclusion
In this work, we have presented Polar Gini Curve, a novel technique to detect marker genes from the single-cell RNA expression data using visual information. In principle, our approach could complement the state-of-the-art approaches:Polar Gini Curve finds marker genes, such that the expressing cells are evenly distributed throughout the cluster space; meanwhile, the state-of-the-art approaches find marker genes assuming a multivariate normal distribution of expression in the visual space. We have demonstrated that Polar Gini Curve performs better in some tasks in single-cell data analysis.
Data availability
All data and source code in this manuscript could be freely accessed at https://figshare.com/projects/Polar_Gini_-Curve/76749. Source code and data for the circle-cluster simulation are downloadable at https://figshare.com/articles/dataset/Supplemental_Data_1_Circle-shaped_Simulation/11933421; source code and data for the mouse singlecell lung dataset are downloadable at https://figshare.com/articles/dataset/Supplemental_Data2_Neonatal_Mouse_-Lung_Simulation/11933475; and source code and data for the mouse single-cell heart dataset are downloadable at https://figshare.com/articles/dataset/Supplemental_Data_3_Neonatal_Heart_Simulation/11933520.
CRediT author statement
Thanh Nguyen:Methodology, Software, Formal analysis,Writing- original draft,Writing -review & editing.Jacob Jeevan:Software, Formal analysis, Writing - review &editing.Nuo Xu:Methodology,Writing-review&editing.Jake Y. Chen:Conceptualization, Supervising, Writing -review & editing. All authors have reviewed/revised and approved the manuscript.
Competing interests
The authors have declared that no competing interests exist.
Acknowledgments
The work is partly supported by the National Institutes of Health,Center for Clinical and Translational Science grant award,USA(Grant No.U54TR002731)to the University of Alabama at Birmingham (UAB) where JYC is a co-investigator, the Network Biology Modeling to Enhance Bioinformatic Characterization of Heart Regeneration grant by University of Maryland where JYC is a co-investigator,a research start-up fund provided by the UAB Informatics Institute to JYC, and the National Cancer Institute grant award,USA(Grant No.U01CA223976),to which JYC is a co-investigator.
ORCID
0000-0002-8440-1594 (Thanh Nguyen)
0000-0003-0910-5610 (Jacob John Jeevan)
0000-0001-8564-5075 (Nuo Xu)
0000-0001-8829-7504 (Jake Y. Chen)
 Genomics,Proteomics & Bioinformatics2021年3期
- Genomics,Proteomics & Bioinformatics的其它文章
- Genomics, Proteomics & Bioinformatics
- Call for Papers Special Issue on “Artificial Intelligence in Omics”
- Call for Papers Special Issue on “RNA Modifications and Epitranscriptomics”
- Advanced Single-cell Omics Technologies and Informatics Tools for Genomics, Proteomics, and Bioinformatics Analysis
- A Single-cell Transcriptome Atlas of Cashmere Goat Hair Follicle Morphogenesis
- Integration of Droplet Microfluidic Tools for Single-cell Functional Metagenomics: An Engineering Head Start