
Changes in leaflet shape and seeds per pod modify crop growth parameters,canopy light environment,and yield components in soybean
2020-04-21 13:47:00JulietaBianchiAlvaroQuijanoCarlosGospariniEligioMorandi
The Crop Journal 2020年2期
Julieta S. Bianchi, Alvaro Quijano, Carlos O.Gosparini, Eligio N.Morandi,*
aLaboratorio de Fisiología Vegetal,Facultad de Ciencias Agrarias,Universidad Nacional de Rosario(UNR),Campo Experimental J.Villarino,P.O.Box 14,2125 Zavalla,Santa Fe,Argentina
bInstituto de Investigaciones en Ciencias Agrarias de Rosario(IICAR),Consejo Nacional de Investigaciones Científicas y Técnicas(CONICET)–UNR,Campo Experimental J.Villarino,P.O.Box 14,2125 Zavalla,Santa Fe,Argentina
cConsejo de Investigaciones de la UNR(CIUNR),Campo Experimental J.Villarino,P.O. Box 14,2125 Zavalla,Santa Fe,Argentina
A B S T R A C T
1. Introduction
Seed number(SN)is the component most strongly associated with yield in soybean [1-4]. SN depends on pod number (PN)and seeds per pod (SPP). PN is the result of the balance between pods initiated (PI) and pods abscised and is strongly influenced by environmental and management factors. In contrast,SPP is a highly heritable trait only slightly influenced by environment [5-8]. The early reproductive period, from flowering to beginning seed filling (R1 to R5, respectively [9]),is considered critical for PN definition because reproductive structures are established during this period [7,8]. However,other components that begin to develop during the vegetative period, such as the number of nodes, are important in PN determination, given that reproductive structures develop on axillary buds located on the main stem and branch nodes[10].
Photoperiod [11-13], water stress [14], temperature [15],nitrogen availability [16] and solar radiation [17,18] are environmental factors that affect PN. Crop growth rate (CGR)has commonly been used as an estimator of canopy net photosynthesis in soybean [19,20], and several studies[4,7,17,20] have shown linear associations between CGR from R1 to R5(CGRR1-R5)and PN.This association held when CGRR1-R5was severely reduced by defoliation or shading, but for CGRR1-R5higher than 14-15 g m-2day-1no differences in PN or SN and yield were found [21,22], suggesting that other factor/s participate in the regulation of PN when CGR is not limiting.
CGR is a function of the fraction of intercepted photosynthetically active radiation(IPAR)and leaf area index(LAI)[23],both parameters determined by canopy architecture. Canopy architecture may be altered by management practices such as planting density, sowing date, and space between rows as well as by plant morphological traits such as leaflet shape and leaflet number[24,25].In particular,leaflet shape in cultivated soybean can be classified into two main categories: ovate (O)and lanceolate (L). L canopies reduced LAI by about 30%compared to O canopies[24,26,27].Despite differences in LAI,IPAR was similar for both leaflet shapes during the vegetative and early reproductive periods [24,25]. Given that L canopies showed similar IPAR with lower LAI than O canopies,it seems evident that the former must have higher IPAR efficiency(IPARE) than the later. However, IPARE and its possible contribution to net assimilation rate (NAR)and CGR have not been measured in soybean canopies with different leaflet shapes.
Canopy architecture can also change the balance of photomorphogenic light wavelengths perceived by plants.Light quality signals are perceived by specific plant photoreceptors including phytochromes, cryptochromes,phototropins, and the UV-B photoreceptor UVR8, and play a central role in controlling the physiology and development of weeds and crop plants [28,29]. Internode elongation [28,30],branching [30,31], flowers, and pod abscission [32,33], are among the developmental processes controlled by photomorphogenic light wavelengths. Heindl and Brun [32]and Myers et al. [33] reported that whereas supplemental red(R) and white light reduced abscission and increased seed weight per node, shading flowers and pods produced the opposite effect. These authors also observed that shading flowers and pods reduced their capacity to accumulate14Cphotoassimilates, concluding that both photoassimilate accumulation and the abscission of reproductive structures are photomorphogenic responses. Quijano and Morandi [8] reported that even though leaflet removal at flowering strongly reduced LAI and IPAR,PI was increased.Moreover,PI was not associated with CGRR1-R5. These authors suggested that photomorphogenic factors are involved in the regulation of PI.Considering that the architecture of L canopies differs from its O counterpart, the balance of photomorphogenic light wavelengths inside both canopies must also be different.However, the effect of leaflet shape on the balance between photomorphogenic light wavelengths and its possible effect on pod initiation and yield in soybean canopies have not been studied.
L plants tend to have more SPP than O plants [34-36].Despite the differences in leaflet area and SPP, no significant differences in seed yield have been found between the two leaflet shapes in previous studies [24,25,35,37,38]. Some authors suggested that the lack of yield differences between L and O isolines could be associated with yield component compensation, particularly between SPP and PN [27] or seed size(SZ)[35,38].However,a recent study using various pairs of isolines showed that different combinations of PN, SPP, and SZ resulted in different seed yields per plant, suggesting that levels of compensation among yield components may be affected by the genetic background[36].Also,previous studies comparing the yields of L and O isolines were performed using old, low-yielding cultivars, with small or null proportion of four-seeded pods[35,37].We used high-yield potential L and O soybean near-isogenic lines with respectively high and low proportions of four-seeded pods to assess i) the effect of leaflet shape and plant density on crop growth parameters,canopy R/FR ratio,and their relationships with pod initiation,PN, SN, and yield, and ii) the effect on SPP of increasing the proportion of four-seeded pods and its relationship with PN,SN,and yield.
2. Materials and methods
2.1. Plant material and experimental design
Two pairs of near-isogenic lines differing in leaflet shape were developed using the repetitive heterozygote selection method[35,39]. Briefly, F2populations were obtained from crosses between L experimental lines (female parent) and O experimental lines (male parents). Given that L and O are respectively recessive and dominant traits,leaflet shape was used as the selection criterion. In each generation, starting from the F2,L plants were discarded and 12-15 O plants(which could be either homozygous or heterozygous for leaflet shape) were sown in progeny rows and advanced to the next generation.In each generation,O plants were repeatedly selected from rows segregating for leaflet shape until the F6generation,when one L and one O plant were selected from the same row to form each pair.These plants were advanced to the F8generation to check homozygosity and increase seed number.Thus, each L and O pair was established in the F8generation from a single heterozygous F6plant.Each pair obtained in this manner was expected to have ~97% of genes in common and thus be nearly isogenic.
Besides differences in leaflet shape, L and O lines also differed in the proportion of four-seeded pods. Whereas L lines set 60%four-seeded and 40%three-seeded pods,O lines set 7% four-seeded, 90% three-seeded, and 3% two-seeded pods. Thus, the potential SPP (SPPP) of L and O lines was calculated as a weighted mean of pods with different numbers of seeds:
SPPP= [(l oc2×2)+ (l oc3×3)+ (l oc4×4)]/total pod number per plant(1)
where loc2, loc3, and loc4 are numbers of pods with respectively two,three,and four loculi.
A locule was counted if a remnant of seed structure was visible in a partially or fully developed pod locule. Thus,applying Eq. (1), SPPPwas respectively 3.6 and 3.0 for L and O lines. All lines showed indeterminate growth habit and belonged to relative maturity group 5.9 [40]. Near-isogenic lines pairs were FV9-L/FV9-O and FV15-L/FV15-O (Table 1).FV9-L and FV15-L lines had the L leaflet shape and FV9-O and FV15-O lines had the O leaflet shape.
Field trials were conducted during the 2013/2014 and 2014/2015 growing seasons (GS), henceforth GS 1 and GS 2,respectively. Field experiments were performed at the Facultad de Ciencias Agrarias, Universidad Nacional de Rosario, located in Zavalla, Santa Fe, Argentina (33°01′ S,60°52′ W). Soil type was a silty clay loam Vertic Argiudoll,Roldán series. Seasonal dynamics of incident radiation (Fig.S1) and daily mean temperature (Fig. S2) for each growing season can be found in the supplementary data.
The experimental design was a randomized complete block with three replications in each year. Individual plots were 5.50 m long and 2.08 m wide, with 0.52 m row spacing.Plots were overseeded and hand-thinned at phenological stage V2 (according to Fehr and Caviness [9]) to a final plant density of 16 and 30 plants m-2in GS 1 and 14 and 28 plants m-2in GS 2, for respectively low (LD) and high (HD) density.Emergence dates were December 28 in GS 1 and December 24 in GS 2. Plots were drip irrigated when necessary to prevent water deficit. Insects, diseases and weeds were chemically controlled following local agronomic practices during both GS.Soybean was the preceding crop in both years.
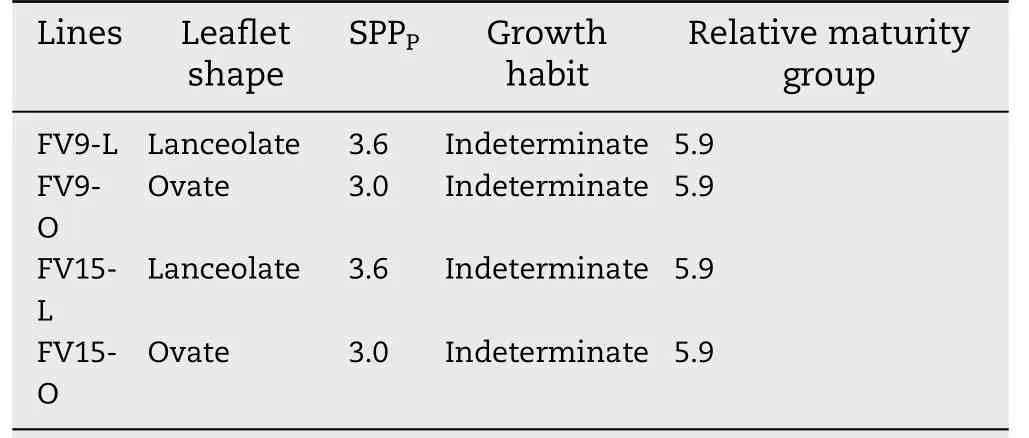
Table 1-Characteristics of the two pairs of soybean nearisogenic lines.
2.2. Plant measurements
Phenological stages were recorded every two days in the two central rows of each plot according to Fehr and Caviness [9].Stages V5,R2,R5,R6,and R8 occurred at respectively 26,47,73,97, and 124 days after emergence (DAE) in GS 1; and V7, V13,R2, R5, R6, and R8 occurred at respectively 28, 42, 49, 76, 103,and 124 DAE in GS 2.
Destructive samples of 0.5 m2were taken from the two central rows at V5,R2,R5,and R6 in GS 1 and at V7,V13,R2,R5,and R6 in GS 2. In all cases a 0.25 m separation was maintained between sample areas and from the plot edge.All plants were separated into stems, branches, petioles,leaflets, pod wall, and seeds (when present). At R5, the numbers of branches, main stem and branch nodes, main stem and branch reproductive nodes,and PI in the main stem and in the branches were recorded. A pod was counted as initiated when it was visible (≥2 mm). The number of pods was recorded in all sampled plants.At maturity,1 m2of each plot was harvested by cutting the plants at ground level.Harvested plants were separated into main stems, branches,seeds, and pod walls. All samples were dried at 65 °C in a forced-air dryer for at least 72 h and weighed.Dry matter was expressed as g m-2(land basis). Branch number, main stem and branch nodes,and PN were also recorded.SZ(mg seed-1)was calculated as the mean dry weight of 480 randomly sampled seeds and mature SN (seeds m-2) was estimated as seed yield (g m-2) divided by SZ. PN (pods m-2) was obtained by counting all pods present at maturity in the samples evaluated.Percentage of pod abscission was calculated as PN/PI×100.SPPPwas calculated using Eq.(1).Developed SPP was estimated as SN/PN. Percentage of seed abortion was calculated as (SPP/SPPP)×100.
Photosynthetically active radiation(PAR, 400-700 nm)was measured above and below the canopy with a line quantum sensor connected to a LI-1000 data logger(LI-COR,Lincoln,NE,USA). For the below-canopy measurements, the sensor was placed on the ground between plot rows,oriented diagonally.PAR measurements were taken on clear days between 11:30 AM and 2:00 PM. In each plot, two readings were taken at randomly selected positions at 26,39,47,54,62,and 69 DAE in GS 1,and at 28,32,39,48,56,and 64 DAE in GS 2.Percentage of PAR intercepted(IPAR, %) was calculated in each plot from readings made above and below the canopy. Leaf area was measured with a LI-3100 leaf area meter (LI-COR) to estimate leaf area index(LAI).IPAR efficiency(IPARE,%)was calculated as IPAR/LAI. CGR [g m-2day-1] and NAR [g m-2leafday-1]between V5 and R2 and between V7 and R2 in GS 1 and GS 2,respectively, and between R2 and R5 for both GS, were determined by stepwise regression[41].
Fluxes of red (R, 650-670 nm) and far red (FR, 720-740 nm)radiation were measured during GS 2 with an equipment developed in our laboratory in collaboration with Consultar SRL,Rosario, SF, Argentina. This equipment had photodiodes(Hamamatsu Photonics K.K.,Hamamatsu City,Japan)covered with specific acetate filters (LEE Filters, Andover, UK) to restrict the sensitivity peak to the desired wavelength. The G1115 photodiode covered with one LEE 106 (primary red)filter was used to measure the R wavelength and the G1735 photodiode cover with one LEE 118 (light blue) plus one LEE 021 (gold amber) filter was used to measure FR. Photodiodes were attached to 2-cm diameter disks and covered with a white acrylic glass hemisphere as a cosine corrector (sensor unit).The sensor units were remotely connected to a recorder(SAD 9000 PLT, Consultar SRL) that received the signals and accumulated the output values. The sensors were calibrated against a LI-1800 spectroradiometer (LI-COR) and measurements were made in the canopies of the FV15-L and FV15-O lines.Four sensors were used for each line:two in LD and two in HD.Sensors were located between two adjacent plants in a row and in the middle of the inter-row space.Daily R/FR ratio was the mean of within-row and between-row measurements made from 10:00 AM to 5:00 PM at 30 min interval,during the V7-R5 period.As plants grew, sensors were moved to remain at the midpoint of plant height (i.e., at the canopy middle stratum)following Board[31].
2.3. Data analysis
Total dry matter was transformed to its natural logarithm and regressed on time to obtain CGR and NAR. Linear, quadratic,and cubic components of each regression equation were successively tested for significance and included in the equation if they significantly reduced the residual sum of squares. Three sample dates were used in all treatments and CGR and NAR were obtained for each period as the mean of fitted values over samples. Significant differences were determined by t-tests using standard errors calculated by the regression program[41].
The evolution of the R/FR ratio at canopy middle stratum,R/FRM, was fitted to a function using the TBL Curve V 2.0 program [42]. The comparisons of the values at V7, R2, and R5 were made by Student's t-test [43] using the adjusted value of the function and its standard errors.For FV9-L and FV9-O lines, the R/FR ratio was estimated in the same experiment using a regression of the R/FR as a function of LAI obtained for the FV15-L/FV15-O near-isogenic line pair.The coefficient of determination (R2) for this function was 99%.
Analysis of variance(ANOVA)with separation of means by LSD was used to analyze the data. Before the ANOVA was performed, the normal distribution of residuals and homogeneity of variance were verified.The linear ANOVA model used was as follows:

where Y is the response variable, μ is the general mean, ρithe effect of block i, αjthe effect of growing season j, βkthe effect of plant density k,γlthe effect of leaflet shape l,τm(l)the effect of line m nested in leaflet shape l, (αβ)jkthe interaction between growing season j and plant density k, (αγ)jlthe interaction between growing season j and leaflet shape l,(βγ)klthe interaction between plant density k and leaflet shape l(αβγ)jklthe interaction among growing season j, plant density k, and leaflet shape l,(ατ)jm(l)the interaction between growing season j and line m nested in leaflet shape l, (βτ)km(l)the interaction between plan density k and line m nested in leaflet shape l, (αβτ)jkm(l)the interaction among growing season j,plant density k, and line m nested in leaflet shape l, and εijklmthe residual effect ε~N(0; σ2).
The effects of block, growing season, plant density, leaflet shape, line nested in leaflet shape, and their interactions were treated as fixed effects [44,45]. The relationships between variables were analyzed by linear and nonlinear regression.All statistical analyses (ANOVA, regression, t-tests, and LSD tests) were performed using SAS University Edition (SAS Institute Inc., Cary, NC, USA).
3. Results
3.1. Effects of L and O canopies on crop growth parameters
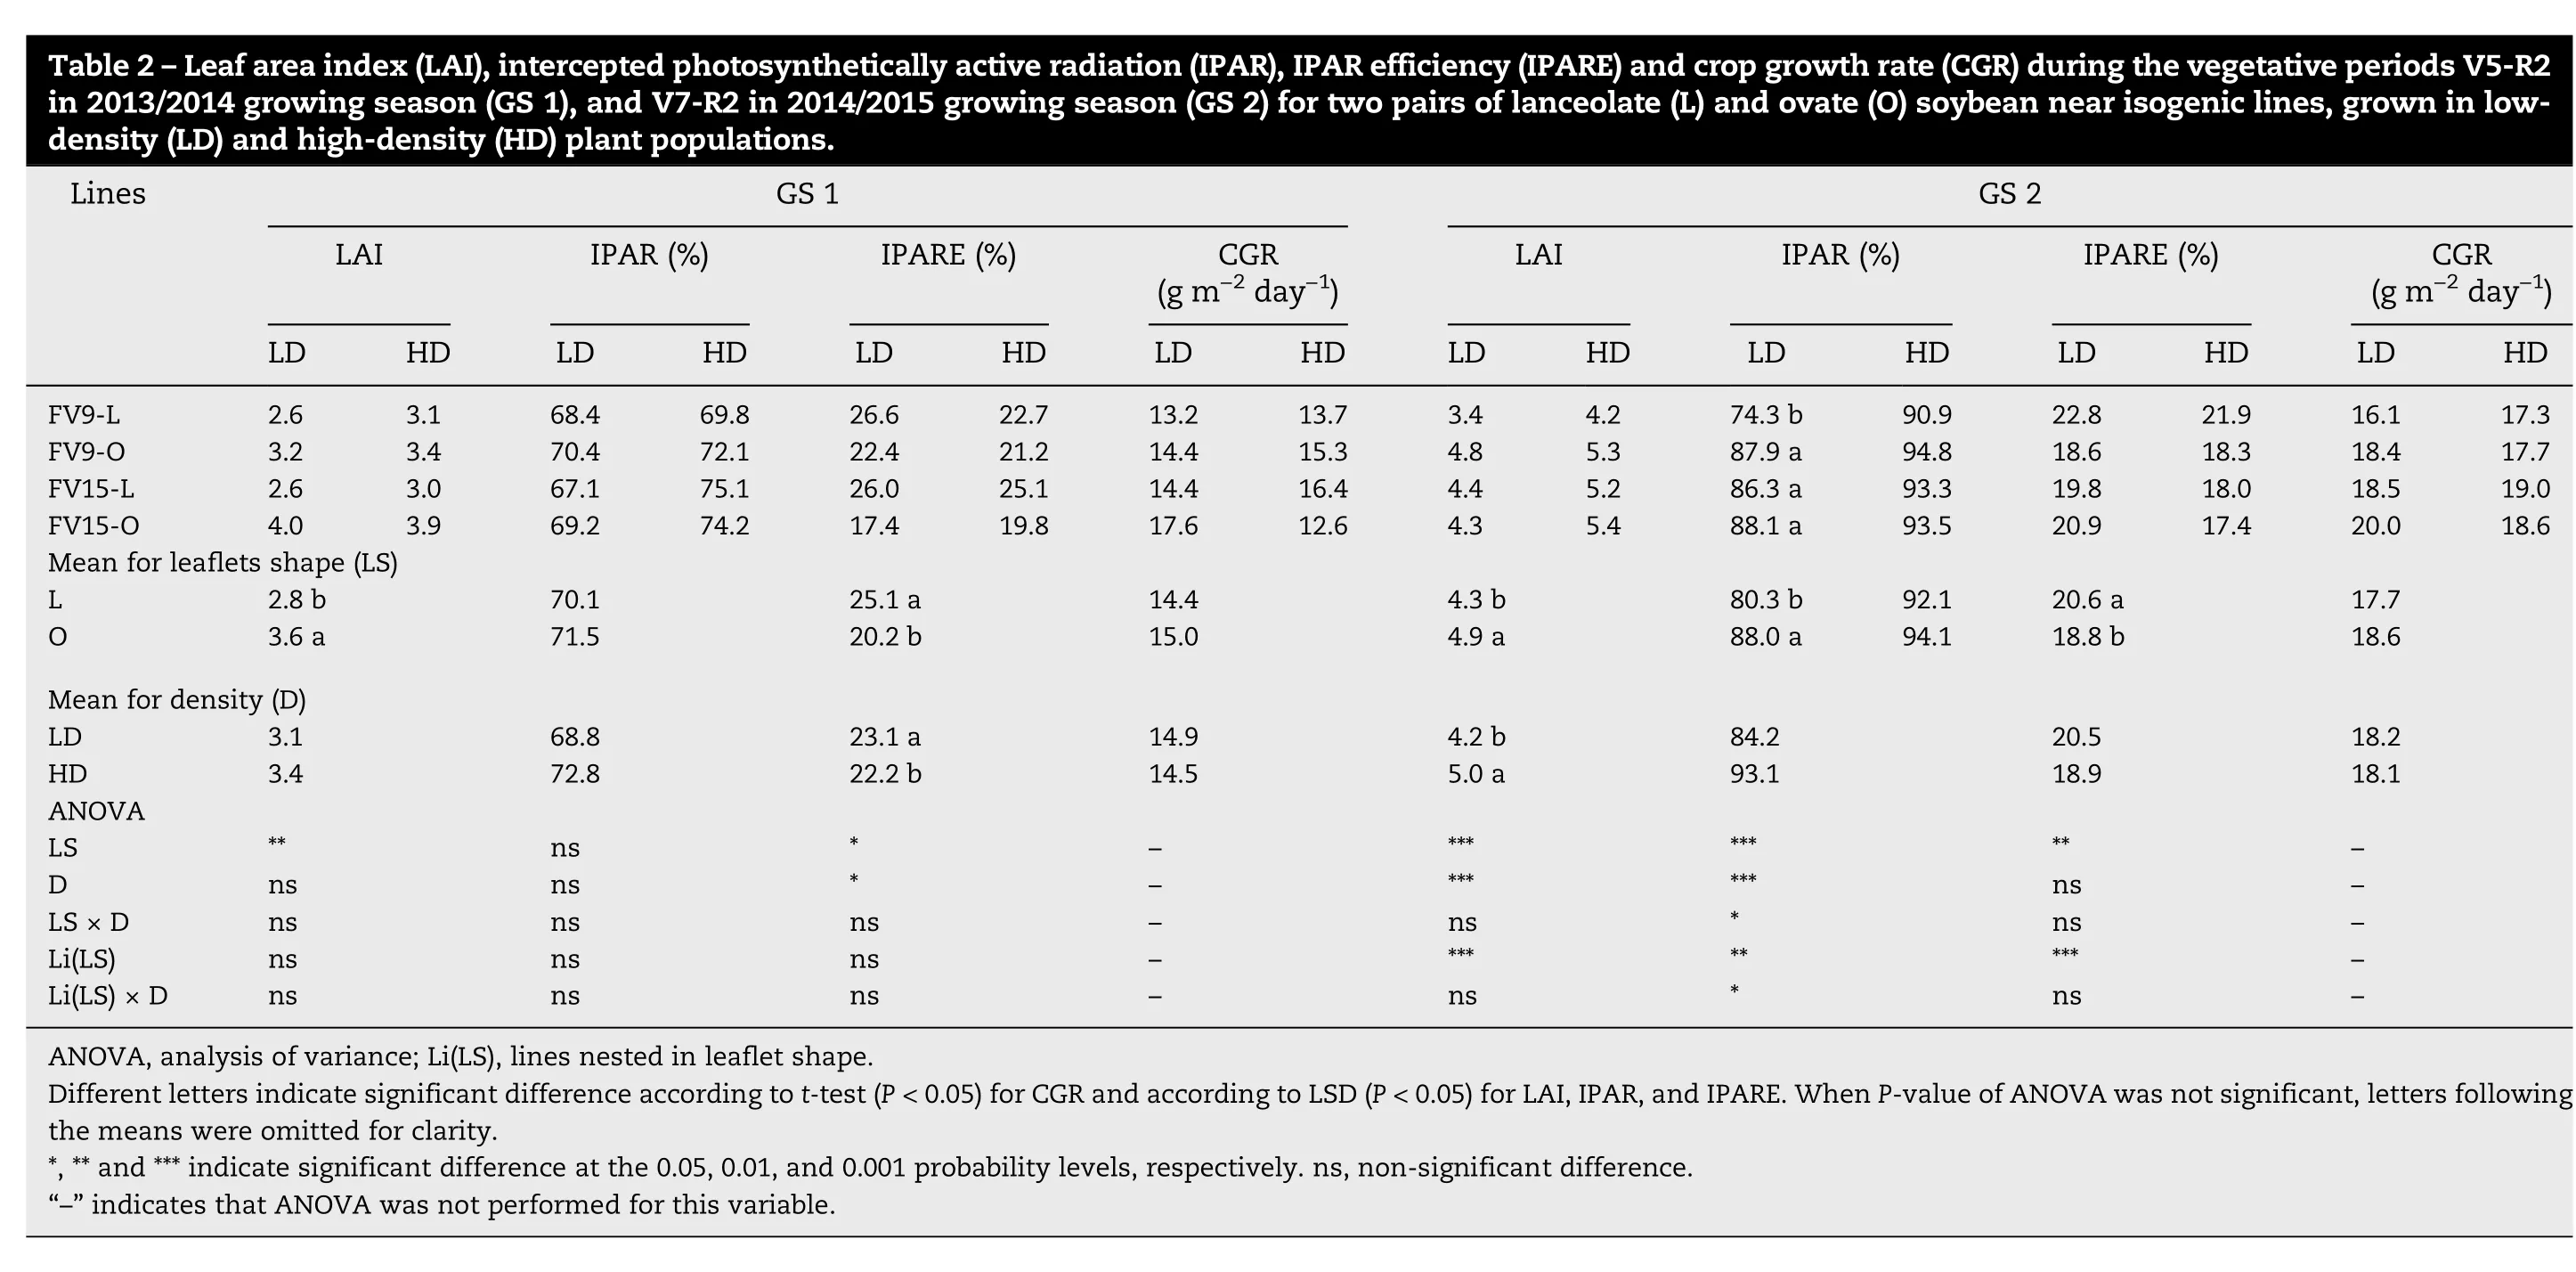
Crop growth parameters for the vegetative and early reproductive periods are presented for GS because of significant interactions between this variable and other sources of variation (Table S1, Table S2). During the vegetative period(V5/V7-R2)LAI was greater in O than in L canopies in both GS.However, except for the FV9-L line at LD in GS 2, IPAR was equal in L and O canopies and IPARE was always higher in L than in O canopies(Table 2).Also,L canopies showed higher NAR than O canopies for both GS (7.0 and 6.0 g m-2leafday-1for respectively L and O in GS 1;3.5 and 3.3 g m-2leafday-1for L and O in GS 2),with the difference significant in GS 1(P <0.05).Consequently, despite the differences in LAI, L and O canopies showed similar CGR during the vegetative period(Table 2).
During the early reproductive period(R2-R5),LAI and IPAR were above their critical threshold (5 and 95% for LAI and IPAR, respectively) for all treatments. The LAI and IPAR,however, were lower for L than for O canopies in GS 1,whereas differences between L and O canopies occurred only for IPAR in GS 2 (Table 3). The IPARE was lower during this period than during the vegetative period (compare Table 2 with Table 3), being significantly higher in L than in O canopies only in GS 1 (Table 3). The CGRR2-R5was greater in O than in L canopies in GS 1 but not in GS 2 (Table 3). No differences were observed in NAR during the R2-R5 period for leaflet shape in either GS.
3.2. Evolution of the R/FRM ratio in L and O canopies
The R/FRMratio was always higher in L than in O canopies,with the greatest differences observed at LD during the vegetative period. As the canopy developed, R/FRMdeclined exponentially for both leaflet shapes and plant densities (Fig.1). Thus, differences between L and O canopies for the R/FRMratio were observed from V7 to R5 in LD(Fig.1-A)and from V7 to R2 in HD(Fig.1-B).
?

hen P-value of ANOVA was not significant,letters following Table 3-Leaf area index(LAI),intercepted photosynthetically active radiation(IPAR),IPAR efficiency(IPARE)and crop growth rate(CGR)during the early reproductive period(R2-R5) for two pairs of lanceolate (L) and ovate (O) soybean near-isogenic lines, grown in low-density (LD) and high-density (HD) plant populations in 2013/2014 growing CGR(g m-2 day-1)HD 26.3 25.8 28.4 28.3 LD 17.6 18.6 19.8 21.0 23.1 23.4 19.3 b 27.2 a-----IPARE(%)HD 14.0 13.5 12.7 12.6 GS 2 LD 15.0 13.1 13.9 14.8 13.9 13.5 14.2 a 13.2 b ns*ns ns ns IPAR (%)HD 99.0 99.5 99.2 99.3 LD 97.2 99.3 98.7 99.3 98.5 b 99.3 a 98.6 b 99.2 a***ns ns ns HD 7.1 7.4 7.9 7.9 LAI LD 6.5 7.6 7.2 6.7 7.2 7.4 7.0 b 7.6 a ns*ns ns ns(P <0.05)for LAI,IPAR,and IPARE.W-2 day-1)HD 16.7 22.8 23.4 27.4 CGR(g m LD 19.5 23.5 22.2 25.7 20.5 b 24.8 a 22.6 22.7-----IPARE (%)HD 17.3 14.1 15.9 13.9 season(GS 1), and in 2014/2015 growing seasons(GS 2).LD GS 1 18.8 14.8 17.1 13.1 17.3 a 14.0 b 16.0 15.3**ns ns ns ns IPAR (%)HD 97.2 98.6 97.5 98.8 LD 97.1 98.3 97.4 98.2 97.3 b 98.5 a 97.7 98.0**ns ns ns ns ed for this variable.HD 5.7 7.0 6.4 7.2 LAI LD 5.2 6.7 5.8 7.5 5.8 b 7.1 a 6.3 6.6**ns ns ns ns Lines FV9-L FV9-O FV15-L FV15-O Mean for leaflet shape (LS)eans were omitted for clarity.LO Mean for density (D)LD HD ANOVA LS D LS × D Li(LS)Li(LS) × D ANOVA, analysis of variance; Li(LS), lines nested in leaflet shape.Different letters indicate significant differences according to t-test(P <0.05)for CGR and according to LSD the m*and ** indicate significant differences at the 0.05 and 0.01 probability levels, respectively.ns, non-significant difference.“-” indicate that ANOVA was not perform
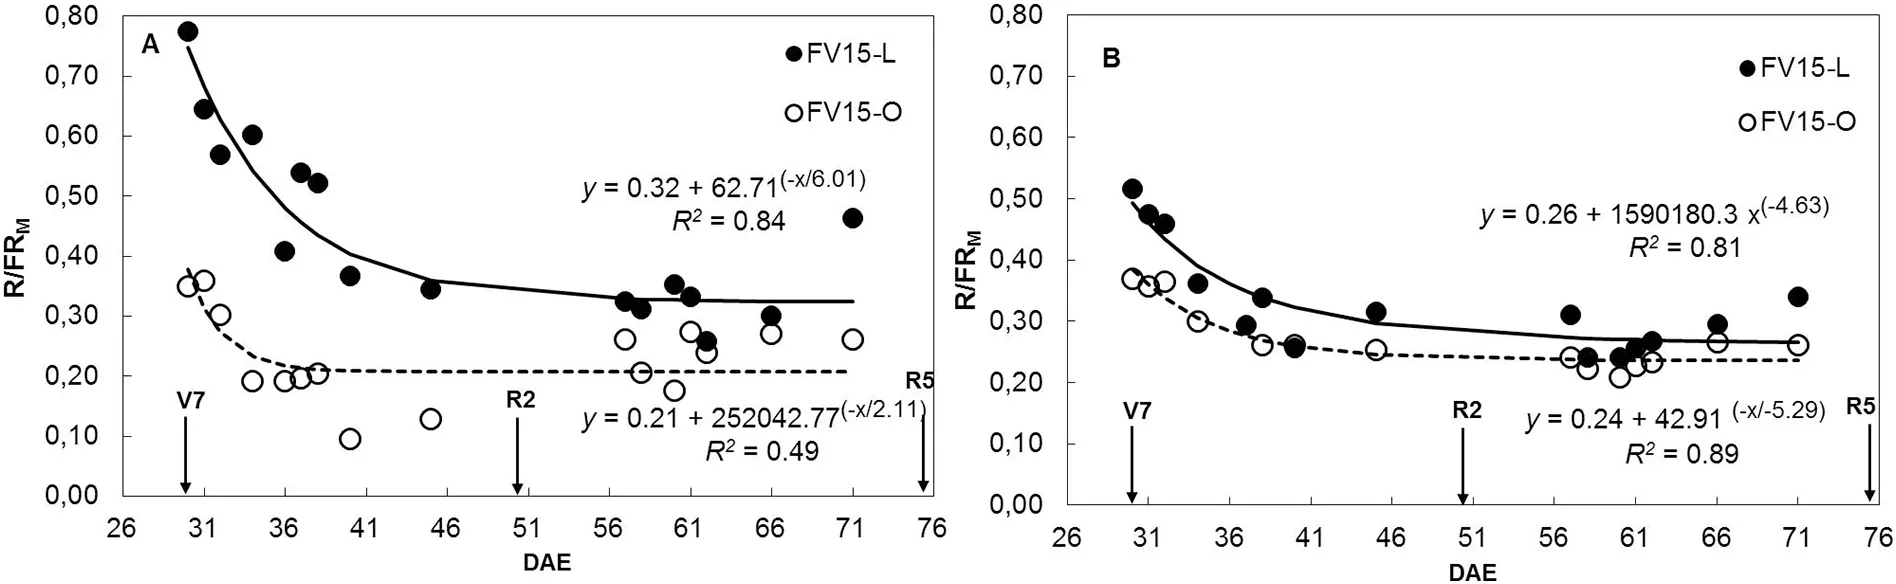
Fig.1-Evolution of the canopy middle stratum red/far-red ratio(R/FRM)as a function of days after emergence(DAE)for soybean near-isogenic lines FV15-L(filled circles)and FV15-O(open circles)grown at low(A)and high(B)density in 2014/2015 growing season(GS 2).Data points are daily means of R/FRM values of sensors located between two adjacent plants in a row and in the middle of the inter-row space.Measurements were taken from 10:00 AM to 5:00 PM,at 30 min intervals.Arrows indicate phenological stages V7(seven-leaf stage),R2(full bloom)and R5(beginning seed).Continuous and dashed lines represent the fitted regression equations for data points of lines FV15-L and FV15-O,respectively. Parameters of the fitted regressions and coefficients of determination (R2)are also shown.
3.3. Effects of L and O canopies on PI
PI, RN, and PI/RN are presented for GS because of significant interactions between GS and other sources of variation(Table S3).PI was higher in L than in O canopies in both GS(Table 4).Variations in PI were the result of changes in RN and PI/RN.RN was higher in L than in O canopies for both GS, with the difference significant in GS 2 (Table 4). PI/RN was also higher in L than in O canopies,except for HD in GS 1(Table 4).
The variation in total PI (main stem and branches) was associated with PI on branches in all treatments and GS (Fig.2). As there was no difference in the number of branches between leaflet shape(P >0.10 for both GS),variation in PI was associated with changes in number of reproductive nodes perbranch (R2= 0.77, P <0.001) and with pods per reproductive branch node (R2= 0.73, P <0.001). Because branch development started before flowering and reproductive structures develop on axillary buds located on the main stem and branch nodes, the relationships of PI with LAI, IPAR, and R/FRMratio from V5 to R5(GS 1)and from V7 to R5(GS 2)were analyzed.PI decreased with increase in LAI for L and O canopies in both GS(Fig. 3). Similarly to LAI, an inverse relationship was also observed for PI and IPAR (R2= 0.44, P <0.10 and R2= 0.47,P <0.10,for GS 1 and GS 2,respectively).In contrast,PI showed a linear and positive association with R/FRMratio for both leaflet shapes and plant densities in GS 2 (Fig.4).
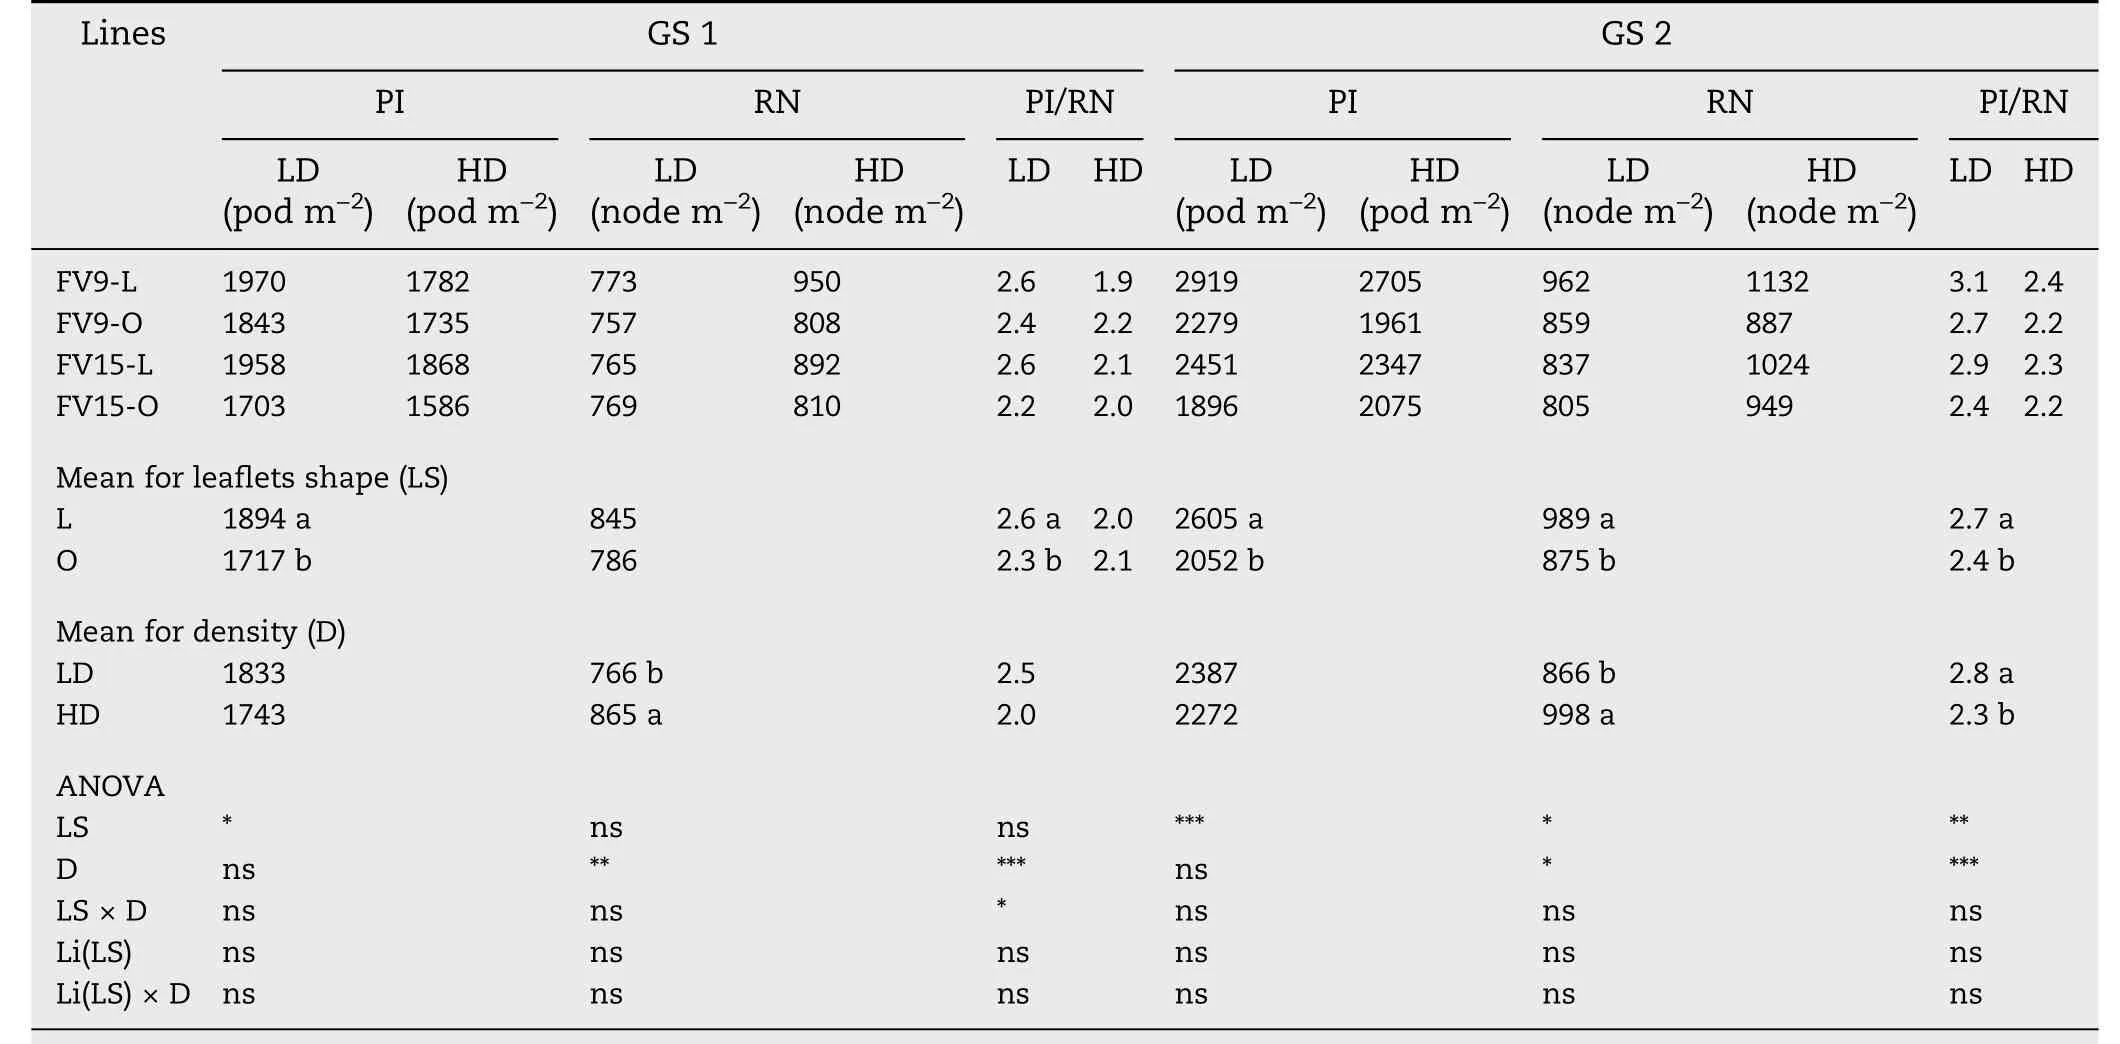
Table 4-Numbers of pods initiated (PI), reproductive nodes (RN) and pods initiated per reproductive node (PI/RN) at R5 stage,for two pairs of lanceolate(L)and ovate(O)soybean near-isogenic lines,grown in low-density(LD)and high-density(HD) plant populations in 2013/2014 growing season(G1), and in 2014/2015 growing season(GS 2).
3.4.Effects of L and O canopies on yield and yield components at maturity
At maturity there were no significant interactions among GS and the other sources of variation for none of the variables measured (Table S4). Accordingly, the results of both GS are presented jointly(Table 5).
Variation in yield was tightly associated with changes in SN(R2=0.77,P <0.0001)but not with SZ(R2=0.0005,ns).At LD,L canopies had higher yield than O canopies, whereas at HD there were no differences between L and O canopies(Table 5).The higher yield in L-LD than in O-LD was associated with greater SN,which was the result of higher PN and higher SPP,in the L-LD combination.This yield increase in L-LD occurred despite its lower SZ (Table 5). At HD, even though PN was similar for both leaflet shapes, SN remained higher in L than in O canopies because the higher SPP of L lines was not affected by plant density(Table 5).
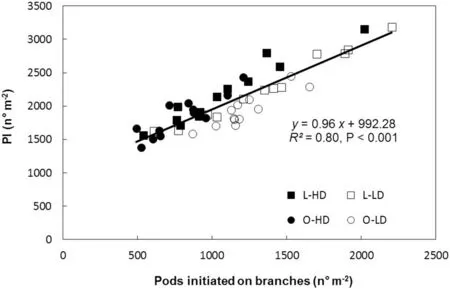
Fig.2-Relationship between pods initiated(PI)and pods initiated on branches,for lanceolate(L,squares)and ovate(O,circles)soybean near-isogenic lines,grown at low plant density(LD,open symbols)and high plant density(HD,filled symbols)in 2013/2014 growing season(GS 1), and in 2014/2015 growing season(GS 2).Data points correspond to triplicate replicates for each line,density,and GS.Continuous line represents a regression fitted to replicate values for all treatments.Parameters of the fitted regression,coefficient of determination(R2), and probability value(P)are also shown.
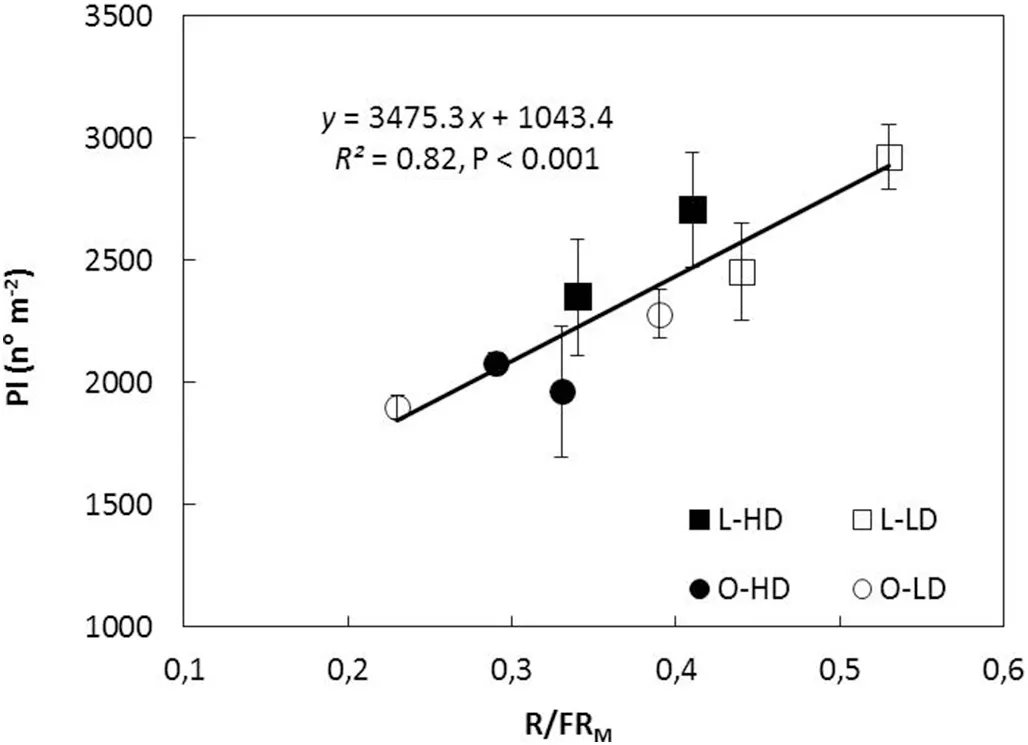
Fig.4-Pods initiated(PI)as function of the mean red/far-red ratio measured in the middle stratum of the canopy(R/FRM)during the V7-R5 period in 2014/2015 growing season,for lanceolate(L,squares)and ovate(O,circles)soybean near-isogenic lines grown at low plant density(LD, open symbols)and high plant density(HD,filled symbols).Data points are means of three replicates for each line and density.Vertical bars indicate standard error of the mean.Continuous line represents the fitted function to mean values for all treatments.Parameters of the fitted regression,coefficient of determination(R2)and probability value(P) are also shown.
Whereas PI was greater in L than in O canopies,either at LD and HD in both GS (Table 4), pods abscised were differently affected by leaflet shape and plant density. At LD, L and O canopies showed the same percentage of pod abscission(31%,ns).Thus,the higher PI in L-LD than in O-LD canopies(Table 4)explained the higher PN at harvest in the L-LD combination(Table 5).In contrast,at HD,greater pod abscission occurred in L than in O canopies (37% and 23% for L and O, respectively,P <0.001).Thus,a similar PN was observed in both treatments(Table 5),despite the higher PI in L-HD than in O-HD(Table 4).
SPP depends on SPPPand seed abortion. Whereas L lines showed higher values of SPPPthan O lines (3.6 and 2.9 for L and O, respectively, Table 5), seed abortion was greater in L(27%)than in O(22%)lines(P <0.001).Despite this increase in seed abortion, L lines retained greater developed SPP than Olines at harvest(2.7 and 2.3 for L and O,respectively,Table 5),and this difference was maintained irrespective of GS and plant density (Fig. 5). Although L lines had lower SZ compare to O lines(Table 5),no association was found between SZ and SPP (R2= 0.32,ns).
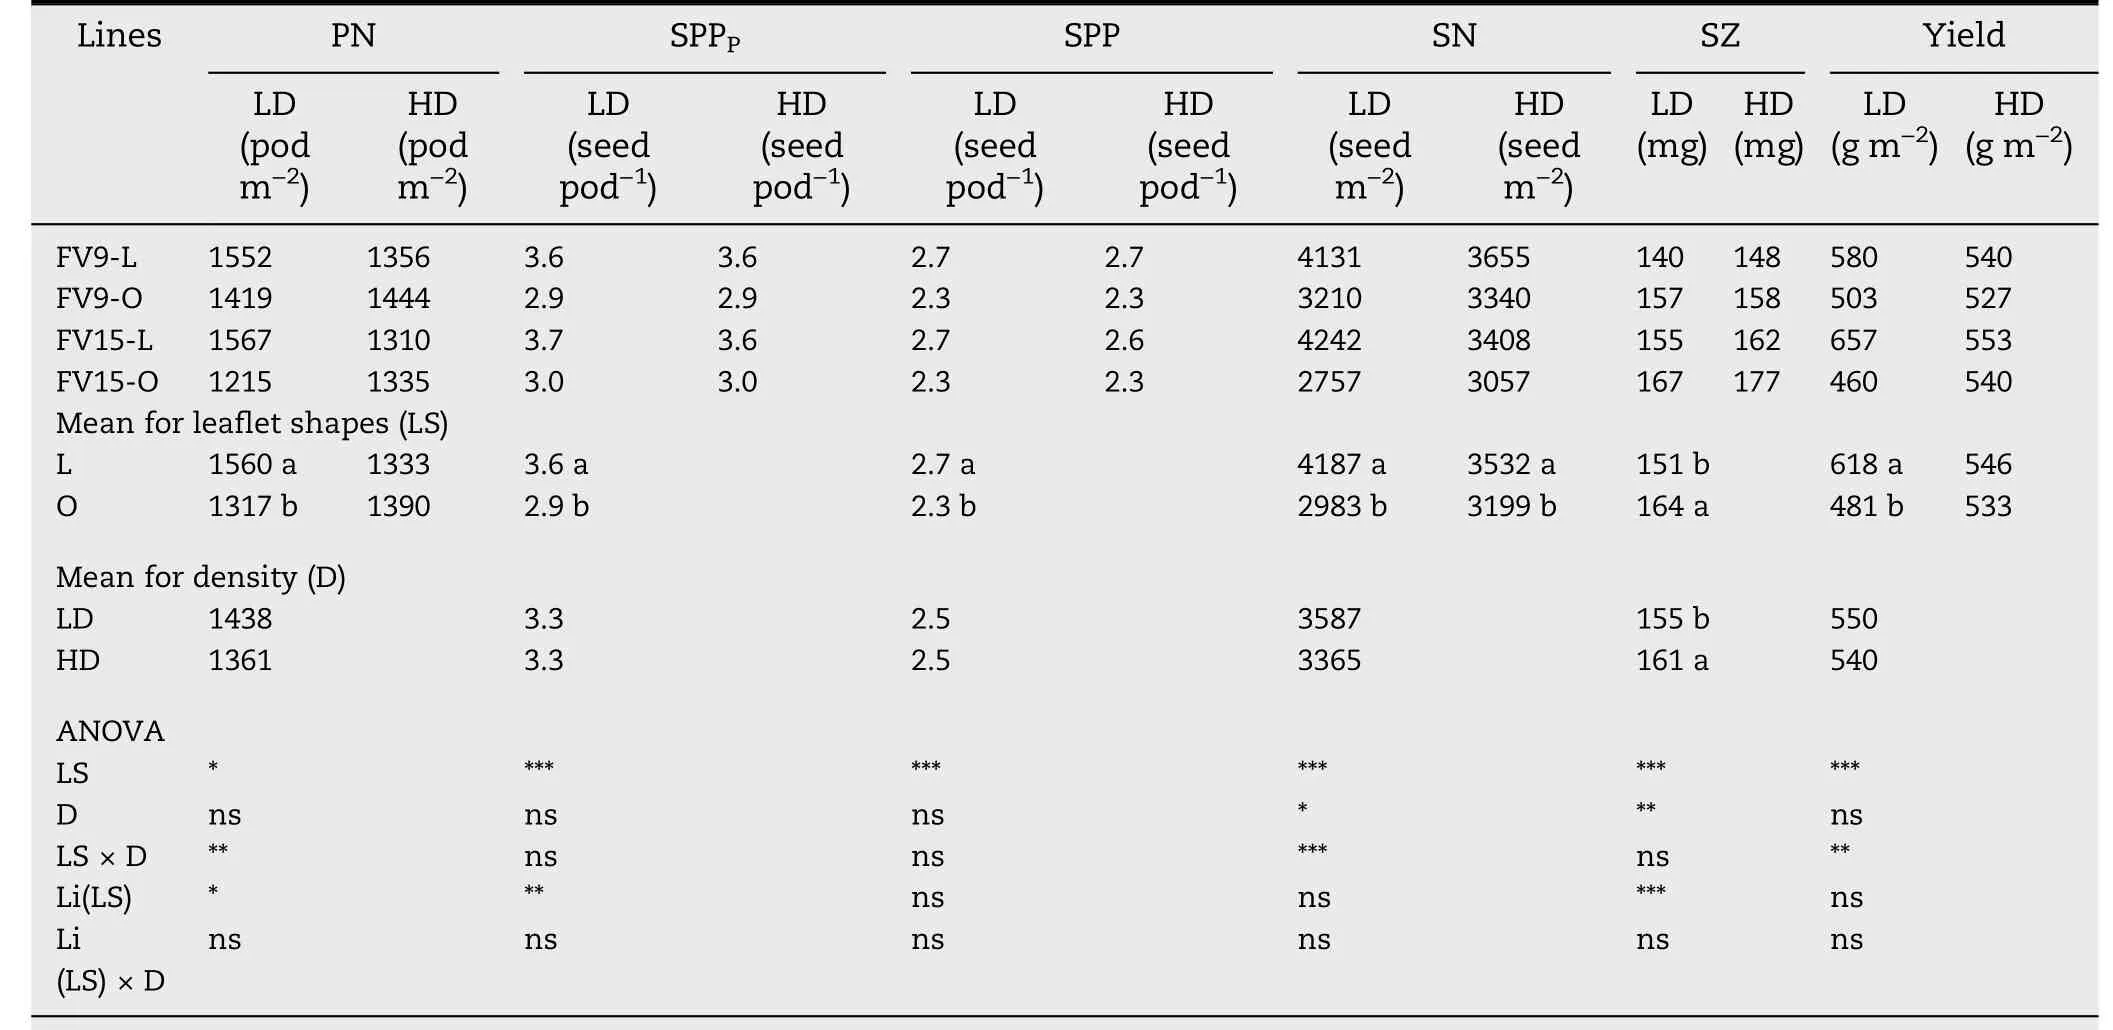
Table 5-Maturity pod number(PN),seed per pod potential(SPPP),seed per pod(SPP),seed number(SN),seed size(SZ)and yield,for two pairs of lanceolate(L)and ovate(O)soybean near-isogenic lines,grown in low-density(LD)and high-density(HD) plant populations.Data are averaged across 2013/2014 and 2014/2015 growing seasons.

ANOVA, analysis of variance.Li(LS),lines nested in leaflet shape.Different letters indicate significant differences according to LSD (P <0.05). When P-value of ANOVA was not significant, letters following the means were omitted for clarity.*, **, and *** indicate significant differences at probability level of 0.05,0.01, and 0.001, respectively.ns, non-significant difference.
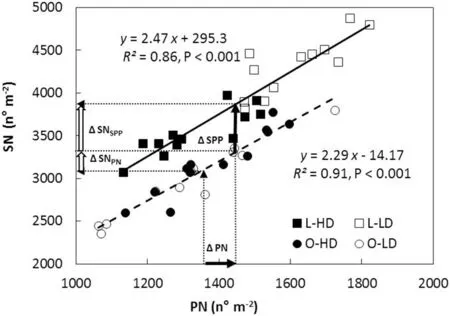
Fig.5- Seed number(SN)as a function of pod number(PN)and seed per pod(SPP)for lanceolate (L,squares)and ovate(O,circles)soybean near-isogenic lines,grown at low plant density(LD,open symbols)and high plant density(HD,filled symbols),for both growing seasons(GS).Data points correspond to triplicate replicates for each line,density and GS. Continuous and dashed lines are functions fitted to replicate values for L and O lines,respectively.The dotted vertical arrows starting at the abscissa axis indicate mean PN for respectively O and L lines,and their corresponding dotted horizontal arrows pointed at the ordinate axis indicate mean SN for respectively O and L lines.ΔPN(horizontal filled arrow)indicates the mean increase in PN of L compared to O lines,whereas ΔSPP(vertical filled arrow)indicates the mean increase in SPP of L compared to O lines.ΔSNSPP and ΔSNPN(vertical open arrows)indicate the mean increase in SN due to the increase in SPP and PN,respectively.Parameters of the fitted regressions, coefficient of determination(R2)and probability(P)values are also shown.
3.5. SN and its components PN and SPP
Variation in SN was highly associated with changes in PN for L and O canopies(Fig.5).However,the values of SN were always higher in L than in O canopies throughout the range of PN generated by growing seasons and densities (P <0.001; compare fitted lines for L and O in Fig. 5). This difference was explained by the higher SPP of L than of O lines.
L canopies showed higher minimum and maximum values of PN than O canopies: 1132-1821 pods m-2and 1062-1725 pods m-2,for L and O canopies,respectively.As a result,the mean PN was 1447 and 1354 pods m-2for L and O canopies,respectively(Fig.5,start of dotted vertical arrows at the abscissa axis). The mean SN corresponding to each mean PN was 3860 and 3091 seeds m-2for L and O canopies,respectively (Fig.5,dotted horizontal arrows pointed at the ordinate axis). The higher mean SN in L than in O canopies was the result of the added effects of the mean increase in SPP of L lines and the mean increase of PN in L canopies(vertical and horizontal filled arrows, respectively, in Fig. 5).
Another interesting result was that the LD and HD points for L canopies were grouped in respectively the upper and lower sectors of the fitted line(Fig.5,compare open and filled squares), whereas no grouping was observed as a function of the density for O canopies(Fig.5, open and filled circles).
4. Discussion
4.1. Crop growth parameters and canopy light environment
During the vegetative period, no difference in CGR was observed between L and O canopies, indicating that lower LAI was compensated by an increase in NAR of L canopies.Higher NAR in L canopies has been attributed [26] to a higher photosynthetic rate per unit leaf area,associated with a more uniform distribution of light into the canopy.Also,it has been suggested [46] that greater leaf photosynthetic capacity in L than in O lines was a consequence of higher Rubisco activity and more chloroplasts per unit leaf area in the former. Our results suggest that the increase in NAR can be attributed to higher IPARE in L than in O canopies before flowering (Table 2).This result is the first experimental evidence for the effect of leaflet shape on IPARE and its connection with NAR and CGR before canopy closure in soybean.
Likewise,Board[31]and Carpenter and Board[47]reported that the similar CGR in low and high plant density was the result of the increase in the IPARE and NAR of plants sown at low density. In our experimental conditions a similar response was observed in GS 1(Table 2).
With respect to the balance of photomorphogenic radiation, L canopies consistently showed higher R/FRMratio than O canopies at both plant densities. Although the greatest differences between L and O canopies occurred during the vegetative period, these differences persisted until R5, especially at LD (Fig. 1). Variation in R/FR ratios within soybean canopies with different plant populations and row spacing had been previously reported [30,31,48,49]. However, the results presented here provided the first experimental evidence that changes in leaf morphology (e.g. lanceolate vs.ovate)modify the R/FR balance within soybean canopies.
4.2. L and O canopies and PI
No difference was found between L and O lines in the duration of the R2-R5 period,which lasted 26 days in GS 1 and 27 days in GS 2.However,L canopies always showed higher PI than O canopies in both GS and plant densities. In previous studies[8,21],at CGRR2-R5above 14-15 g m-2day-1the response of PN to CGR was saturated.Under our experimental conditions,the mean CGRR2-R5was >20 g m-2day-1in all treatments(Table 3)suggesting that the CGRR2-R5was not the limiting factor in the determination of PN. In addition, PI was inversely related to LAI(Fig.3)and IPAR but directly associated with pods initiated on branches in both GS (Fig. 2). Similar results were reported by Quijano and Morandi[8]working with artificial defoliation imposed at flowering. Thus, two different experimental approaches have shown that, whether LAI reduction was achieved by leaflet removal or by genetic reduction of leaflet area, PI was always inversely related to LAI and IPAR, and no relationship was found between PI and CGRR2-R5.
Remarkably, PI was directly associated with the canopy R/FR ratio of the V7-R5 period,for both leaflet shapes and plant densities (Fig. 4). In soybean, the reproductive structures differentiate in axillary racemes located at the nodes which start to develop well before flowering. In the present study,50% (GS 1) and 70% (GS 2) of branch nodes were generated before flowering and the increase in total PI was a consequence of the increase in PI at branch nodes (Fig. 2). It is known [29,31,50] that branching in soybean, like tillering in grasses, is a developmental process controlled by the R/FR ratio and that the photoreceptor involved is phytochrome B.Negative effects of phytochrome B mutation and low R/FR ratio on branching in Arabidopsis were largely a result of reductions in bud outgrowth due to an increased degree of correlative inhibition acting on the buds [51]. It is thus reasonable to infer that the effect of the R/FR signals on the PI begins before flowering,via its effect on the development of branch nodes.
The highest value of PI/RN occurred in L-LD in both growing seasons (Table 4). As L-LD was the treatment that showed the highest R/FR ratio, it may be hypothesized that this response results from an intra-nodal process triggered by high levels of R/FR ratio,as suggested by Heindl and Brun[32]and Myers et al.[33].Testing this hypothesis,however,would require the design of new experiments.
In this context, it is worth noting that even though LAI influences both IPAR and R/FR ratio, the photoreceptors involved are different. Whereas PAR is absorbed by chlorophylls, requires high irradiation levels, and functions in photosynthesis and assimilates production, the R/FR ratio is sensed by phytochromes, does not necessarily require high levels of radiation, and plays a controlling role in many developmental processes [28,29]. Fig. 6 shows that while the response to IPAR was almost saturated at LAI of 5(95%IPAR or LAI critical, LAIc), the canopy R/FR ratio decreased from around 0.80 to 0.25 with the increase in LAI from about 2.5 to 8.0. Moreover, the association between PI and canopy R/FR ratio was linear and direct for R/FRMratios from 0.23 to 0.53(Fig.4)which corresponded to LAIs of about 8 to 3,respectively(Fig. 6). These results show that, in intact soybean canopies,pod initiation was directly associated with R/FRMand that this association was sustained across different leaflet shapes and plant densities (Fig. 4). Furthermore, the association between PI and R/FRMremained valid above as well as below LAIc. To our knowledge, this is the first experimental evidence of a direct association between pod initiation and R/FR ratio in intact soybean canopies.
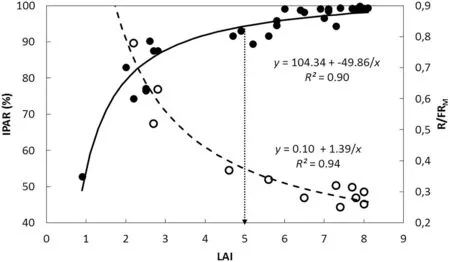
Fig.6- Evolution of photosynthetically active radiation intercepted (IPAR)and the red/far-red ratio(R/FRM) as function of leaf area index(LAI). Filled circles show the evolution of the percentage of IPAR(left axis)for the pairs of soybean near-isogenic lines FV9-L/FV9-O and FV15-L/FV15-O grown at low and high plant density in 2014/2015 growing season(GS 2).Data points are means of three replicate samples for each line grown at low and high plant density.Continuous line is the fitted function for data points of%IPAR.Dotted arrow pointed at the abscissa indicates the critical LAI(LAIc=5)for 95%IPAR.Open circles show the evolution of the R/FRM(right axis)as a function of LAI for the pair of near-isogenic lines FV15-L/FV15-O grown at low and high plant density in GS 2.Dashed line is the fitted function for data points of R/FRM.Parameters of the fitted regressions and coefficients of determination (R2)are also shown.
4.3. L and O canopies, yield components, and yield
As in other studies[1-4,52],yield was directly associated with SN but not with SZ. SN is the product of PN and SPP. As PN depends on the balance between PI and pods abscised, the increase in PI may eventually be offset by the increase in pod abscission.In both GS and densities,PI was higher in L than in O canopies (Table 4). As at LD there was no difference in pod abscission between L and O, the increase in PI explained the higher PN at harvest in L-LD than in O-LD canopies (Table 5).At HD,however,L showed 14%more abscised pods than O,so that PN at harvest remained similar for L-HD and O-HD canopies(Table 5).Whereas some authors[18,53-55]consider that pod abscission is controlled by the assimilatory capacity,others [32,33] propose that the abscission of reproductive structures in soybean is photomorphogenically regulated.The process of abscission is controlled by developmental and environmental cues in which plant hormones such as cytokinins, auxins, and ethylene are involved [56-59]. In tobacco, the synthesis of ethylene was stimulated by a low R/FR ratio [59]. The main peak of pod abscission in soybean occurs immediately after R5 [8,18]. Under our experimental conditions the LAI during the main abscission period was above LAIc in all treatments,suggesting that the assimilatory capacity was not limiting. However, the causes of the differences in pod abscission remain unknown.
The other component that determines SN is the SPP,which depends on SPPPand seed abortion. The L lines used in this study had 20%more SPPPthan O lines(3.6 and 2.9 for L and O,respectively, Table 5). This difference was explained by the higher percentage of four-seeded pods in L (60%) than in O(7%)lines.At harvest, SPPPdropped to a SPP of 2.7 and 2.3 for respectively in L and O lines,owing to seed abortion(Table 5).Even though L lines showed 5% more seed abortion than O lines,the differences in harvest SPP remained 17%higher in L than in O lines, increasing the SN of the former at both plant densities(Table 5).
Fig.5 summarizes the relationships among PN,SPP and SN found in this study.The range of variation in PN observed for L and O canopies was generated by the combination of different growing seasons and densities. The finding that the position of the fitted function for L was always above that for O in Fig.5, may be explained by genetic differences in SPPPbetween L and O lines (Table 1, Table 5). Moreover,the difference in SPP between the two leaflet shapes remained stable over the entire range of variation in PN(Fig.5).The stability of the SPP component is consistent with previous reports [6-8] that SPP is a highly heritable trait only slightly influenced by environment.Our results show that the effect of increasing SPP on the increase of SN was direct and independent of PN, showing that there was no compensation between SPP and PN.
PN in L canopies was clearly separated into two groups depending on density (Fig. 5, compare open and filled squares), whereas no grouping as a function of density was observed in O canopies (Fig. 5, open and filled circles). The differing responses to density of L and O canopies may be explained by differences in pod initiation and pod abscission.Thus, for L canopies the increase in pod initiation was reinforced by a decrease in pod abscission in L-LD compared to L-HD, magnifying the differences in PN between the two treatments(Fig.5).In contrast,for O canopies,the higher PI in O-LD than in O-HD was partially offset by the increase in pod abscission in the former, preventing a clear separation of PN between the two densities(Fig.5).
Although O lines showed higher SZ than their L counterparts,this difference was not reflected in yield. At LD,the SN of L lines outweighed their low SZ,allowing higher yields in LLD than in O-LD canopies,whereas at HD,yield of L-HD and OHD canopies remained unchanged because SN and SZ compensated for each other(Table 5).
Previous studies [27,35,37,60,61] evaluating lanceolate leaflets effect on yield suggested that this trait offers neither a yield advantage nor a disadvantage compared to ovate leaflets. However, these studies were conducted with older varieties whose mean yield was around 2600 kg ha-1(2100 to 3200 kg ha-1) whereas the lines used in this study had an mean yield of around 5430 kg ha-1(4460 to 6570 kg ha-1,Table 5). Traits such as leaflet shape may require a suitable genetic background to maximize yield potential [36,62]. In addition,crop management decisions such as the choice of plant density must be adjusted properly to optimize the effect of leaflet shape on the components of yield under diverse environmental conditions. We suggest that the deployment of the L trait, together with an appropriate selection of plant density, would increase the canopy R/FR ratio, increasing PI and pods retained. Given that the L trait is controlled by a single gene, it would be simple to incorporate it into elite soybean germplasm.
Also, the introgression, by conventional or marker-assisted breeding,of the high percentage of four-seeded pods into modern soybean germplasm will increase SPP and impact positively on SN,the component most associated with yield in soybean.
5. Conclusions
The results presented in this study show for the first time that L canopies had higher IPARE than O canopies. The higher IPARE may explain the increase in NAR observed for L canopies that allowed them to achieve similar CGR than O canopies,particularly before canopy closure.PI increased with the increase in the canopy R/FR ratio.This positive association was maintained across different leaflet shapes and plant densities and was sustained above as well as below LAIc.This finding provides strong experimental evidence that R/FR ratio is positively associated with PI in intact soybean canopies.Increasing SPP increased SN irrespective of PN and plant density.
Declaration of competing interest
Authors declare that there are no conflicts of interest.
Acknowledgements
We are grateful to Darío Dardo Rocha for his help in the design and assembly of the equipment for the measurement of red and far-red light in the field. We also thank María Gabriela Borgognone and Celina Beltrán for their advice with statistical analysis. This research was partially supported by Project PUE 22920160100043, IICAR-CONICET, Argentina; and Project 2010-205-13 Ministerio de Ciencia Tecnología e Innovación Productiva, Santa Fe Province,Argentina.
Appendix A. Supplementary data
Supplementary data for this article can be found online at https://doi.org/10.1016/j.cj.2019.09.011.
- The Crop Journal的其它文章
- Brief Guide for Authors
- Boosting proso millet yield by altering canopy light distribution in proso millet/mung bean intercropping systems
- Genome-wide association study of vitamin E in sweet corn kernels
- Strip rotary tillage with subsoiling increases winter wheat yield by alleviating leaf senescence and increasing grain filling
- Transcriptome analysis suggests mechanisms for a novel flowering type: Cleistogamous wheat
- Vacuolar invertase genes SbVIN1 and SbVIN2 are differently associated with stem and grain traits in sorghum(Sorghum bicolor)