
Genetic bases of source-, sink-, and yield-related traits revealed by genome-wide association study in Xian rice
2020-04-19 02:30:04YunWngYunlongPngKiChenLiyunZhiCongongShenShuWngJinlongXub
The Crop Journal 2020年1期
Yun Wng, Yunlong Png, Ki Chen, Liyun Zhi, Congong Shen, Shu Wng,Jinlong Xub,,*
aRice Research Institute, Shenyang Agricultural University,Shenyang 110866,Liaoning,China
bInstitute of Crop Sciences/National Key Facility for Crop Gene Resources and Genetic Improvement,Chinese Academy of Agricultural Sciences,Beijing 100081,China
cAgricultural Genomics Institute at Shenzhen,Chinese Academy of Agricultural Sciences,Shenzhen 518120,Guangdong, China
Keywords:Rice GWAS Source-sink relationship Quantitative trait loci/locus (QTL)Candidate gene
ABSTRACT The source-sink relationship determines the ultimate grain yield. We investigated the genetic basis of the relationship between source and sink and yield potential in rice. In two environments, we identified quantitative trait loci (QTL) associated with sink capacity (total spikelet number per panicle and thousand-grain weight), source leaf (flag leaf length, flag leaf width and flag leaf area), source-sink relationship (total spikelet number to flag leaf area ratio) and yield-related traits (filled grain number per panicle,panicle number per plant,grain yield per plant,biomass per plant,and harvest index) by genome-wide association analysis using 272 Xian (indica) accessions. The panel showed substantial variation for all traits in the two environments and revealed complex phenotypic correlations. A total of 70 QTL influencing the 11 traits were identified using 469,377 high-quality SNP markers. Five QTL were detected consistently in four chromosomal regions in both environments. Five QTL clusters simultaneously affected source, sink, source-sink relationship, and grain yield traits, probably explaining the genetic basis of significant correlations of grain yield with source and sink traits. We selected 24 candidate genes in the four consistent QTL regions by identifying linkage disequilibrium (LD) blocks associated with significant SNPs and performing haplotype analysis. The genes included one cloned gene (NOG1) and three newly identified QTL(qHI6, qTGW7, and qFLA8). These results provide a theoretical basis for high-yield rice breeding by increasing and balancing source-sink relationships using marker-assisted selection.
1. Introduction
Grain yield of rice is determined largely by source, sink and their relationship [1]. Spikelet number per panicle and grain size are the primary sinks that accumulate photosynthetic product,and the topmost three leaves,especially the flag leaf,are often regarded as the most important primary source of assimilate for grain yield [2]. Flag leaf size in rice is also associated with thousand-grain weight (TGW), grain weight per panicle (GWP), and other yield-related traits [3,4]. Rice breeding experience indicates that a large sink coupled with a strong source is a prerequisite for high yield potential [5].Accordingly,in modern crop science,the source-sink model is usually applied to explain the formation of yield and yield components.
Our understanding of the genetic bases of source-sink-and grain yield-related traits has been greatly advanced by developments in genetic and molecular technologies. To date, many researchers have detected QTL for yield-related traits in rice, including source leaf-size traits including leaf length, width, and area [6-9], sink capacity traits including spikelet number per panicle and grain weight [10-14], and source-sink relationship [1,3,15,16]. Several QTL affecting these traits have been further cloned. Examples include sink-related genes, such as Gn1a [17], DEP1 [18], OsSPL16 [19],GNP1 [20], and NOG1 [21] for grain number, qSW5 [22], GIF1[23],qGL7[24],and GS3[25]for grain size and grain weight,and source-sink relationship gene NAL1 [26-28]. Notably, several QTL affecting source leaves (e.g. flag leaf, second top leaf)have been mapped to chromosomal regions close to those associated with sink traits such as grain number per panicle,TGW and yield per plant, hinting at possible pleiotropy or tight linkage of genes affecting source, sink, and yield traits[1,3,15,16]. Validation and dissection of these QTL or genes is still needed for better understanding of the genetic basis of source-sink related traits.
Genome-wide association study (GWAS) is an effective method of investigating the genetic architecture of complex traits and has been successfully applied for identifying the genetic bases of agronomic traits and biotic and abiotic stress tolerances [29-34]. Here we report an effort to elucidate the source-sink relationship based on GWAS applied to several morphological traits associated with source and sink capacities and yield in rice using a panel of worldwide collected Xian accessions with high throughput re-sequencing data.The objective of the study was to identify phenotypic relationships between source-sink related traits and yield and to identify the underlying genetic bases of source-sink related traits.
2. Materials and methods
2.1. Materials and phenotypic investigation
The study employed 272 Xian rice accessions from 31 countries or regions. The detailed origin and the population structure of the association mapping panel were reported by Qiu et al.[32].
All accessions were planted in Sanya (SY 18.3°N, 109.3°E),Hainan province during December 2013-April 2014 and Shenzhen (SZ 22.6°N, 114.1°E) during July-November 2015.Each accession was grown in a plot of five rows with 10 plants in each row at a spacing of 20.0 cm × 16.6 cm with three replicates. Field management followed local production practices. At the full heading stage, flag leaf width (FLW, in cm) and flag leaf length (FLL, in cm) were measured on the main stem of five uniform plants of each accession. Flag leaf area (FLA, in cm2) was calculated as FLL × FLW × 0.75 [35]. At maturity,five uniform plants in the middle row were sampled and dried in an oven at 70 °C for 5 days for trait measurement including panicle number per plant (PN), total spikelet number per panicle (TSN), total spikelet number to flag leaf area ratio (TAR), filled grain number per panicle (FGN),thousand grain weight (TGW, in g), biomass per plant (BMP,in g), and grain yield per plant (GY, in g). Harvest index (HI)was calculated as the ratio of GY to BMP.
2.2. Phenotypic data analysis
Best linear unbiased estimates(BLUEs)for each of the genotypeenvironment combinations were estimated by multiple-site analysis with accession (genotype) treated as a fixed effect and environment and replicate within environment treated as random effects. Variance components were estimated using multiple-site analysis with all effects treated as random.Heritability across environments was computed using the estimated variance components as VG/(VG+ VGEI/s + Ve/sr),where VG, VGEI,and Veare the variances of genotype,genotype-by-environment interaction(GEI),and residual error,respectively,s is the number of environments,and r is the number of replicates.All analyses were conducted with the PBTools package (http://bbi.irri.org/products) developed by IRRI. Phenotypic correlations were computed from the BLUEs using the rcorr function implemented in the R package Hmisc[36].
2.3. Genome-wide association mapping
The 700,000-SNP genotype data of the association panel was described by McCouch et al.[37].SNPs with missing rate ≥20%and minor allele frequency ≤5%were removed.Heterozygous SNPs were also eliminated. The remaining 469,377 highquality SNP markers, evenly distributed over the chromosomes, were used for GWAS with the BLUEs. GWAS was performed using the compressed mixed linear model [38]implemented in TASSEL 5.2.43 with the Q + K model. The Q matrix was calculated by the Bayesian clustering analysis method implemented in STRUCTURE software version 2.3.4[39],and the optimal number of groups was Q = 3 determined by Δk following Evanno et al.[40].The K matrix was calculated by centered IBS[41]the default method of TASSEL 5.2.43.The critical P-value for declaring a significant marker-trait association was 10-4.
2.4. QTL candidate region analysis and identification of candidate genes
Haplotype analysis was performed to detect candidate genes for QTL consistently identified in the two environments.Candidate genes were identified in three steps. First, to estimate candidate regions of identified QTL,the LDs between SNPs were evaluated using squared Pearson's correlation coefficient (r2) calculated with the R package “genetics”. LD heatmaps surrounding peaks in the GWAS were constructed with the R package“LDheatmap”[42].SNPs with P-value <0.01 were used to construct an LD heatmap. Candidate regions were estimated using an r2≥0.6 [43]. LD blocks containing significant trait-associated SNPs were defined as candidate gene regions. All genes located in the candidate regions of each QTL were then retrieved from the Rice Annotation Project Database (https://rapdb.dna.affrc.go.jp/). Second, haplotype analysis of the candidate gene in each QTL region was performed using non-synonymous SNPs within the CDS region (type I) and SNPs located in the 5′ flanking sequences of genes (≤2 kb from the first ATG), and thus in the promoter region (type II). Finally, candidate genes were assigned by testing for significant differences in phenotype among major haplotypes (comprising more than 10 accessions) for each QTL using analysis of variance.
3. Results
3.1. Basic statistics of markers
In total, 469,377 high quality SNPs with minor allele frequency ≥0.05 and missing rate below 20% were used in association analysis. The number of SNPs per chromosome ranged from 28,890 on chromosome 10 to 56,566 on chromosome 1. The sizes of chromosomes varied from 22.9 Mb(chromosome 9) to 43.3 Mb (chromosome 1). The full genome size was 372.9 Mb with an average marker spacing of 797.7 bp,ranging from 677.1 bp for chromosome 11 to 865.2 bp for chromosome 5 (Table 1).
3.2. Phenotypic variation and correlation
The panel showed wide variation for all investigated traits and most traits appeared to be normally distributed(Fig.1-A).Based on estimates of variance components for 11 traits,mosttraits were controlled mainly by VG, whereas VGEIwas the main source for FLA (Table 2). The heritability of the 11 traits ranged from 0.40 for FLA to 0.92 for TGW(Table 2).
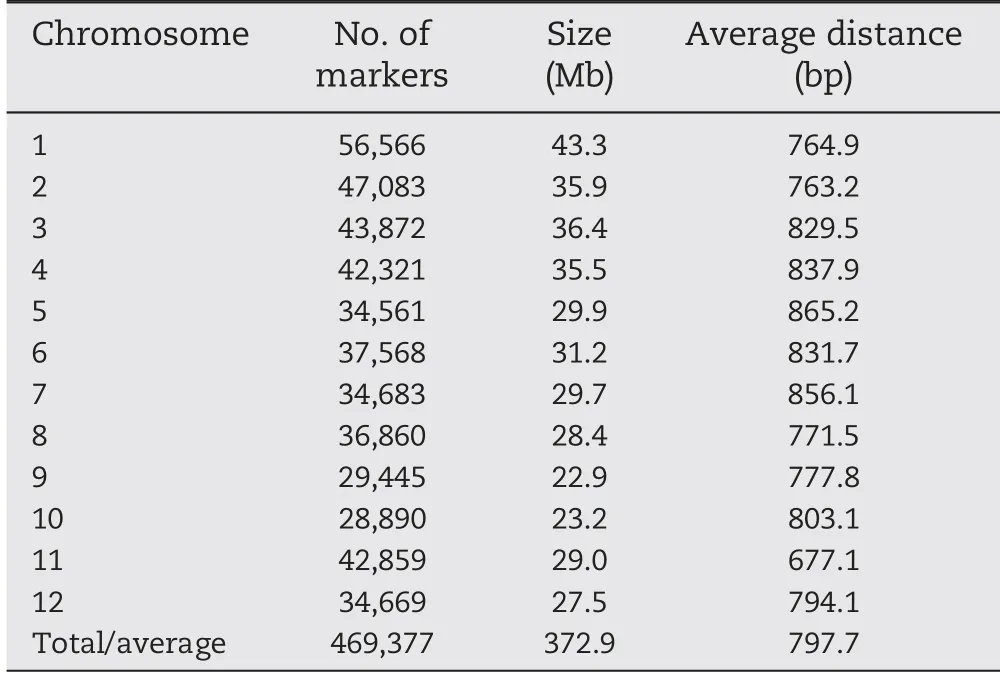
Table 1-Distribution of SNP markers on 12 chromosomes of rice.
In the two environments, the trends of pairwise phenotypic correlations were similar. The FLA showed strong positive correlation with sink size (TSN) and sink capacity(TGW), but significantly negative correlations with PN. GY showed significant positive correlations with PN, TSN, and FGN (Fig. 1-B), whereas GY and TGW showed no significant correlations,implying that PN and TSN made larger contributions to GY than TGW in this panel.The correlations between HI/BMP and the three grain yield component traits (PN, FGN,and TGW) were consistent with correlations between GY and its component traits in both environments (Fig. 1-B). TAR, a source-sink relationship trait, showed significant positive correlations with FGN, TSN, GY, and HI, but significant negative correlations with FLL, FLW, FLA, and TGW (Fig. 1-B).There were negative correlations among the three grain yieldcomponent traits (PN, FGN, and TGW) in both environments.As expected, FLA showed significant positive correlations with its corresponding component traits(FLL and FLW)(Fig.1-B). The three flag leaf traits (FLL, FLW, and FLA) were all significantly positively correlated with grain weight per panicle(GWP = GY/PN)(Table 3).
3.3. QTL mapping
In total, 70 QTL were associated with the 11 traits in two environments,ranging from three for BMP to nine for FLA and TSN. Among these, 43 QTL were detected only in SY and 32 only in SZ, and five QTL were consistently detected in both environments(Fig.S1,Table 4).
Eight QTL for FLL were identified on chromosomes 1,2,5,7,8,9,and 12,including four QTL detected in SY and five QTL in SZ. These QTL explained 7.8%-19.5% of phenotypic variation.Only qFLL1 was consistently detected in both environments and accounted for respectively 7.8% and 12.5% of phenotypic variance(Fig.S1,Table 4).
For FLW,eight QTL were detected on chromosomes 1,2,4,5, 9, 10, and 12. Among them, four QTL (qFLW1, qFLW2,qFLW10, and qFLW12) were identified only in SY, accounting for 9.9%-14.7% of phenotypic variance. The other four QTL(qFLW4, qFLW5.1, qFLW5.2, and qFLW9) were detected only in SZ and explained respectively 11.7%-15.7% of phenotypic variance(Fig.S1,Table 4).
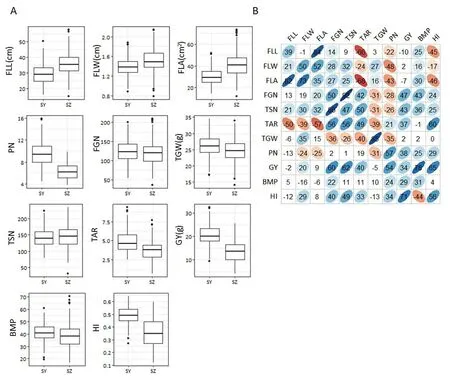
Fig.1-Values and correlations of source-,sink-,and yield-related traits in two environments.(A).Box plots of 11 yield-related traits in Sanya(SY)and Shenzhen(SZ).FLL,flag leaf length;FLW,flag leaf width;FLA,flag leaf area;PN,panicle number per plant;FGN,filled grain number per panicle;TGW,thousand-grain weight;TSN,total spikelet number per panicle;TAR,total spikelet number to flag leaf area ratio; GY,grain yield per plant;BMP,biomass per plant;HI, harvest index.(B). Correlations between the 11 traits in SY (upper diagonal)and SZ(lower diagonal).The values are correlation coefficients(r)multiplied by 100.The values on the main diagonal are correlations between SY and SZ.The areas and colors of ellipses correspond to absolute values of the corresponding r.Right and left oblique ellipses indicate positive and negative correlations,respectively.Values without glyphs were insignificant at the 0.05 probability level.
For FLA, nine QTL were identified on chromosomes 1, 2,5-9, and 12, with the phenotypic variation accounted for ranging from 6.7 to 18.0%. Among them, qFLA8 was detected in both SY and SZ and explained respectively 12.5%and 14.4%of phenotypic variance(Fig.S1, Table 4).
For TSN,nine QTL were detected on chromosomes 1,2,4,5,6, 8, 11, and 12. Of these, six QTL (qTSN1.1, qTSN2, qTSN4,qTSN6,qTSN11,and qTSN12)were identified in SY,accounting for 7.1%-7.9% of phenotypic variance. The other three QTL(qTSN1.2, qTSN5, and qTSN8) were detected in SZ and explained 9.1%-9.9%of phenotypic variance(Fig.S1,Table 4).
For TAR,five QTL(qTAR1.2,qTAR1.3,qTAR2,qTAR7,and qTAR8)were detected in SY,and accounted for 5.6%-6.7%of phenotypic variance.One QTL (qTAR1.1)was detected in SZ, and accounted for 8.8%of phenotypic variance(Fig.S1,Table 4).
For FGN,five QTL were detected on chromosomes 1,6,and 12, including three QTL identified in SY and three QTL in SZ.The phenotypic variation explained by these QTL ranged from 6.7% to 12.8%. Among them, qFGN1.2 was identified in both environments,accounting for respectively 10.8%and 12.8%of variation in SY and SZ(Fig.S1,Table 4).
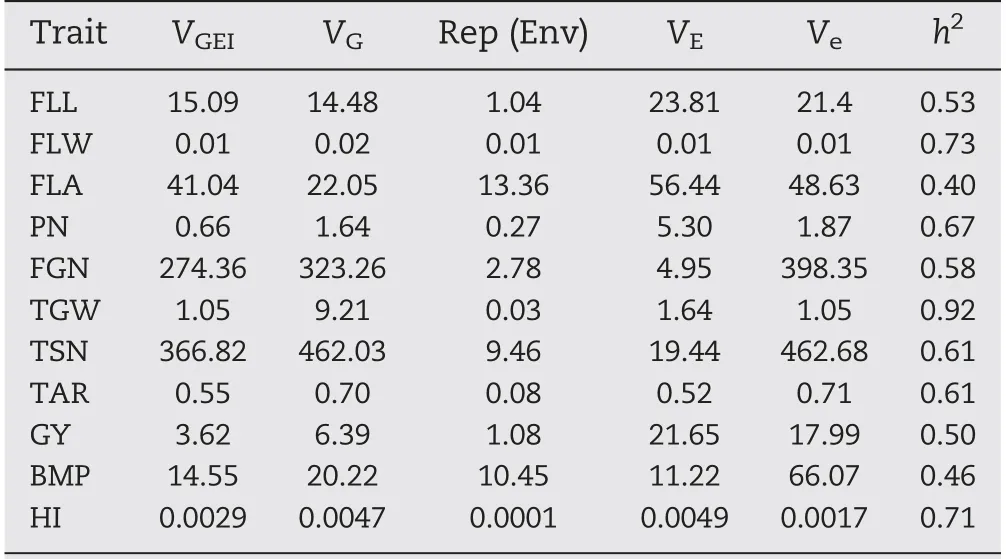
Table 2-Variance components and heritability estimated by multiple-site analysis.
QTL for PN were detected only in SY. The four QTL (qPN2,qPN3,qPN11.1,and qPN11.2)governing PN were identified and located on chromosomes 2, 3, and 11 with phenotypic variation explained ranging from 7.2% to 10.5%(Fig.S1, Table 4).
For TGW,five QTL were identified on chromosomes 3,5,7,10, and 12, with phenotypic variation accounted for ranging from 6.3%to 18.7%.Of the five,qTGW7 was detected in both SY and SZ explaining respectively 9.9% and 18.7% of variation(Fig.S1,Table 4).
For GY, seven QTL were detected on chromosomes 1, 7, 8,and 11. Three (qGY7, qGY11.1, and qGY11.2) were detected in SY and accounted for 6.0% to 12.2% of phenotypic variance.The other four QTL (qGY1.1, qGY1.2, qGY1.3, and qGY8) were detected in SZ and accounted for 10.0%to 18.6%of phenotypic variance(Fig.S1, Table 4).
QTL for BMP were detected only in SY.The three QTL were identified on chromosomes 11 and 12 with phenotypicvariation explained ranging from 7.2% to 10.6% (Fig. S1,Table 4).
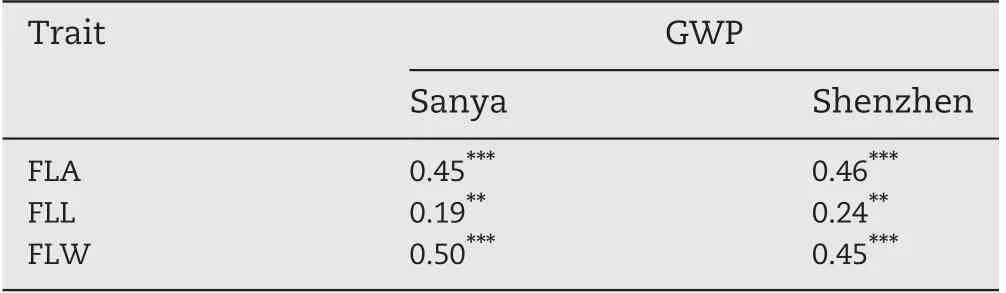
Table 3-Correlations of grain weight per plant (GWP)with flag leaf traits in Sanya and Shenzhen.
Six QTL affecting HI were detected on chromosomes 1,3,6,7, and 8 with phenotypic variation explained ranging from 6.9% to 19.4%. Of the six, qHI6 was detected in both environments and accounted for respectively 9.4% and 12.8%of phenotypic variation in SY and SZ (Fig.S1, Table 4).
3.4. Coincidence of QTL for source- and sink-related traits
Comparison of 25 QTL affecting source flag leaf size, 14 QTL influencing sink capacities, 6 QTL for source-sink relationship, and 25 QTL affecting yield-related traits revealed that five chromosomal regions simultaneously influencing source,sink/yield-related and source-sink relationship traits, including the region of 30.82-32.10 Mb on chromosome 1 harboring qFLL1 for FLL,qFGN1.2 for FGN,qGY1.2 for GY and qHI1.1 for HI;the region of 38.5-39.73 Mb on chromosome 1 harboring qTAR1.3 for TAR and qFLA1 for FLA; the region of 4.74-5.96 Mb on chromosome 2 harboring qFLL2, qFLW2,qFLA2.1, qPN2 for FLL, FLW, FLA and PN, respectively; the region of 24.7-27.0 Mb on chromosome 6 harboring qFLA6 for FLA, qTSN6 for TGN and qFGN6 for FGN; and the region of 19.60-20.89 Mb on chromosome 8 harboring qFLA8, qTSN8,qGY8,qHI8 for FLA,TSN,GY,and HI,respectively(Table 4).
3.5. Candidate gene analysis for important QTL
For qHI6 governing HI, the candidate region was mapped in the region of 2.89-3.19 Mb(300 kb)on chromosome 6 containing 65 annotated genes according to the Rice Annotation Project Database(Fig.2-A).Among them,52 genes with type I and/or type II SNPs were included in haplotype analysis. For type I SNPs, four genes (Os06g0157500, Os06g0157700,Os06g0159450, and Os06g0159600) and for type II SNPs, six genes (Os06g0156700, Os06g0157700, Os06g0158300,Os06g0158900, Os06g0159450, and Os06g0159600) showed significant differences for HI among different haplotypes, and three genes (Os06g0157700, Os06g0159450, and Os06g0159600)showed differences for both SNP types(Fig.2-B-K).
QTGW7 was identified in the region of 22.10-23.59 Mb(1490 kb) on chromosome 7, containing 247 annotated genes(Fig. 3-A), of which 185 of type I and/or type II were used for haplotype analysis. Significant differences in TGW were identified between different haplotypes for six candidate genes (Os07g0556200, Os07g0568500, Os07g0574900,Os07g0578200, Os07g0580500, and Os07g0582500) using type II SNPs (Fig. 3-B-G), whereas no significant haplotypes were found using type I SNPs.
QFLA8 was fine-mapped to the region of 19.51-20.18 Mb(670 kb)on chromosome 8 harboring 98 annotated genes(Fig.4-A), and 61 genes of type I and/or type II were used for haplotype analysis.Highly significant differences in FLA were detected between different haplotypes for the five candidate genes (Os08g0412200, Os08g0414700, Os08g0416900,Os08g0419200, and Os08g0421850) using type II SNPs (Fig. 4-B-F),whereas no significant haplotypes were found using type I SNPs.
On chromosome 1, a high peak of qFGN1.2 was mapped together with the peak of qFLL1.A candidate region from 31.29to 32.10 Mb(810 kb)containing 128 annotated genes(Fig.5-A)was selected, and 95 genes of type I and/or type II were used for haplotype analysis. Of these, three (Os01g0758400,Os01g0758900, and Os01g0759200) for type I SNPs and three(Os01g0752200, Os01g0753000, and Os01g0758350) for type II SNPs showed significant differences for FGN among haplotypes (Fig. 5-B-D and F-H). For FLL, the corresponding numbers were one (Os01g0759200) and two (Os01g0752200,Os01g0753000)(Fig.5-E,I, J).
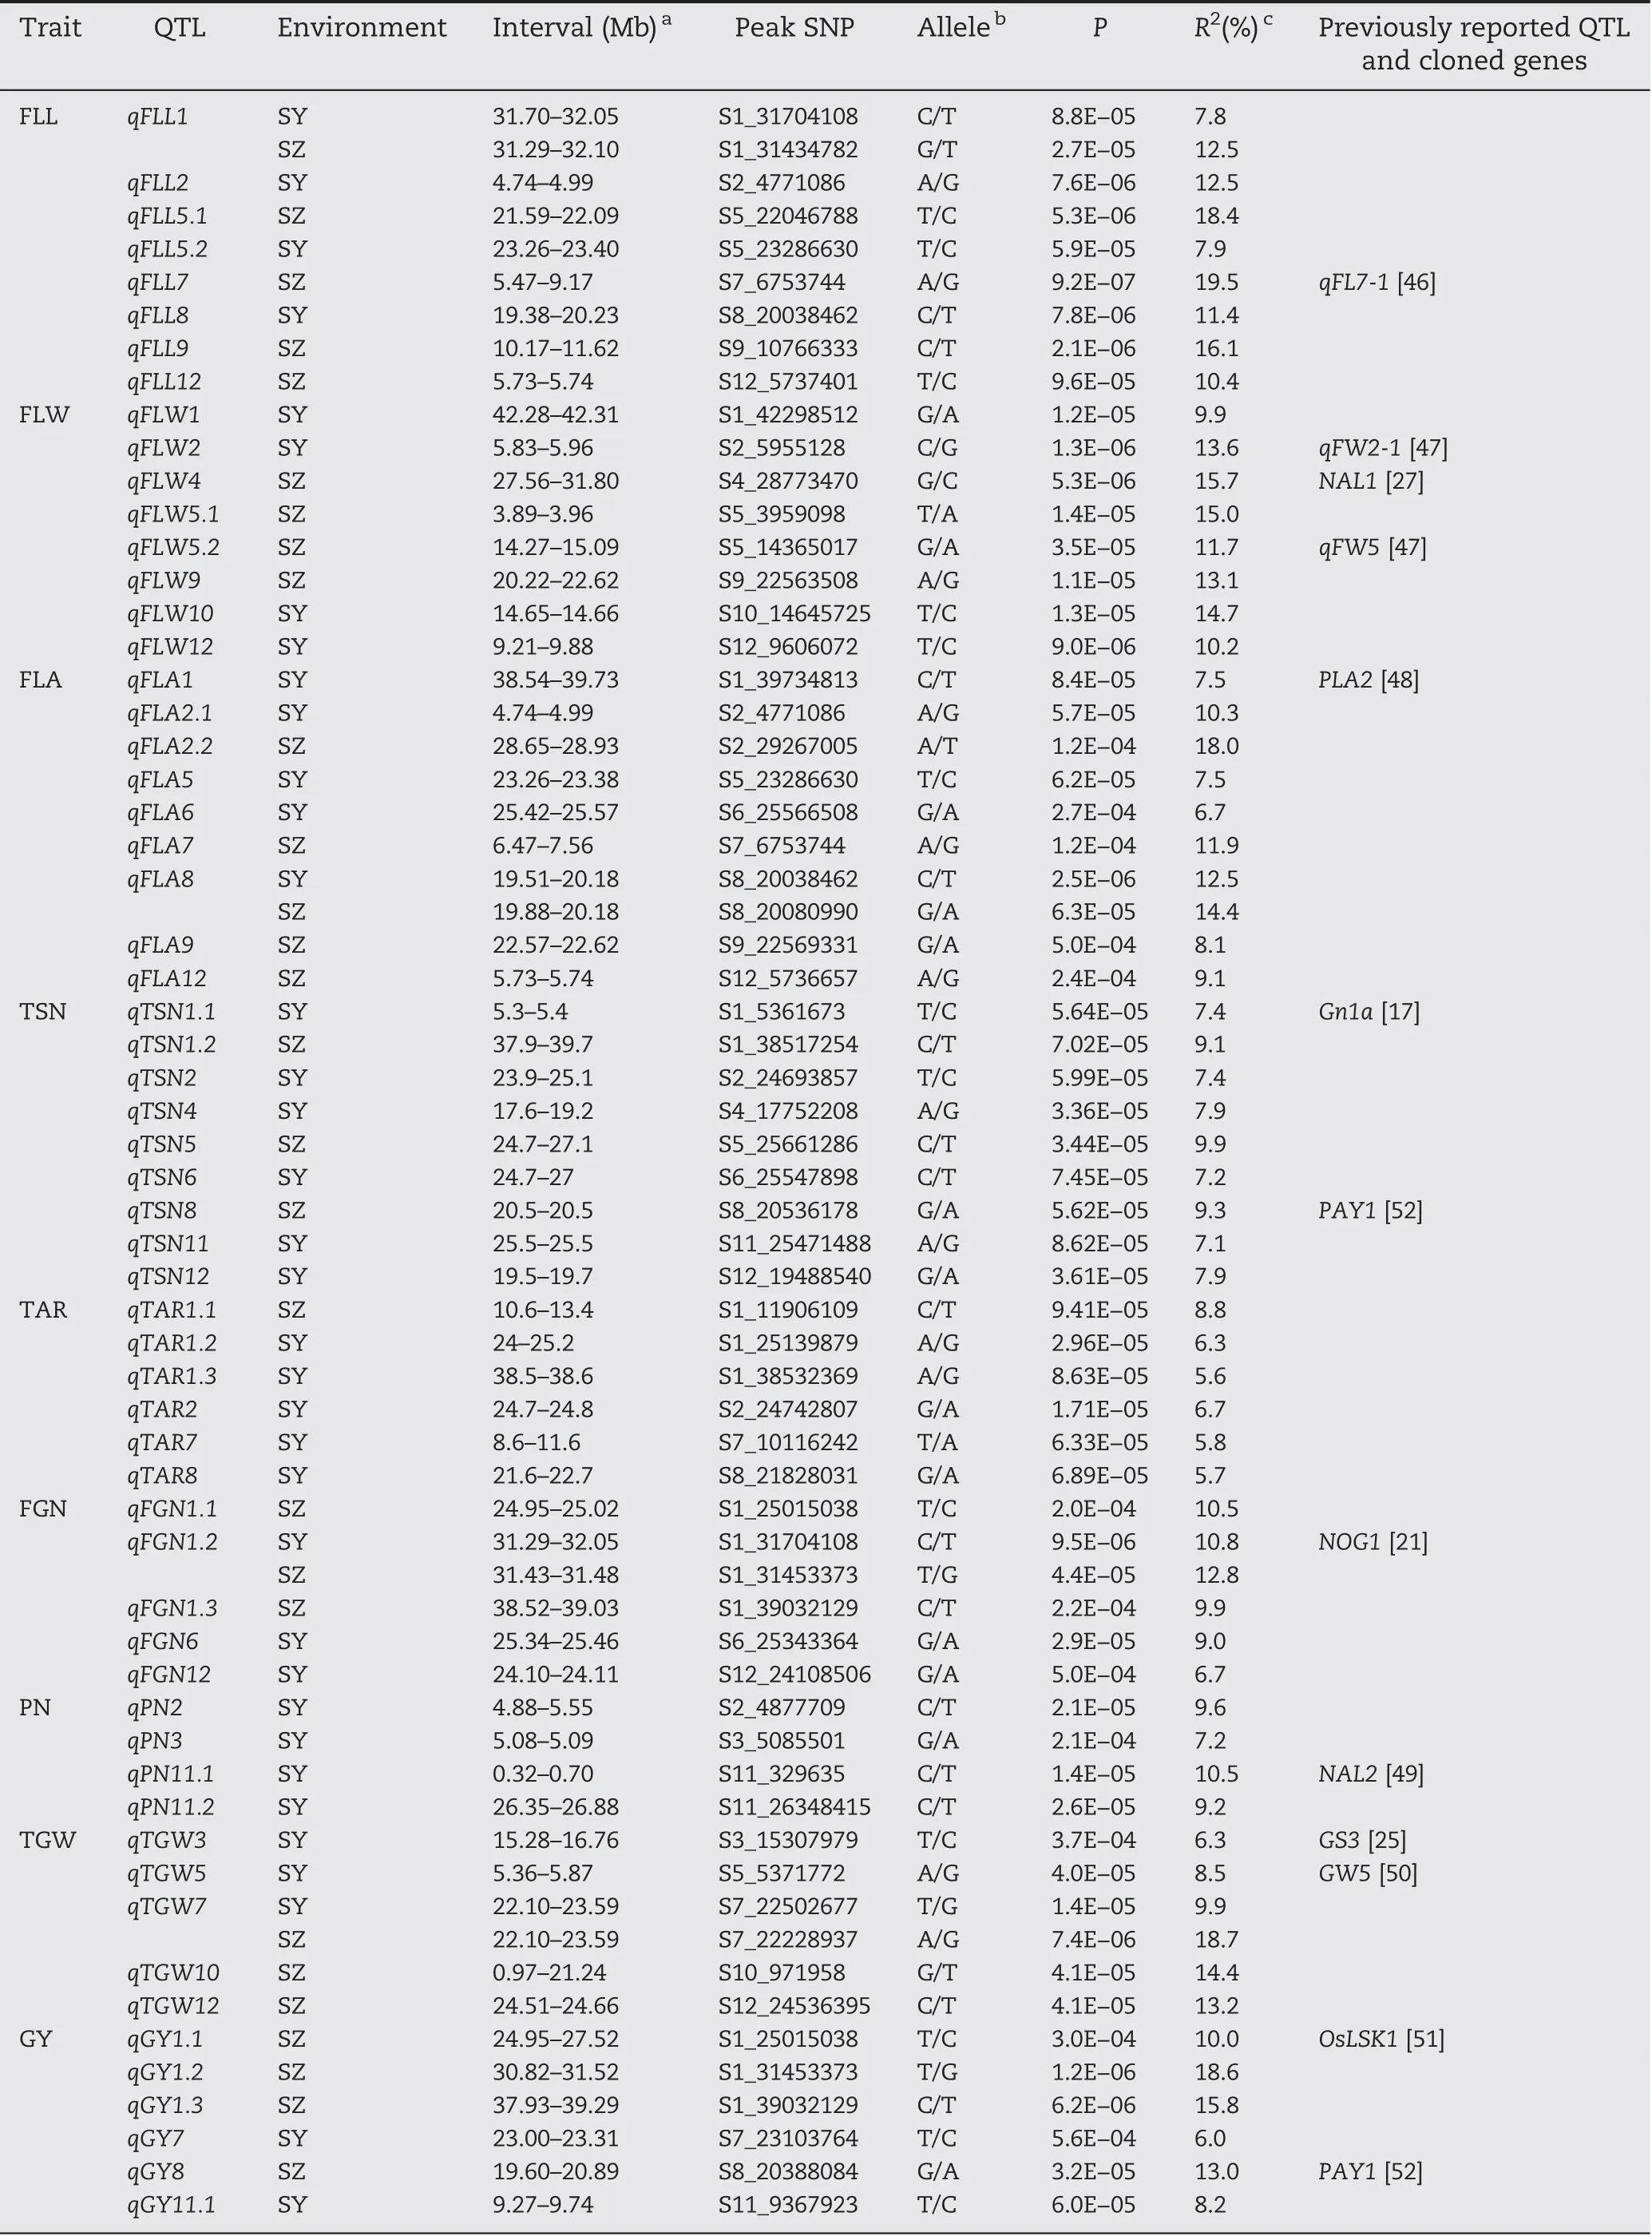
Table 4-QTL identified for sink-,source-,and yield-related traits by GWAS in two environments.
4. Discussion
4.1. Most QTL showed environment sensitivity
Interaction between QTL and environment exerts great effects on plant growth and development [44], and consequently on grain yield and its components such as grain-filling percentage and panicle number [45]. Of 70 QTL for 11 source-sink and yieldrelated traits identified in SY and SZ, only five (7.1%) (qHI6,qTGW7,qFLA8,qFGN1.2,and qFLL1)were consistently detected in both environments. The greater mean flag leaf size of all accessions in SZ than in SY, but the opposite trend for GY and HI,may be attributed to differing environmental factors in SY and SZ.Given that the 272 accessions were planted on July in SZ and December in SY,the temperature and day length in SZ during the growing period were higher and longer than those in SY. The higher temperature and longer day length as well as high nitrogen application in SZ may have promoted the vegetative growth of the plants, resulting in larger biomass including flag leaf size. However, the oversized vegetation might adversely affect the final formation of sink and yield-related traits because of shading,insufficient ventilation,partial lodging,etc.Given that QTL × environment interaction is one of the major factors limiting the use of QTL for marker-assisted selection (MAS) in rice, caution should be paid attention to applying QTL mapping information in breeding for yield-related traits by MAS in the presence of large environmental effects as seen in this study.The five QTL consistently identified in the two different environments may be effective for enhancing grain yield via MAS.
4.2.Comparison of QTL detected in this study with previously reported QTL and cloned genes
Of the 70 QTL for source,sink and yield-related traits, 11 QTL were located in the same or adjacent regions containing previously reported cloned genes in rice (Table 4). For example, qFLL7 affecting FLL was mapped in the region of 5.47-9.17 Mb on chromosome 7, which harbored the previously reported qFL7-1 for FLL [46]; qFLW2 and qFLW5.2 affecting FLW, located in the regions of 5.83-5.96 Mb on chromosome 2 and 14.27-15.09 Mb on chromosome 5, were co-located with qFW2-1 [47] and qFW5 [47] for FLW, respectively; qFLW4 in the region 27.56-31.80 Mb on chromosome 4 was co-located with NAL1, a gene influencing leaf morphogenesis by regulating polar auxin transport [27]; qFLA1 in the region of 38.54-39.73 Mb on chromosome 1 was co-located with the previously reported PLA2 gene regulating leaf initiation and maturation in rice [48]; qTSN1.1 in the region 5.3-5.4 Mb on chromosome 1 was co-located with Gn1a regulating rice grain production by increasing spikelet number per panicle[17];qFGN1.2 in the regions 31.29-32.05 Mb on chromosome 1 was co-located with NOG1 controlling grain yield by increasing grain number per panicle [21]; qPN11.1 in the region 0.32-0.70 Mb on chromosome 11 was close to NAL2 affecting leaf, spikelet, tiller, and lateral root development[49]; qTGW3 in the region 15.28-16.76 Mb on chromosome 3 and qTGW5 in the region 5.36-5.87 Mb on chromosome 5 were co-located with GS3 [25] and GW5 [50] associated with rice grain size and grain weight, respectively; QGY1.1 for GY in 24.95-27.52 Mb on chromosome 1 was co-located with OsLSK1,an S-domain receptor-like kinase gene influencing grain yield[51]; qTSN8 for TSN, qGY8 for GY, and qHI8 for HI were colocated in the region 19.60-20.89 Mb on chromosome 8,harboring PAY1 for plant architecture and grain yield of rice[52]. Allelic correspondences of the above QTL for yield and related traits detected in this study with previously reported genes await further verification using fine mapping and QTL cloning.
4.3. Candidate gene identification for important QTL
In genetic association analyses of complex traits,determining the correct P-value threshold for statistical significance is critical for controlling the number of false-positive associations. Theoretically, the threshold can be calculated by 0.05/number of SNPs, but this P-value is too strict and seldom adopted in most GWAS. QTL assigned at a higher threshold are more reliable, but some QTL will be missed owing to type II error. In contrast, lower thresholds may produce false positive results owing to type I error. The genome-wide significance P-value threshold of 1 × 10⁻⁴has been adopted by many GWAS[29,30].In the present study,to further investigate the extent to which inconsistent QTL detection across the two environments could be attributed to type II error, all QTL identified in both environments were accepted at a significance threshold of 1 × 10⁻⁴, and just five QTL consistently identified in both environments were selected for further candidate gene analysis. GWAS and haplotype analysis of candidate genes revealed 24 candidate genes governing the five stable QTL (qHI6, qTGW7, qFLA8,qFGN1.2,and qFLL1)influencing grain yield-related traits.

Fig.3- Haplotype analysis of targeted genes associated with qTGW7.(A).LD block surrounding the peak on chromosome 7.Dashed lines indicate the candidate region for the peak.(B-G).Boxplots for thousand-grain weight(TGW)based on haplotypes for candidate genes using SNPs located in the 5′flanking sequences of genes ≤2 kb from the first ATG,promoter region(type II).The**and***denote significance of ANOVA at P <0.01 and P <0.001,respectively.Letters on histograms(a,and b)are ranked by Duncan's test at P <0.05.Cyan and orange colors indicate Sanya and Shenzhen,respectively.
The region 2.89-3.19 Mb on chromosome 6,harboring qHI6,contains seven candidate genes,including Rice Flowering Locus T 1 (RFT1, Os06g0157500) [53] and Heading date 3 (Hd3a,Os06g0157700) [54] that encode mobile flowering signal proteins. Compared with Zhonghua 11 (a recurrent parent),near-isogenic lines (NILs) carrying the RFT1 allele from Zhenshan 97 showed delayed heading date and increased plant height, grain weight, grain number, and grain yield,indicating that RFT1 played an important role in rice growth and development[53].In the present study,seven haplotypes of RFT1 were identified and haplotypes TGG and TGN showed significantly larger HI than haplotype CGN in both environments (Fig. 2-B), suggesting that RFT1 (Os06g0157500) is a likely candidate gene of qHI6 that probably affects HI in rice.
qTGW7, affecting TGW, was identified in the region of 22.10-23.59 Mb on chromosome 7, containing six candidate genes. Of the six, the most likely candidate gene for qTGW7 was OsBZR1 (Os07g0580500), a brassinosteroid (BR) signaling factor gene. Compared with the wild type, OsBZR1 overexpressing lines showed increased rice grain width,length,and thickness and a 3.4% increase in TGW as well as a 21.9%increase in grain number per panicle [55]. In contrast, RNAi lines showed reduced grain length, thickness, and width and a 4.4% decrease in TGW and 22.8% decrease in grain number per panicle compared with a control [55]. For this reason,OsBZR1 (Os07g0580500) is considered as the most likely candidate gene of qTGW7.
Of the five candidate genes for qFLA8, VIRESCENT 5B (OsV5B,Os08g0416900)encodes a J-like protein with four transmembrane domains and is the most likely candidate gene. OsV5B plays a specialized role in regulating proteins of protochlorophyllide oxidoreductase abundances during leaf emergence and expansion [56]. In the present study, three haplotypes of OsV5B were detected and haplotype G was associated with significantly larger FLA than haplotypes N in both environments(Fig.4-D).
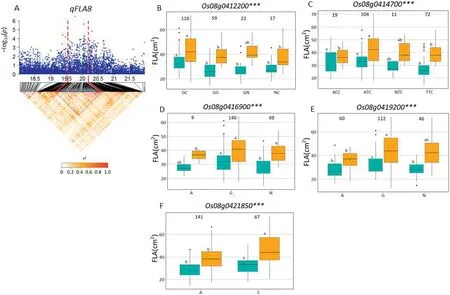
Fig.4- Haplotype analysis of targeted genes associated with qFLA8.(A).LD block surrounding the peak on chromosome 8.Dashed lines indicate the candidate region for the peak.(B-F).Boxplots for flag leaf area (FLA)based on haplotypes for candidate genes using SNPs located in the 5′ flanking sequences of genes ≤2 kb from the first ATG,promoter region(type II).The***denote significance of ANOVA at P <0.001.Letters on histograms(a,and b)are ranked by Duncan's test at P <0.05.Cyan and orange colors indicate Sanya and Shenzhen,respectively.
A QTL cluster (qFGN1.2 and qFLL1) in the region of 31.29-32.10 Mb on chromosome 1 was detected, containing six candidate genes. Among these, NUMBER OF GRAINS 1 (NOG1,Os01g0752200), encoding an enoyl-CoA hydratase/isomerase,contributed to grain yield by increasing grain number per panicle[21]. Two haplotypes of NOG1 were found and haplotype CG showed significantly larger FLL and more FGN than those of haplotypes GA (Fig. 5-F, I). In the NOG1-deficient rice cultivar Zhonghua 17,introgression of NOG1 enhanced rice production by 25.8%[21].Further study indicated that sequence variation in the promoter region decreased the levels of NOG1 expression,resulting in increased rice spikelet number per panicle and grain yield per plant. Relative expression levels of NOG1 in the leaves and young panicles of Guihao 2 were significantly higher than those of the introgression line SIL176 with lower grain number and grain yield in the genetic background of the highyielding Xian cultivar Guihao 2[21].In that study,comparison of NOG1 haplotypes using SNPs located in the promoter region showed significant differences for FGN and FLL. To date, NOG1 has not been found to be associated with FLL. Reverse genetic approaches might be used to test whether NOG1 is the candidate gene of qFLL1.
4.4. Application in rice breeding for high yield potential
In rice breeding history, harmony between source and sink plays an important role in guiding breeding for developing super high-yielding rice varieties. Among them, the upper three leaves, especially the flag leaf, are the primary sources in rice. Significant positive correlations between flag leaf characteristics and grain yield component traits have been reported in rice[6].The high positive correlations of FLL,FLW,and FLA with FGN and TSN (Fig. 1-B), and those of FLW and FLA with TGW in both SY and SZ(Fig.1-B)were in agreement with previous studies [1,6,57,58]. However, both positive and negative correlations between flag leaf characteristics and grain yield itself have been reported in previous studies[1,3,6].In the present study, no significant correlations between the three flag leaf traits and GY except between FLW and GY in SZ were observed in the two environments (Fig. 1-B). In crop physiology,it is found that when leaf area is too large,mutual shading of leaves reduces photosynthetic capacity, and the negative correlation between leaf area and photosynthetic rate ultimately leads to non-increase or decrease in production [3]. In our study, the non-significant correlation of leaf size with GY might also be attributed partly to its negative correlations with PN (Fig. 1-B). The significant positive correlations of the three flag leaf traits with GWP (Table 3)were also consistent with previous studies [1,57]. These results suggest that increasing source capacity by enlarging leaf area might increase GWP,but not necessarily grain yield,by reducing PN. A whole-system view of source-sink balance is more important than separately emphasizing individual source or sink traits. Breeding of high-yielding rice cultivars should seek a balance between source and sink capacities.
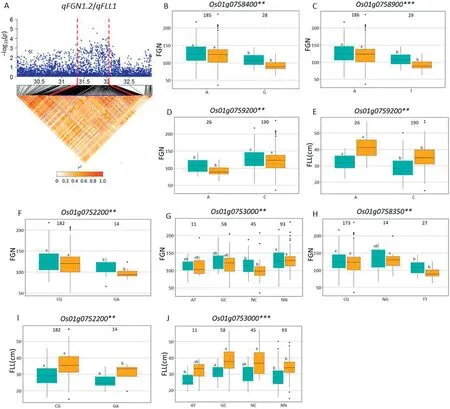
Fig.5- Haplotype analysis of targeted genes associated with qFGN1.2 and qFLL1.(A).LD block surrounding the peak on chromosome 1.Dashed lines indicate the candidate region for the peak.(B-E).Boxplots for filled grain number per panicle(FGN)and flag leaf length(FLL)based on haplotypes for candidate genes using non-synonymous SNPs within the CDS region(type I).(F-J)Boxplots for FGN and FLL based on haplotypes for candidate genes using SNPs located in the 5′flanking sequences of genes ≤2 kb from the first ATG,promoter region(type II).The**and***denote significance of ANOVA at P <0.01 and 0.001,respectively.Letters on histograms (a, and b)are ranked by Duncan's test at P <0.05.Cyan and orange colors indicate Sanya and Shenzhen,respectively.
qTSN4 (NAL1) showed pleiotropic effects in regulating the development of multiple traits related to source (leaf width,leaf chlorophyll content, photosynthetic efficiency) and sink(spikelet number per panicle) in a different genetic background [26-28]. In a physiological study, qTSN4 enlarged leaf area,and in some cases photosynthetic capacities and starch reserves,of the top 3-4 phytomers of the main tiller[59].This change was accompanied by earlier cessation of tillering,which coincided with the initiation of these phytomers, and increased spikelet number per panicle[59].From a physiological view point, qTSN4 could explain the cluster of QTL simultaneously influencing source and sink traits. In this study, Os01g0752200 (NOG1) is considered as the most likely candidate gene of qFGN1.2 and qFLL1. Haplotypes analysis revealed haplotype CG was associated with significantly larger FGN and FLL than haplotypes GA in Xian accessions.Two Xian varieties carried haplotype CG, CC176 (with mean FGN 238.8 in SZ and 199.8 in SY; mean FLL 38.7 cm in SZ and 32.5 cm in SY) and CC231(mean FGN 177.8 in SZ and 217.5 in SY; mean FLL 38.5 cm in SZ and 33.9 cm in SY) having more FGN and longer FLL were identified in this panel. Haplotype CG of the Os01g0752200 from the two Xian accessions showed larger additive effect for increased FGN and FLL in Xian accessions. Thus, these favorable alleles from CC176 and CC231 could be introgressed by MAS into Geng and other Xian varieties to develop super high-yielding rice cultivars with ideal plant type and harmony between sink and source.
5. Conclusions
GWAS identified 70 QTL for 11 source-,sink-,and yield-related traits. Five of these QTL (qFGN1.2, qFLL1, qHI6, qTGW7, and qFLA8) were consistently detected in four chromosome regions in two environments, and five QTL clusters were found to simultaneously affect source-, sink-, source-sink relationship-, and yield-related traits. Twenty-four candidate genes for five loci qFGN1.2/qFLL1, qHI6, qTGW7, and qFLA8 were identified and the most likely candidate genes were assigned based on haplotype analysis and functional annotation. These results will enrich knowledge of genetic relationships among source-,sink-,and yield-related traits in rice and provide genetic information for high-yield-potential rice breeding by MAS.
Supplementary data for this article can be found online at https://doi.org/10.1016/j.cj.2019.05.001.
Acknowledgments
This work was funded by the National Key Research and Development Program of China (2016YFD0100301), the National Natural Science Foundation of China(31671602)and the Agricultural Science and Technology Innovation Program and the Cooperation and Innovation Mission (CAASZDXT2018001).
- The Crop Journal的其它文章
- Brief Guide for Authors
- Rapid generation advance(RGA)in chickpea to produce up to seven generations per year and enable speed breeding
- Transcriptomic responses in resistant and susceptible maize infected with Fusarium graminearum
- Relay-intercropping soybean with maize maintains soil fertility and increases nitrogen recovery efficiency by reducing nitrogen input
- Genetic analysis and QTL mapping of stalk cell wall components and digestibility in maize recombinant inbred lines from B73 × By804
- Performance and yield stability of maize hybrids in stress-prone environments in eastern Africa