
Multiple hierarchy risk assessment with hybrid model for safety enhancing of unmanned subscale BWB demonstrator flight test
2020-01-09 01:04:56YiLUShugungZHANGZjingZHANGXunZHANGPngTANGShnFU
CHINESE JOURNAL OF AERONAUTICS 2019年12期
Yi LU, Shugung ZHANG, Zjing ZHANG, Xun ZHANG, Png TANG,Shn FU
a Department of Automation, School of Electronic Information and Electrical Engineering, Shanghai Jiao Tong University,Shanghai 200240, China
b School of Transportation Science and Engineering, Beihang University, Beijing 100083, China
c Airworthiness Technologies Research and Management Center, China Aviation Polytechnology Establishment, Beijing 100028, China
d China Electronic Product Reliability and Environmental Testing Research Institute, Guangzhou 510610, China
e School of Energy and Power Engineering, Beihang University, Beijing 100083, China
Abstract To explore the low-speed characteristics of the Blended-Wing-Body (BWB) configuration for future civil aircraft, a series of unmanned subscale demonstrators have been developed and tested by our research team. During this process, specific safety risks deriving from uncertain design features, system unreliability, and insufficient personnel experience caused continuous flight test mishaps and the risk mechanism was not clear.Local and trial-and-error learning driven safety improvements took few effects on mishap prevention, so our focus was turned to look for systematic safety strategies. This paper establishes a systems theory based hybrid model to integrate the physical system reliability analysis techniques with the system dynamics method for illustrating the multiple risk interactions of the demonstrator flight test involving organizational, human resource and technical system factors. Using the prior BB-5 demonstrator as a case, the hybrid model simulation represents its historical risk evolution process, which verifies the model rationality.Derived risk control strategies reduced the mishap rate of a new demonstrator called BB-6 Sprit.The paper also shows the extended hybrid model can be applied on safety management of unmanned aerial vehicles from the initial period of vehicle development.
KEYWORDS Blended-wing-body;Demonstration flight test;Markov analysis;Risk assessment;Strategy experiment;System dynamics;Systems theory
1. Introduction
Scaled demonstration implements flight test in real environment by using manned or unmanned air vehicle according to the dynamic similarity law to study and verify the aerodynamics,flight dynamics characteristics and feasibility of flight control law of new aircraft concepts.1,2Unmanned subscale demonstration is an investigation approach for aircraft configuration exploration with a long history. It arose in 1940s and experienced rapid development during recent decades due to the telemetering and data transmission techniques.3-5Compared to numerical simulation and full-scale wind tunnel test,unmanned subscale demonstration has advantages of short development cycle and low cost. It plays an important role in research and development of aerospace cutting-edge technology, such as the blended-wing-body, hypersonic vehicle, and the integrated aircraft and propulsion systems etc. It has attracted growing concern by researchers in the field of aviation science and engineering.1,6,7Moreover, as the subscale demonstration is often located in the early stage of aircraft development, the development targets such as layout innovation, new system introduction and flight envelope expansion have brought significant risks to its flight test activities. Compared with manned flight tests, organizations engaged in unmanned subscale verification always have inherent defects in profession composition, technical and practice experience,system engineering and safety management, especially when they face low-cost, short-cycle constraints in testbed engineering. Consequently, the mishap rate was much higher than its manned peers. Gong et al.investigated 99 unmanned subscale hypersonic vehicle mishaps (e.g., X-15, X-37 and X-43A) and identified six hazardous factors which involved system malfunction, hazardous component, protective system, system compatibility, undesired state, and human error. This study also indicated the needs to introduce systematic approach to guide the demonstrator development and operation.8
Since 2007, to investigate the low-speed characteristics of Blended-Wing-Body (BWB) aircraft, our joint research team initialized projects to develop and test a set of BWB unmanned subscale demonstrators. Due to risks pervading in different levels,frequent mishaps in flight tests were encountered.Some relevant safety data for risk mechanism analysis has been collected by us continuously in previous studies.4,9,10They formed the numerical basis for further risk analysis in a systematic way. In this paper, a systematic approach is introduced to establish a hybrid model for BWB demonstrator flight test risk assessment. This model covers multi-level risk characteristics,identifies flight test risk mechanism, and evaluates the benefits of risk control strategies to enhance the demonstrator safety.
2. Safety vision on BWB demonstration flight
2.1. Case studies of BWB subscale demonstration
Compared to traditional tailed aircraft, the BWB aircraft has reduced infiltration area, lower aerodynamic drag and better fuel economy.11-13However, its unique design features also bring new challenges on flight dynamics and control.BWB aircraft has no conventional horizontal stabilizer and a set of elevons are located on the trailing edge of the wings. It may lead tight coupling of forces and moments on BWB,called‘‘sagging phenomenon” in takeoff and landing phases.9Currently, a Hybrid-Wing-Body (HWB) has become a derived concept to increase the aerodynamic efficiency by inducing a tightly aircraft-propulsion system coupled configuration, and it has attracted new attentions in the field of BWB concept.14
In order to verify the feasibility of BWB configuration under low-speed status in a low-cost way, many institutions have developed unmanned subscale demonstrators with adopting data collection and transmission system, small propulsion system and light weigh airframe, such as NASA, Cranfield University,Hamburg University,Florida Institute of Technology University, COMAC and Beihang University et al.15-18Due to different demonstration goals, they owned a broad range of the Maximum Take-Off Weight (MTOW) and various system complexities. However, due to the adverse effects of mentioned risk on the subscale demonstration, some of them have represented poor safety status.19,20
For our research team, the basic configuration parameters of prior BWB demonstrators are shown in Fig. 1 and their safety records were listed in Table 1. In this paper, the Class-A mishap of BWB demonstrator is defined to cover severe accidents causing total loss of vehicle,serious overhaul of vehicle airframe, damage of high-value test equipment, personal injury or ground property loss. Especially, using the BB-5 demonstrator as an example,the value of the airborne mission payload(e.g.,malfunction flight control system,airborne data transceiver, airspeed sensor, etc.) have exceeded the testbed manufacturing costs (more than 10 times). How to get out of the ‘‘low-cost platform vs. high-value payload” predicament commonly seen in subscale demonstration was a challenging concern for us.
2.2. Systematic view based approach on demonstrator flight test safety
2.2.1. Limitation of current accident models
At present,there are various accident models in the field of system safety, such as reason model, Human Factors Analysis and Classification System (HFACS), Systems-Theoretic Accident Model and Processes (STAMP), Functional Resonance Analysis Method(FRAM),etc.21-24However,the above methods were not applicable directly to solve our problems. The main reasons involve: (A) the linear event-chain accident model is the theoretical foundation of many probability risk analysis techniques, such as Fault Tree Analysis (FTA) and Bayesian approach, which supports the establishment of complex system safety assessment and assurance techniques widely.25They have been widely adopted in civil aviation type certification (e.g., SAE ARP-4754/4761).26However, those methods focus on component reliability improvement for failure prevention. When facing non-failure factors such as software, human factor even organizational errors, the limitations of those methods have been seen commonly due to lacking of the probability statistics fundamentals.The developed event-chain based accident model such as Reason and HFACS models aims to identify the risk mechanism including organizational and human factors but they just communicate their analysis results in a textual way, and cannot describe the master-subordinate relationship and time series characteristics between factors. (B) similarly, although the systems theory based model such as STAMP and FRAM use hierarchical loops or functional network to describe the risk interactions,they still present the risk mechanism in a static and structured way. They are more suitable for formal presentation of accident investigation findings to replace traditional textual description,but they do not aim on risk assessment and safety strategy evaluation, especially in a quantitative way.
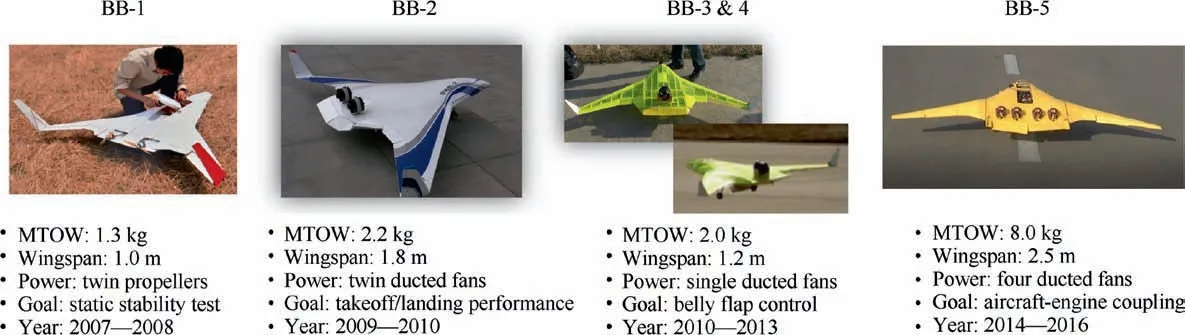
Fig.1 Basic descriptions of prior BWB demonstrators developed by our research team.
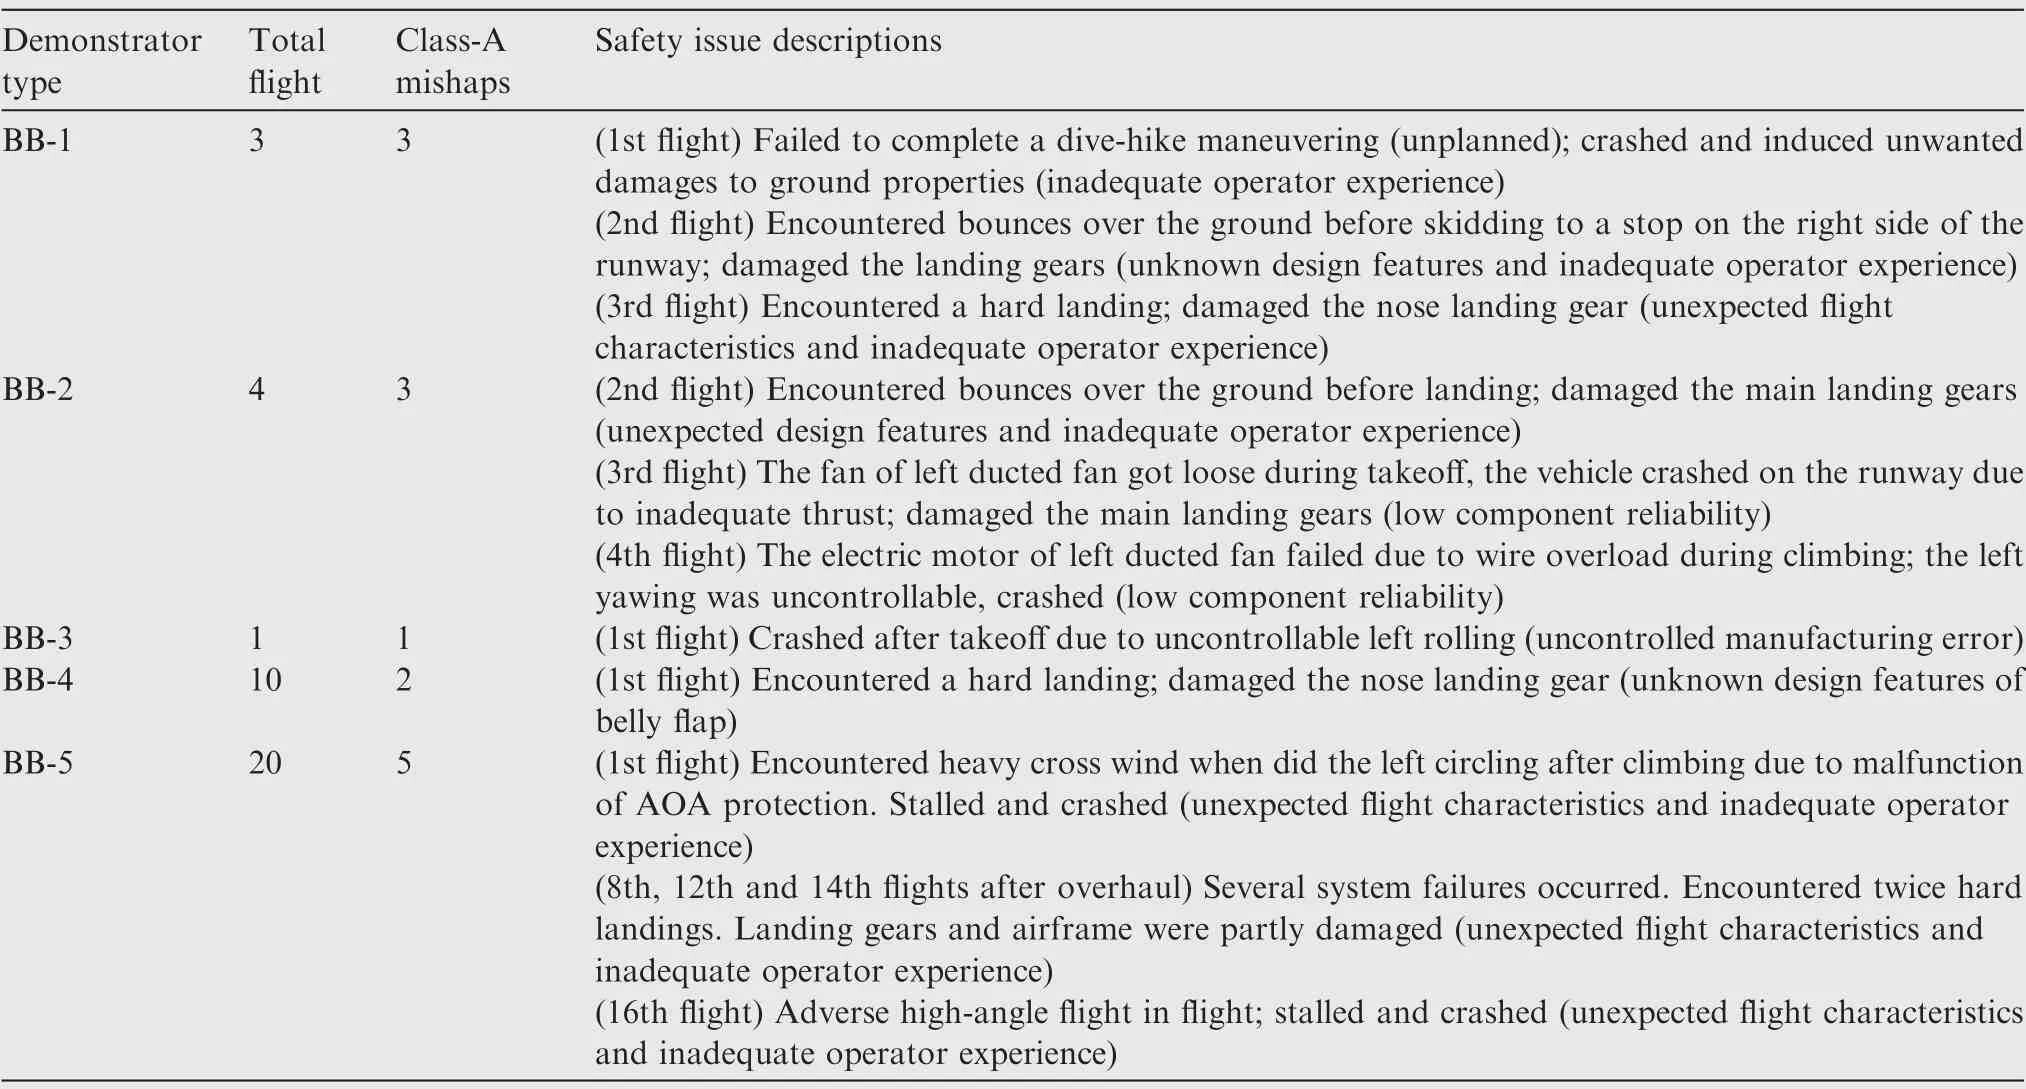
Table 1 Safety records of prior BWB demonstrators developed by our research team.
In this study, compared to the complexity and cost for developing a full-sized manned BWB aircraft porotype, the direct application of the above-mentioned safety assessment methods on the BWB demonstrators will induce unacceptable development period and cost.Meanwhile,due to using a large number of aero-model level cots, non-certified supplier systems, and handmade airframe under low cost constraints, the design assurance level of safety critical system is not possible to be determined.Even worse,insufficient technology accumulation, inadequate personal training and incomplete technical procedures are widely existed in the processes of demonstrator development and operation, which have adverse impacts on the feasibility of flight test risk control.
2.2.2. Hybrid model based risk assessment method
This paper introduces a systems theory based safety vision on demonstrator flight test and regards the development-opera tion-maintenance processes of the BWB demonstrator as controlled behavior of a ‘‘social-technical system” involving relevant organizational, human resource and technical factors.Therefore, the flight test mishap appears as the emergency property of such system. In this case, it covers the mentioned accidental factors, especially critical risk interactions beneath them as shown in Fig. 2.
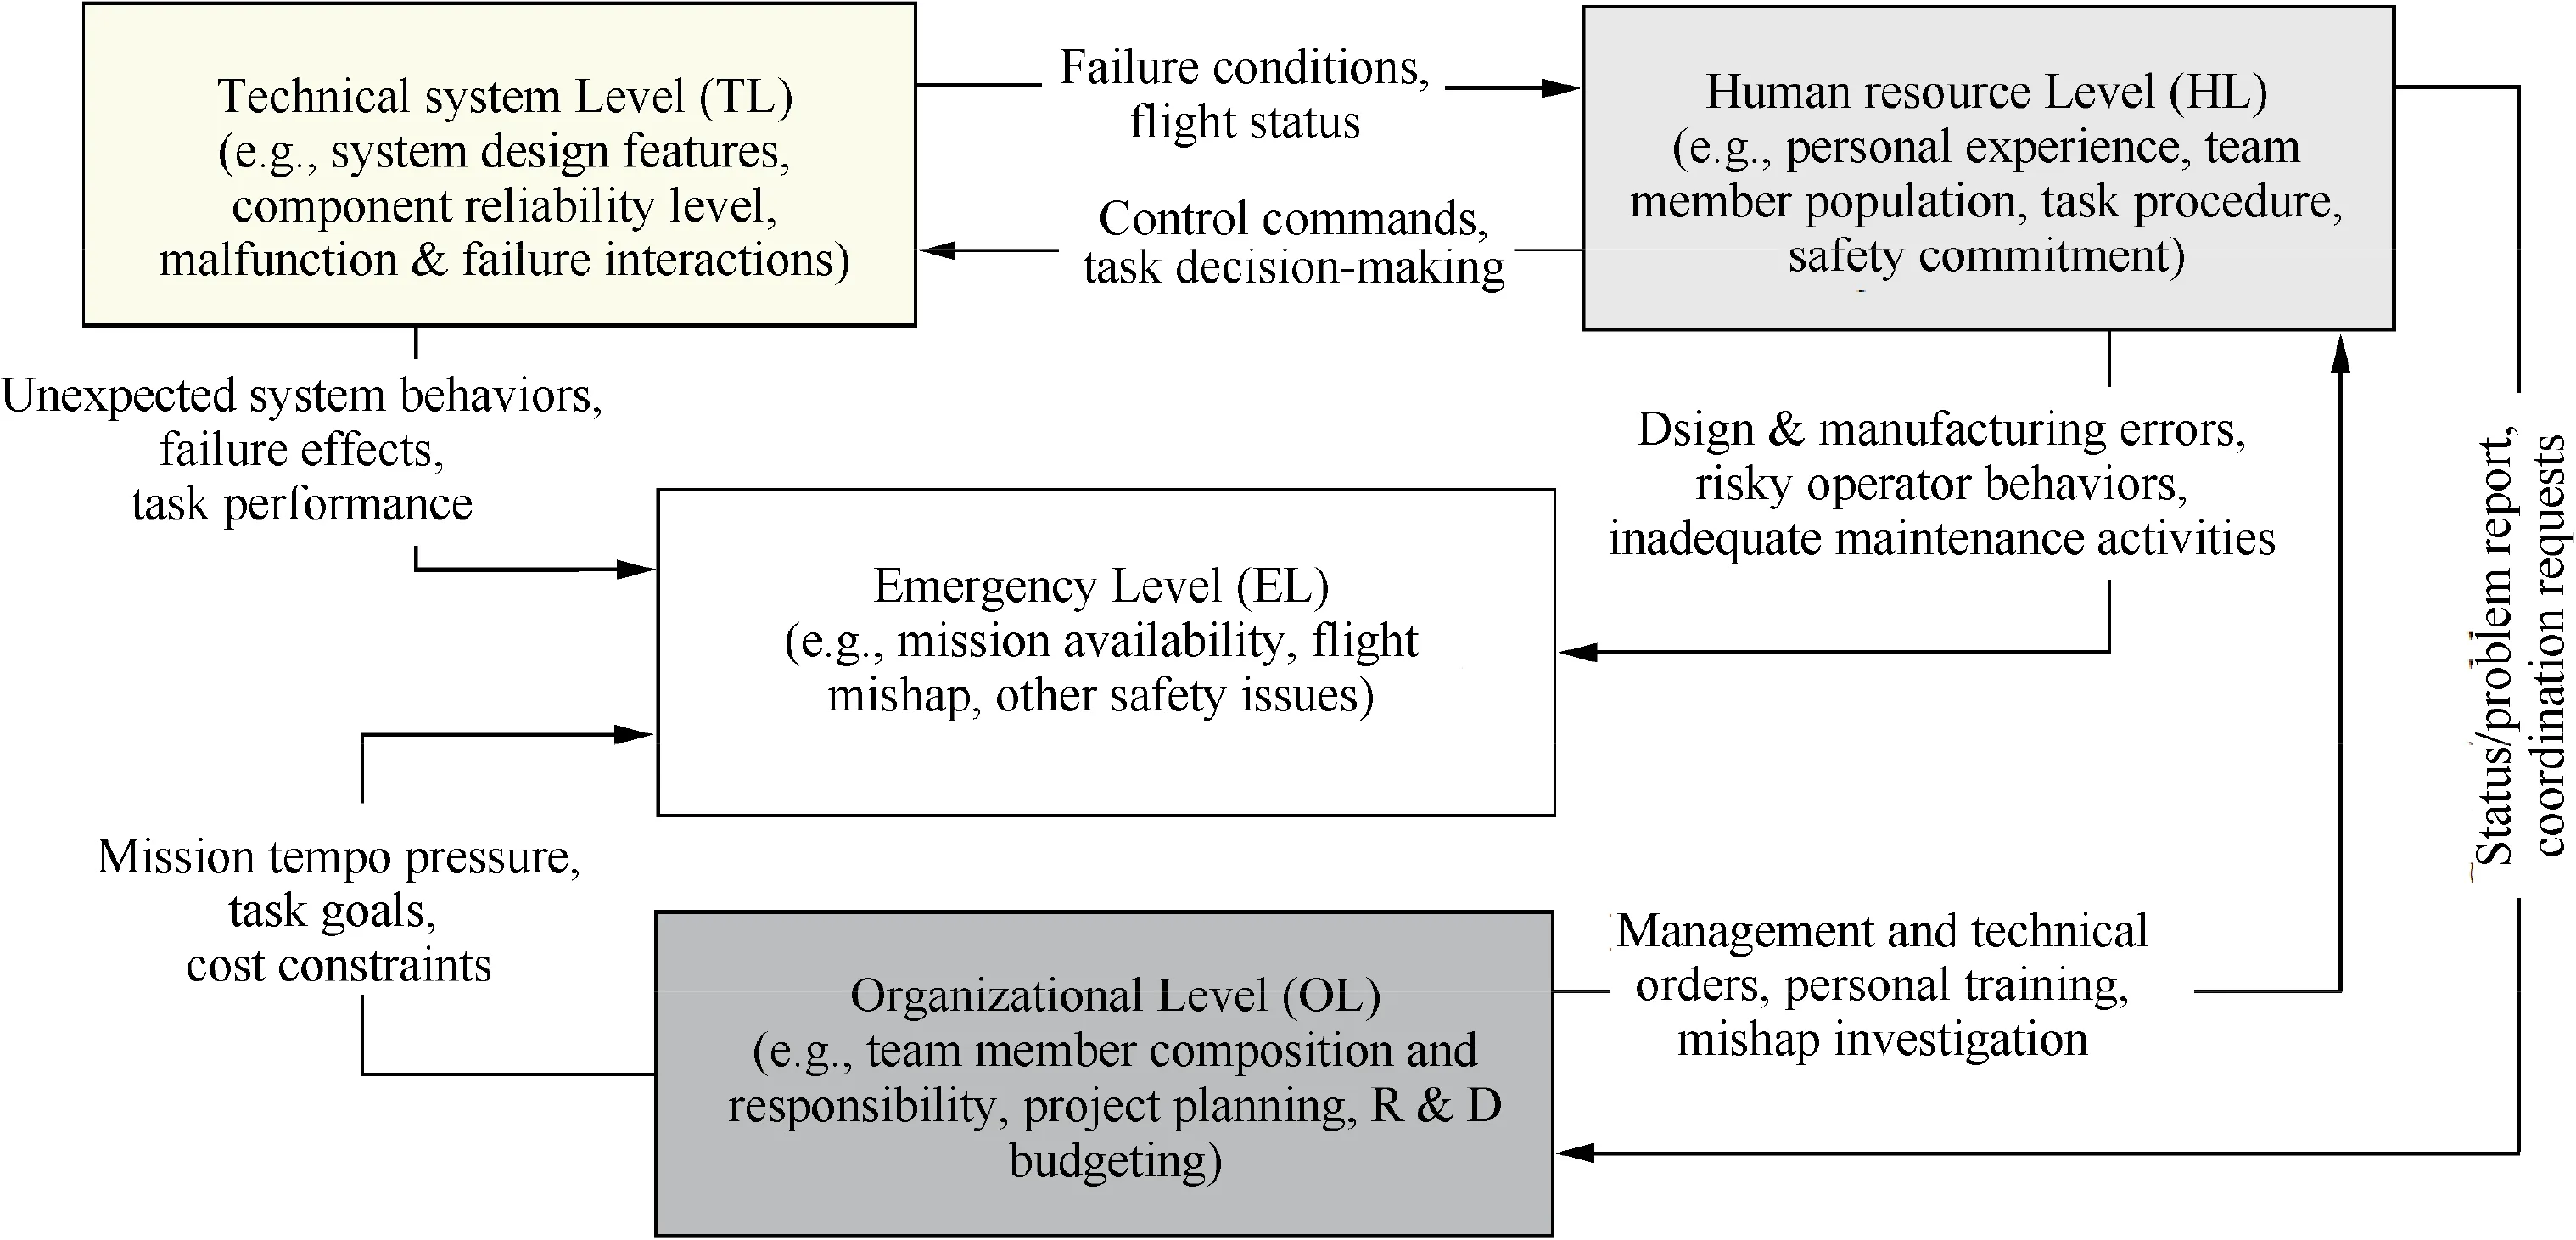
Fig.2 Risk interaction between hierarchical factors involved in BWB demonstrator flight test.
Currently, there is few prior studies on the risk assessment of new aircraft configuration demonstrator flight test. This study introduces a hybrid model to assess such risks. It grounded on the System Dynamics (SD) approach deriving from the theory of nonlinear dynamics and feedback control.SD is a mathematical method used to understand and analyze behaviors of complex systems in the systems theory view.27,28It provides new insights into organizational risk issues such as aerospace,transportation,chemical industry and other engineering fields.10,29-31. It uses the reinforcing loop, balancing loop and delay links as basic units to model the interaction between the risk factors of different levels in form of Causal-Loop Diagram (CLD). Especially, as a feature of hybrid model,the reliability analysis on BWB demonstrator technical system derived from the probabilistic risk assessment are systematically incorporated into a comprehensive model involving organizational and human resource factors as a whole.After quantitative transferring and necessary verification test of variable and parameter, the hybrid model simulates behavior of such social-technical system with the language of Stock-Flow Diagram (SFD). Referring to supporting data collected,the plausibility of simulation is verified by statistical validation test to replicate historic risk evolution process of our research team.Finally,this model generates risk control strategies for a new demonstrator called BB-6 Sprit and its safe flight records demonstrated the effectiveness of this approach,especially in a view of mid-and-long term.Aiming for other subscale demonstration and Unmanned Aerial Vehicle (UAV) development and operation risk control, the potential application of this hybrid model is also discussed.
3. BWB demonstrator flight test risk causation modeling
3.1. Emergency and organizational level risk causation
To regard the key elements of organizational management characteristics(i.e.in research team level),basic feedback relations in the Emergency Level (EL) and Organizational Level(OL) are identified. The causal loop diagram representing risk causations is shown in Fig. 3. Referring the loop dominance,the identified feedback loops can be categorized into two groups as following:
(1) R1 and B1 loops.
In this group,the R1 loop describes the scheduled total mission duration (OL3, the sum of the time required for BWB demonstrator in equipment calibration, testing and function verification in fight) and the scheduled total flight sorties(OL4, more extra sorties required for low speed characteristic demonstration due to the battery capacity limitation of propulsion system)drives the demonstrator purchasing.In this case, more demonstrator will be helpful for ensuring the flight test milestone and offsetting the effects of demonstrator mishap on project progress. Meanwhile, the B1 loop describes the demonstrator design modification process enabled by mishap investigation(OL6).When combined with the system reliability improvement, it helps to achieve the goal of flight test tasks with less losses.
(2) R2 and B2 loops.
The R2 loop describes the suppression of system failures(TL2)on the mission duration of each sortie(OL5)under high mission pressure. It directly increases the requirement for demonstrator quantity (OL8). Meanwhile, the B2 loop shows the system reliability may remain at a relatively stable level(TL2) due to project budget constraints (OL1.2). The above two loop groups illustrate the risk mechanisms that how BWB demonstrator mishap could be affected by the dual pressure from task milestone and project budget.
3.2. Human resource level risk causation
In the Human resource Level (HL), critical human factor induced risk causations are identified, as shown in Fig. 4.Referring the loop dominance, the identified feedback loops can be categorized into two groups as following:
(1) B1, B2 and B3 loops.
The primary risk consequence of Development and Manufacturing (D&M) member and maintainer errors is the induction of technical system failures (B1 and B2 loops), which are always combined with unsafe acts of operators(B3 loop).This model also describes two main routines to accumulate team member experience: a. the initial experience achieved by the academic education and technical training provided by research team; b. addition experience increase gained by spending time on tasks and learning from the mishap investigation reports. It was often known as ‘‘self re-learning” in literatures on training.32,33
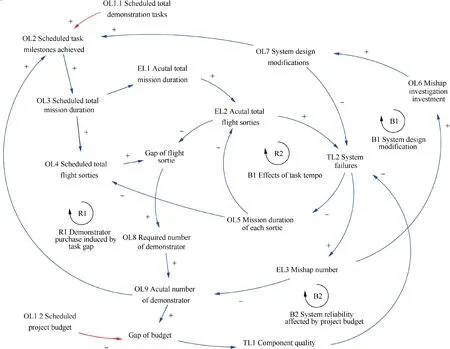
Fig.3 BWB demonstrator flight test risk causation model in emergency and organizational levels.
(2) B4 and B5 loops.
As the precondition and physical fundamental of flight test risk control, this add-on group reveals the adverse effects of the D&M member errors on the operation and maintenance process, which emphasizes the impact of demonstrator development process on flight test safety.
3.3. Technical system level risk causation
For the risk causation modeling at the Technical system Level(TL),this causation model considers the reliability evolution in the whole BWB demonstrator life cycle, as shown in Fig. 5.Referring the loop dominance, the identified feedback loops can be categorized into three groups as following:
(1) R1 and B1 loops.
The feedback loops in this group describes the risk interactions caused by component failures among technical systems.They will accelerate the occurrence of system malfunction.As a response, the actual total flight sorties (EL2) increases in order to offset the mishap effects on total mission duration(EL1).
(2) B2 and B3 loops.
The two feedback loops have similar structures. The B2 loop describes the maintainer’s experience accumulation of known failure modes through the mishap learning. The maintainer identifies potential system failure during relevant tasks and cancels the scheduled flight test mission in active way.The B3 loop describes the operator’s experience accumulation through the mishap learning. The operator detects the system failure symptoms during the flight and aborts the mission to prevent undesired consequences in advance.
(3) B4 and B5 loops.
The two feedback loops have similar structures and illustrates the process that how system reliability of demonstrator could be improved by the introduction of D&M modification and maintenance procedure revision. Above hierarchical causation models are integrated as a whole strategies.It also illustrates a conceptual framework supporting the later development of hybrid model for risk assessment.
4.BWB demonstrator system reliability characteristics modeling
Referring to the technical system level causation model in Section 3.3, the quantitative definition of the conceptual variable ‘‘TL3 Critical system reliability status” is addressed by adopting on the system safety assessment method. It shows the hybrid feature of the approach proposed in this study. In order to facilitate the method demonstration, this section uses the flight control system as a case.
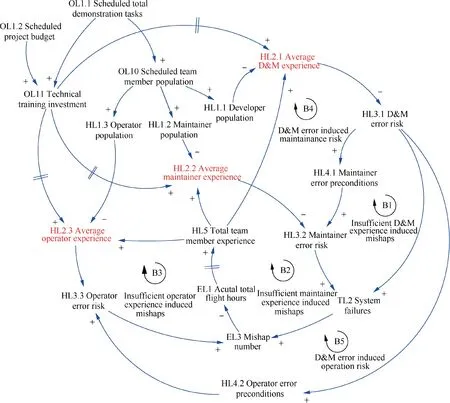
Fig.4 BWB demonstrator flight test risk causation model in human resource level.
4.1. BWB demonstrator technical system overview
As described in Section 2.1,the BWB demonstrators developed by our team were propelled by electric propellers or ducted fans installed at the rear of the center body.The pitch and roll controls were provided by a set of elevens located at the trailing edges of outer wing and transition sections,and the rudder on the vertical tail generated the yaw-axis control capacity.Especially, since BB-4, a belly flap beneath the center body provided additional lift, drag and positive pitch moment in takeoff and landing phases. All control surfaces were driven by digital servos in aero-model level. As the core and highvalue payload of demonstrator, a STA-34 centered multiple function Flight Control System (FCS) was introduced since BB-5 and its usage is continued on BB-6 Spirit.As an example,the basic system configuration is shown in Fig. 6.
The BB-5 demonstrator is flown visually by the Mission Pilot (MP, Operator #1) through remote controllers who is assumed for main safety responsibility in a started flight test mission. Meanwhile, another Ground Station Operator(GSO, Operator #2) takes charge of the data transmission,flight parameter monitoring and safety supervision. The FCS of BB-5 demonstrator contains three main elements:
(1) STA-34 flight control unit: it is a programmable platform supporting flight control law implementation. It receives the PWM signal from the Remote Controller(R/C),obtains external flight parameter through various sensor devices.
(2) CSS-22 signal I/O device: it is connected with the STA-34,R/C receiver and other sensor devices to obtain signals for flight control processing and actuator implementation. It has manual and FCS modes enabled by a switch settled on the R/C transmitter operated by MP.
(3) Data transceivers: it contains airborne (ADT) and ground (GDT) components to support flight control program upload and flight parameter display.
4.2. System component reliability data collection
Referring to the recommended procedures by the Preliminary System Safety Assessment (PSSA), a Function Hazard Analysis(FHA)provides a baseline for reliability analysis.Using the STA-34 centered FCS as a case, the FHA result is partly shown in Table 2. This study used the typical top-level event‘‘Loss of FCS signal without notification”as a case to initialize the Fault Tree Analysis (FTA). The result is shown in Fig. 7.
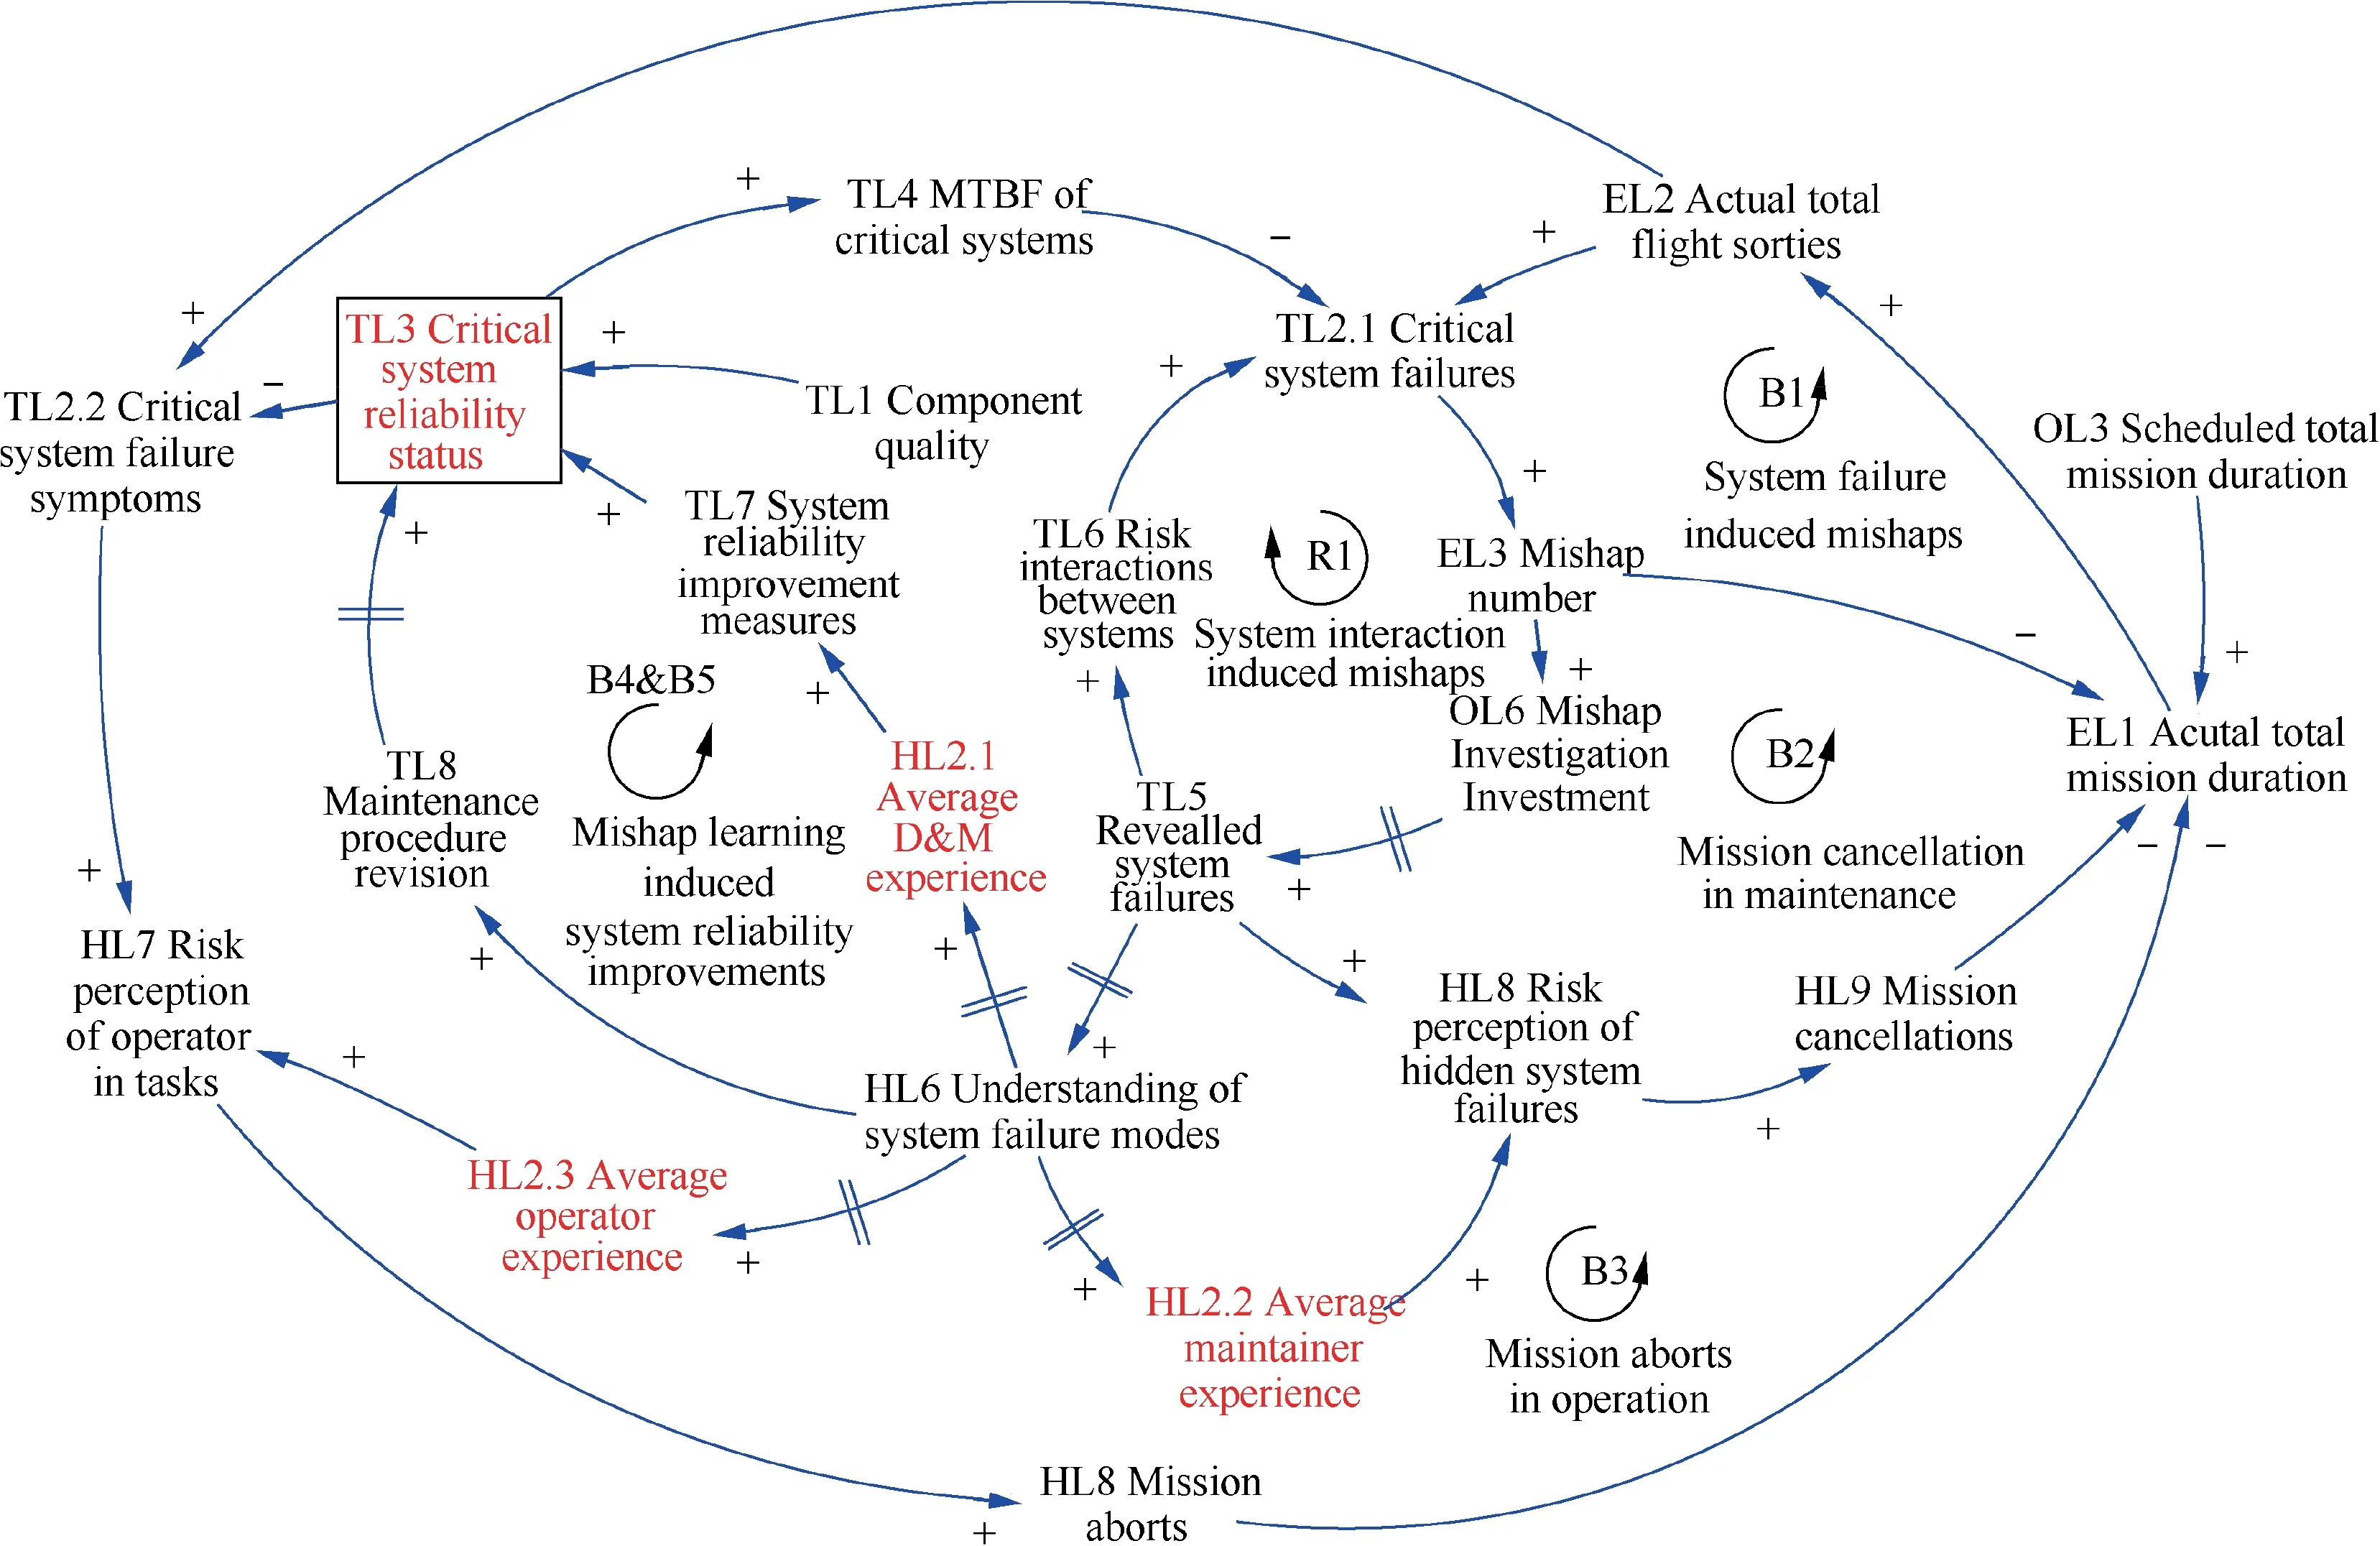
Fig.5 BWB demonstrator flight test risk causation model in technical system level.
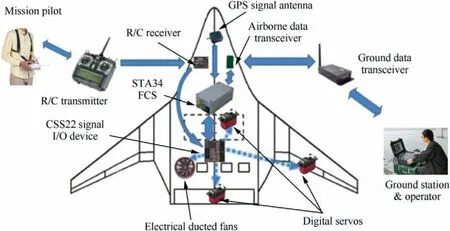
Fig.6 Basic system configuration of BWB demonstrator (since BB-5).
Through the fault tree established, the failure rate of bottom events can be allocated and predicted. Considering the low-cost characteristics of BWB demonstrator, reliability data of most components are incomplete, and a score distribution analysis is used to offset the data gap. It compares the differences between objects considering their Reliability Distribution Factors (RDFs) and refers to multiple scores generated from expert experience and previous operation data, which determines the failure rate of each bottom events empirically.34
The RDFs involves three types: technology maturity, technical complexity and environment conditions. The range of each factor is 0-10, which means the component unreliability.The sore distribution can be expressed as below:
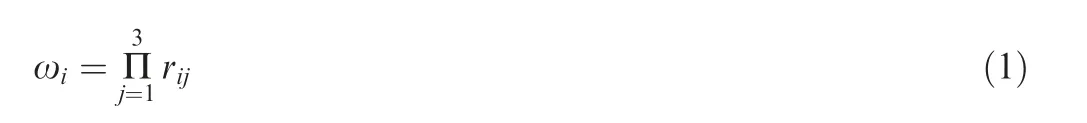
where rijmeans the value of each RDF:i represents the bottom event,j represents the technology maturity,technical complexity and environment conditions respectively. The analysis result of the mentioned case is shown in Table 3. Regarding a certain bottom event as reference failure rateλ*s,total component RDF sore is ωsand respective component RDF sore is ωi,so the failure rate of single component can be estimated as below:
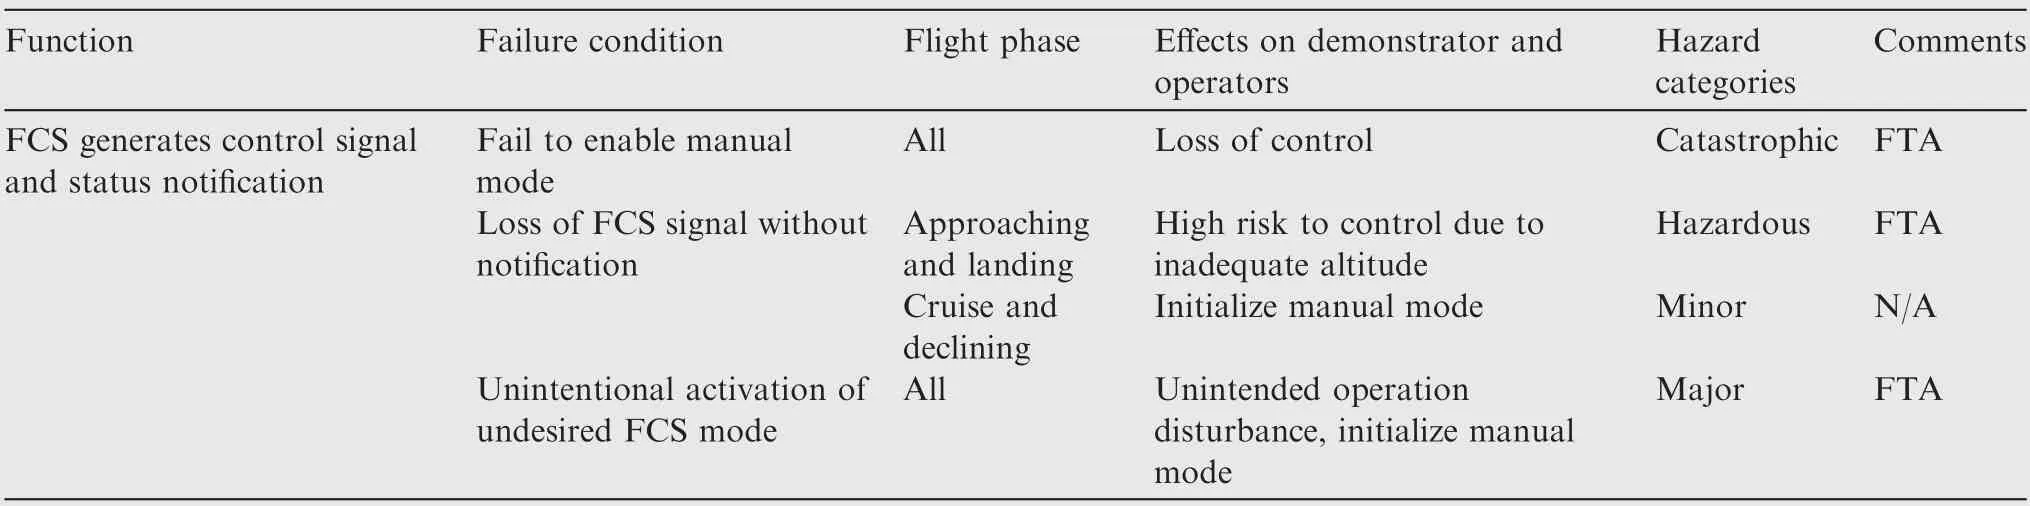
Table 2 An example for BWB demonstrator technical system FHA.
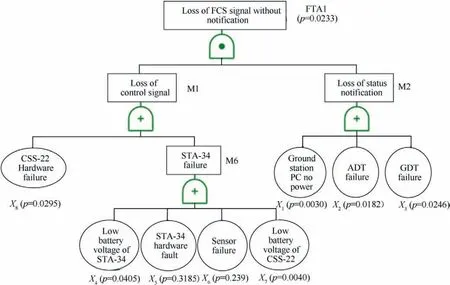
Fig.7 An example for technical system FTA (loss of FCS signal without notification).
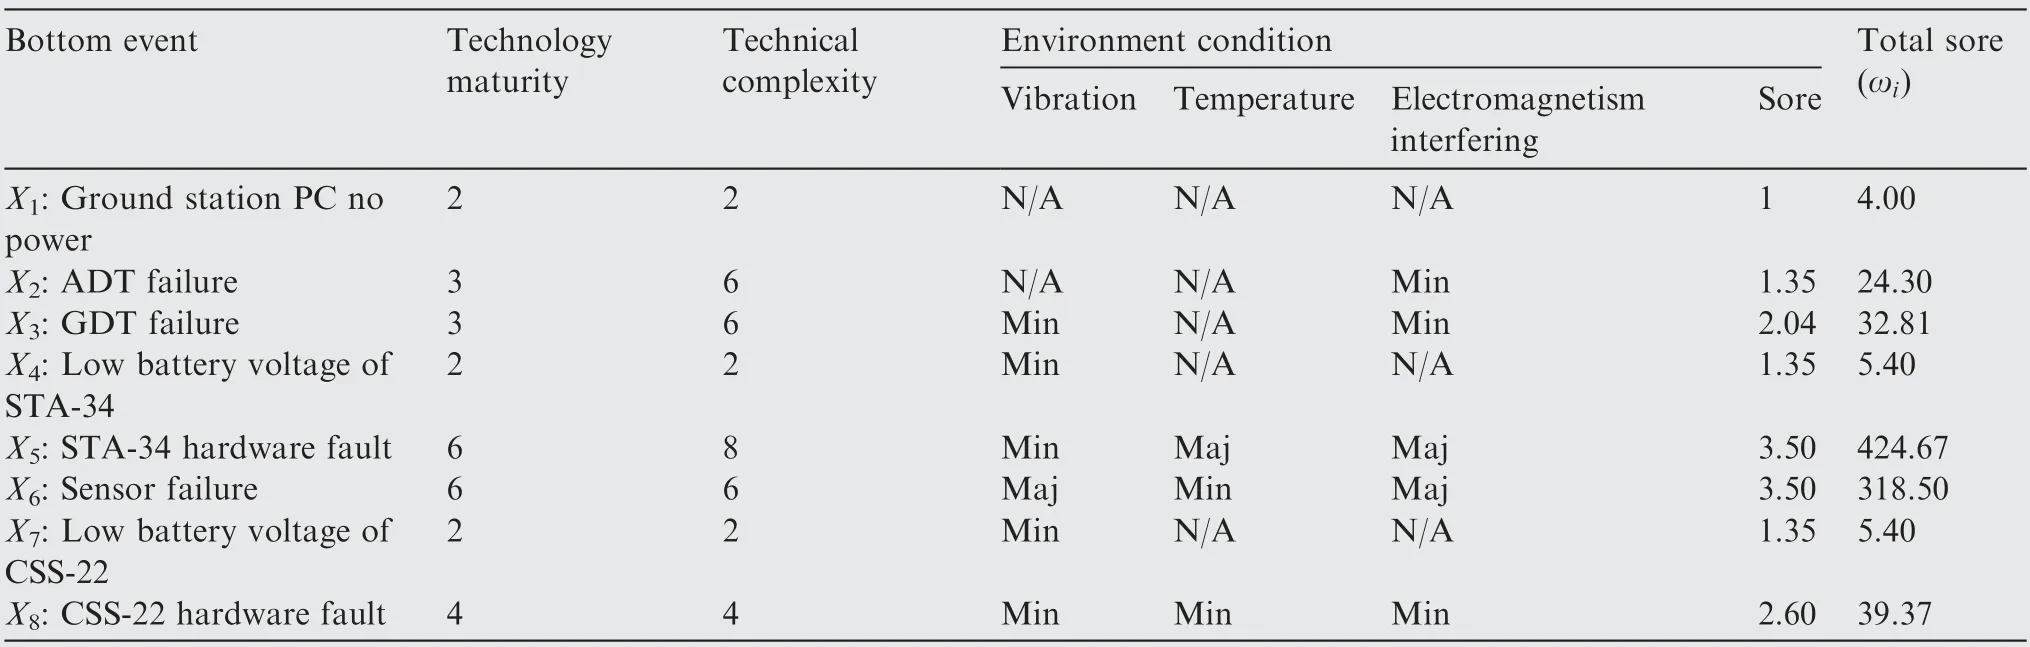
Table 3 Score distribution analysis result for ‘‘Loss of FCS signal without notification”

Table 4 Failure rate estimation based on score distribution analysis.
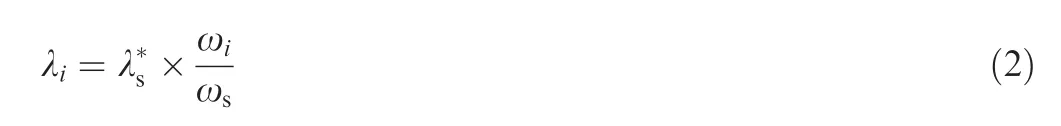
The failure rate of bottom event X1was chosen as the reference (λ1=0.003 per flight hour), the failure rate of other events can be calculated as Table 4 shows. Following this approach,the risk probability of all function failure conditions identified in the FHA were addressed.Through the analysis of the importance and sensitivity of the bottom events, a preliminary judgment on the critical degree of each bottom event in the technical system were implemented,which not only guided the system reliability improvement under project budget and cots component quality constraints but also generated the reliability data as inputs for the hybrid model to evaluate the whole flight test risk semi-quantitatively.
4.3. Markov analysis based system reliability description
Based on the system component reliability data collected in Section 4.2, the Markov Analysis (MA) approach is introduced to identify the possible states of the critical systems affecting the reliability of the BWB demonstrator. It establishes state transition differential equations to obtain the dynamic variation characteristics of the catastrophic failure probability.
Using the loss of flight control ability as a top level event for a case,when consider the possible system status in the view of Markov chain,each bottom event has two basic states:normal or failure,and the relevant fault tree is shown in Fig.8(a).To describe above reliability characteristics with MA approach, the normal state is marked as ‘‘1”,and failure state is marked as ‘‘0”, the flight control ability has four states: S1,normal ability, safe; S2, FCS mode normal but manual mode failure, safe; S3, manual mode normal but FCS mode failure,safe; S4, loss of flight control ability, catastrophic state. The relationship between bottom event and system states are shown in Table 5.
Referring to the Markov model shown in Fig.8(b),the system state equations are shown as below, where pi(t ) indicates the probability of state Siat time t, λithe failure probability of each bottom event (indicated by Xi) and its value are listed in Table 6. By solving the above equation and when its iterative convergence was acceptable, the probability of the system in the S4state represented the unreliability level of the FCS.It was defined as the FCS loss the flight control ability under specified time and relevant conditions. Such system unreliability profile is shown in Fig. 9.
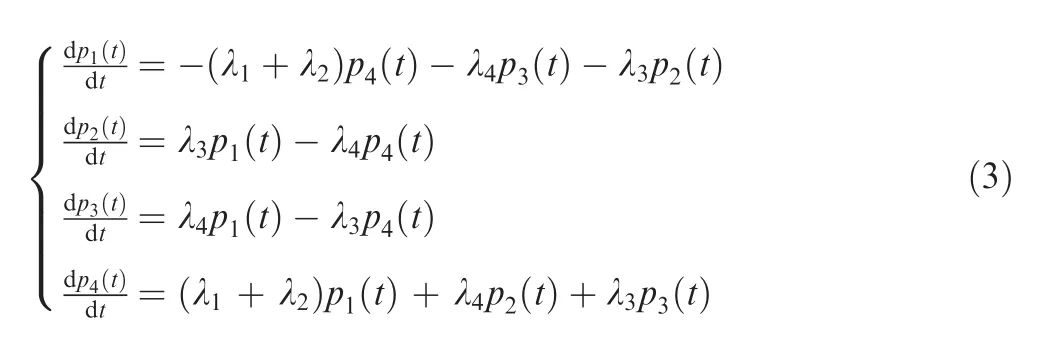
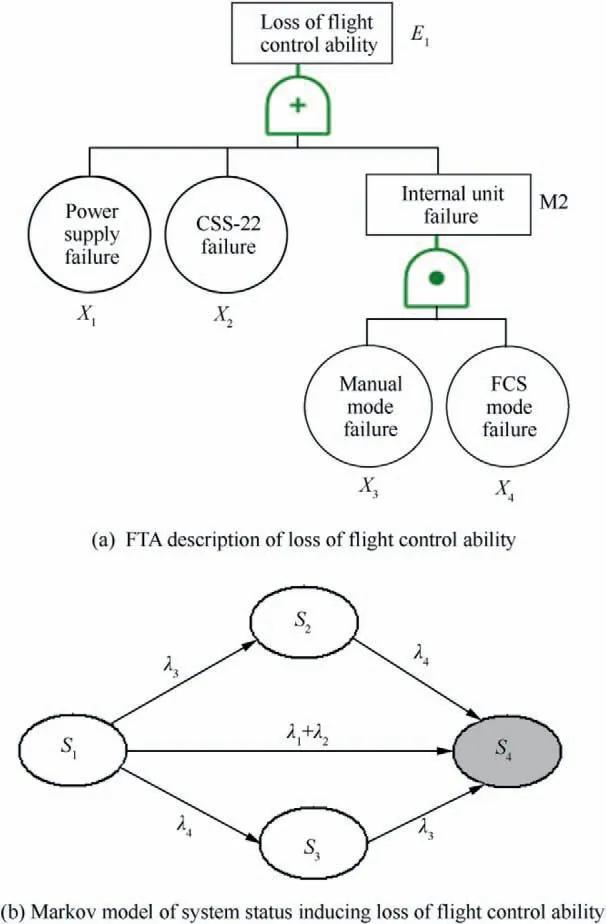
Fig.8 Example for Markov analysis used in hybrid model.
As indicated by Section 5.1, using the SFD variable‘‘OL5A1 Mission duration of each sortie” as an lookup function,this profile was modified as a data variable in hybrid simulation model (i.e., ‘‘TL3D1 Estimated critical system unreliability”)to realize the conceptual definition of causation model variable ‘‘TL3 Critical system reliability status”.
5. Hybrid model for BWB demonstrator flight test risk assessment
Since 2016, our team has begun to develop the 6th generation BWB demonstrator called BB-6 Spirt which has higher MTOW than the previous ones.Its basic configuration parameters are shown in Fig.10 below.It also equips with the STA-34 center FCS and possesses a cruising speed of 90 km/h and maximum endurance time of eight minutes. It will be flown in separated airspace by mission pilot under visual flight rules with a maximum flight altitude of 150 m. The ground station operator will monitor the flight status and provides necessary information support.
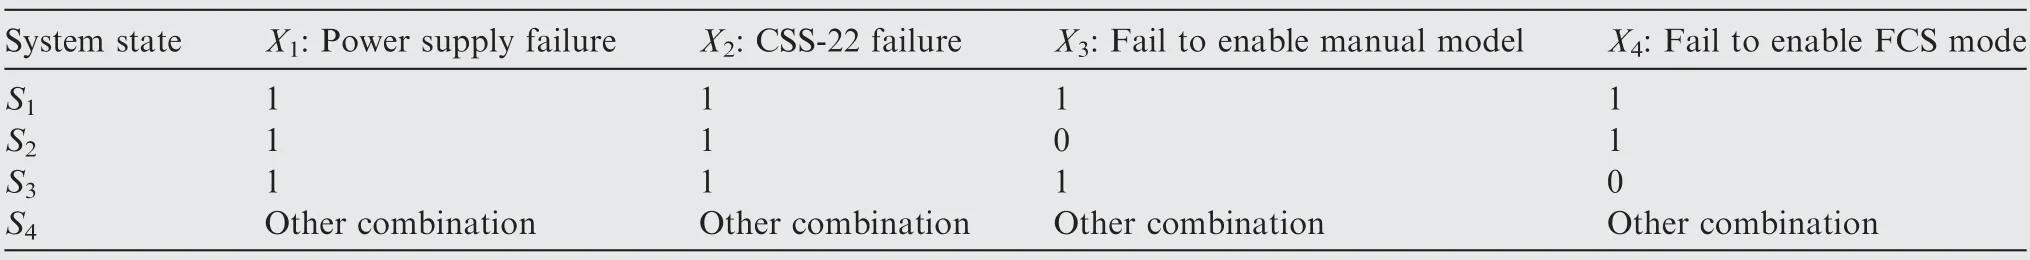
Table 5 System state list used in Markov Analysis.
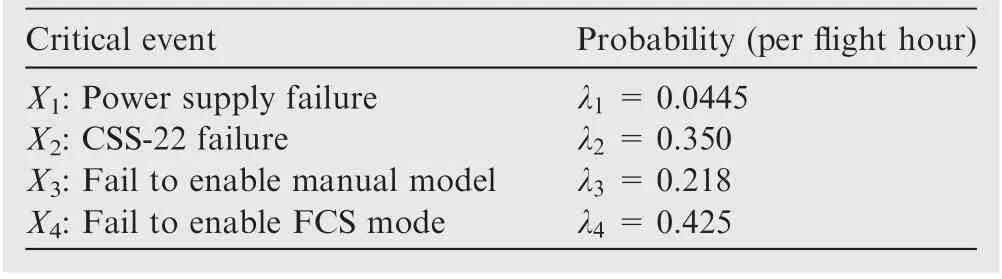
Table 6 System failure probability list.
5.1. Stock-flow diagram modeling
Due to the limitation of available data such as quantitative relationships of conceptual variable, the causation model established in Section 3 was tailored aiming for the construction of feasible hybrid model that can be verified.The function definitions of all links in causal loops were given based on mental,written and numerical sources,and the causation models were transferred as a semi-quantitative stock-flow simulation model for potential time-domain simulation of safety evolution in BWB demonstrator flight test.
In simulation model,the historic data are expressed as data variables (D). The variables involving cumulative process are defined as stock variables (S). The change rates of S are defined as flow variable(F).Moreover,some variables expressing effects of the upstream variables are defined as auxiliary variable (A) and constant parameter (C). About more modeling details,the interested reader is referred to the extensive literatures.10,27-29Using the modeling of the BWB demonstrator cumulative mishap rate (EL4A1) as an example, its definition is determined as following:
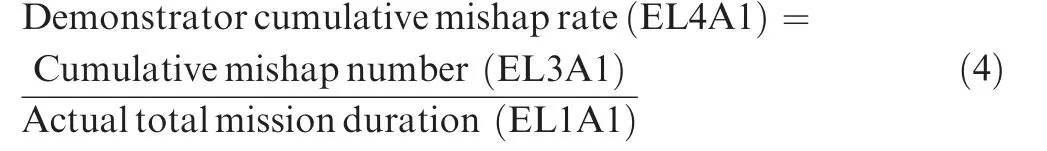
and the relevant view of hybrid model is shown in Fig. 11.
The causal factors related to ‘‘EL3A1 Cumulative mishap number” involve following variables:
(1) ‘‘TL2S1 Cumulative critical system failures”, regarding the variable ‘‘TL3D1 Estimated critical system unreliability” mentioned in Section 4.3 as its change rate approximately: in the prior flight tests of BWB demonstrator series, some mishaps were caused by low-cost cots component failures, such as one mishap of BB-2 was caused by loosed left ducted fan blade in takeoff phase. Its relevant equation definition is
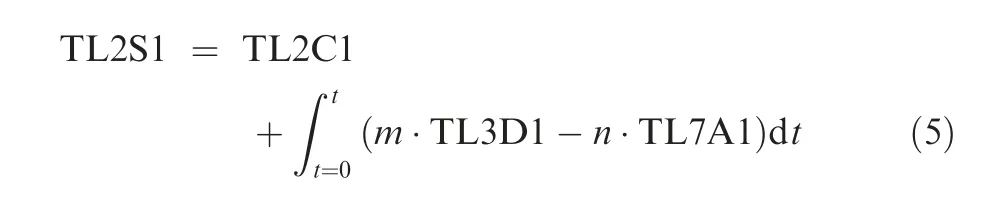
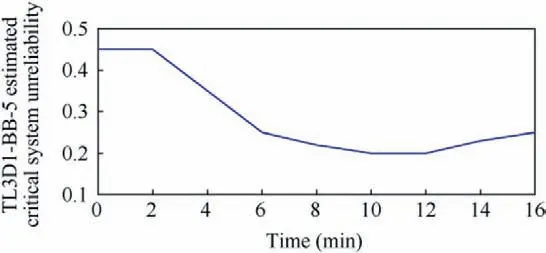
Fig.9 BB-5 demonstrator technical system unreliability profile(using the flight control system as a case).
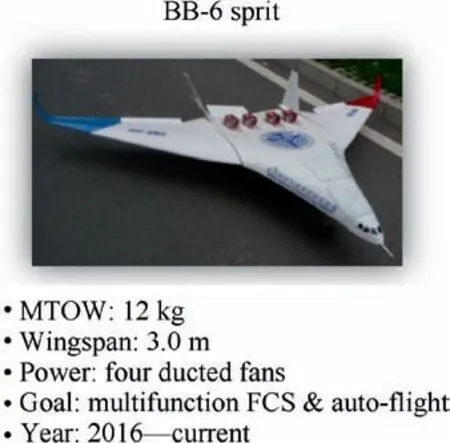
Fig.10 Basic descriptions BB-6 sprit.
where TL2C1 is the initial number of critical system failures,TL7A1 refers to the effect of improvement measures on system reliability through the hindsight of mishap investigation, m and n are all empirical coefficients.
(2) ‘‘HL4.2S1 Unknown design feature risk”,due to insufficient D&M member experience. For example, the BB-3 had manufacturing errors which caused asymmetry lift and uncontrollable fall; the BB-5 encountered several times of unexpected stall due to unclear flight dynamic characteristics under adverse combination of angle of attack and sideslip. Through mishap investigation and organizational learning, the design flaw improvement measures (TL7A2) helps to reduce these risks.
(3) ‘‘HL3.3S1 Operator error risk”,due to insufficient operator experience. For example, the BB-1 experienced a catastrophic controlled crash due to the operator not following the test procedures; both the BB-2 and BB-5 encountered hard landings due to insufficient operator skill,which damaged the airframe structure and landing gear components seriously. More importantly, combined with critical system failure and unknown design features, such risk may increase significantly. The BB-4 suffered from a hard landing mishap attributing to the operator unfamiliar with the design features of newly added belly flap. In the case of the BB-2 mishap, it encountered a single engine failure and the operator failed to implement emergency landing procedures proficiently, which caused the demonstrator crash and ground property losses. Along with the progress of the project, based on the current experience (HL2.3A1) the operator continues to learn from the systemic hazard symptoms (TL2.2A1), which may prevent his operation errors. Such as in the later stage of the BB-4 flight test until the BB-5, there was no mishap directly caused by improper usage of the belly flap in landing. This study uses following equation to model the cumulative process of this risk:
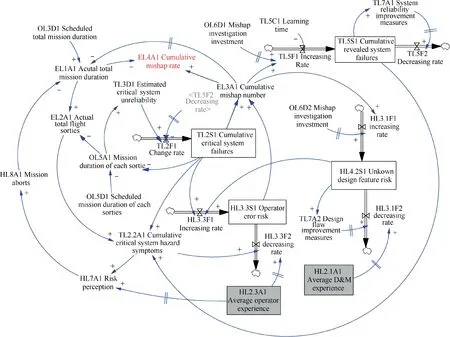
Fig.11 View1 of proposed hybrid model: BWB demonstrator cumulative mishap rate (EL4A1).
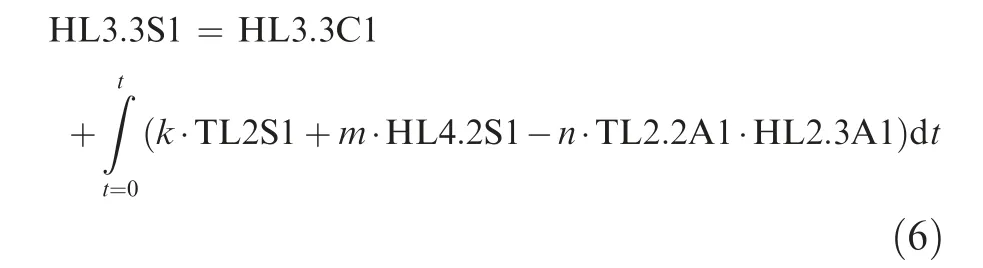
where HL3.3C1 is the initial value of the operator error risk(unit: %) and the parameter k, m and n are all empirical coefficients. Considering the frequency of personal mobility in the life cycle of BWB demonstrator this hybrid model aims to assess the multiple level risk dynamics with a long-term vision.Referring to some classical case studies on high risk organization safety, average personnel experience was choosen as a critical factor to model the risk mechanism related to human-technical system interaction in a simplified way (i.e.,‘‘HL2.1A1 Average D&M member experience” and‘‘HL2.3A1 Average operator experience”, see the gray blocks in Fig. 11).29,35The human resource level view explains the details of how those variables are defined,as shown in Fig.12.
Because of the design features of low-cost platform and the introduction of COTS,the maintainability was not emphasized in the development goals and the most necessary maintenance tasks were carried out by operators.This study mainly considers the risk effects derived from D&M member and operator in our research team. The critical variable definition in this view are explained as following:
(1) ‘‘HL1S1 Total team member population”,characterized by the flow rate changes of team member expansion and turnover. The member expansion is derived from the organizational corrective behavior to offset the gap between ‘‘OL10D1 Scheduled team member population” and the actual population (HL1S1), which forms a typical negative feedback system. The turnover of team member (HL5F2) is attributed to their graduation rate (HL5D2). To consider the obvious intersection of team members across D&M members and operators, a division ratio (HL1D1) was introduced to describe such composited population variation along with time.
(2) ‘‘Average D&M Member and operator experience”(HL2.1A1 and HL2.3A1): Among them, the change of total task experience (HL2.iS1) mainly derives from:(A) team member initial training (attributed to‘‘OL11D1 Technical training investment”); (B) mishap learning, that is the self-relearning of team members from revealed system hazard symptoms and unknown design features;(C)team member graduation introduced experience decay; (D) experience natural deterioration with time.For both D&M members and operators,they have the same similar hybrid model structures.
5.2. Hybrid model simulation and verification
Combined with the times-series historical developmentoperation data and safety records collected from the BWB demonstrator series flight test, corresponding organizational level data variables were determined as the inputs of the hybrid model. After the performance of model structure and variable definition iterations driven by Extreme Initial value Test(EIT),Parameter Sensitivity Test(PST)and Variable Validity Checks(VVC), the hybrid model represents the flight test risk evolution process of BB-5 which equipped the STA-34 centered FCS from 2014 to 2015 for a model behavior verification.The time horizon is 360 days and the integration type for hybrid model simulation is Euler method. Fig. 13 compared the simulation results of critical variables in four different hierarchies against relevant historical data.
6. Risk control strategy benefit assessment and model application
6.1. Strategy scenario experiment
Referring to the high reliability theory,the civil aircraft can be operated under high risk for a long time without mishaps.36Moreover, only relying on textual descriptions on safety prevention derived from mishap investigation, the time series and factor importance were not so clear to guide targeted risk control measure.For the case of BWB demonstrator,the high risk status always induces mishap soon due to the feature of technical exploratory rather than commercial routine flight.In this study, with such practical basis, a model application for risk control assessment aiming for BB-6 demonstrator were performed based on the verified BB-5 centered hybrid model in a view of strategy scenario experiment. In this Section, three typical risk control strategies were chosen.The critical parameters reflecting the base and test strategy scenario features are listed as Table 7.
In order to observe the model behavior in long term vision,the time horizon in experiment was extended as 720 days. The experiment results are shown in Table 8 and Fig. 14.
(1) Case 1: improve the reliability of the technical system(TL3D1).By enhance the component quality and system configuration, in this experiment, such measures are reflected by adjusting the unreliability profiled obtained in Section 4 to realize this strategy (using of the FCS as an example).
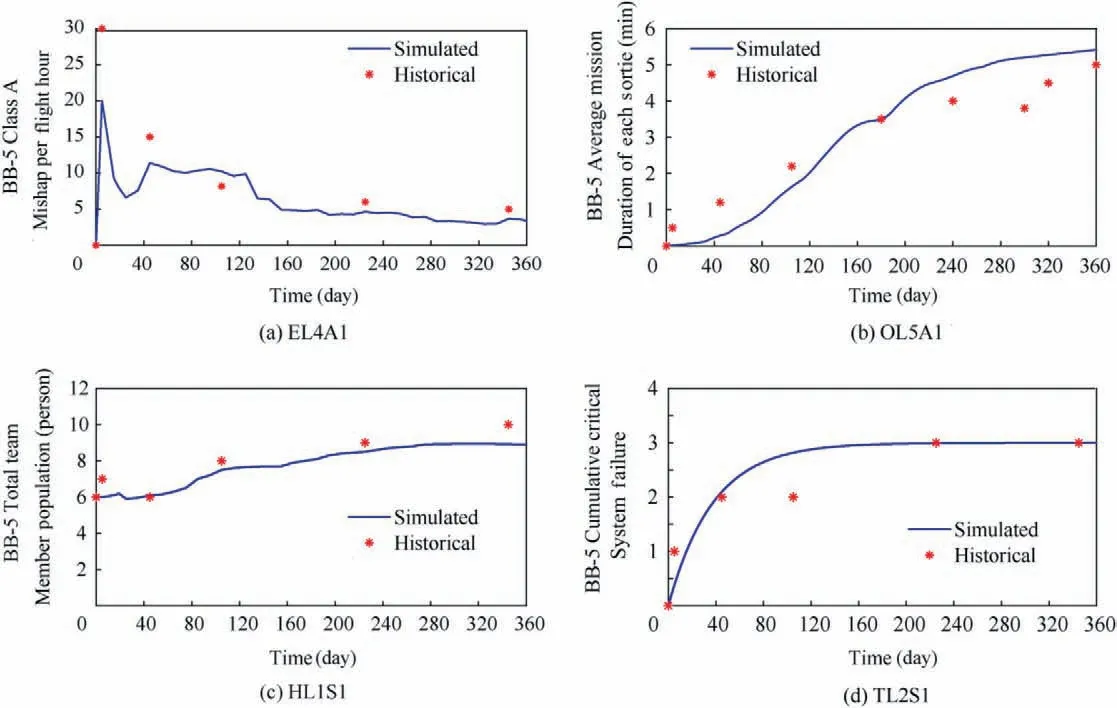
Fig.13 Simulated results vs historical data of the flight test risk assessment of BB-5 demonstrator.
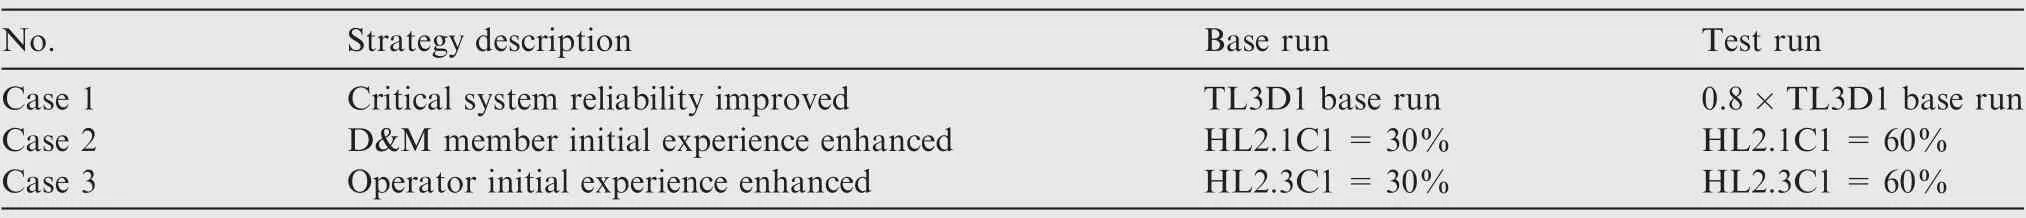
Table 7 Risk control strategy scenario experiment parameter setting.
(2) Case 2: enhance the D&M member initial experience(HL2.1C1)to control risk derived from unknown design features. In practice, by strengthening relevant professional knowledge education and engineering mastery training of D&M members,such as CFD analysis,structural finite element analysis and control law verification etc., can realize this strategy.
(3) Case 3: enhance the operator mission experience(HL2.3C1). Referring to the safety records of BWB demonstrator series, necessary mastery theoretical knowledge education and flight skill training on operator are needed.
The results can be discussed as following:
(1) The influence of the unknown design feature risk is reflected at early period of flight test and dominates variation of the mishap rate. When the D&M defect are modified continuously following the mishap investigation suggestions, it will show less significant impacts on flight safety.
(2) The impact of technical system reliability is dominant at the later period of flight test. Due to the high mishap rate at the initial time of BWB demonstrator life cycle,the cumulative mission duration is short,and few system failures can be detected prior to other factors. It will be observed with a time delay and represented as a transla-tion effect on mishap rate in medium-and-long term vision.
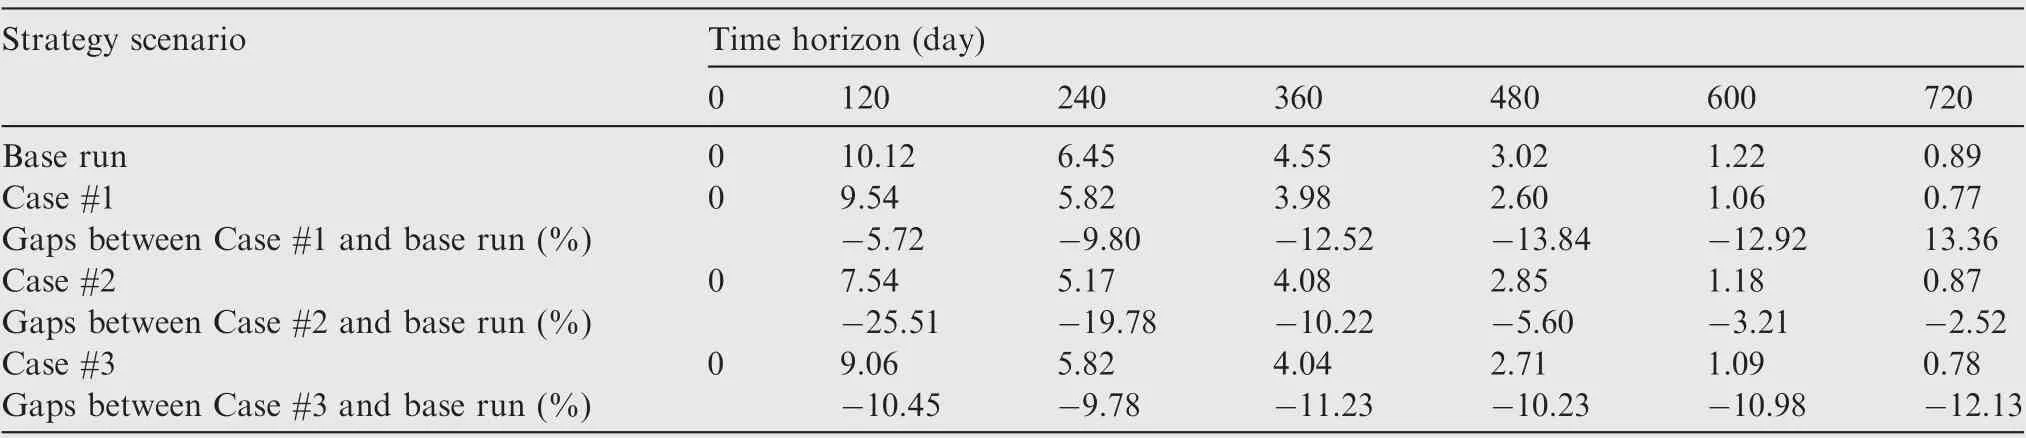
Table 8 Risk control strategy scenario experiment results.
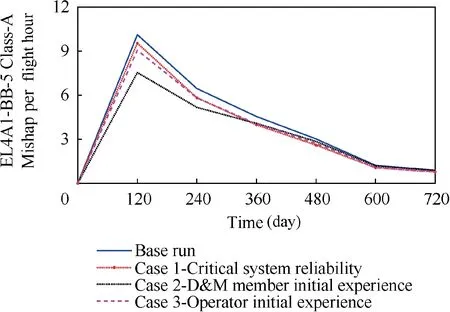
Fig.14 Risk control strategy scenario experiment results.
(3) The impact of the operational error persists in the whole time horizon of BWB demonstrator flight test and can be regarded as a continuous translation effect on mishap rate. Regarding the demonstrator development budget constraints pervading in our research team, the price for enhance the system reliability is much higher than strengthen operator training, especially on simulator and stability variable air model platform.
In summary,the basic risk control policy of the BB-6 can be derived with such priority: identify the demonstrator flight dynamics characteristics actively at the initial period of the demonstrator development instead of ‘‘trial-and-error” by flight test, emphasize operator training both in mastery and refresher routines to enhance the operator’s understanding of demonstrator overall safety characteristics, and enhance the technical system reliability of system referring to the component sensitivity analysis considering cost control. By implementation of the above hierarchal policy, the BB-6 succeeded its maiden flight. From 2016 to date, it has flown safely in its several sorties without any Class-A mishap. It showed the effectiveness of the proposed hybrid model to control the flight test risk.
6.2. Discussion for model application
This proposed risk control metrics can also be applied to the product-level UAVs.Based on international aviation engineering conventions, the most aviation authorities adopt the MTOW to categorize the UAV in service, due to it can determine the potential ground impact energy and the threat to public safety. Some aviation authorities have taken the lead in developing the airworthiness framework for civil UAV operation accompanying with ICAO’s exploratory aspiration.37,38Using the FAA and EASA the pioneers in UAV airworthiness as example, they have reached a preliminary consensus which focuses a hierarchical structure for UAV safety supervision and contains three categories.39,40
The proposed hybrid model can cover the most risk factors of the UAVs under the open operation category due to their similar size, system configuration and operator proficiency.In contrast, for the bigger UAV products under operation and even certified categories, the product-level system components will possess more comprehensive basic reliability data and failure effect mode analysis results which make the system reliability characteristics modeling more credible. The further developed hybrid model aiming for UAVs in higher level categories should focus on more risk factors such as maintainer risk and operation environmental impacts, which has been planned in the next phase of our following research.
7. Conclusions
Facing the frequent mishaps in the BWB unmanned subscale demonstrator flight test implemented by our research team,this paper introduces a hybrid model for the demonstrator flight test risk assessment involving risk factors from multiple levels. Due to the insufficient statistics data and limited demonstrator mission durations, further research is needed to improve the accuracy and credibility of the hybrid model simulation. This hybrid model has the following characteristics:
(1) It regards the hierarchical risk interaction scenario as the unit of risk assessment in a systems theory based safety vision. Through both qualitative and semi-quantitative ways, the hybrid model integrates the technical system reliability analysis techniques into the framework of social-technical system risk assessment.
(2) The time-domain model simulation is based on the historic data. It reveals the different risk mechanisms of three critical factors in BWB demonstrator flight test:unknown D&M features, technical system reliability and operator errors. They have the impacts on the demonstrator safety in the prior,latter and whole phase respectively.
(3) The risk assessment implemented by this hybrid model covers representative risk spectrum and interaction of UAVs. It may help the related stakeholders to evaluate safety benefits of their decision-making better in a medium-and-long term vision.
Acknowledgements
This research was sponsored by the National Natural Science Foundation of China (No. 61803263) and the Startup Fund for Youngman Research at SJTU of China (SFYR at SJTU).The first author also thanks Professor Karen B MARAIS from Purdue University for her helpful advice during the process of this research.
 CHINESE JOURNAL OF AERONAUTICS2019年12期
- CHINESE JOURNAL OF AERONAUTICS的其它文章
- A CFD-based numerical virtual flight simulator and its application in control law design of a maneuverable missile model
- Numerical investigation of flow mechanisms of tandem impeller inside a centrifugal compressor
- Experimental investigation on dynamic response of flat blades with underplatform dampers
- Non-random vibration analysis for general viscous damping systems
- Numerical analysis of hypersonic thermochemical non-equilibrium environment for an entry configuration in ionized flow
- Prediction of nonlinear pilot-induced oscillation using an intelligent human pilot model