
Effects of forest management on biomass stocks in Romanian beech forests
2019-10-17 09:54:38BouriaudDonJanssensMarinandSchulze
Forest Ecosystems 2019年3期
O.Bouriaud ,A.Don,I.A.Janssens,G.Marin and E.-D.Schulze
Abstract
Keywords:Forest management,Forest productivity,Biomass stocks,National forest inventory
Background
The influence of mana gement on forest carbon stocks has been under discussion in the context of climate mitigation (Schulze et al. 2012) in the C-sequestration framework which stresses the need for increased carbon storage in terrestrial ecosystem, potentially conflicting with the increased need for wood supply in the future, bio-bases economy. Forest management could be one of the most influential drivers of forest carbon sequestration in the long term (Nabuurs et al. 2001; de Vries et al. 2006; Ciais et al. 2008; Schulze et al. 2018). However, its actual influence on the forest biomass stocks and productivity has been far less studied than that of climate or CO2forcing (Ciais et al. 2008; Reyer et al. 2014; Erb et al. 2018).
The high diversity of management forms, but also other factors influencing forest productivity, such as site fertility, local climate etc., make the quantification of the influence of forest management very challenging. Management indeed takes a lot of different forms and intensities, and covers a great diversity of actions (Luyssaert et al. 2011; Duncker et al. 2012; Schall and Ammer 2013).
In order to study the influence of forest management on forest biomass and growth, the statistical replication of each management type should be sufficiently large. Only systematic sampling schemes, such as those implemented within national forest inventories (NFI), provide the required sample sizes for each management type, including protected forests. Large-scale estimations of biomass or carbon stocks have already been successfully derived from NFI data (e.g. Hall et al. 2001; Goodale et al. 2002; Pan et al. 2011) and provided important insights into large-scale forest biomass stock dynamics.
With a total area of the order of 2.5 Mha, common beech (Fagus sylvatica L.) is one of the dominant tree species in Romania and equals ~ 14% of European beech forests area. Beech represents almost one-third of the Romanian growing wood stock. Another dominant species is spruce (Picea abies L.), but its management may not have the same variability as that of beech and we therefore did not assess the management impact for this species. Beech forests grow over the entire country and cover a wide diversity of management types and intensities. This species, therefore, offers the opportunity to investigate the influence of management on the biomass stocks and growth of forests, comparing differences between management types, intensities and harvest practices, within a relatively confined spatial domain. Studying these relations for one single species overcomes potentially confounding effects of differences in species mixture, and narrows the ecological conditions encompassed.
The forest management types of Fagus forests in Romania are differentiated according to the main objective selected for a given management unit:protected forestsare forests where any form of harvest is excluded and whose objective is nature conservation;protection forestsare forests located on steep slopes, protecting soils or watersheds.Harvest is possible,but limited,these forests being typically forests with restricted wood supply,thus this management has a low intensity.Production forestsare primarily used for wood production and have generally a high intensity management. These management objectives are assigned through repeated 10-year management plans and represent the main objective prescribed for a given management unit. These three management types mainly differ in the level of harvest limitation: no harvest in protected forests, low intensity harvest in protection forests, and higher intensity harvest in production forests. The production management itself takes a great variety of forms,depending on the thinning regime and the harvest method (final felling), because the harvest influences the regeneration process hence the structure of the stand that results from it(Matthews 1989;Duncker et al.2012).In short,the harvest can either promote a regular structure with a restricted difference in tree age (e.g. after clear-cutting and short-duration shelterwood), or, on the contrary, promote age and structural heterogeneity (e.g. after tree selection).These treatments therefore need to be distinguished as they subsequently involve a diversity of tendering and thinning operations.
Historically, the management type of a given stand has hardly changed over time since the 70s as the classification into protection forest or protected forest depends on permanent site conditions (ex. accessibility, steep slopes, watershed) or stand features (ex. rare species, absence of cuttings).
Production forests are essentially managed according to three harvest and regeneration methods, referred to astreatments: age class, for even-aged forests; group shelterwood (or in short, shelterwood) based on creating gaps to promote un-even-aged structures; and selected tree cutting generating an irregular forest structure. In age class forests, the harvests are implemented by removing a prescribed fraction of the trees (one third, typically from the intermediate and lower layers) from the entire stand. In the shelterwood type, the trees are harvested by patches that generate small-size openings.Openings are widened by each successive harvest until the entire cover is removed. Age class and shelterwood do not strongly differ in the thinning intensity, they mostly differ in the way harvests and regeneration are implemented, which has potentially large consequences on the forest structure and stem density in young stages.
In Romania, stands are kept at rather high densities and with very long rotations compared to other countries (Bouriaud et al. 2016): thinnings are typically of low intensity and can (legally) be implemented only up to until ~80 years old, after which the stands enter the no intervention (dead period) till they reach 100 years of age. Given the duration of the regeneration cuttings, the final cut age can reach 160 years. In protection forests,thinnings are possible during the first 2/3 of the rotation,after which only the so-called conservation harvests are allowed (salvage cuttings), at a maximum of 10% of the current standing volume. The harvest type is that of a shelterwood.
Two diverging hypotheses prevail concerning the influence of management on forest stocks and growth: i)forest management has a negative impact on forest stocks, because of the successive cuttings resulting in removing a share of the biomass (Nunery and Keeton 2010; Luyssaert et al. 2011; Naudts et al. 2016), or ii)management has no impact on forest stocks because cuttings are compensated by increased stand growth(Pretzsch 2005). The idea that management decreases forest productivity has been forwarded mainly by nature conservation promoters (Zeide 2001), but with little empirical support on the large scale (Noormets et al. 2015).Conversely, the position of forestry is that thinning concentrates resources in fewer, selected (the remaining)trees, which therefore grow faster. The consequences of thinning or partial cutting should therefore be mainly transitory, resulting in saw-tooth shaped time series of the aboveground biomass that builds up as a result of the faster growth of the remaining trees (Pretzsch 2009).However, the persistence and possible effects on the stand volume and growth remains poorly assessed on the large scale. Indeed, while tree-level responses of growth to variations in competition are well documented(Kunstler et al. 2011; Fichtner et al. 2012), the stand-level impact on the stocks and productivity has been mainly assessed by modeling (Thornley and Cannell 2000; Lafond et al. 2014), but has seldom been documented by direct measurements (Nunery and Keeton 2010; D'Amato et al. 2011).
The aim of this study is to analyse the impact of different management and treatment types on the biomass stock and productivity of beech forests in Romania with the hypothesis that growth compensates removals. Another aim is to determine if the cumulative biomass production -accounting for the wood biomass growth and removals of successive cuttings- along with the rotation cycle may be similar among the treatments because of these compensations.
Methods
The analysis of the impact of management on Fagus forests biomass stocks and growth requires estimating the stocks and the production (biomass increment over the last 5 years) for each management type (production, protection and protected) and treatments (age class, shelterwood and tree selection). The cuttings (biomass cut) on each plots also need to be assessed because it could strongly influence both stocks and growth.Once accounted,it enables the estimation of cumulated biomass production,living plus harvest,over the duration of a rotation.
Forest management types and treatments
In the context of NFI, the classification of the plots into forest management types was made according to the management plan. Plots were classified into the protected forests category only in the absence of harvest signs (skidder road, stumps, branch piles). In the absence of management plan information,the classification into protection forest can be based on the slope: all forests on slopes exceeding 35° belong to protection forest type. The classification into treatment (age-class, shelterwood, tree selection) was based on the current forest structure and the regeneration method defined by the management plan. Age-class represents the most common treatment with over 63% of the beech-dominated forest area, followed by shelterwood with 36%. Tree selection is very rare (less than 1% of the Fagus forest area)and will be neglected in the following analysis (see Hessenm?ller et al. 2018). Differences in treatments originally reflected forest structure and usage. Before 1990 all forests were owned and managed by the State. Forest management does not differ between public and privately owned forests, both being regulated by the same rules. Ownership was therefore not considered in this study. Protection forest is 15% of the total Fagus-dominated area. These forests have been under protection the last 50 years and a great majority had not been subject to large-scale cuttings before given their inaccessibility.
The inventory
The analysis is based on the first cycle of the Romanian NFI. Inventory plots were filtered so that only pure or nearly pure beech stands were considered (the maximum admixture threshold was set at 10% of the total above-ground volume), which amounts to 2840 plots.The tree-level variables used were the tree diameter at breast height (dbh, cm) and the tree height (h, m). The plot-level data included the description of the stand management type and enabled the estimation of plot-level attributes such as the standing volume and the stand density.
The inventory is the first statistical forest inventory of Romania. It was initiated in 2006 and field measurements started in 2007.The field sampling of Fagus(ranging from 150 to 1650 m a.s.l.)was based on plots belonging to a systematic 4 km×4 km grid, resulting in a homogeneous set of data covering the entire country (Additional file 1:Figure S1). Thus our study that focuses on beech dominated forests covers an area of 2.47 Mha.
Measurements on living trees
For each tree we recorded the dbh using a calliper and height using a vertex hypsometer (Hagl?f AB, Sweden).The tree-level woody aboveground biomass (AB, kg) was estimated based on the generic biomass equation for Central Europe (Wutzler et al. 2008) and based on both dbh and h for predictions: AB=0.0523×dbh2.12×h0.655.
Deadwood measurements
Two categories of deadwood were distinguished: lying deadwood and standing snags. The volume of decaying pieces was derived from the inventory of deadwood within the 200-m2plot. Each deadwood piece sampled was classified into one of the five decay classes based on a visual examination on the field. The diameter of each piece was measured at its middle, together with the length that falls into the inventory circle. Snags were recorded in the same manner as the living trees, with diameter and height measurements. Following Mund and Schulze (2006) and in the absence of specific measurements, wood density was assumed to decrease linearly from decay class 1 to class 5, from 558 to 62 kg·m-3. The density used for class 1 was the same as that for living trees: 558 kg·m-3.
Branch piles were inventoried when they lay inside the inventory plot, and were attributed to similar decay classes as the lying deadwood. Two right-angle diameters and the top height of the pile were measured on the field so that the outer piles'volume was approached using the theoretical semi-volume of an ellipsoid (Woodall et al.2013). The actual volume of wood inside the piles was estimated at the tenth of that of the pile since the packing ratio was not assessed in the field.
Cuttings
The recent cuttings were used to quantify the management intensity. Since the data available come only from the first NFI cycle, the cuttings can be evaluated only based on stumps. Stumps are classified according to their decomposition into four decay classes. Only recent stumps with no visible wood decay were considered in the analysis. Given the high rate of decay of beech wood(Kahl et al. 2017), the age of the stumps classified as recent is probably well below 10 years.
Cumulated biomass
The cumulated biomass was computed as the sum of the living stock and of the cumulative cuttings (i.e. cumulative sums from one age class to the next), all along the rotation, hence representing the cumulative biomass produced at each age classes during a rotation based on plots of different ages (replacement of space by time).They were estimated for each age class, management type and treatment by adding up the average living stock biomass and the cumulative average harvested biomass.
Dendrochronological measurements
Increment cores from 10 to 16 trees per plot were sampled from bark-to-pith at breast height, in order to estimate the growth rate of the trees in the plot. Trees were sampled outside the plot to avoid damage within the plot. The dbh of the trees sampled had to be larger or equal to the mean dbh within the plot. Tree growth is estimated based on the diameter and biomass increment during the past 5 years (Babst et al. 2014). To this end,species-specific models of biomass increment were fitted on the cored trees using the lme4 package of R (Bates et al. 2014). The species-specific models were in the form(Jucker et al. 2015; Bouriaud et al. 2016):

where ΔBiis the 5-years biomass increment of tree i in plot j given its current biomass Biand top height hi; αjis the random, plot-level intercept, parameters β1and β1are unknown and the residual variance ε is assumed normally distributed.
The tree diameter over bark is measured directly in the field during the coring. The historical diameters are estimated by subtracting the width of the last 5 rings.Bark thickness growth is assumed to be proportional to the diameter growth in accordance with Bakker (2005).All samples were dried and sanded before being scanned at 1200 or 2400 dpi using a flatbed scanner depending on the condition of the samples and the width of the rings. The ring width series were measured as well as the distance to pith, when missing, using the C-Dendro suite (Cybis Elektronik & Data AB Saltsj?baden,Sweden). Absolute dating and potential measurement mistakes or missing rings were tracked and corrected using C-Dendro.
Relative stand density index
The relative density index (RDI) was computed in order to provide a quantitative description of the stem crowding independently from tree size and age, based on the self-thinning theory. High RDI indicates dense stands and low RDI open stands. The RDI has been thought for long to be a log-log linear relationship between the mean quadratic diameter and the stem density (Reineke 1933;Enquist and Niklas 2002),but recent studies have pointed out important curvature in the relationship (Charru et al.2012). Moreover, the relationship varies among studies and seems to be influenced by site fertility. It therefore seemed important to fit a new Romania-specific model on the basis of the NFI data. The model was a curvilinear fit(Additional file 1: Figure S2) using the R package Quantreg(v5.33,Koenker 2017):
lnN=a+b× ln Dg+c×(lnDg)2, where a, b and c are unknown parameters estimated for the 95th quantile.
Dominant height
Dominant height was used as a proxy for site fertility for its very low sensitivity to stem density and high correlation with stand productivity (Assmann 1970; Skovsgaard and Vanclay 2008). Here, dominant height was defined as the mean height of the four largest trees, estimated for each plot. The dominant height was subsequently modelled using a dominant height-age logistic model, fitted on the NFI data (Additional file 1: Figure S3) using the nls R function.
Statistical methods
The first hypothesis is that biomass stocks are not affected by management or treatments, even in the most intensive treatment type. The second hypothesis is that the productivity is not depressed on medium or long terms by successive cuttings, hence that intensely managed forests have a similar productivity level to that of low intensity forests.
The influence of forest management type and treatment on the aboveground biomass was tested using a multiple linear model (mlm) where stand age, dominant height, stem density are independent variables, management type or treatment are categorical, fixed factors.The rationale of using a mlm model is that all variables and factors and their potential interactions are readily included in the model. The dependence of the aboveground biomass stock and of the productivity on factors,common to all forest types and treatments, was thus represented by the continuous variables while the effects of the management types and the treatments were represented by the categorical variables. A significant coefficient associated with a factor represents a significant influence of the factor on the biomass stock or the productivity.
Additionally, an ANOVA was performed to compare the biomass or productivity per management types and treatments. Type-II errors were computed in order to estimate the error risk of accepting the null hypothesis(that there are no significant differences).
A complementary test was made for situations where a group has a highly different number of plots, as in the case of protected and protection forest. The test was based on resampling the plots with replacement, such that groups have the same effective for mean and variance estimations.
All statistical analyses and models were made in R(3.3.0; R Development Core Team 2016).
Results
Forest management and stocks
Aboveground woody biomass increased with stand age across all management types and treatments to reach ~300 t·ha-1at 100 years (Fig. 1). Up to this age, the biomass increase along stand age was very similar among management types and treatments in spite of their different cutting intensities (Fig. 2). Noticeably, the range and maximum values were also very similar (Table 1).The model showed no significant effect of the management type on the aboveground biomass before final harvest (Table 2).
Conformingly the ANOVA per age classes showed no significant influence of the forest management type on the aboveground biomass (Table 3), except for the age classes 30, 60 and 80 age classes, which showed an overall higher biomass on production forests than in protection forests despite the thinnings occurring in production forests at these ages. Furthermore, no significant effects were noticed during the ‘dead period' theoretically without cuttings at 90-110 years.
The tendency for reduced biomass stocks after 100 years in production forests indicates the effects of regeneration harvests. Comparing the biomass stocks over the entire production cycle (i.e. including the harvest age range 100-160 years), the protection stands had significantly more biomass (about 92 t·ha-1) than production stands (Table 2).
Despite the cuttings, the biomass was very similar in age class and group shelterwood forests (Fig. 1) with no significant overall effect of the forest treatment on the aboveground woody biomass (Table 3). The biomass was indeed slightly but significantly lower in age class forests at stand age 30 (in the order of -25 Mg·ha-1) but higher(in the order of +20 Mg·ha-1) at age 60 (Table 3).
Influence of management on production
Stand production was quantified as the stand-level aboveground biomass increment over the last 5 years.Higher production in the 30-80 years old range was observed for production forest due to taming and thinning(Fig. 3) compared to other management types. Despite the successive cuttings, the stand production of production forests remained at a level comparable or was even higher than that of protection (low cuttings) or protected (no cuttings) forests at stand ages exceeding 100 years old. The surge in growth at ages around 150 years corresponds to the harvest cuttings, which boost the growth of the remaining trees.
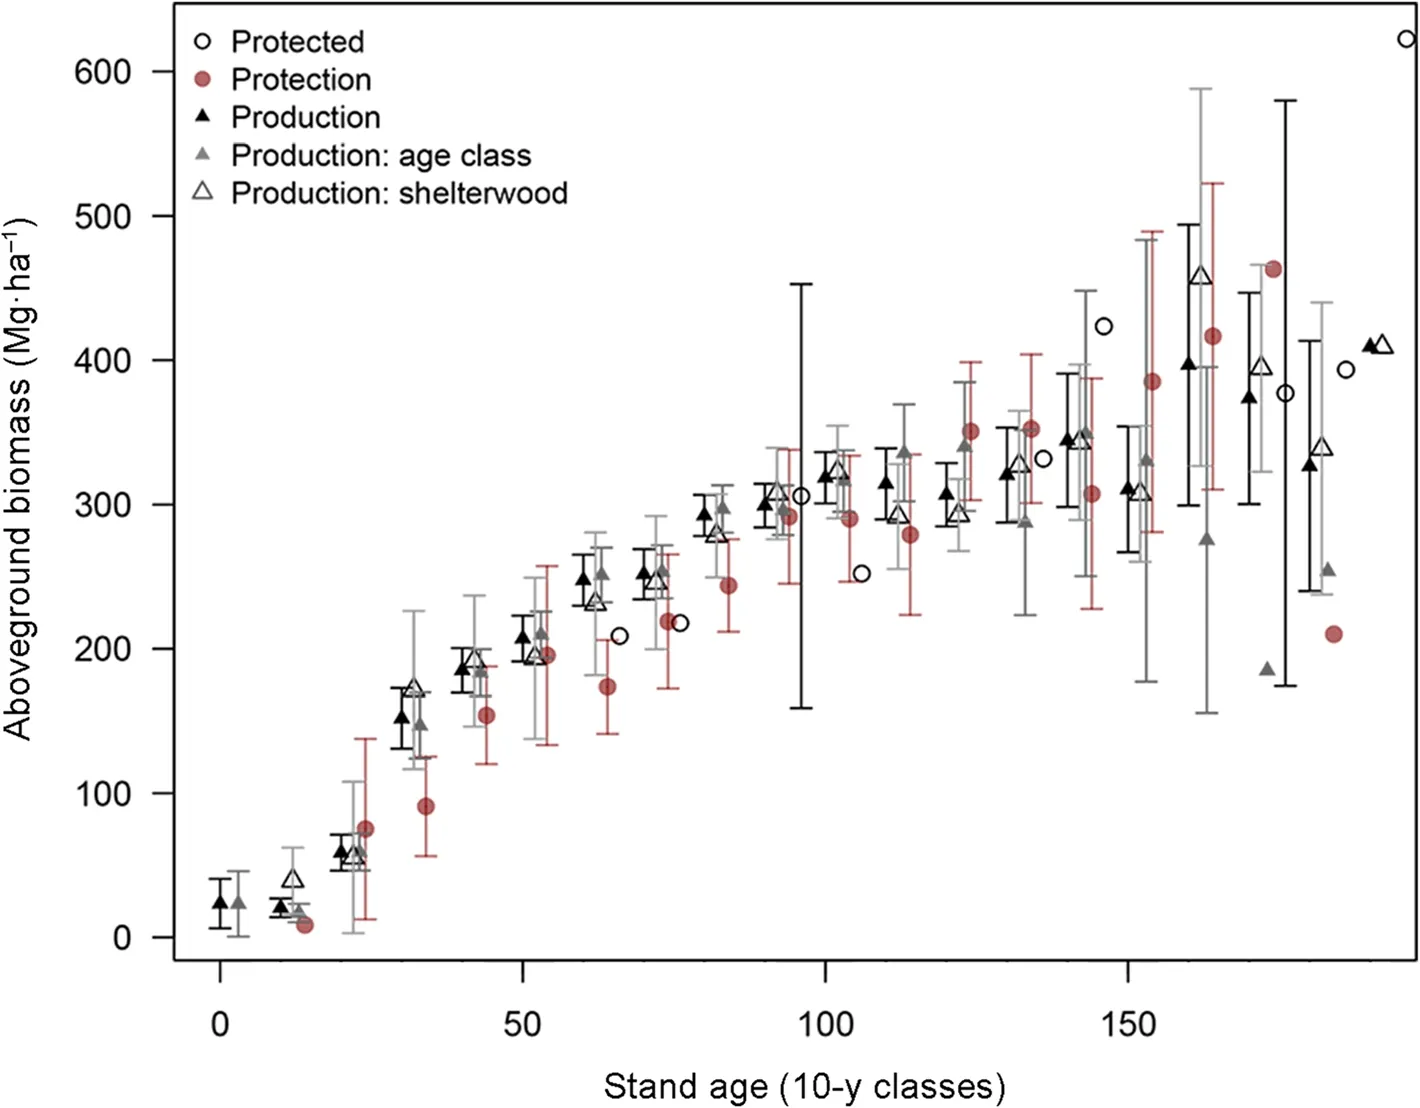
Fig.1 Comparison of the standing biomass per age classes for the three different forest management types and treatments. A small shift on the X axis for each group was introduced to avoid overlay.Bars represent 1 SD and are displayed only for groups larger than 5 plots.Significance of the difference in biomass among management types or treatments are displayed in Table 4
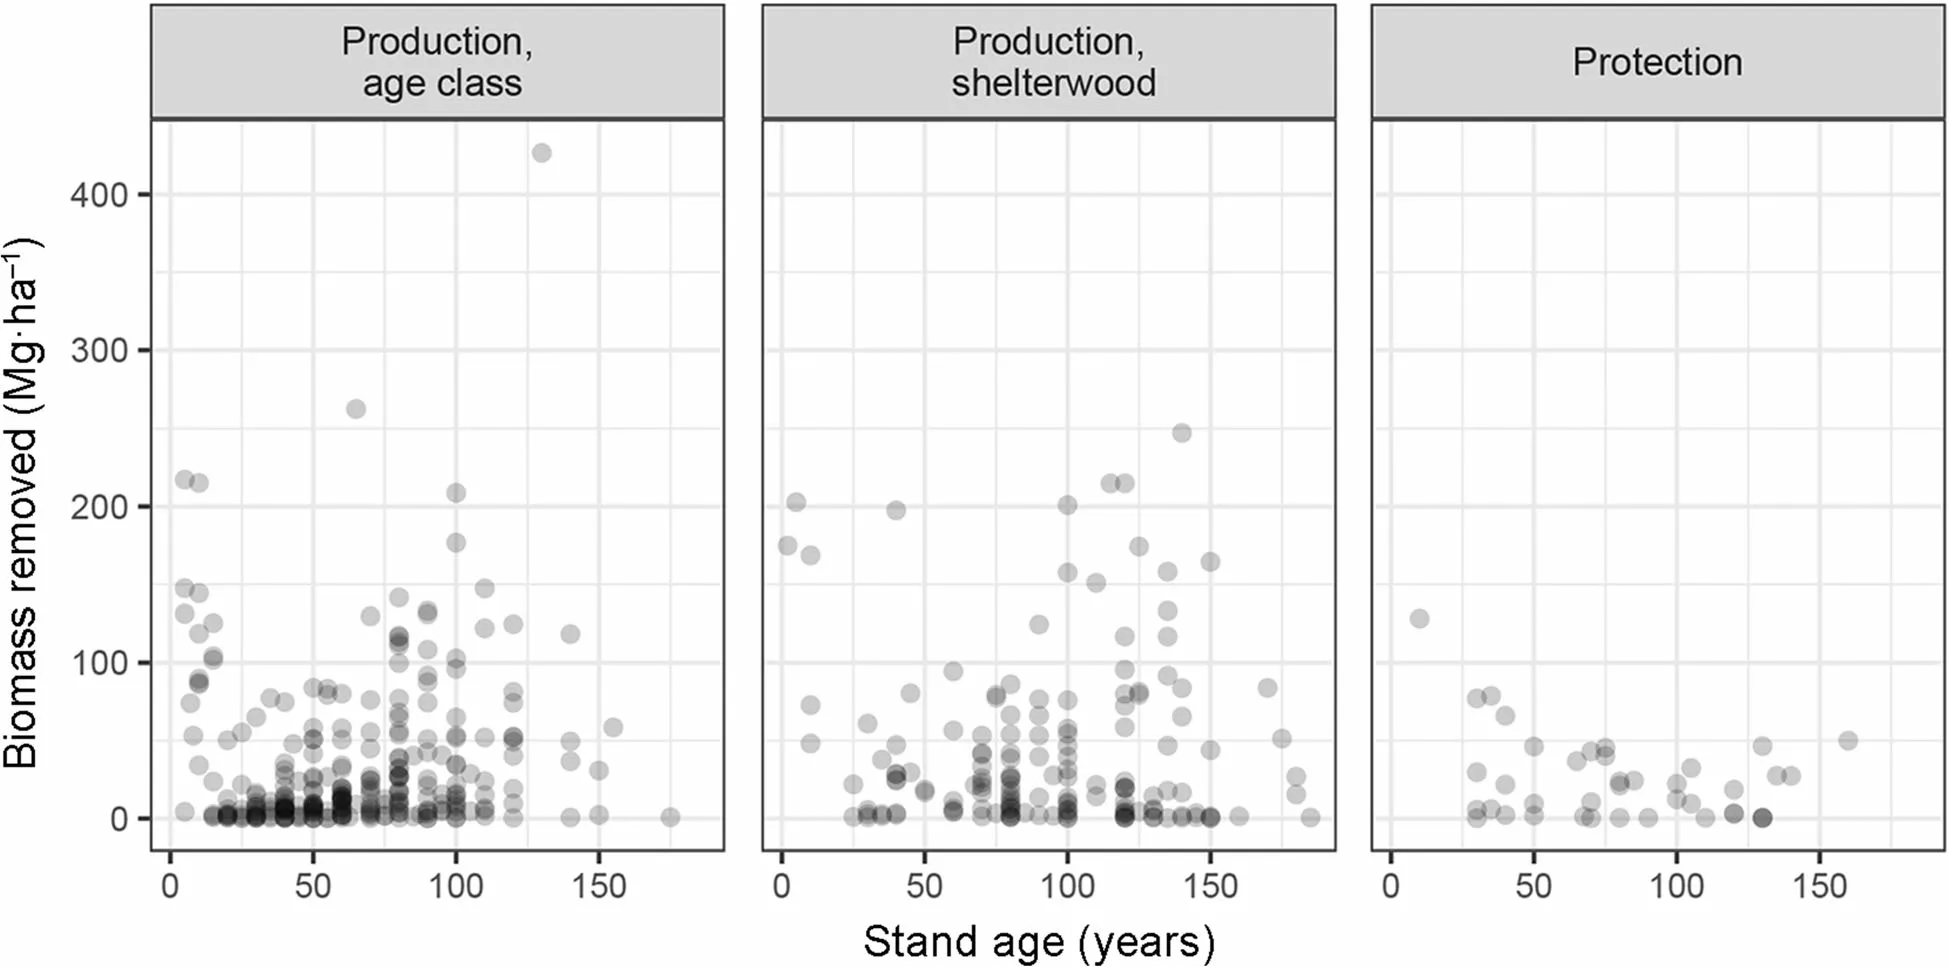
Fig.2 Distribution of the biomass recently cut against stand age for production and protection forestsThere is one dot per plot.By definition of the management types,there are no cuttings in protected forests,which are thus not represented here
Stand production was primarily correlated to the standing biomass (Fig. 4). The rate of biomass increment was relatively equal throughout the observational network: 2.4% on average. The upper limit of production decreased with age in protection forests too. The lm model explained over 67% of the variance in production and showed that standing biomass, fertility, stem density and stand age were all significant drivers of the biomass production (Table 4). In contrast, the treatment was not a significant factor, nor was the number of trees recently removed or their cumulated biomass, showing that past cuttings,by thinnings or by harvests,have little influence on the current stand production.
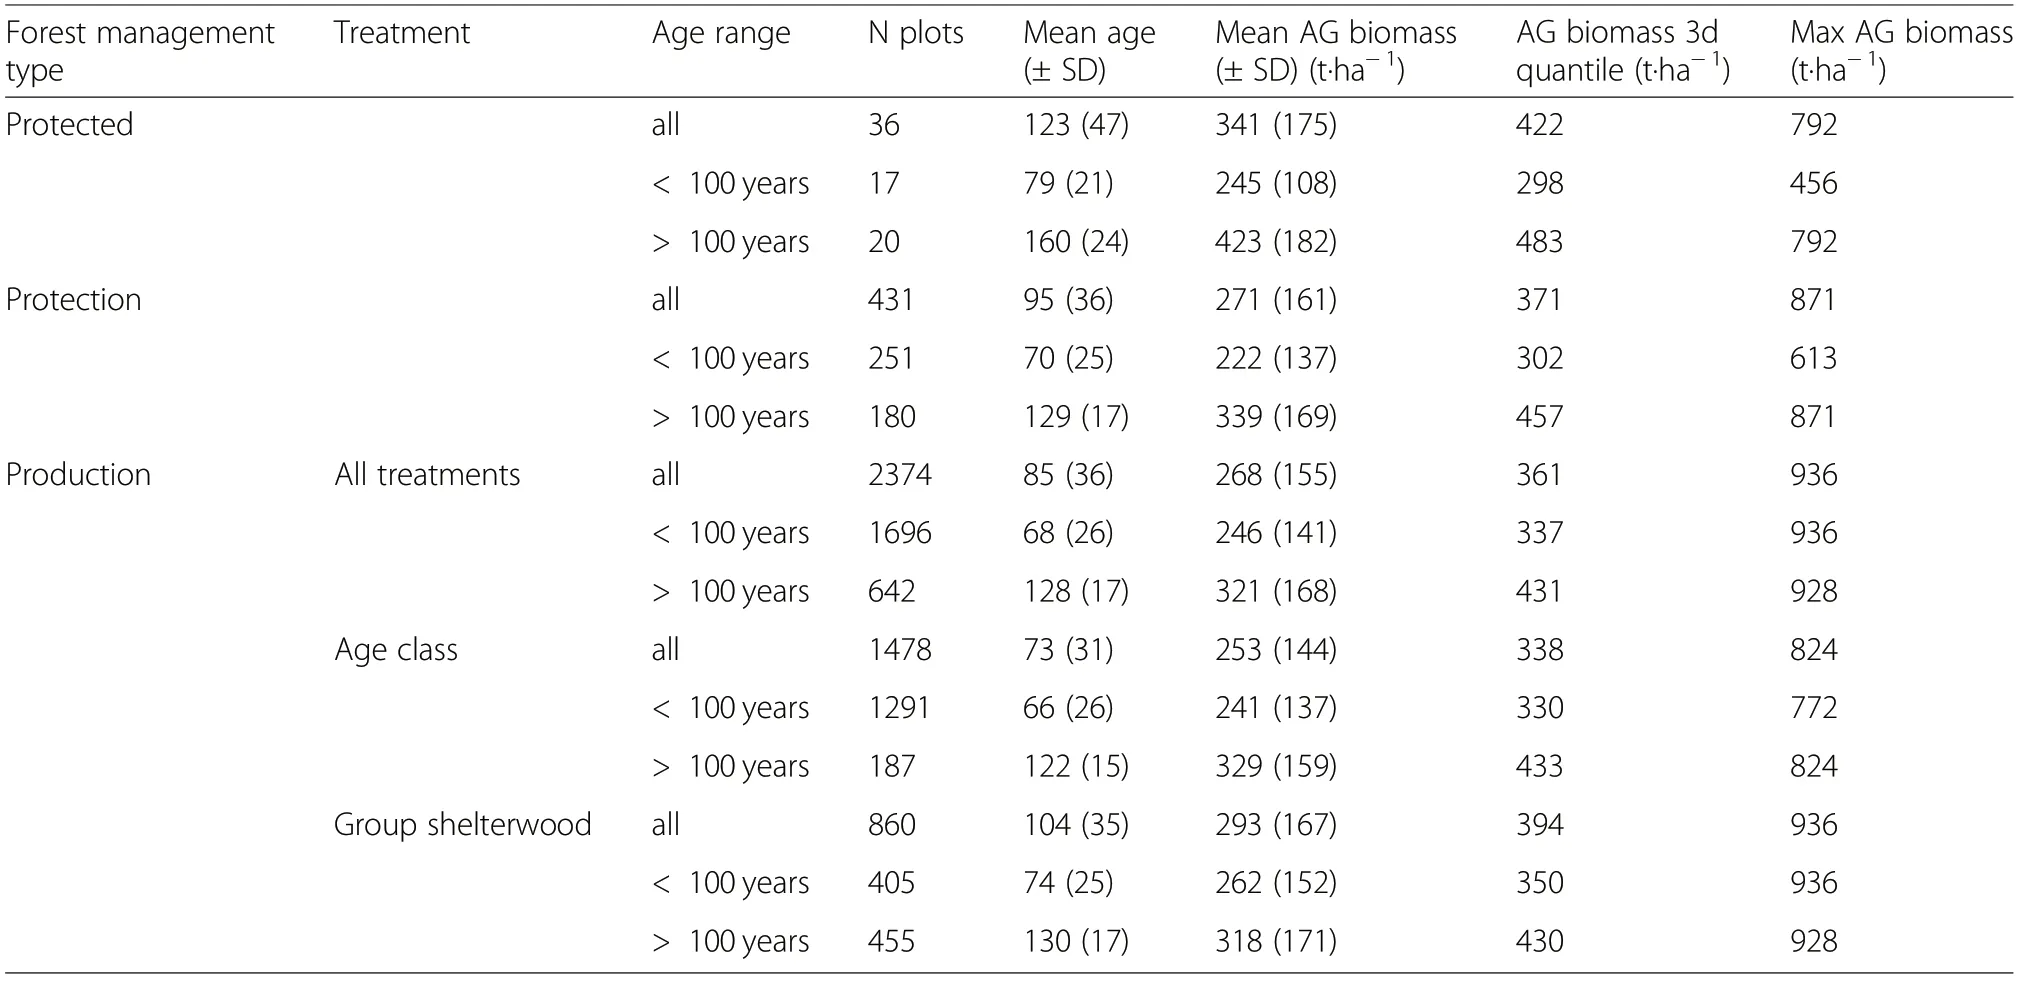
Table 1 Number of plots, aboveground biomass per forest management type and forest treatment

Table 2 Parameters estimation and significance of the aboveground biomass model with forest management type as categorical variable before harvest (age <100 years) and with harvest (all data)
Individual tree growth was, however, markedly improved at low stem densities. Radial growth was indeed significantly higher for trees growing in scarce stands (RDI <0.92, 0.92 being the median RDI value over the network) as compared to higher density stands (Fig. 5): the mean ring width in stands with a lower relative density was on average 17% larger during the last 5 years than in stands with RDI >0.92, although the sampled stands of each category were of similar age.
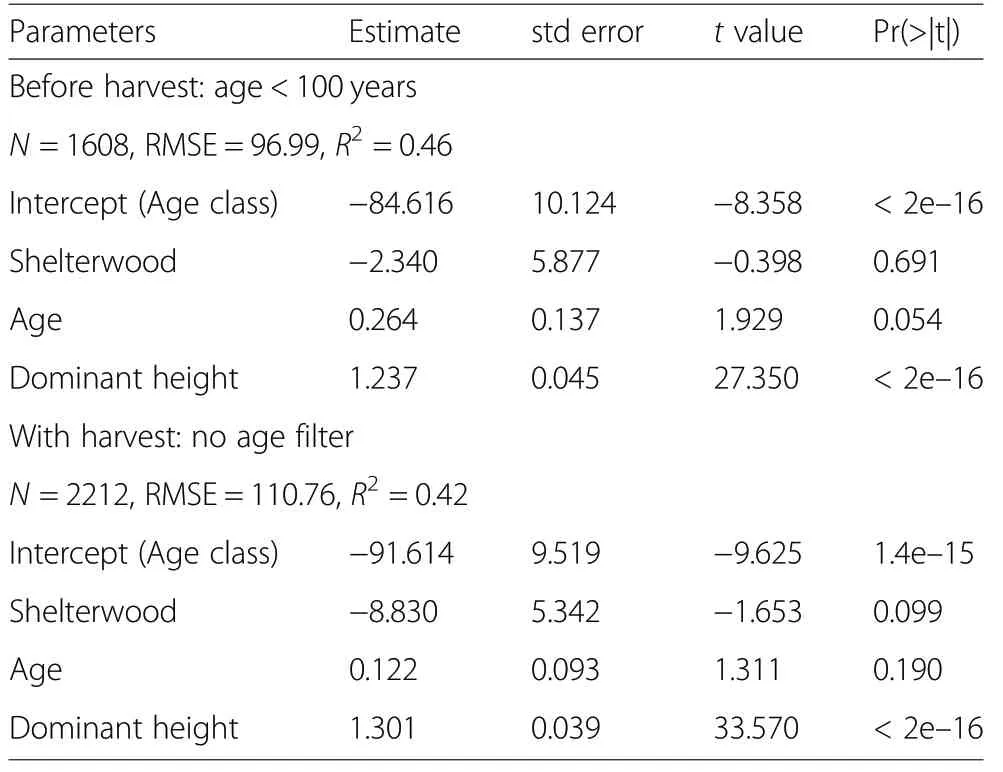
Table 3 Parameters estimation and significance of the aboveground biomass model with treatment as categorical variable before harvest (age <100 years) and with harvest(all data)
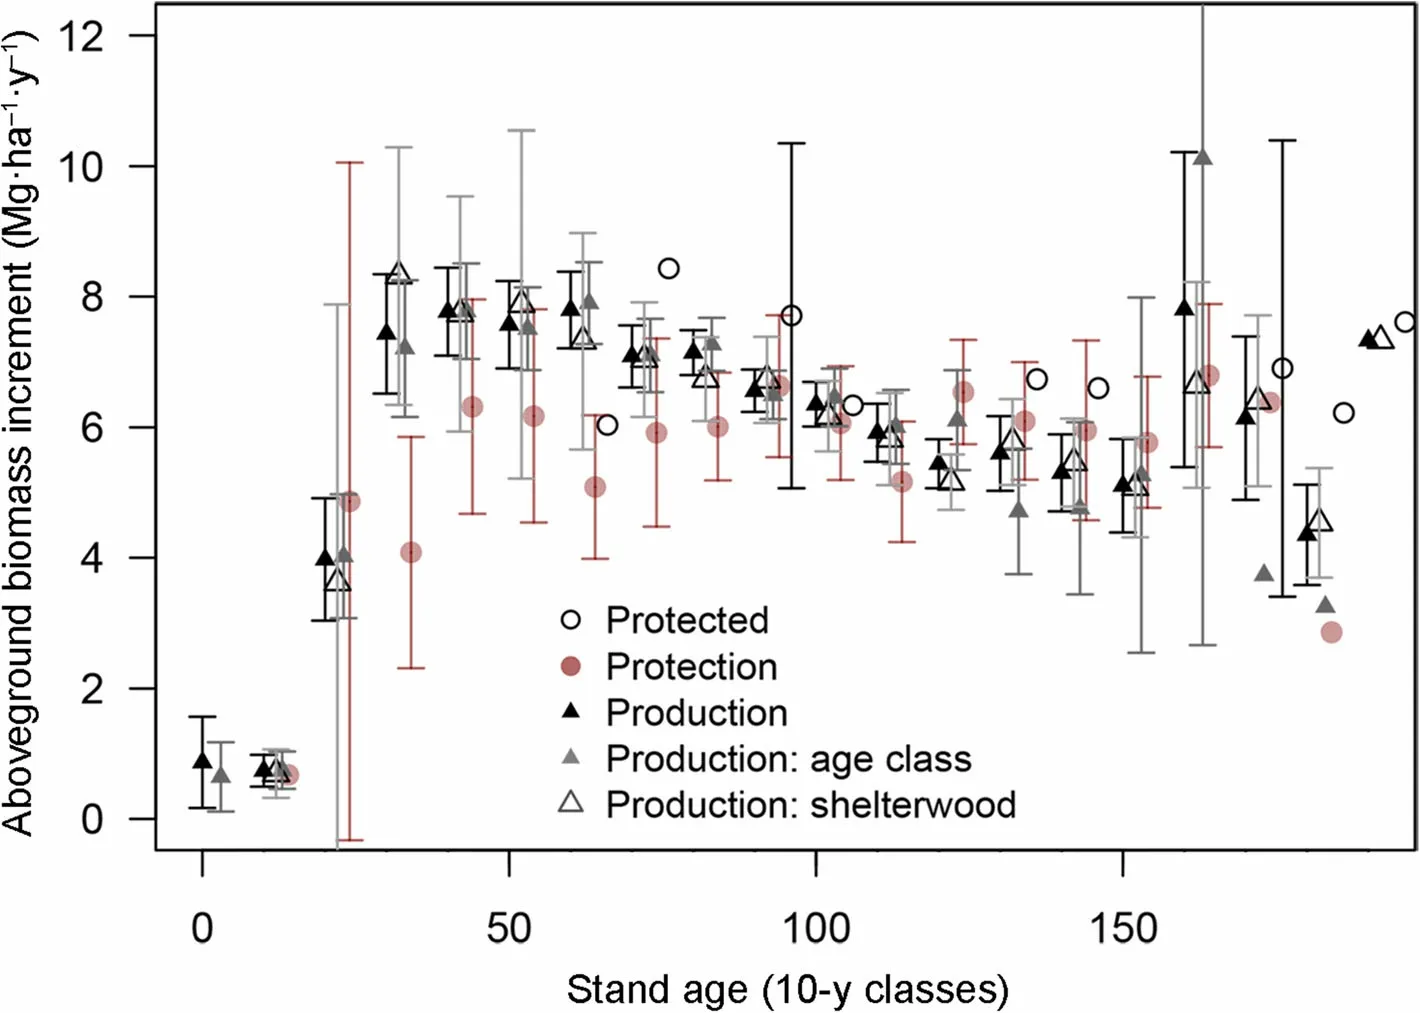
Fig.3 Comparison of the biomass production per age classes for the three different forest management types and three treatmentsA small shift on the X axis for each group was introduced to avoid overlay.Bars represent 1 SD and are displayed only for groups larger than 5 plots
Management and deadwood
The total amount of downed or standing deadwood was not significantly different according to the management types or treatments because the variability within each category was very large (Table 5, Fig. 6). Likewise, the range of deadwood biomass was very comparable although the highest values were observed in protection forest.
The smaller number of observations in protected forests and the lack of regeneration in protected forests may have influenced these results. The plots were therefore randomly drawn from the population of plots in each category (production, protection and protected forests) in such a way that the number of plots is equal in all categories. This resampling test confirmed that the mean values per category and dynamics were similar among treatments and not caused by the imbalanced number of plots(Additional file 1: Figure S4).
The contribution of the branch piles and stumps in managed forests was always small compared to that of lying dead trees (Table 5). The biomass of standing dead trees was similar to that of lying deadwood, with no significant effects of management and treatments but much larger standing deadwood stocks in protected forests only. The relation between total deadwood and living biomass was very weak (R =0.04) and not significant.
Rotation-cycle cumulative biomass production
The total wood production before final harvest was estimated by adding the average living stock to the average cumulative harvested biomass (Fig. 7) per management types, treatments and age class. The resulting average cumulative amount of produced biomass reached 450 t·ha-1at 100 years (before harvests) in production forest against 380 t·ha-1in protection forest,but this difference was reduced towards the end of the cycle (after 140 years). Cumulated biomass differed markedly between treatments (Fig. 7 right): the mean value exceeded 600 t·ha-1after 140 years in group shelterwood while it remained below 500 t·ha-1in age class forests. At the end of the rotation cycle, all biomass is harvested in age class forests, contrary to all the other treatments where permanent cover is maintained. Thus, the average aboveground biomass over a rotation cycle was 9%higher in production forest than in low intensity managed forests or in protected forests.
Discussion
We found that forest management type had no significant effects on the aboveground living biomass stocks of beech forests across Romania within a production cycle,despite important effects on the stand density and structure, and the temporarily significant reduction in stocks.More intensively managed forests had an equal or even higher stock at a given age than protected forests. Productivity was slightly higher in forests used for wood production throughout the production cycle, but overall no statistically significant effects of management type and management intensity on the standing stock and the production of the forests were detected at country scale.The cumulative amount of biomass produced at the end of a cycle was, however, higher in production forest, particularly in group shelterwood,than in protected forests.
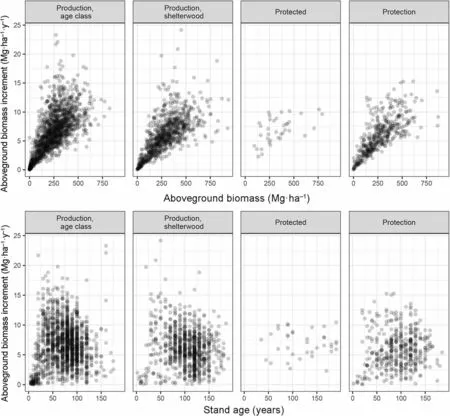
Fig.4 Relation between the production(mean AG biomass increment over the last 5 years)and the AG biomass(up)or the stand age(down)according to the forest management type and treatment
Forest management type
Management type had limited impact on beech forest biomass stock and productivity, except for the obvious decrease in stocks when regeneration harvests start after 100 years. More intensively managed forests were indeed having a higher stock at 100 years than protected stands.These results at country scale (2.47 Mha) are in agreement with Nunery and Keeton (2010) -though based on simulations only- and references herein, De Simon et al.(2012) and Schaedel et al. (2017), suggested few consequences of forest management on the long-term biomass stocks. Our results are also in agreement with the fact that, on an even larger scale, there was an increase of the European forest biomass and a strong relationship between forest biomass and productivity during the last 50 years, in spite of their intensive use (Ciais et al. 2008).In the short term, however, in agreement with Keeling and Phillips (2007), productivity was strongly related to the standing biomass, with a rate being surprisingly stable through management types and treatments.
Recent cuttings were not found to affect productivity.These results are in agreement with Herbst et al. (2015)who showed that carbon fluxes measured using eddy covariance (particularly, the net ecosystem productivity rates) and biometric methods did not differ significantly between an unmanaged and a managed stand of beech in Germany.For other tree species also, stand productivity decreases only slightly even at high thinning intensity(Assmann 1970). Using Eddy covariance to measure CO2exchange between beech forests and the atmosphere, Granier et al. (2008) and Pilegaard et al. (2011)reported no effect of thinning on the net ecosystem CO2fluxes over beech stands, supporting the fact that productivity is not necessarily affected (reduced) by thinning.
The positive effects of management on individual tree growth are well documented for beech (Le Goff and Ottorini 1999; Pretzsch 2005 and references herein; van der Maaten 2013) and seem universal (Juodvalkis et al.2005; Zeide 2005; Zhou et al. 2013), but are much less obvious at stand level. Here, we observed that stands with a lower density had a larger individual growth, in agreement with the principle that productivity is concentrated over fewer, selected trees. This can be explained by the short-term increase of light interception and light use efficiency of the remaining trees in thinned stands(Granier et al. 2008), in combination with the ability for lateral growth of the crown of the remaining trees (Pouderoux et al. 2001). The highly dynamic growth of beech enables this species to rapidly close openings (Collet et al. 2001), also upon thinning (Pouderoux et al. 2001)where the leaf area index can reach pre-thinning values in a matter of three years even after a 40% decrease(Bouriaud 2003). Besides reducing vulnerability to drought thanks to a reduced rain interception and transpiration, thinning was also shown to prolong growing season's duration of beech stands (van der Maaten 2013).
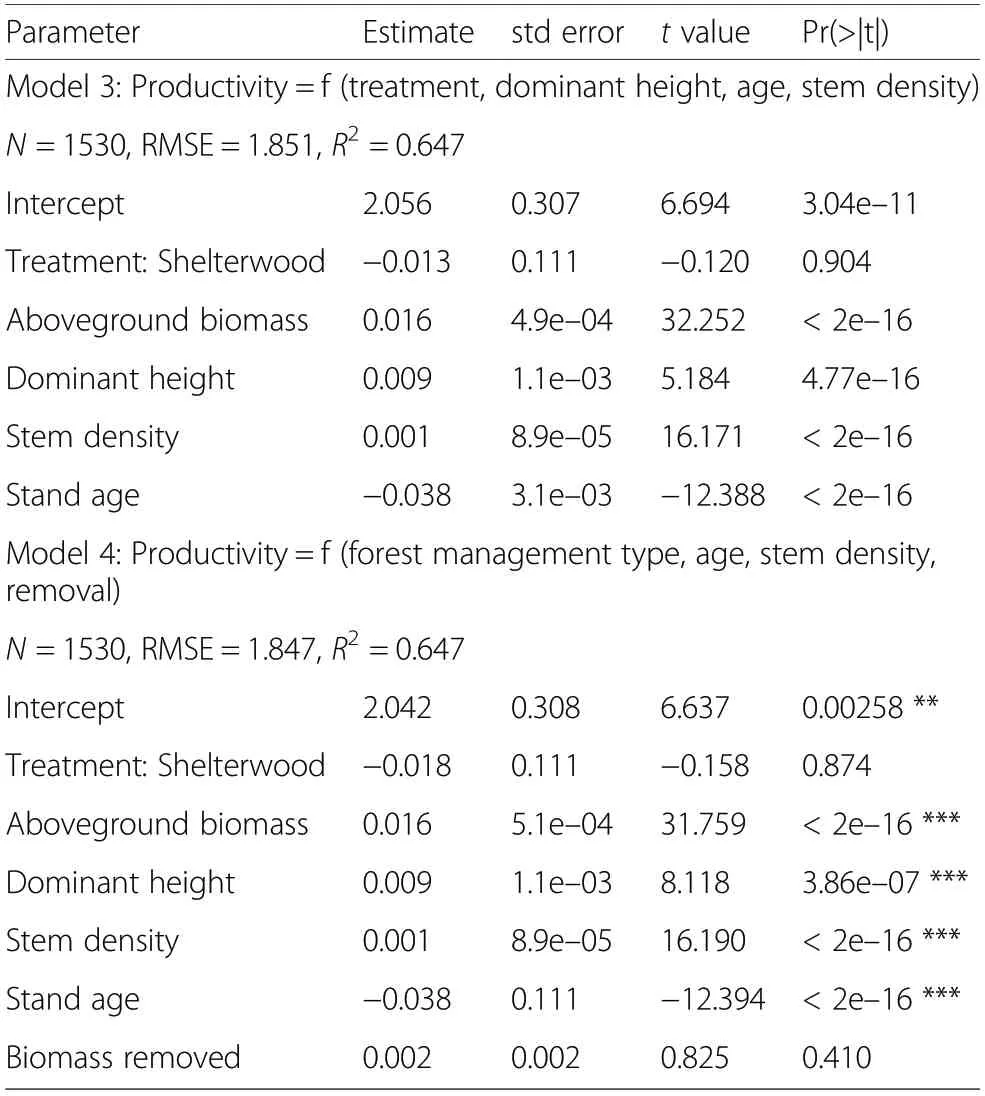
Table 4 Model of the productivity(5-years aboveground biomas increment,Mg·ha-1·y-1)as a function of the dominant height,the stem density,the stand age and the forest treatment,analysed for production forest only before harvest
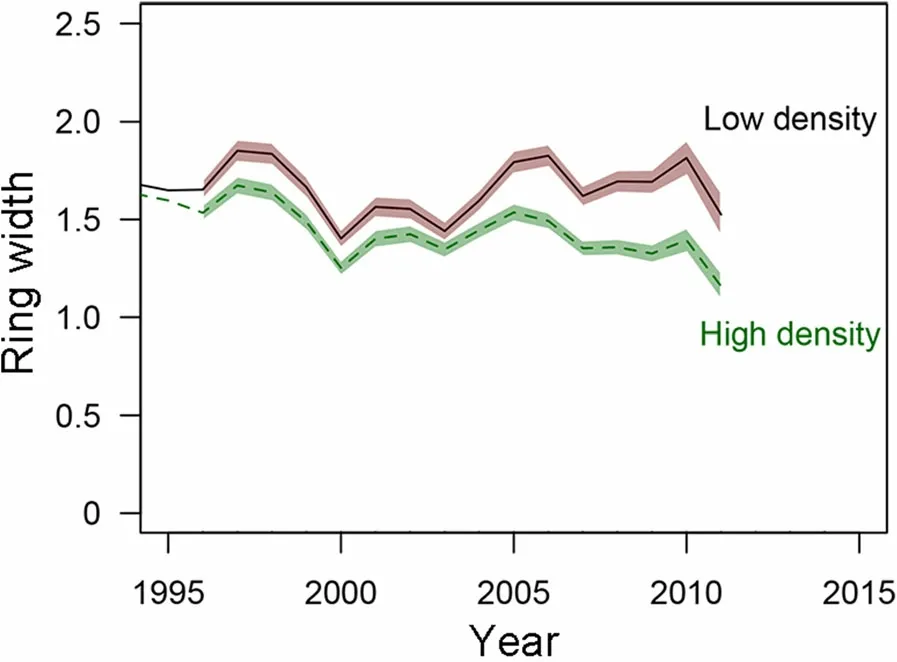
Fig.5 Average ring width of the trees growing in stands with low stem density(RDI <0.92)or high density(RDI >0.92).Bands represent the confidence interval of the mean(±2 SD)
These responses explain the apparent paradox,whereby the productivity was primarily related to the standing biomass, yet the influence of recently removed biomass was not significant, nor that the management type or the treatment significantly affected the standing biomass or productivity. Overall, tree stems contain very little nitrogen (Augusto et al. 2008), and therefore wood nitrogen losses due to thinning and stem removal are very likely easily compensated by atmospheric N deposition. The situation might be different for phosphorous and potassium, whose concentrations in stems are not negligible (Netzer et al. 2017) and whose export during thinning might exceed atmospheric inputs. In regions with young, fertile soils, potassium and phosphorous release from mineral weathering probably replenishes their stocks.In sandy areas,however,sustained removal of potassium and phosphorous in production forests may negatively affect tree growth, albeit only in the long term.
Forest treatment
Romanian beech forests typically regenerate naturally,and the stem density starts at very high values at low stand ages (Additional file 1: Figure S3), especially for even-aged stands. Tendering and thinning operations subsequently reduce the stem density, but the observed effects of the thinnings on biomass stocks or productivity were highly transient and no visible relation was observable between the recent cuttings and the standing biomass (Fig. 2). The average intensity of forest management is low in Romania, compared to other countries such as Germany (Bouriaud et al. 2016) with a strong deficiency in tendering, and thinning intensities being only frequency half that of Germany. Nonetheless, the relative stand density index RDI was below 0.92 for 50%of the stands and below 0.87 for over 25% of the stands in production forests, which means that management had a visible effect on the stand structure. The higher productivity at ages <100 observed in production forests as compared to protection or protected forests may have resulted from the stimulating effect of the tendering and thinning, which were shown to have long-lasting and large-scale stimulating consequences (Bouriaud et al.2016; Zhou et al. 2013). The inter-tree competition for light was indeed found to be the strongest amongst trees growing in monocultures (Jucker et al. 2014) where canopy structure cannot avoid competitive inhibition.Competition is a strong factor controlling tree growth and is avoided primarily by thinning. In Romania, forest stands enter by law into a 25-years ‘dead period' with no cuttings at around 100 years (Schulze et al. 2014; Bouriaud et al. 2016). The associated increase of competition seems to have visible effects at stand scale by levelling off productivity. The high tolerance to shade of beech and its great canopy plasticity (Pretzsch 2014) may create the conditions for stagnation (decrease in stand-level productivity at high stand density), which is eventually followed by natural mortality. Beech was indeed shown to survive to suppression (i.e. remain in the shade of dominant and codominant trees)several decades(Peters 1997). Nevertheless, we observed more natural mortality (standing dead trees biomass) in less intensively or unmanaged stands. The distribution of snag biomassshows a strong decline in age class forest beyond age 100,while snag biomass increases in unmanaged forest at ages>100 years. Apparently, snags are harvested, or destroyed for working safety in managed forests at harvesting age.In unmanaged forest, most trees die due to fungal infection,mainly by Fomes fomentaria (Purahong et al. 2014) at an age of about 150 to 250 years(Schulze 2018).
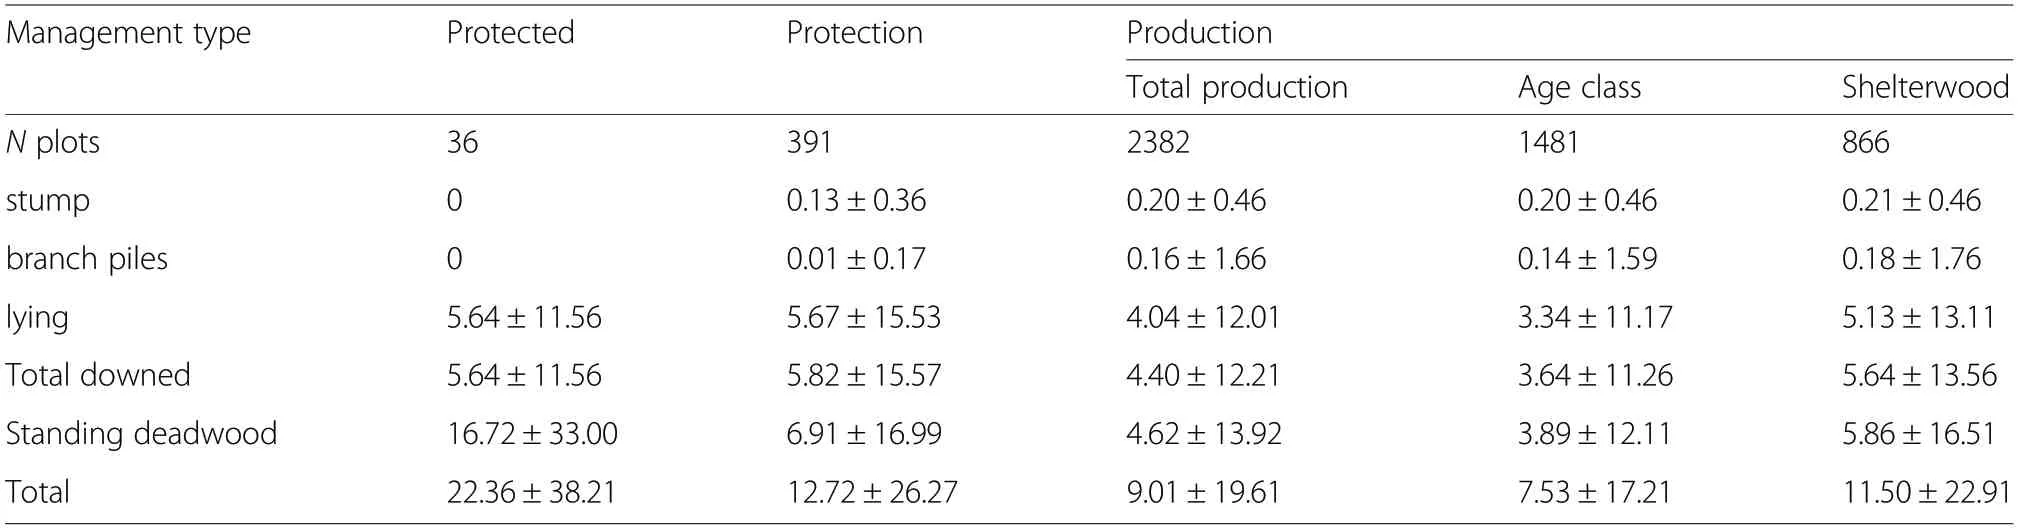
Table 5 Mean biomass (t per hectare ±1 SD)of deadwood per management types and treatments
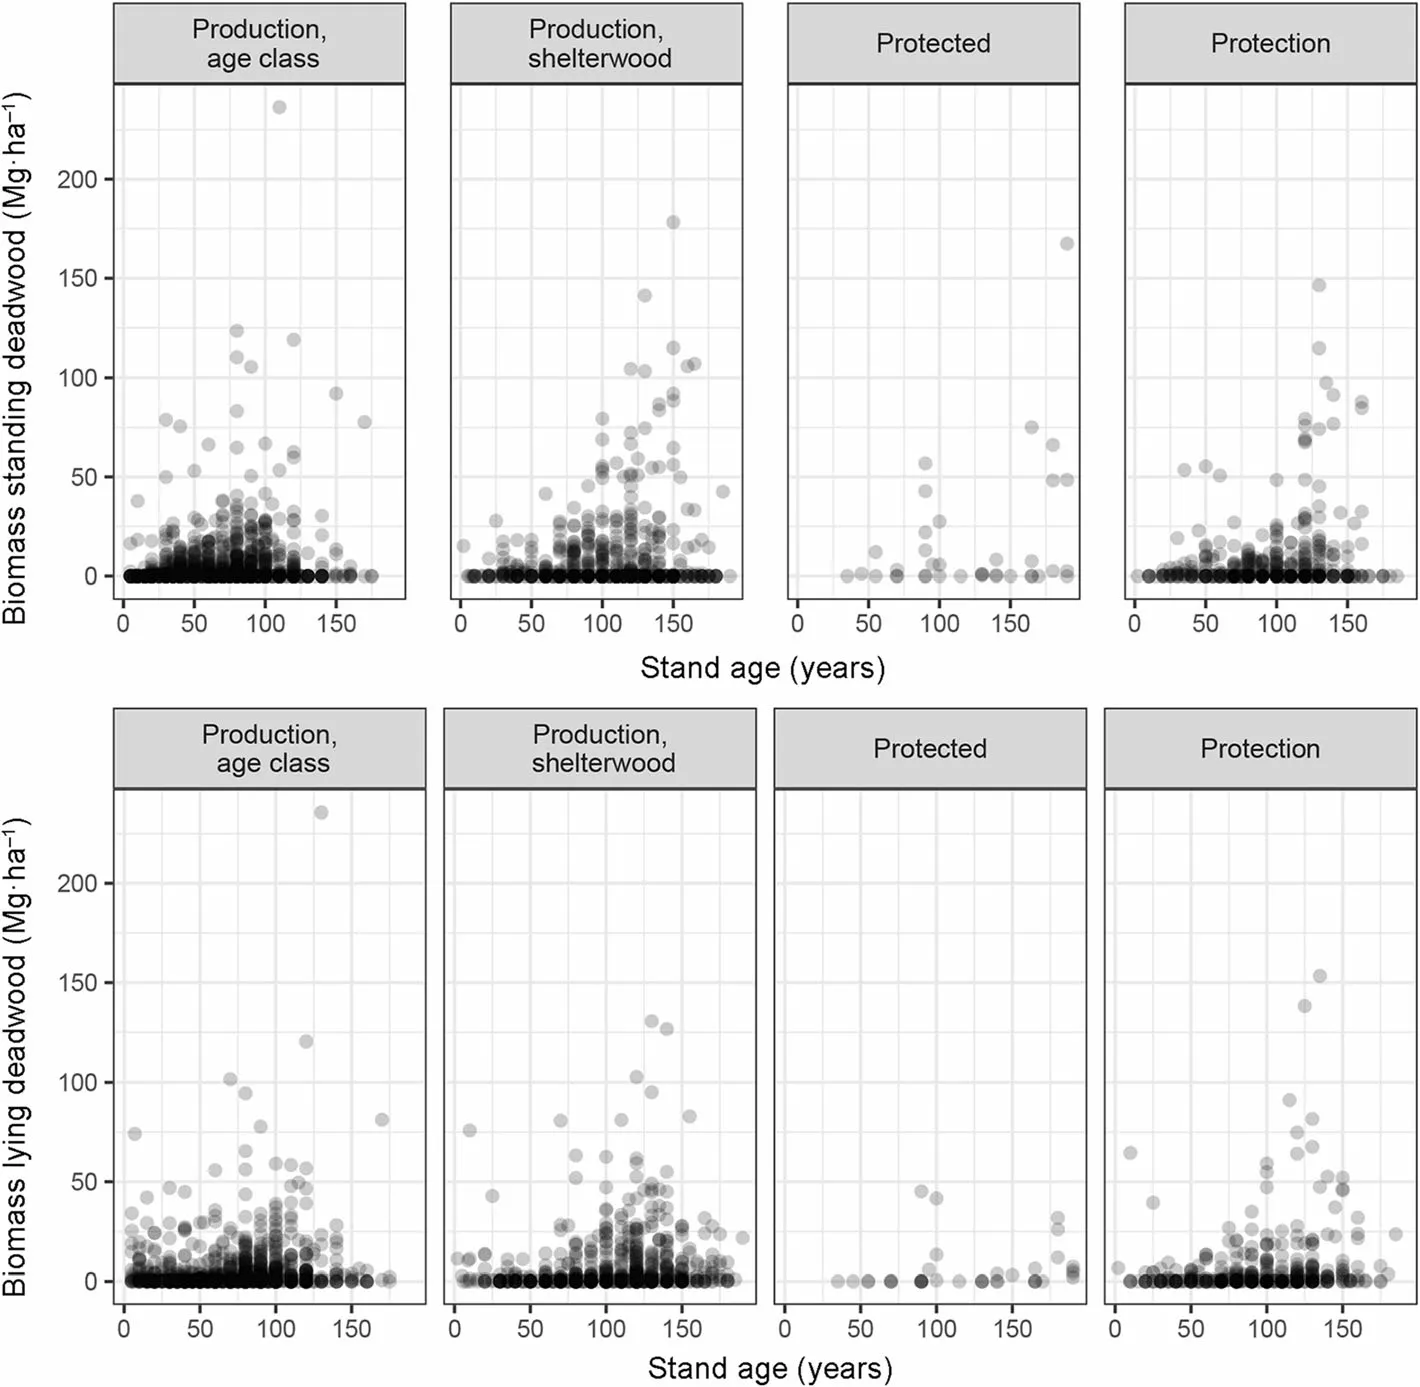
Fig.6 Relation between the standing deadwood biomass (up)or lying deadwood biomass(down)and the stand age
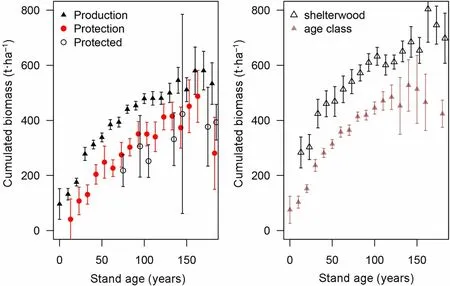
Fig.7 Biomass accumulation curves(standing plus cuttings)per forest management types(left) and treatments (right)
The lying deadwood biomass exhibited low values across the entire observational network. We found 77%(~2 t·ha-1) more standing deadwood in protected forests than in production forests and more than three times as much standing dead biomass in protection forests. The low amounts of downed or lying deadwood were probably attributable to fast decomposition. Assuming a 50% C concentration,the deadwood pools contained between 3.5 and 11.2 Mg·C·ha-1, which remains within the range of values encountered in unmanaged beech stands in Germany(Mund 2004;Mund and Schulze 2006)and Italy(De Simon et al.2012).Very high deadwood biomass may be observed in wind-throw patches in protected oldgrowth forests but such a situation was not encountered in the entire inventory network.
Our study did not cover the belowground stocks,for which dedicated measurements and allometry models are lacking. It can be hypothesized that forest management in Romania has a reduced influence on these stocks since low level disturbance was shown to have little effects on the soil C pool (De Simon et al.2012) and the effects of harvests on below-ground C are temporary (Nave et al. 2010). Given the importance of the soil C pool, which has approximately the same size as the aboveground C pool for Fagus forests (De Simon et al. 2012 and references herein),further studies are needed to obtain a complete picture of the belowground components.
Implications for forestry
Our results show that under the current management in Romania beech forests can sustain cuttings at young stages without reducing their standing stocks and productivity at maturity. The amount of cumulative biomass,however, proved that the stands used for wood procurement have an excess production of over 100 t·ha-1(~50 Mg C·ha-1) compared to forest stands with protective function. The biomass removed is therefore more than compensated by the accelerated growth of the remaining trees. Similarly, Pretzsch (2005) reports from long-term experimental plots a higher cumulative volume in heavily thinned stands than in low-intensity thinned stands for beech. More wood obtained during the rotation has important implications for the active contribution of forest stands to climate change mitigation through fossil fuel substitution (Birdsey and Pan 2015). It has been hypothesized that primary forests tend to store more carbon than managed forests (McKinley et al. 2011), but, as underlined by several previous works, managed forests can have a greater contribution to reducing the atmospheric CO2once the substitution wood products and biomass for energy are accounted for (Schlamadinger et al. 1997;Fahey et al. 2010; Birdsey and Pan 2015).
In face of global environmental changes, the recommendations for silvicultural actions are to give priority to actions that can increase tree vigour, such as the early selection of future trees (Hemery 2008). The implementation of a pro-active forest management more adapted to climate changes seems to be unfortunately rather challenging due to institutional locks (Bouriaud et al. 2015; Sousa-Silva et al. 2018). Our results suggest that a reasonable silviculture should be envisaged that does not compromise C storage targets (Thornley and Cannell 2000; Garcia-Gonzalo et al. 2007; D'Amato et al. 2011). Decreasing the management intensity in production forest results in dense and closed canopy and a repression of light-demanding species, thus reducing plant biodiversity. Given the tendency of beech forests to be monospecific and with the view of promoting species diversity, silvicultural interventions are necessary to help less competitive species in admixture (Petri?an et al. 2017). Climate change and nitrogen deposition were not studied here but could have strong impacts on productivity. Positive trends in growth were indeed widely reported in Europe for Fagus (Dittmar et al.2003; Aertsen et al. 2014), which are probably attributable to these factors. While these trends are likely not to alter the compensation of cuttings by the increased growth of remaining trees, the cutting intensity needs adaptations to the current growth rates. More frequent and intense droughts could however reverse the trends since Fagus is particularly responsive to drought(Scharnweber et al. 2011), and signs of inflections were already reported (Bontemps et al. 2010). The consequences for the stock and C pools are much more difficult to predict: higher mortality and increasing disturbance frequency could counterbalance the improved productivity of the stands.
Though this would require more research, there are clues that the conclusions drawn here on Fagus forests can be extended, to the least, to other forests dominated by a shade-tolerant species. The positive reaction of trees to thinnings of various intensity(Wallentin and Nilsson 2011), the dynamic of gap closure and recruitment are indeed general mechanisms that allow the rapid compensation of biomass losses caused by cuttings.
Conclusions
Our results confirm the hypothesis that forest management, despite its successive cuttings and modifications of stand structure, has temporary effects that does not reduce the biomass stocks on the long term and on a large scale in Fagus forests. Conversely, the cumulated biomass, which represents the total amount of biomass produced, was higher in managed forests. Noticeably,the management intensity in Romania is low compared to other European countries. These results are probably limited to forests where the cutting intensity and frequency is sufficiently low so as to enable a reconstitution of the stocks.Deadwood stocks were not related to management either, with a small contribution of the branch piles and stumps in managed forests. Forests therefore can contribute to the effort of climate mitigation by both storing biomass and contributing to the provision of major ecosystem services such as wood production through management.
Additional file
Additional file 1: Figure S1.Location of the NFI plots used for the analysis. Plots were selected based on the species composition such that beech represents at least 90% of the aboveground volume.Figure S2.Relationship between the stand density (N·ha-1)and the mean quadratic diameter (cm) of the stands plotted for pure beech stands from the NFI network.Figure S3.Dominant height model fitted to the beech stands sampled, all management types included.Figure S4.Relation between the productivity (mean aboveground biomass increment over the last 5 years) and the stands' dominant height (up) and stem density (down)according to the forest management type and treatment.Figure S5.Comparison of the mean deadwood biomass stock per management type and treatment against stand age. The confidence bands represent the mean and 2 standard deviation interval over 200-iterations resampling that aims at compensating for the difference in plot number between categories:35 plots are randomly selected with replacement within each category,36 being the number of plots in the less replicated category(protected forests,cf.Table 1).Table S1.Variance analysis(ANOVA)table for aboveground biomass with management type as factor(left)or treatment as factor(right).Df values are residuals'degrees of freedom(DOCX 2448 kb)
Abbreviations
a.s.l: Above see level; ANOVA: Analysis of variance;C: Carbon (element);dbh: Diameter at breast height; h: Total tree height; lm: Linear model;NFI: National Forest Inventory; R: Correlation coefficient; RDI: Relative density index; t: Tonne (metric)
Acknowledgements
We would like to thank Gheorghe ?tefan for his invaluable technical support,the editor and anonymous reviewers who helped improving sensibly this article.
Funding
The research leading to these results received funding from the European Union Seventh Framework Program (FP7/2007-2013) under grant agreement n° 244122. OB acknowledges support by a grant of the Romanian National Authority for Scientific Research, CNCS-UEFISCDI, project number PN-II-IDPCE-2011-3-0781. IAJ acknowledges support of the University of Antwerp Research Council through its Methusalem program.
Availability of data and materials
The datasets analysed during the current study are subjected to approval.
They can be available from the corresponding author on reasonable request.
Authors' contributions
OB analysed the data and wrote the manuscript. EDS made substantial contributions to the conception and design, the interpretation of data and writing of the manuscript.All authors read and approved the final manuscript.
Ethics approval and consent to participate
Not applicable.
Consent for publication
Not applicable.
Competing interests
The authors declare that they have no competing interests.
Author details
1Integrated Center for Research, Development and Innovation in Advanced Materials, Nanotechnologies, and Distributed Systems for Fabrication and Control, Stefan cel Mare University, 720229 Suceava, Romania.2National Forest Inventory, National Research Development Institute for Silviculture,Voluntari, Romania.3vTI, Braunschweig, Germany.4Department of Biology,University of Antwerpen, Universiteitsplein 1, 2610 Wilrijk, Belgium.5Faculty of Silviculture and Forest Engineering, Transilvania University of Brasov, Str.Sirul Beethoven, nr. 1, 500123 Brasov, Romania.6Max-Planck Institute for Biogeochemistry,PO Box 100164, 07701 Jena, Germany.
Received: 8 December 2018 Accepted: 22 March 2019

- Forest Ecosystems的其它文章
- Assessing the influence of harvesting intensities on structural diversity of forests in south-west Germany
- Designing near-natural planting patterns for plantation forests in China
- The Chapman-Richards Distribution and its Relationship to the Generalized Beta
- Effects of prescribed burning on carbon accumulation in two paired vegetation sites in subtropical China
- The functional complex network approach to foster forest resilience to global changes
- Editorial Board