
A pilot study for distinguishing basal cell carcinoma from normal human skin tissues using visible resonance Raman spectroscopy
2019-07-30 14:13:44ChenghuiLiuBinlinWuLauraSordilloSusieBoydstonWhiteVidyasagarSriramojuChunyuanZhangHughBeckmanLinZhangZhePeiLingyanShiRobertAlfano
Cheng-hui Liu, Binlin Wu, Laura A. Sordillo,3, Susie Boydston-White, Vidyasagar Sriramoju, Chunyuan Zhang, Hugh Beckman, Lin Zhang, Zhe Pei, Lingyan Shi,6, Robert R. Alfano,3
1Institute for Ultrafast Spectroscopy and Lasers, The City College of the City University of New York, New York, NY 10031, USA.
2Physics Department and CSCU Center for Nanotechnology, Southern Connecticut State University, New Haven, CT 06515, USA.
3Department of Electrical Engineering, The Grove School of Engineering, The City College of the City University of New York,New York, NY 10031, USA.
4Science Department, City University of New York, Borough of Manhattan Community College, New York, NY 10007-1097, USA.
517150 Bermuda Village Dr., Boca Raton, Florida 33487-1041, USA.
6Department of Chemistry, Columbia University, New York, NY 10027, USA.
Abstract Aim: The aim of the study is to test visible resonance Raman (VRR) spectroscopy for rapid skin cancer diagnosis,and evaluate its effectiveness as a new optical biopsy method to distinguish basal cell carcinoma (BCC) from normal skin tissues.Methods: The VRR spectroscopic technique was undertaken using 532 nm excitation. Normal and BCC human skin tissue samples were measured in seconds. The molecular fingerprints of various native biomolecules as biomarkers were analyzed. A principal component analysis - support vector machine (PCA-SVM) statistical analysis method based on the molecular fingerprints was developed for differentiating BCC from normal skin tissues.Results: VRR provides a rapid method and enhanced Raman signals from biomolecules with resonant and nearresonant absorption bands as compared with using a near-infrared excitation light source. The VRR technique revealed chemical composition changes of native biomarkers such as tryptophan, carotenoids, lipids and proteins.The VRR spectra from BCC samples showed a strong enhancement in proteins including collagen type I combined with amide I and amino acids, and a decrease in carotenoids and lipids. The PCA-SVM statistical analysis based on the molecular fingerprints of the biomarkers yielded a 93.0% diagnostic sensitivity, 100% specificity, and 94.5%accuracy compared with histopathology reports.Conclusion: VRR can enhance molecular vibrational modes of various native biomarkers to allow for very fast display of Raman modes in seconds. It may be used as a label-free molecular pathology method for diagnosis of skin cancer and other diseases and be used for combined treatment with Mohs surgery for BCC.
Keywords: Visible resonance Raman spectroscopy, human skin, basal cell carcinoma, principal component analysis, supports vector machine, molecular fingerprints, tryptophan, carotenoids
INTRODUCTION
Several studies have reported that skin cancer is in an increasing trend worldwide. Each year, new cases of skin cancer have been reported to have a greater incidence than breast, prostate, lung and colon cancers combined. Basal cell carcinoma (BCC) is the most common skin cancer, accounting for about 80% of the non-melanoma skin cancers (NMSC) which includes BCC and squamous cell carcinoma (SCC). Before the age of 65, 40%-50% Americans will have BCC or SCC skin disease occurring. There are about 4 million cases of BCC diagnosed in the USA annually[1-4]. Although BCC lesions rarely metastasize and have a high curable rate, they frequently expand quickly and may not only become a cosmetic problem but infiltrate surrounding tissue causing functional problems. Therefore, early detection and rapid and accurate diagnosis become very important for treatment.
Currently, clinical routine diagnosis of skin cancer is performed using biopsy and histopathology. The gold standard method requires freezing or reagent preparation of the biopsy tissue prior to microscopic analysis. This requires skilled technicians and expert histopathologists to perform the diagnosis, as well as considerable time before the results are available. This leads to a diagnostic accuracy of about 80% depending on expertise and training[5-9]. A new diagnostic technique that is more rapid with higher accuracy would be a great clinical advantage. A search is ongoing for a fast and accurate way for diagnosis while treating cancers.An optical biopsy (OB) technique would offer many advantages including in situ evaluating lesions. There is a panoply of OB techniques, such as label-free native fluorescence, Raman spectroscopy (RS), optical coherent tomography, and other optical imaging techniques forex vivoandin vivocancer detection in human tissues and cells. These techniques have advanced significantly since the earliest reports in 1984,1987, 1991 and 1992 by Alfano’s group[10-13]. In particular, OB techniques forex vivodetection of a panoply of different cancer types such as NMSC have progressed in recently years. Some fluorescence spectroscopic techniques for diagnosis of BCC have been reported, such as fluorescence confocal microscopy that has been used to detect BCC skin cancer margin in Mohs excisions without the need of frozen and fixed section processing[14-20]. RS technique has some unique features such as using intrinsic biomarkers and operatingin situand in a time period of many minutes or seconds. This has led to a rapid progress in seeking commercial instrumentation for researchers and clinical applications in BCC and other skin cancer diagnoses[21-36]. Most of the reports demonstrated spectral differences between normal skin tissue and BCC lesions using nearinfrared (NIR) laser excitation only. Some reported the use of high power and very long signal collection time (e.g., 300 mW of power and minutes of time) on cells and tissues[24,25]. The NIR Raman method which uses excitation light sources at 671 nm, 785 nm, 830 nm or 1,060 nm has limitations for practical applications described as follows: (1) NIR Raman method only detects non-resonant biomolecule components; (2) NIR laser source requires long excitation time. Even a confocal micro Raman system has poor signal-to-noise(S/N) ratio since the spectral peaks are weak and not enhanced. Increasing excitation light intensity and longer exposure time will limit the practical application[24,26,30]; and (3) The NIR light penetrates relatively deep and excites a large volume in the skin compared to visible light. Thus, it is subjected to variations in the molecular content of the target tissue yielding a low selectivity distinguishing the abnormal from the normal target sites.
We have recently developed a novel visible resonance Raman (VRR) technique using 532 nm as the excitation source which can address the aforementioned limitations of NIR RS technique and extend the Raman technique so that it detects both non-resonant and resonant biomedical components. The vibrational resonance effect occurs in resonance Raman (RR) spectroscopy when the energy of the excitation approaches an optical transition energy level, which greatly enhances the scattering. The RR signal intensity may be enhanced 102to 103times, typically 10 to 100 folds, compared with non-resonance signal, since Raman scattering cross section is inversely proportional to the fourth power of the wavelength. In particular, RR using 488 nm and 532 nm excitation wavelengths gives almost seven and five times more intense Raman signal than using 785 nm excitation wavelength, respectively.
One will have many advantages of resonance Raman over conventional non-resonance Raman if 532 nm is used for excitation in biomedical diagnosis. Since cells and tissues contain many large biomolecular chromophores and other large conjugated molecules with multiple vibrational bonds, they experience stretching and bending vibrations that can be enhanced by the excitation laser and the RR spectra collected from them exhibit enhanced peaks. Specific biomolecules in the cell and organelles contain fluorophores,such as flavins, NADH, NAD, collagens, elastin, carotenoids, tryptophan, hemeproteins, mitochondria and cytochromes. The resonance enhanced signals from these biomolecules suggest that the 532 nm excitation wavelength matched (or closely matched) the molecular absorption bands for these biochemical compounds in the cells and tissues. For example, the metalloprotein such as hemoglobin, has one absorption band at 534 nm. Similarly, the mitochondrial electron transport protein, cytochrome c, has one absorption band at 552 nm (under the hypoxia conditions). The 532 nm is in the tail of the absorption band of flavins and lactate. Carotenoids and flavins have pre-resonance absorption bands about 480 nm and 500 nm which fall in the pre-resonance range of the excitation wavelength of 532 nm. The molecular vibrations of flavins were enhanced by more than 100 times. Therefore, the VRR spectral peaks are greatly enhanced, and much sharper than those from NIR non-resonance Raman. The first RR using 488 nm and 514 nm was noticed in cancer tissue by Alfanoet al.[11]in 1987. The VRR method has been used to produce enhanced S/N results in the biomedical fields. More recently, the VRR technique has been used on human brain, breast, vulnerable atherosclerotic plaque, gynecological tissues, gastrointestinal tissues, and atherosclerotic abdominal aortic tissues studies[37-43]. The VRR spectraex vivoexhibited native molecular signatures that could be used as optical molecular histopathological criteria to distinguish abnormal from normal tissues. The 532 nm wavelength is like a “magic” wavelength for tissue to generate extraordinarily high Raman signals for quasi real-time measurements. It is just inside the key fluorophores’ absorption and emission regions in tissue.
This study focuses on VRR spectral analysis of normal and BCC human skin tissues performedex vivousing a confocal micro-Raman system. It investigates the depth dependence of BCC which reveals a process of status change, and demonstrates the discrimination and classification between normal and BCC skin tissues using molecular vibrational fingerprints and a statistical model. The statistical model is based on principal component analysis (PCA)[44]and supports vector machine (SVM)[43,45-48]. To the best of our knowledge,this study is the first to detail and discuss the depth dependence of BCC in correlation with statuses, and to distinguish BCC from normal skin tissue using the VRR technique. This is a pilot study on BCC skin cancer using VRR performed as a basis for longer studies using 532 nm and other visible laser wavelengths.
METHODS
RR spectra of sliced samples of human skin normal and BCC tissues were measured using a confocal micro-Raman spectrometer, with a 532 nm laser for excitation at low power (3.5 mW) for under 30 s. Fifty-five RR spectra were obtained and analyzed from thirty-six slices of skin tissue samples.
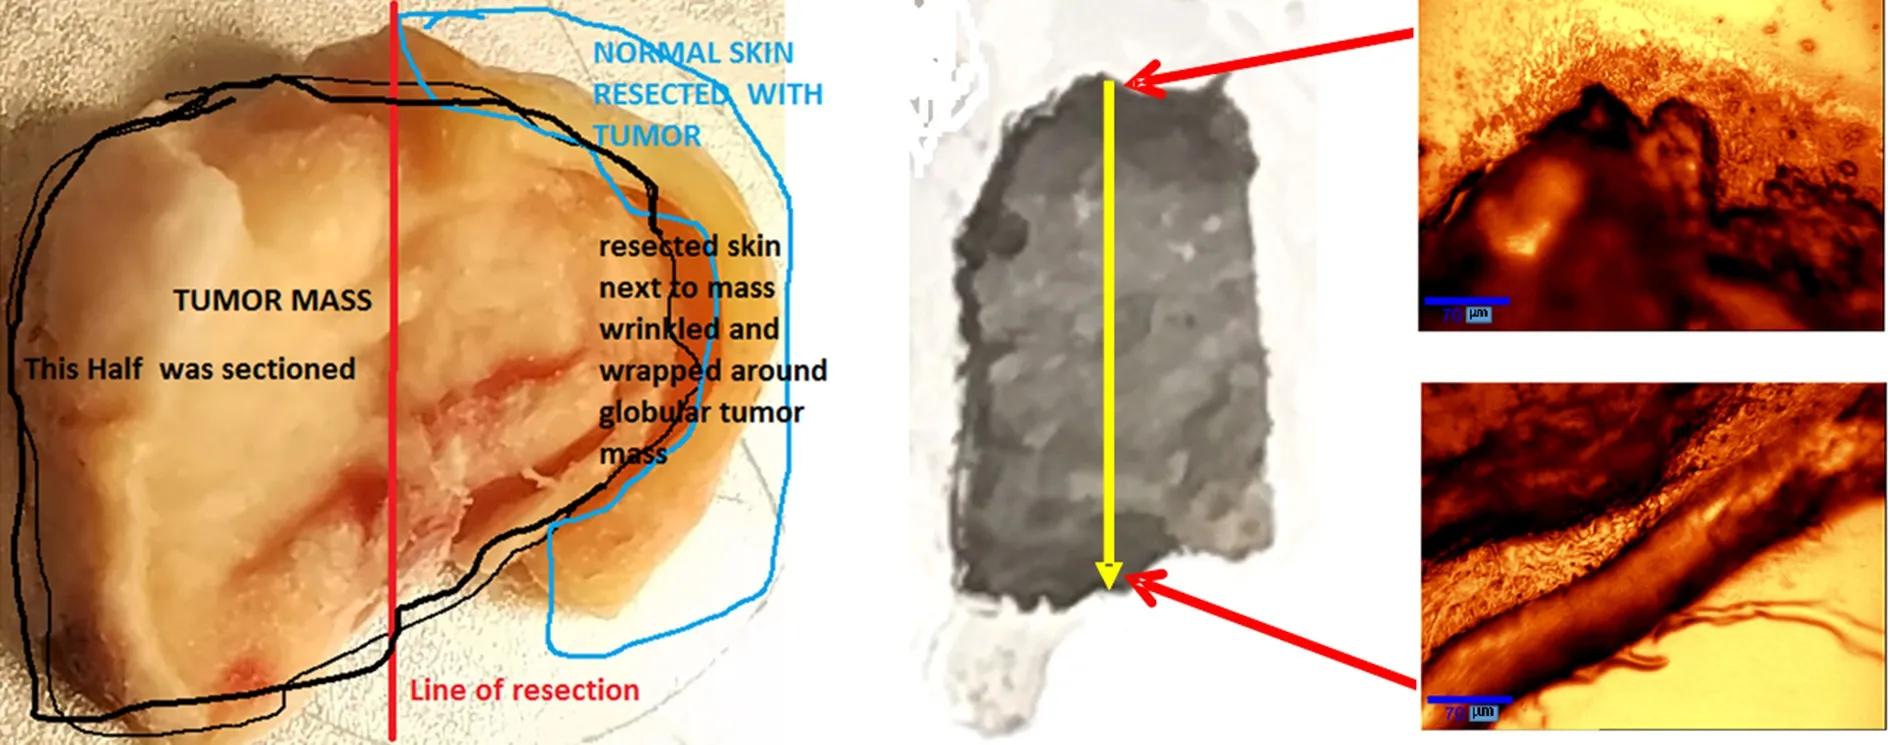
Figure 1. A photograph (side view) of the original human BCC skin specimen used in the experiments (left). The specimen was sliced in vertical direction indicated by the red line. Twenty-eight slices were made with 50 μm thickness for each slice. In the middle is the photograph of a piece of vertical slice of BCC with the size of 5.6 mm × 8.3 mm × 50 μm, where the yellow arrow indicates the direction of measurement steps in depth. The right images were taken from the top and bottom edges of the BCC slice. The red arrows show the sites at the top and bottom of the slice where the two images are taken. BCC: basal cell carcinoma
Tissue sample preparation
The human skin normal and BCC specimens were obtained from the National Disease Research Interchange(NDRI, Philadelphia, PA) under the City College of CUNY Institutional Review Board (IRB). The BCC tissue was from the left ear of a 77-year-old white male. The normal skin sample was from the adjacent area of this BCC tissue. The RR spectra of sliced BCC and normal skin samples were measured, including 28 vertical section slices from one BCC sample and 8 horizontal section slices from one normal sample. Each slice is approximately 8.4 mm long and 5.6 mm wide with a thickness of 50 μm. One vertical section slice of BCC sample was selected for measurement at 6 steps of depths with 100 μm step size, and 9 steps of depths with 500 μm step size, starting from the top surface of the skin toward the bottom as shown in Figure 1.
The irregular-shaped skin specimens were snap-frozen with no chemical treatment. They were kept in a-80 °C freezer and shipped with dry ice for all tests. Tissue sections were cut with a thickness of 50 μm and mounted on uncoated glass microscope slides using Leica CM1080 Cryostats at -20oC. The specimens were thawed to ambient room temperature for the spectroscopic studies.
Measurement of RR spectra of BCC and normal skin sliced tissues
All of the RR spectra were collected directly from a region of interest on each sliced specimen. The raw RR spectrographs (without subtracting the baseline) were produced using the software of NGSlabSpec and ORIGIN 2015. A total of 55 spectra were collected from normal and BCC tissues at the following sites: 12 spectra from eight sections of normal specimen; 15 spectra from one vertical section of BCC sample that was selected for measurements at 6 depths with 100 μm separation, and 9 depths with 500 μm separation; and 28 spectra from the centers of 28 vertically sliced sections of BCC sample. Typical spectra are shown in Figure 2.
The instrument used in this study was WITec alpha300 Raman microscope system (WITec: Wissenschaftliche Instrumente und Technologie GmbH, Ulm, Germany), equipped with a Nikon 20X objective (Nikon Instruments, Melville, NY, USA). The excitation light source was a 532 nm solid-state diode laser (Verdi-2,Coherent Company, Santa Clara, CA, USA) with a maximum output power of 50 mW. Each piece of slices was placed on the stage of the system to collect data. The excitation beam was focused on the sample with a spot diameter of 1 μm and the power of the beam at the sample position was kept at 3.5 mW. RR spectra were collected using a one-second integration time and 30 accumulations, with a system resolution down to the optical diffraction limit of ~200 nm. The spectra were collected over the spectral range of 400-4000 cm-1.The spectral resolution was 2 cm-1in the range of interest[41,42]. All the spectra were collected at ambient room temperature. Student’st-test was used to determine if particular RR peak intensities between normal and BCC samples were significantly different.
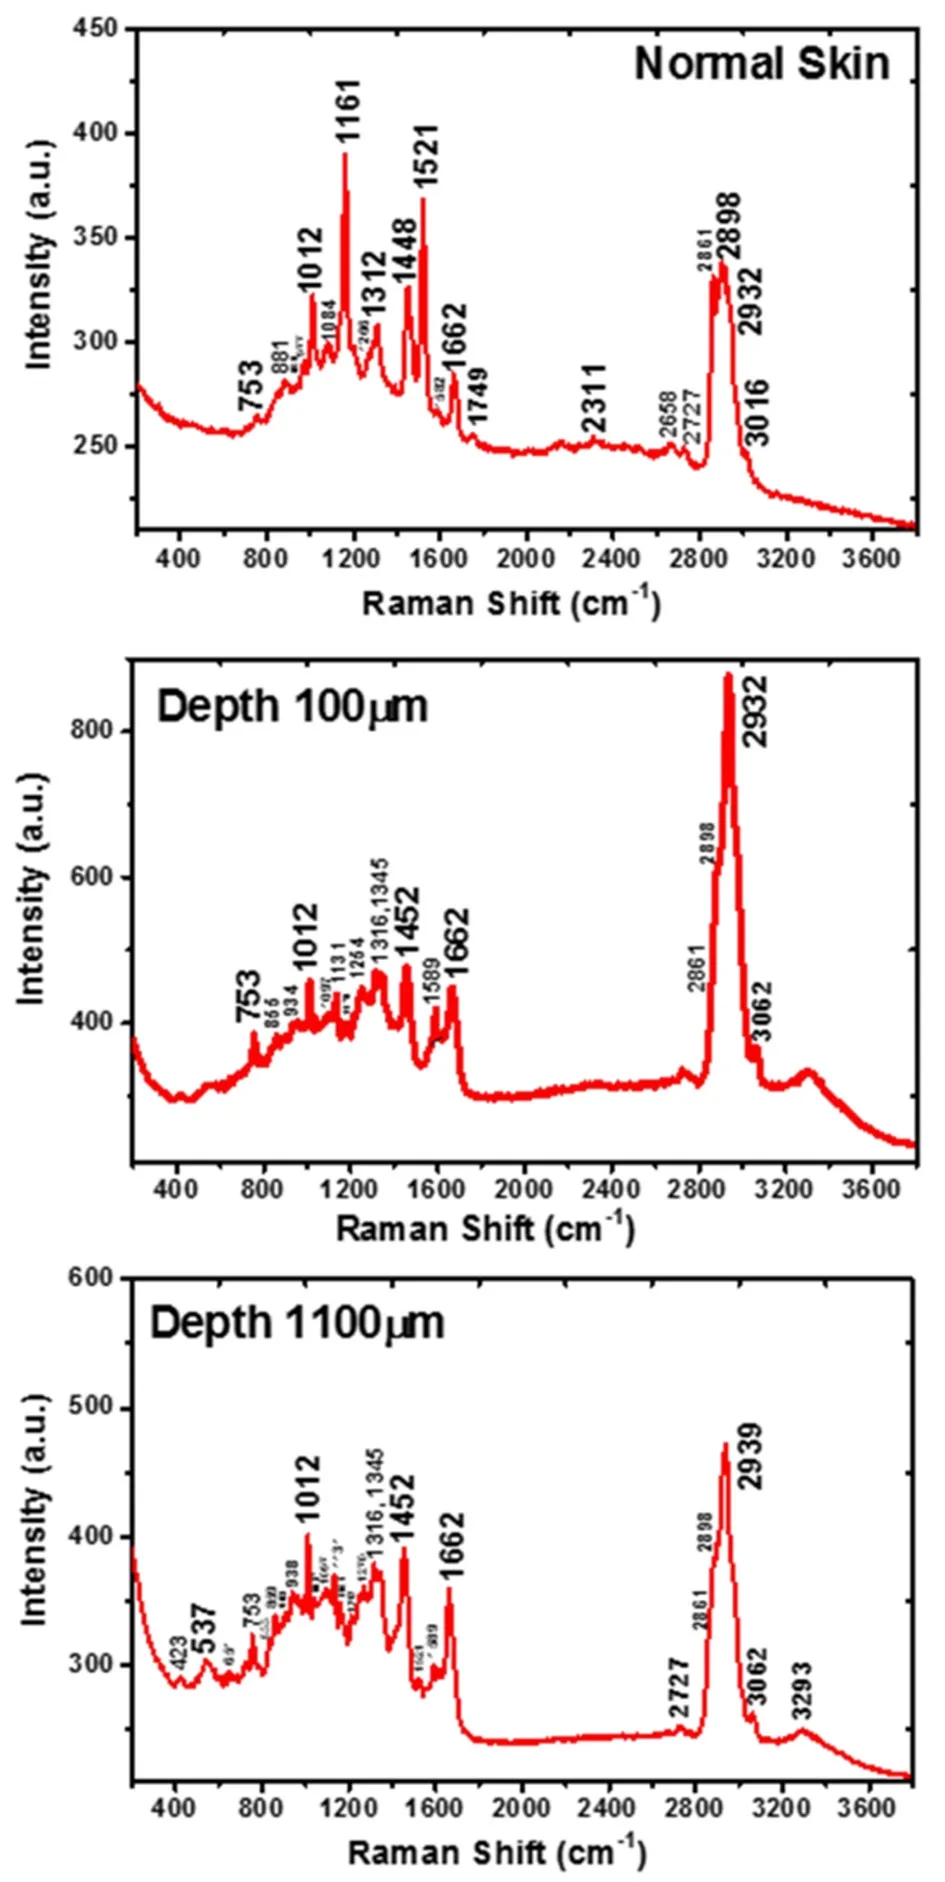
Figure 2. A set of typical resonance Raman raw spectra collected from a horizontal section of normal human skin sample, and a vertically sliced BCC skin sample measured at different depths. (Top), the spectrum was from dermis layer of normal skin showing nine feature peaks; (middle), the spectrum was from the vertically sliced BCC sample at a depth of 100 μm. There are eight characteristic peaks including increased peaks at 753 cm-1 and 1,589 cm-1, but intense carotenoids peaks at 1,161 cm-1 and 1,521 cm-1 disappeared compared to the normal tissue (top); (bottom), the spectrum was from BCC sample at a depth of 1,100 μm, substantially similar to the depth of 100 μm,with six Raman peaks, but carotenoids peaks at 1,161 cm-1 and 1,521 cm-1 are present and obviously weaker than normal tissue sample (top).Those peaks of 753 cm-1 and 1,589 cm-1 greatly decreased in comparison with the depth of 100 μm. BCC: basal cell carcinoma
RR spectral data analysis method by PCA-SVM
The baseline of each raw Raman spectrum was fitted to a polynomial using an asymmetric Huber function as the loss function[49]. The difference between the raw spectra and the baselines were calculated.Each baseline-subtracted Raman spectrum was then normalized using its Euclidean norm, and used for subsequent analysis.
Raman peaks in the normalized baseline-subtracted Raman spectra were first investigated. Student’st-test was used to determine if particular RR peak intensities between normal and BCC samples were significantly different. Then unsupervised machine learning algorithms such as PCA were used to analyze the entire spectral data, reduce dimension and detect underlying spectral feathers.
PCA finds the uncorrelated components that explain the most variance in the signal. It has been widely used for various applications, such as spectroscopy[50], face recognition[51]and optical imaging[52]. Mathematically,PCA solves an eigenvalue equation, and finds a set of orthonormal eigenvectors which are considered principal components (PCs) corresponding to the eigenvalues which are the variances of the PCs in the data.For Raman spectral data contained in a matrixXM×N= {x1, …,xN}, whereMis the number of wavenumbers,andNis the number of spectra or samples (assumingM>N). PCA considers the spectral dataxito be linear combinations of PC loadings {wj} with scores {hji}, i.e.,XM×N≈WM×NHN×N, whereWM×N= {w1, …wN}andHN×N= {h1, …,hN}. To calculate the PCs, the data matrix is “mean centered” first, i.e., the mean of each row is calculated and subtracted off that row. Then an eigenvalue equation of the covariance matrix of the“mean centered” data matrixX’is solved to find the eigenvectors and the corresponding eigenvalues. The eigenvectors are the PC loadings, and eigenvalues are the variances explained by the corresponding PCs.In practice, this can be solved using singular value decomposition[53]of the data matrixX’, i.e.,X’=U∑VT,whereUandVare left and right singular vectors, and σi= diag{∑} are the singular values. Columns ofUM×Nare taken to be the PC loadings, i.e.,W=U, eigenvalues λi= σi2,H= pinv(W)X, where pinv denotes pseudo inverse, and pinv(W) = (WTW)-1WT.
The PC scores contained inHare essentially the projection of the spectral data in matrixXonto the PCs or“eigenspectra”. The PC scoreshiare a set of mixing coefficients of the PCs. These scores can be considered as the characteristic information of the spectra (samples) and used for classification. Alternatively, PC scores obtained from the mean-centered data matrix can also be used, and they are simply different from those obtained from the raw data with a shift in the origin.
Then the PC scores of different spectra (samples) were used for classification after standardization. The scores were standardized for each spectrum using the following formula: (score - “score mean”)/“score standard deviation”. An SVM with a linear kernel was used for classification. SVM attempts to find a hyperplane (a boundary line in two dimension) to separate two classes with the largest distance from the nearest class members (data points) which are called support vectors. Once the SVM classifier is trained, it is tested for classification using all the data points, which is called re-substitution validation. Various combinations of features were tested for classification. Since the contributions due to higher-order PCs significantly decrease according to the eigenvalues, limited number of PCs need to be evaluated and compared. More thorough search of optimal feature selection may be carried out[47,48]. The classification performance of the SVM classifier was evaluated using statistical measures including sensitivity, specificity, and accuracy, along with the receiver operating characteristic (ROC) curve[54,55]. To plot the ROC curve for the SVM classifier, the positive class (cancer) posterior probability (a data point classified into positive class) for each data point was calculated by using a sigmoid function to map the SVM scores which are the distances from the data points to the SVM separation line[56]. Then the posterior probabilities were used to calculate the true positive rate(i.e., sensitivity) and false positive rate (i.e., 1 - specificity) by varying the threshold and generate the ROC curve for true positive ratevs. false positive rate. The area under ROC curve (AUROC)[55,57]was calculated to show the performance of the classifier. AUROC represents the probability that a classifier will rank a randomly chosen positive sample before a randomly chosen negative one. It is used as a global measure of classifier performance that is invariant to the classifier discrimination threshold and the class distribution.Perfect classification accuracy corresponds to an AUROC value of 1, while a random guess separation leads to an AUROC value of 0.5. To reduce bias in the classification with re-substitution, leave-one-out cross validation (LOOCV)[58]was used to re-evaluate the classification performance. To perform LOOCV, each time one individual spectrum was removed from the dataset. The rest of the dataset was used to train an SVM classifier. The removed spectrum was then classified by the trained classifier for testing. This process was repeated for all spectra. In the end, sensitivity, specificity and accuracy were calculated based on the results of all testing as overall evaluation of the classification performance. All the computations for PCASVM were carried out in MATLAB.
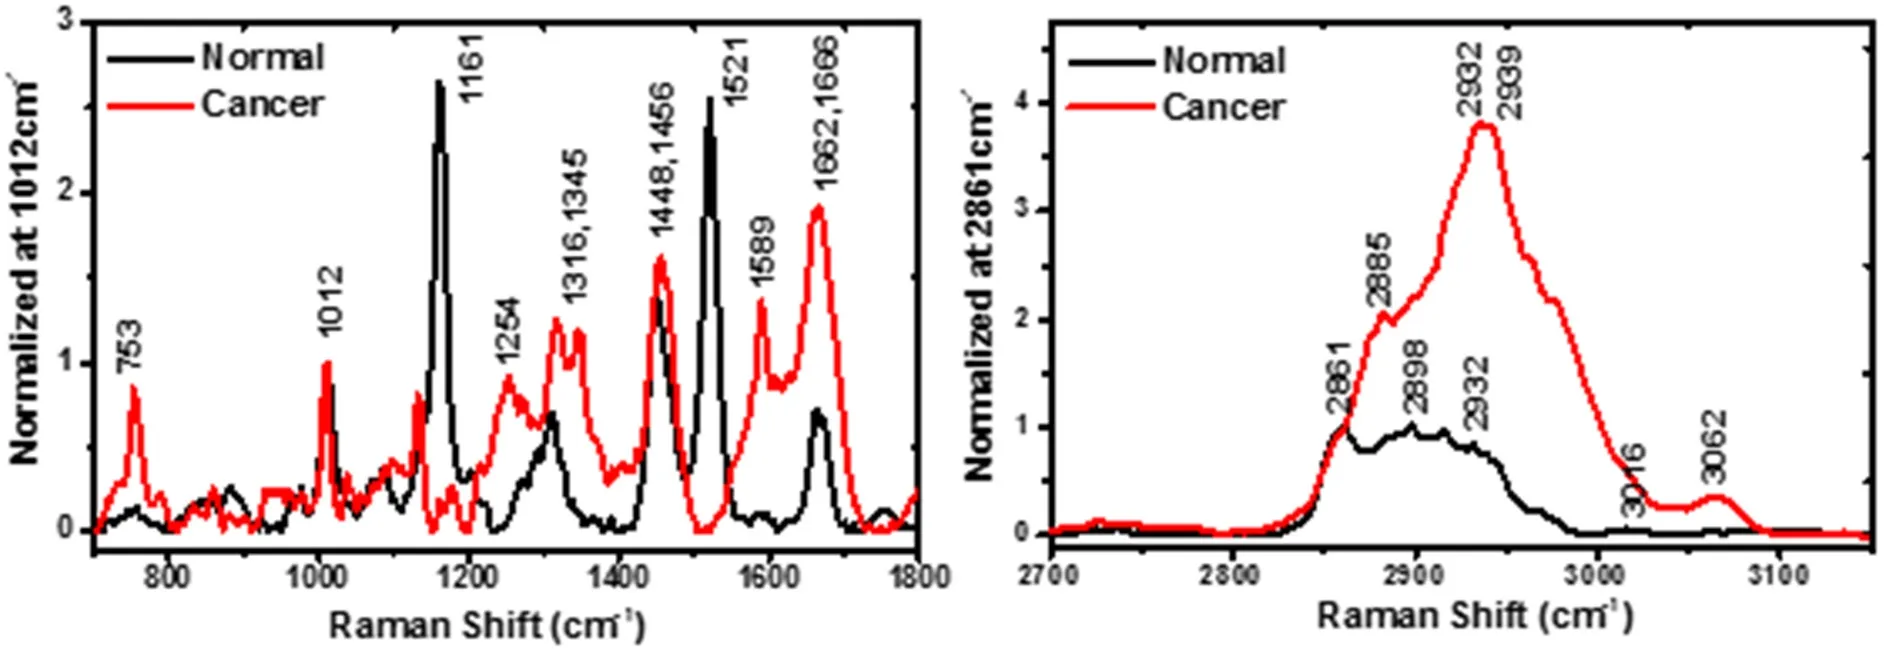
Figure 3. A set of typical resonance Raman spectra collected from a horizontally sectioned normal human skin sample, and a vertically sliced basal cell carcinoma skin sample measured at a depth of 100 μm. Both plots are displayed in the enlarged scale regions of low wave-number 700-1,800 cm-1 and high wave-number 2,700-3,150 cm-1
RESULTS
RR raw spectra from horizontally sliced normal and BCC cancerous human skin samples in vertically section were measured. The distinctive Raman peaks that can be uniquely assigned to distinguish skin cancer lesions were obtained by the raw spectral profiles. The correlation between depth and the status of BCC cancer was found using the RR molecular fingerprints [Figures 2 and 3], by investigating the relative changes of biomarkers [Figure 4] and by calculating the ratios of peak intensities [Figure 5]. The classification of BCC cancer from normal skin tissues using PCA-SVM statistical method is shown in Figure 6.
Depth-dependent BCC assay: (1) VRR spectral fingerprints
RR spectral fingerprints of carotenoids: Figures 2 and 3 and Table 1 show the typical spectra from normal and cancerous BCC sliced skin samples. It revealed the process of evolution from normal to cancer and depth-dependence of cancer from different status with RR spectral fingerprints. The RR spectrum [Figure 2 (top)]was obtained from the center of the third piece of horizontally sliced normal sample with thickness 50 μm.The depth is around 150 μm in the normal skin tissue (corresponding to the lower epidermis layer and the dermis layer). The epithelium is usually ~0.1 mm thick, and ranges from 0.07 to 0.12 mm. Thedermisis alayerof skin which is beneath the epidermis layer and is the thickest of the three layers (epidermis, dermis and hypodermis) of skin[59-62]. Thedermisis also called corium, whose thickness is 0.3-4.0 mm and it is composed of dense irregular connective tissue. So, we consider this normal sliced sample to be located at the dermis layer. In the RR spectrum of normal dermis skin, the resonance-enhanced intrinsic molecular fingerprints of β-carotenes (here we consider β-carotenes, because the β-carotenes and lycopene account for about 60%-70% of the total of the five most concentrated carotenoids content in human organisms),at 1,161 cm-1and 1,521 cm-1are thought to play a significant role in the normal dermis skin anti-oxidant defense system, as shown in Figure 2 (top) and Figure 3 (left). These two resonance bands are active because carotenoids have a pre-resonance absorption band which falls in the pre-resonance range of the excitation wavelength of 532 nm[37,63-67]. The RR peaks of 1,161 cm-1and 1,521cm-1disappeared in the BCC sliced sample at a depth of 100 μm as shown in Figure 2 (middle) and Figure 3 (left). This shows a clear progression of the BCC tissue mutation process in comparison with normal skin tissue, which suggests it may be a lesion with very serious status. The spectrum shown in Figure 2 (bottom) is from vertically sliced BCC sample at a depth of 1,100 μm, substantially similar to the BCC sliced at a depth of 100 μm, with RR peaks present at 1,012 cm-1, 1,452 cm-1, 1,662 cm-1, 2,861 cm-1, 2,898cm-1and 2,932 cm-1. But carotenoids peaks occurring at 1,161 cm-1and 1,521 cm-1are obviously weaker than normal tissue sample [Figure 2 (top)], which suggest this status may be a mildly lesion. Thus, we propose that the evolution of the RR spectra of biomarker carotenoids with the depth dependence revealed the correlation between depth and the process of status change. Carotenoids are the organic and natural fat-soluble pigments and exist in plants. Human beings can obtain carotenoids from diet, such as fruits and vegetables, and its concentration depends on their daily diet and stress factor[67,68]. Carotenoids accumulate in the epidermis through (1) diffusion from the fat tissue,blood and lymph flows, or (2) secretion via sweat glands, and sebaceous glands onto the surface of the skin and subsequent penetration. The specific importance of carotenoids is to serve as a marker substance for the entire anti-oxidative network of human skin[69,70]. Because antioxidants form protective chains in skin tissue,they act synergistically to protect each other against the destructive action of the free radicals, and mainly reactive oxygen species[69-73].
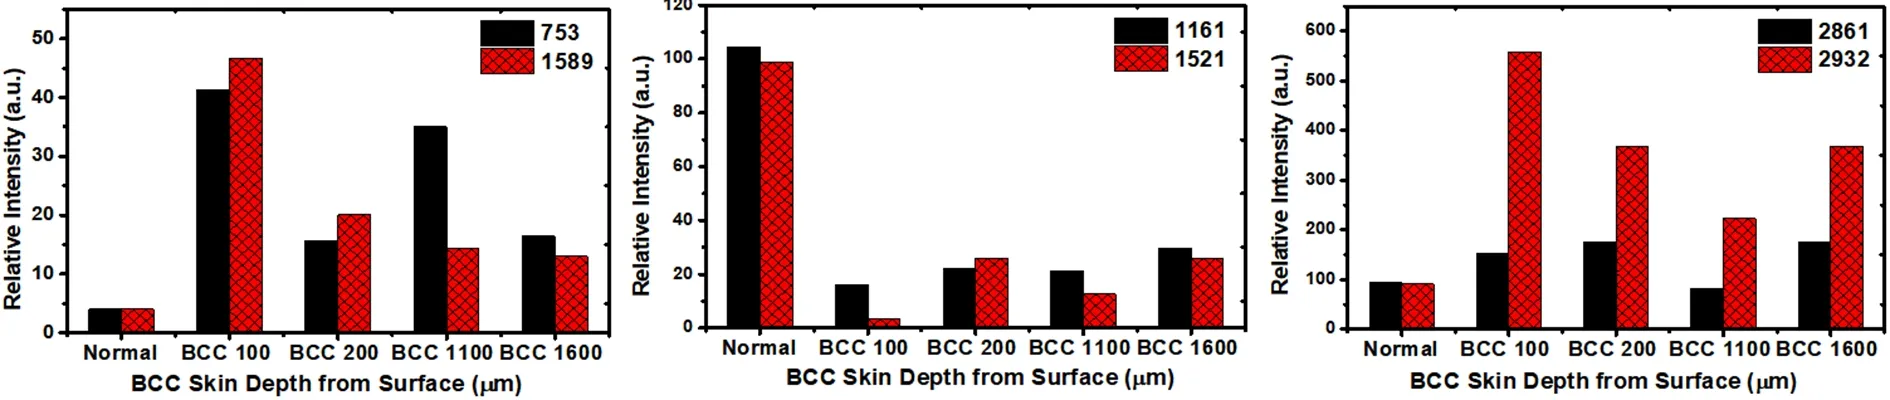
Figure 4. The relative concentration changes in biomarkers of tryptophan (left), carotenoids (middle) and lipids/lipoproteins (right) in the normal skin tissue and BCC skin tissues with depth-dependence. Dramatic changes on relative concentrations are shown for the lesion slices at the depth of 100 μm compared with other depths of 200 μm, 1,100 μm and 1,600 μm. Based on student’s t-test, the difference between normal and BCC samples is statistically significant (P < 0.05) for biomarkers: 752, 1,161 and 1,521 cm-1. The units of the numbers in the figure legends are cm-1. BCC: basal cell carcinoma

Figure 5. The changes in the resonance Raman fingerprints represented by the ratios of peak intensities of biomarkers. The 1,589 cm-1 mode is supposed to be arising from tryptophan; 1,452 cm-1 mode is assigned to fatty acids-lipid protein molecules; 1,662 cm-1 mode is amide I combined with type I collagen; the largest ratio (I1589 to I1452) changes occurred at a depth of 100 μm in the BCC tissue (left).Based on student’s t-test, the difference between normal and BCC samples is shown to be statistically significant (P < 0.05) for all biomarkers. BCC: basal cell carcinoma
RR spectral fingerprints of tryptophan: in contrast, the RR peaks of 1,161 cm-1and 1,521 cm-1diminished sharply for BCC tissues at a depth of 100 μm while the fingerprints of tryptophan peak at 753 cm-1and 1,589 cm-1greatly increased in BCC tissue at a depth of 100 μm in a more serious status [Figure 2 (middle), Figure 3 (left)and Table 1], but decreased in the BCC sliced sample at a depth of 1,100 μm in a mild status [Figure 2 (bottom)].The RR spectra of key fingerprints of tryptophan with a main vibrational mode at 1,588 cm-1(W8b) were observed[66,74]. It was found that endogenous tryptophan and metabolites contributions were accumulated in the mode of 1,588 cm-1in cancers and enhanced by resonance. Researchers have reported that heterocyclic amino acid tryptophan is a key factor during the metabolic process[74,75]. This RR vibrational mode of 1,588 cm-1indicates that tryptophan may be produced in human skin cancer in the kynurenine pathway of tryptophan metabolism involved in tumor progression according to our previous studies on human brain cancer[75-77]and that the micro-environment of malignant tumor tissues may result from tryptophan radicals[78-80].
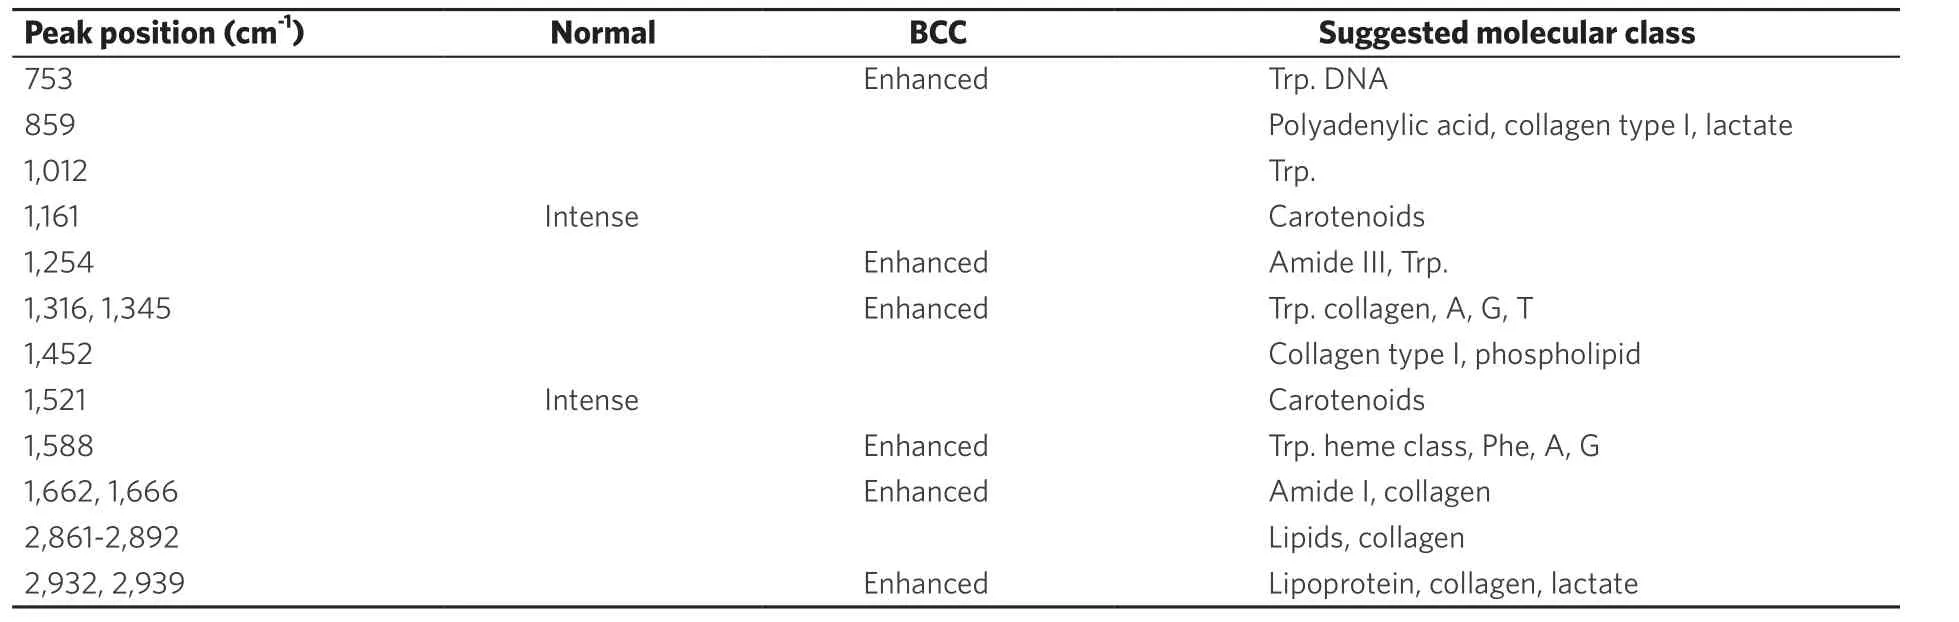
Table 1. Changes in intensities of peaks in the resonance Raman spectra of human normal skin tissues compared with basal cell carcinoma skin tissues in Figure 3
RR spectral fingerprints of lipids and lipoprotein: the characteristic band of spectral peaks observed between 2,861 cm-1/2,898 cm-1and 2,932 cm-1are attributed to the vibrations of methylene (-CH2) from lipids and methyl (-CH3-) groups from lipoproteins [Figure 3 (right), Figure 4 (right) and Table 1]. The peak near 2,932 cm-1, due to the asymmetric C-H stretching of methyl groups, showed a significant increase in BCC cancer tissue at a depth of 100 μm site, while the 2,861 cm-1/2,898 cm-1band relatively decreased in intensity in BCC cancer tissue at a depth of 100 μm in comparison to RR spectrum of the normal skin tissue.
Depth-dependent BCC assay: (2) relative content changes of molecular fingerprints
Figure 4 showed the relative content changes of biomarkers of carotenoids (left), tryptophan (middle) and lipids/lipoproteins (right) in normal skin tissuevs. BCC cancer skin tissues with depth-dependence. The dramatic changes in relative concentrations are shown in the slice at depth 100 μm which is a BCC lesion in comparison to other status BCC lesions at depths of 200 μm, 1,100 μm and 1,600 μm. These results are consistent with the analysis of RR spectral fingerprints in the previous section. The suggested reason for the spectral changes of carotenoids is that the concentration of carotenoids decreased in BCC cancer at the depth of 100 μm, which caused the RR peaks to become too weak to detect and induced a shift in chemical vibration bonds. This change in carotenoids may be due to the structural changes within the micro-environment of malignant lesion. All these observations point out the existence of fast activation and deactivation of Raman vibrational modes.
Depth-dependent BCC assay: (3) ratio of intensity of molecular fingerprints vibration modes
Figure 5 showed the RR fingerprints changes using the ratio of the intensities of RR peaks. The 1,589 cm-1mode is attributed to tryptophan; while the 1,452 cm-1mode is assigned to the fatty acid/lipid protein molecules and the 1,662 cm-1mode is from the amide I combined with the collagen type I molecules. The largest ratio changes of (I1589to I1452), (I1662to I1452) and (I2861to I2932) occurred at a depth of 100 μm from the BCC tissue samples. These ratios of the intensities of the spectral peaks from the BCC cancer tissue at depth 100 μm are found to be much higher [Figure 5 (left and middle)] or lower [Figure 5 (right)] in comparison with those from normal skin tissue, therefore they may be used as a distinct marker to distinguish cancerous tissues from normal skin tissues. Such ratios provide an insight into the conformational changes occurring in biomolecules in these tissues. For instance, the Raman spectra of proteins (represented by the 1,662 cm-1band) correspond to beta-sheets which provide insight into protein folding or the denaturation processes.
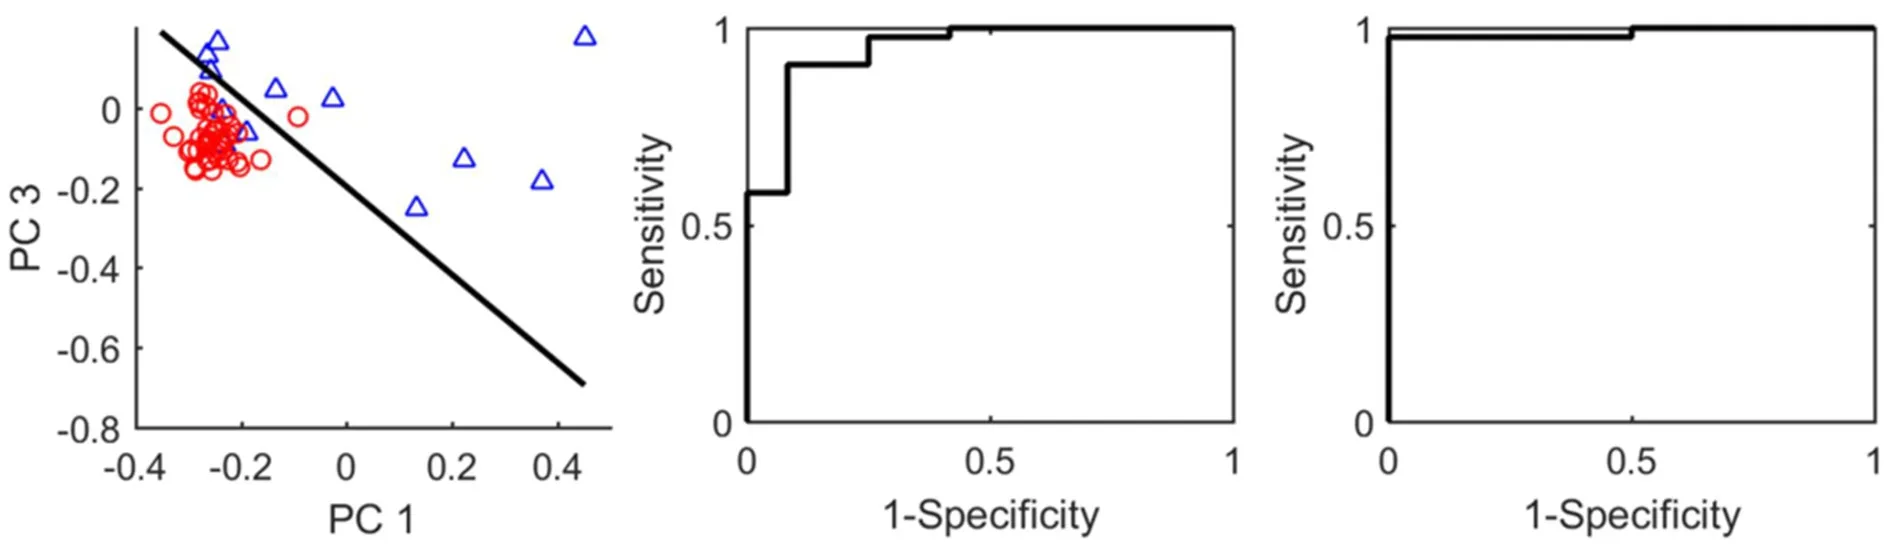
Figure 6. (left) is a scatter plot of scores PC1 and PC3 with the separation line (SVM classifier); (middle) ROC curve for the SVM classifier in the left panel; (right) ROC curve for the SVM classifier trained with PC1, PC3 and PC7. PC: principal component; ROC: receiver operating characteristic; SVM: supports vector machine
Classification based on RR spectral data of BCC and normal skin tissues by SVM
The spectral dataset including 12 spectra from sliced normal skin tissues, and 43 spectra from sliced BCC cancerous samples were analyzed using PCA. Fifty-five PCs were obtained with corresponding eigenvalues sorted in a descent order (the plots are not shown here). The first 10 PCs account for 97% of the total variance.If two PCs are selected for classification, first PC (PC1) and third PC (PC3) showed the best performance.The scatter plot of the PC scores along with a boundary line trained using SVM method is shown in Figure 6(left). The sensitivity, specificity and accuracy of the classifier with re-substitution validation were calculated to be 97.7%, 75.0%, and 92.7%, respectively. The ROC curve was generated and shown in Figure 6 (middle).The AUROC was found to be 0.95. When PC1, PC3 and PC7 are used together for classification, it achieved optimal performance. Sensitivity, specificity and accuracy of the SVM classifier trained with all spectra were found to be 93.0%, 100%, and 94.5% with re-substitution validation. The ROC curve was generated and shown in Figure 6 (right). The AUROC was found to be 0.99. LOOCV achieved sensitivity 97.7%, specificity 66.7%, and accuracy 90.9%. The classification is shown to be effective for the diagnosis of human skin tissues using RR spectroscopy.
DISCUSSION
In conclusion, given our preliminary investigation, we have demonstrated how the molecular components and conformation change under different conditions of BCC skin cancer tissues, and shown that there is a correlation between the depth dependence of RR spectra and the status change of BCC tissue at a molecular level. At a depth of 100 μm, the VRR spectra from BCC tissue change significantly compared to the spectra from normal skin tissues due to the changes in the relative concentrations of tryptophan, carotenoids, lipids and proteins [Figures 2-5]. In addition, VRR technique with 532 nm excitation can effectively distinguish BCC from normal skin tissues. The PCA-SVM statistical analyses of the VRR data collected from human skin cancer and normal tissues were used to distinguish BCC lesions from normal skin tissues. It yielded a sensitivity, specificity and accuracy of 93.0%, 100%, and 94.5%, respectively, when compared with the histopathology analysis (as the “gold standard”) reports. This is the first evidence that the difference between human skin normal tissues and cancer lesions can be detected by VRR spectroscopy.
The VRR method has a high S/N ratio, and provides visually intuitive results for inspection. Even the raw RR spectra can be used for a direct comparison between cancerous and normal tissues. In contrast, it is much more difficult to inspect the raw Raman data acquired using NIR such as 785 nm excitation, because of the much lower S/N ratio. In fact, the raw Raman spectra are rarely provided in the literature[81,82]. The VRR system also uses less power and shorter integration time to collect signals[28,29,31,32], thus providing a safer and more suitable method forin vivoand real-timein-situskin cancer diagnosis compared with other NIR or FT-Raman system. We believe we cannot obtain Raman spectra fast and at a local spot in a skin tissue to get cancer margins without using the 532 nm RR.
This pilot study shows that VRR technology may have broad clinical applications for real-time, and label-free detection of skin lesions and other human tumors such as breast and brain[37-42,83,84]. A most recent reference to salient features of VRR in carotene in solution is given by Luet al.[85].
DECLARATIONS
Acknowledgments
The authors are grateful to Dr. K. Sutkus for his assistance to manuscript preparation and submission.
Authors’ contributions
Read and revised the manuscript: All authors
Performed experiments, initiated the manuscript and performed data analysis: Liu CH
Performed the PCA-SVM analysis and wrote part of the manuscript: Wu B
Revised the manuscript: Sordillo LA
Performed experiments: Boydston-White S
Prepared the samples: Sriramoju V
Performed data analysis: Zhang C
Financially supported the study, participated in discussions and revised the manuscript: Beckman H
Participated in discussions and revised the manuscript: Zhang L, Pei Z, Shi LY
Is the principal investigator of the project, and supervised the entire study: Alfano RR
Availability of data and materials
The data that support the findings of this study are available from the corresponding author upon reasonable request.
Financial support and sponsorship
This preliminary work was supported in part by a seed grant from Sinai hospital of Detroit medical stafffoundation.
Conflicts of interest
All authors declared that there are no conflicts of interest.
Ethical approval and consent to participate
In this study, the human skin normal and BCC specimens were obtained from the NDRI (Philadelphia, PA).The experimental procedures were approved by the City College of the City University of New York, IRB office.
Consent for publication
Not applicable.
Copyright
? The Author(s) 2019.
 Journal of Cancer Metastasis and Treatment2019年1期
- Journal of Cancer Metastasis and Treatment的其它文章
- AUTHOR INSTRUCTIONS
- Call for Papers
- Cancer stem cells, stemness markers and selected drug targeting: metastatic colorectal cancer and cyclooxygenase-2/prostaglandin E2 connection to WNT as a model system
- Axillary recurrence after intramammary sentinel lymph nodes metastases with capsular extravasation
- A non-toxic approach for treatment of breast cancer and its metastases: capecitabine enhanced photodynamic therapy in a murine breast tumor model
- Mass spectrometry-based metaboIomic profiIing of prostate cancer - a piIot study