
How Microbes Shape Their Communities A Microbial Community Model Based on Functional Genes
2019-05-14 10:07:30XiaoqingJiangXinLiLongshuYangChunhongLiuQiWangWeilaiChiHuaiqiuZhu
Xiaoqing Jiang ,Xin Li,Longshu Yang ,Chunhong Liu Qi Wang ,Weilai Chi,Huaiqiu Zhu *,g
1 State Key Laboratory for Turbulenceand Complex Systems,Department of Biomedical Engineering,College of Engineering,Peking University,Beijing 100871,China
2 Center for Quantitative Biology,Peking University,Beijing 100871,China
3 Peking University-Tsinghua University-National Institute of Biological Sciences Joint Biological(PTN)PhD Program and College of Life Sciences,Peking University,Beijing 100871,China
4 Center for Protein Science,Peking University,Beijing 100871,China Received 29 January 2018;revised 7 May 2018;accepted 25 September 2018 Available online 23 April 2019
KEYWORDS Metagenomics;Dynamics model;Community structure;Acid mine drainage;Human gut microbiota
Abstract Exploring the mechanisms of maintaining microbial community structure is important to understand biof ilm development or microbiota dysbiosis.In this paper,we propose a functional gene-based composition prediction(FCP)model to predict the population structure composition within a microbial community.The model predicts the community composition well in both a low-complexity community as acid mine drainage(AMD)microbiota,and a complex community as human gut microbiota.Furthermore,wedef ine community structureshaping(CSS)genesas functional genes crucial for shaping the microbial community.We have identif ied CSS genes in AMD and human gut microbiota samples with FCPmodel and f ind that CSSgenes changewith the conditions.Compared to essential genes for microbes,CSSgenes are signif icantly enriched in the genes involved in mobile genetic elements,cell motility,and defense mechanisms,indicating that the functionsof CSSgenesarefocused on communication and strategiesin responseto theenvironment factors.Wefurther f ind that it istheminority,rather than themajority,which contributes to maintaining community structure.Compared to health control samples,we f ind that some functional genes associated with metabolism of amino acids,nucleotides,and lipopolysaccharide are more likely to be CSSgenes in the disease group.CSSgenes may help us to understand critical cellular processes and be useful in seeking addable gene circuitries to maintain artif icial self-sustainable communities.Our study suggests that functional genes are important to the assembly of microbial communities.
Introduction
There has never been a better time to investigate microbial communities[1].Not only is the inf luence of microbial communities on biogeochemical cycles,Earth's climate,and human health beginning to be understood,but also cultivation-independent omics techniques as well as highthroughput sequencing technologies aredriving a rapid revolution of our knowledge on the diversity and complexity of microbial communities in natural environments[2].Microorganisms are probably the most diverse organisms and microbial community structures are very important to understand ecosystem functions[3].However,many issues remain elusive,such as the mechanisms underlying microbiota development and maintenance[4].Maintaining the structure of microbial communities is critical to ecosystem and human health.On the one hand,there are great differences in the microbial community structure between lowly and highly metal contaminated samples [5].On the other hand,gut microbial dysbiosis is associated with various diseases,including irritable bowel syndrome(IBS)[6-8]and depression[9].Accordingly,understanding the development and maintenance of microbiota may be helpful in providing feasible strategies for bioremediation and disease therapy.
Many studies on microbial communities were focused on theinf luence of various environmental factorson themicrobial community assemblage,such as the imposed treatments[10],biochar[11],substrate inputs[12],and p H[13].However,the roles of functional genes in community structure remain unknown.Functional genes are important to confer the metabolic phenotypes of microbes,leading to complex ecological interaction,which isa major determinant of microbial community structure[14].Admittedly,it has long been known about so-called essential genes for microbes,i.e.,the genes of an organism or of a genome that are widely considered to be crucial for its survival under given conditions[15].Current studies on essential genes have made great progress and improved our knowledge of their associated biological functions[16-19].However,in natural environments,more than one type of microorganism lives together within a community,interacting with each other and exhibiting various social behaviors.In practice,theessential geneshavenot yet provided usan insight into the way to shape a microbial community for many a microorganism in natural environments.Thus,functional genes crucial for shaping community structure(we proposed as the community structure shaping genes,i.e.,CSS genes),rather than the essential genes,are more expected to reveal theimpactsof geneson development and maintenanceof community structure in natural environments.
A well-known limitation of current studies on the microbial community structure is that monitoring the dynamics of community structure over time,even with an appropriate experimental design,is still diff icult and cost-consuming[20].Fortunately,mathematical models offer an access to study the microbial communities that are diff icult to be cultivated in the lab.Several methods are available for modeling the dynamics of microbiota.The microbial assemblage prediction(MAP)[21],a predictive model based on artif icial neural networks,has achieved much.However,this model takes biological processes as black boxes,taking less account of the inner workings or parts.Rigorous mathematical models are more conducive to realizing the fundamental elements of microbial populations.The generalized Lotka-Volterra model[22,23]and generalized additive model[24]are commonly used and have made much progress.However,they fail to show good prediction and have certain known limitations[25,26].The generalized Lotka-Volterra equations do not capture mutualisms and some other types of relationships[26],whereas the generalized additive model assumes that the relationships are additive,which may not be realistic for complex ecosystems[26].The replicator dynamics model[27]is the f irst and most successful model to study classic evolutionary game theory and has been used extensively in many f ields,such as population genetics,biochemical evolution,and sociobiology.However,these dynamic models do not take environmental factors into consideration and assume constant population size,which may not hold for microbial populations[28].In summary,these methods have shed light on modeling microbial communities,while their limitations deserve a serious concern in state-of-the-art methods,such as poor performance and doubtful assumptions.
In this paper,we proposed a modif ied replicator dynamics model,functional gene-based composition prediction(FCP)model,to predict the population structure composition within a microbial community.Compared to the classical replicator dynamics models,FCP has made three main improvements by(1)explicitly analyzing the dynamics of microbes with variable population size;(2)linking environmental parameters,microbial community structure,and functional characteristics;and(3)using the dissimilarity of taxonomic units at the functional level based on gene annotation of metagenomic sequences and environmental variations to quantify the f itness.Fitness is the most central parameter in replicator dynamics models and its quantif ication has been a long-time goal for evolutionary game theory[29].The f itness describes the viability of microbes as compared to that of other microorganisms in the community.The interspecif ic competition and environmental variations have promoted the evolution of microbial community,but in opposite directions[30].Environmental f iltering increases functional similarity within communities while competition for limited resources tends to decrease functional similarity [30].Consequently,unlike classical replicator dynamics models that often merely consider microbial interactions,we used both microbial interactions and environmental variations to quantify f itness.In summary,we set out to design and test a model focused on predicting microbial community assemblages.Furthermore,we def ined functional genes that are indispensable for shaping microbial community structure as the CSS genes.With the application of the FCP model,we identif ied CSSgenes and investigated which parts of functional genes were critical for shaping the community structure.CSSgenes may be useful in seeking addable gene circuitries to maintain artif icial self-sustainable communities and treating diseases related to microbiota dysbiosis.Our model provides a viewpoint of the relationships between functional genes and microbial community structure,and our study suggests that functional genes are key to the assembly of microbial communities.
Results
The overview of AMD microbial communities
Since predicting microbial community assemblages is often limited by the inherent complexity of biological systems,we performed the current study by analyzing acid mine drainage(AMD)metagenomic sequences as the model metagenome data.AMD biof ilm is a relatively self-contained and lowcomplexity system[31].The genomesof AMD microorganisms were sequenced with high-throughput sequencing strategies[32].After data preprocessing(see methods),totally 17 AMD samples, characterized by acidity, heat, and high concentrations of heavy metals,had been collected from the air-solution interface by Banf ield and colleagues[32].A broad variety of environmental factors at each sample site had been measured[32]and clustered.As shown in Figure 1A,temperature and p H were clustered in one group,revealing a close correlation between these two factors.Proteins from the chemoautotrophic iron-oxidizing bacteria Leptospirillum group II(59.48±12.54%)were predominantly present in almost all samples(Figure 1B).The 17 samples havebeen clustered into two groups,representing different developmental stages(Figure 1B).The classif ication results are quite similar to those reported previously[32].The group with a high relative abundance of Leptospirillum group II(79.41±5.70%)was in the early developmental stage.The other group was in maturestageand had lower relativeabundanceof Leptospirillum group II(53.35±5.34%,Student's t test,P<10E-9).
To examine the gene distribution in AMD community,we aligned the near-complete genomes of nine species in AMD to all predicted peptides in the Clusters of Orthologous Groups(COG)protein database[33](http://www.ncbi.nlm.nih.gov/COG/).By blasting to totally 4631 COGs in the database,we found that AMD samples had 7380 different genes which were classif ied into 1998 COGs.The gene function annotation indicated the difference between bacterial and archaeal genomes(Figure 2).About 4.31%of COGs were shared in all microbes and enriched in the COG categories of J(translation,ribosomal structure and biogenesis),C(energy production and conversion),and O(post-translational modif ication,protein turnover and chaperones),ref lecting the similarities in translation and post-translational modif ication of bacteria and archaea.Genes in the categories M(cell wall/membrane/envelope biogenesis),N(cell motility),U(intracellular traff icking,secretion and vesicular transport),and T(signal transduction mechanisms)wereremarkably shared in bacteria(Fisher's exact test,P<0.05).Most of these genes were involved in communication and motility,allowing bacteria to respond to environmental changes timely.Metabolism-related genes were rarely shared in bacterial genomes.However,there came to almost the opposite conclusions for archaea,whose genomes mostly shared metabolism but lacked the COG categories T(signal transduction mechanisms),M(cell wall/membrane/envelopebiogenesis),and U(intracellular traff icking,secretion and vesicular transport).In summary,bacterial genomes shared more genes related to responses to extreme acidic environments while archaeal genomes shared more genes involved in metabolism.

Figure 1 Hierarchical cluster analysis of AMD samplesA.Hierarchical cluster analysisof environmental factors of AMD samples.Environmental factorsincluding solution dischargerate(Flow,l/min),p H,temperature(Temp,°C),electrical conductivity(Cond,mS/cm),and theconcentrationsof ferrous(Fe2+,M)/ferric and ferrous(FeT,M)/copper(Cu,mM)/arsenic(As,mM)/zinc(Zn,mM)/calcium(Ca,mM)/sulfate(SO42-,M)/nitrate(NO3-,nM)/nitrite(NO2-,nM)were standardized before hierarchical clustered.The standardized values of environmental factors are color-coded in the heatmap,with larger valuesin red and smaller valuesin blue.B.Hierarchical cluster analysisof microbial community composition of AMD samples.Aplasma,E-plasma,G-plasma,and I-plasma represent Thermoplasmatales archaeon A-plasma,E-plasma,G-plasma and I-plasma,respectively;Lepto.group II,Lepto.group III,Ferro.type I,and Ferro.type II indicate Leptospirillum group II,Leptospirillum group III,Ferroplasma type I,and Ferroplasma type II,respectively.ARMAN2 are from the archaeal Richmond Mine acidophilic nanoorganisms(ARMAN)lineages.The results show that 17 samples could be classif ied into two groups.The group(S3/S4/S12/S13)with higher percentage of Leptospirillum group II is in the early developmental stage and the other group is in the late succession stage.AMD,acid mine drainage.
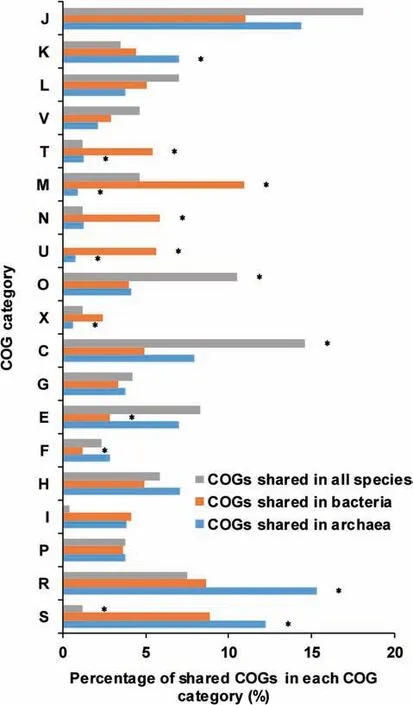
Figure 2 Comparison of COG distributions in AMD samplesComparisons of the distributions of COGs shared in all species,bacteria,and archaea,respectively.The vertical axis shows the different COG categories and the percentage of shared COGs in each category is shown on the horizontal axis.Asterisks indicate that the enrichments are signif icant(Fisher's exact test,P<0.05).COG refers to Clusters of Orthologous Groups.The COG categories are listed as follows.J,translation,ribosomal structure and biogenesis;K,transcription;L,replication,recombination and repair;V,defense mechanisms;T,signal transduction mechanisms;M,cell wall/membrane/envelope biogenesis;N,cell motility;U,intracellular traff icking,secretion,and vesicular transport;O,posttranslational modif ication,protein turnover,chaperones;X,mobilome:prophages,transposons;C,energy production and conversion;G,carbohydrate transport and metabolism;E,amino acid transport and metabolism;F,nucleotide transport and metabolism;H,coenzyme transport and metabolism;I,lipid transport and metabolism;P,inorganic ion transport and metabolism;R,general function prediction only;S,function unknown.
Relationships between microorganisms and environmental factors in AMD samples
We investigated the relationships among the relative abundances of microorganisms in AMD samples with the compositionality corrected by renormalization and permutation(CCREPE)algorithm(http://huttenhower.sph.harvard.edu/ccrepe).Statistically signif icant edges(P<0.05,after Bonferroni correction,correlation coeff icient≥0.65)are shown (Figure 3A).G-plasma,E-plasma,I-plasma,and A-plasma,members of the order Thermoplasmatales,were clustered in one group.The relative abundance of G-plasma was closely related to that of Ferroplasma type II.A positive correlation between the relative abundances of Ferroplasma type IIand Ferroplasma type I was also found.These observationssuggest a potential positive correlation within genomes of allied species.However,the relative abundance of the dominant species,Leptospirillum group II,had a negative correlation with that of I-plasma,thus exhibiting a potential negative correlation with most of the remaining microorganisms.Since that Leptospirillum group III and the archaeal Richmond Mine acidophilic nanoorganism(ARMAN)lineage 2(ARMAN2)were not present in this network,their relative abundances showed poor associations with those of other microorganisms in AMD samples.The common positive correlations among closely-related species and negative relationships in distantly-related species were achieved in part by environmental f iltering,which tended to cluster similar functions and disperse dissimilar functions.The 16S r RNA sequences and whole genome annotation results between Leptospirillum group II and III had a strong correlation,and the same existed between A-plasma and G-plasma and between E-plasma and G-plasma.However,there were no signif icant direct relationships in their relative abundances.In addition,the coeff icient of variation(the ratio of standard deviation to average)of Leptospirillum group III and ARMAN2 were 0.38 and 1.36,respectively,which is much greater than that of Leptospirillum group II(as 0.21).This indicates that the relative abundances of Leptospirillum group III and ARMAN2 are not constant.The two points above suggest that the community composition in AMD samples is not only affected by environments but also inf luenced by other factors,for example,interspecif ic competition.
To measurethe relative inf luenceof different environmental factors on microbial structure in AMD samples,we conducted the multivariate regression tree (MRT) [34] analysis(Figure 3B).Herein temperature appeared to be a strong predictor of community structure,because samples with high temperatureweredistinguished from thosewith moderate temperature.Leptospirillum group II had a relatively low abundance (54.98±8.07%) in extremely hot environments(temperature ≥38.2°C) but was absolutely dominant(74.11±14.34%)under moderate temperature conditions(temperature<38.2°C).This indicates that as AMD biof ilms mature,they become increasingly heated.The energy might come from series of complex chemical reactions in AMD biof ilms.Furthermore,we used the gradient boosting machine(GBM)method[35]to measure the different contributions of environmental factors to the relative abundance of each microorganism.Our resultsdemonstrated that p H and temperature are the two most inf luential variables(Figure 3C).The low relative impact of Zn2+,Fe2+,and FeT concentrations on all microorganisms showed their limited contributions to the dissimilarity of community structure.We classif ied the environmental factors into three groups:physical factor group(p H,temperature,f low,and conductivity),acid ion group(SO42-,NO3-,and NO2-),and metal ion group(Fe2+,FeT,Zn2+,Cu2+,As3+,and Ca2+).The results showed that physical factor group had higher impact on these microorganisms than acid ion group(Figure 3D)(Student's t test,P<0.05),while metal ion group had the lowest impact(Student's t test,P<0.007).Previous studies[36]illustrated that pH was the major factor contributing to community difference in Southeast China AMD samples and Fe2+and Fe3+were also relative important factors.Herein we found that pH and temperature were closely related(Figure 1A)and both were major factors.However,different from previous studies[36],our results showed that Fe2+and FeT had little inf luence on most species.
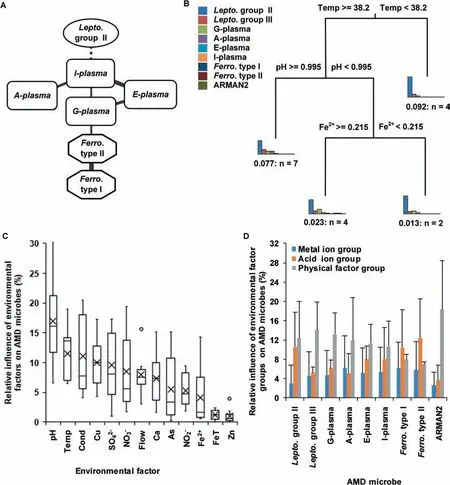
Figure 3 Relationships between relative abundances of microorganisms and environmental factors in AMD samplesA.Social relationship network in AMD biosystem.Only statistically signif icant edges(P<0.05,after Bonferroni correction,correlation coeff icient≥0.65)were retained.Dotted lines ref lect negative relationship between different microbes and solid lines represent positive ones.The thicker lines indicate higher correlation coeff icients,i.e.,stronger relationships between microorganisms.B.Relationships between community structure and environmental factors in AMD samples with MRT model.C.Relative inf luence of environmental factors on microorganisms using GBM method.The circles represent the outlier values and black crosses show the mean inf luence of the corresponding environmental factors on microorganisms.D.Relative inf luence of environmental factor groups on microorganisms.Environmental factors are divided into three groups:physical factor group(p H,temperature,f low,and conductivity),acid ion group(SO42-,NO3-,and NO2-),and metal ion group(Fe2+,FeT,Zn2+,Cu2+,As3+,and Ca2+).Relative effects of each group on microorganisms calculated using GBM models are presented.MRT,multivariate regression tree;GBM,gradient boosting machine.
Prediction of microbial community composition in both AMD and human gut microbiota samples
We then used FCP to simulate how community composition responds to environmental factors.The environmental factors cause allied species to cluster,whereas interspecif ic competition makes them disperse,thus forming dynamic balance in microbial communities.Using both interspecif ic interaction and environmental information to quantify the driving force of community development,FCP model achieved a satisfactory prediction(Figure 4A)in AMD samples.The MAP model,which hasproven to beeffectivein prediction of microbial assemblages[21],was applied to AMD samples as well.The cross-validation of predicted values showed that the FCP model(R2=0.92,equation of linear regression:y=0.96x+0.003,Bray-Curtis similarity=85.32±9.68%)performed better than(one-tailed Student's t test,P=0.032)the MAP model(R2=0.72,y=0.79x+0.03,Bray-Curtis similarity=78.65±15.30%)(Figure 4B).Therefore,our FCP model demonstrated a higher degree of accuracy and smaller variance than the MAP model.The relative inf luence of environmental factors on AMD biof ilms predicted using the FCP,MAP,and GBM methods is shown in Figure 4C(correlation coeff icient(FCP,MAP)=0.75,P=0.0034;correlation coeff icient(FCP,GBM)=0.52,P=0.069;correlation coeff icient(MAP,GBM)=0.59,P=0.035).The high correlation coeff icient of the relative impact of environmental variables showed good consistency between the MAP and FCP methods.
To illustrate the effectiveness and applicability of the FCP model,we further applied it to human gut microbiota(Figure 4D)from healthy and diseased individuals.IBS is oneof themost prevalent functional gastrointestinal disorders,inf luencing 5%-11%of the population in most countries[37].The comorbidity of IBSwith depression iscommon[38].Alterations in the gut microbiota have been found relevant to both IBS and depression[39].Thus,it is important to understand how gut microbiome changes in persons with IBSand depression.We have collected fecal samples from 54 individuals[38],including 21 patients with IBS,6 with depression,12 with comorbid IBS and depression,and 15 health controls(Table S1).In addition,14 variables were measured,including height,weight,pain threshold,and concentrations of relevant molecules(Table S2).These samples were divided into two sets,one for model training and another for validation.For effective validation,each set included samples from the IBS,depression,comorbidity,and health control groups.The prediction using our FCP model(phylum:Bray-Curtis similarity=85.08±9.02%,R2=0.72;order:Bray-Curtis similarity=83.55±9.53%,R2=0.83;and genus:Bray-Curtis similarity=64.16±24.58%,R2=0.40)appeared to be better than(one-tailed Student's t test,phylum:P=0.15;order:P=0.06;and genus:P=0.10)that using the MAP model(phylum:Bray-Curtis similarity=82.88±10.91%,R2=0.70;order:Bray-Curtis similarity=78.76±17.92%,R2=0.74; and genus: Bray-Curtis similarity=59.41±19.11%,R2=0.28)at the phylum,order,and genus levels,respectively.
Consequently,the FCP model developed based on functional gene usage distribution was validated for both low-complexity and complicated microbial communities.The performance of FCP model was better than MAP model in both two datasets.In addition,the MAPmodel might generate a few isolated nodes and thus was unable to predict corresponding microorganisms well.Meanwhile,abnormal results were observed in some samples when predicting using the MAPmode and these outliers had to beremoved(nine outliers at the level of order and six at the genus level in 54 human gut microbiota samples),while there were no such cases when using our FCP model.Different from the MAP model that takes a black-box view,our FCP model has informative formulas and thus has the potential of grasping the intrinsic mechanisms of complex microbial communities.
Identif ication of CSS genes crucial for shaping community structure in AMD and human gut microbiota samples
With all annotated protein coding genes,the FCP model constructs the microbial community based on the functional gene usage.A further question of great interest is which part of thesegenesisimportant to shapesuch a microbial community.Clearly this part of genes should be distinct from the set of essential genes.To test this,we def ined this part of genes as CSS genes in this study.Using the FCP model and metagenomic data,we developed a selection method to identify CSS genes(see Methods).Considering that many genes have the same or similar functions,we measured CSSgenes in the unit of homologous genes according to the COG database.Applying the selection method to AMD samples(Table S3,Figure 5),we identif ied 583.3±103.3 CSS genes(Figure 5A).Among the samples,sample S14 had the lowest number of CSSgenes,amounting to 375 CSSgenes,while sample S12 had the highest number of CSSgenes,amounting to 841 CSSgenes.
As mentioned above,we f inally identif ied 1998 COGs after alignments in AMD samples.Now we compared the 1998 COGs with CSSgenes to discover enriched or depleted functions in the CSS genes.The remarkable enrichment of CSS genes in the COG category X(mobilome:prophages,transposons)revealed that gene exchange and recombination were important in AMD samples(Figure 5B).Previous studies[31]illustrated that AMD communities might have a high mutation rate or gene conversion frequency.One of the interesting f indings is that 8/20 transposases had a high probability(>0.975)to be CSSgenes.Transposases,regarding as selfness genes,might mobilize or activate genes that induce advantageous rearrangements[40]and enhance their hosts'f itness[41].Therefore they are important to community structure.Meanwhile,these 1998 COGs had 846 different prof iles of hit numbers for nine species,and the probability distribution of each prof ile in the CSS gene set in 17 AMD samples to a U shape(Figure 5C).The upper and lower quartiles of this Ushape distribution were 0.01 and 0.79,respectively,indicating that a large percentage of genes are always CSS genes and some genes arealways not.Compared to genes with low probabilities in the CSSgene set,the genes with high probabilities were involved in the categories M(cell wall/membrane/envelope biogenesis),X(mobilome:prophages,transposons),T(signal transduction mechanisms),and L(replication,recombination and repair)(Figure 5D).These data indicate that genes related to exchange and communications are important to shape community structure in all 17 samples.
Our analysis further showed that the number of CSSgenes increased with the relative abundance of bacteria(correlation coeff icient=0.60,P=0.01)in AMD samples.The average number of CSSgenesin the late succession stage samples(with 549.38±74.74 COGs)was much smaller than that of early succession stage ones(with 693.42±115.80 COGs).Furthermore,CSS genes in the early and late developmental stages were completely clustered into two groups(Figure 6A).It reveals that CSS genes were distinctly different at these two stages,possibly due to community physiological changes during ecological succession.Compared to the biof ilms in the late succession stage,CSSgenes involved in the COG categories V(defense mechanisms),U(intracellular traff icking,secretion,and vesicular transport),R(unknown functions),and P(inorganic ion transport and metabolism)were enriched in the early developmental stage biof ilms(Figure 6B).In the late developmental stage samples,we found more CSS genes involved in the categories N(cell motility),I(lipid transport and metabolism),M(cell wall/membrane/envelope biogenesis),O(posttranslational modif ication,protein turnover,and chaperones),and J(translation,ribosomal structure and biogenesis).These results substantially agree with previous studies[32],stating that proteins associated with physical and chemical stress defense,transcription,mobile genetic elements,and unknown functions were signif icantly overexpressed at the early stage,while proteins involved in motility,environmental signaling,chaperones and protein turnover,membrane biosynthesis,translation,and core metabolism were concentrated in mature biof ilms.
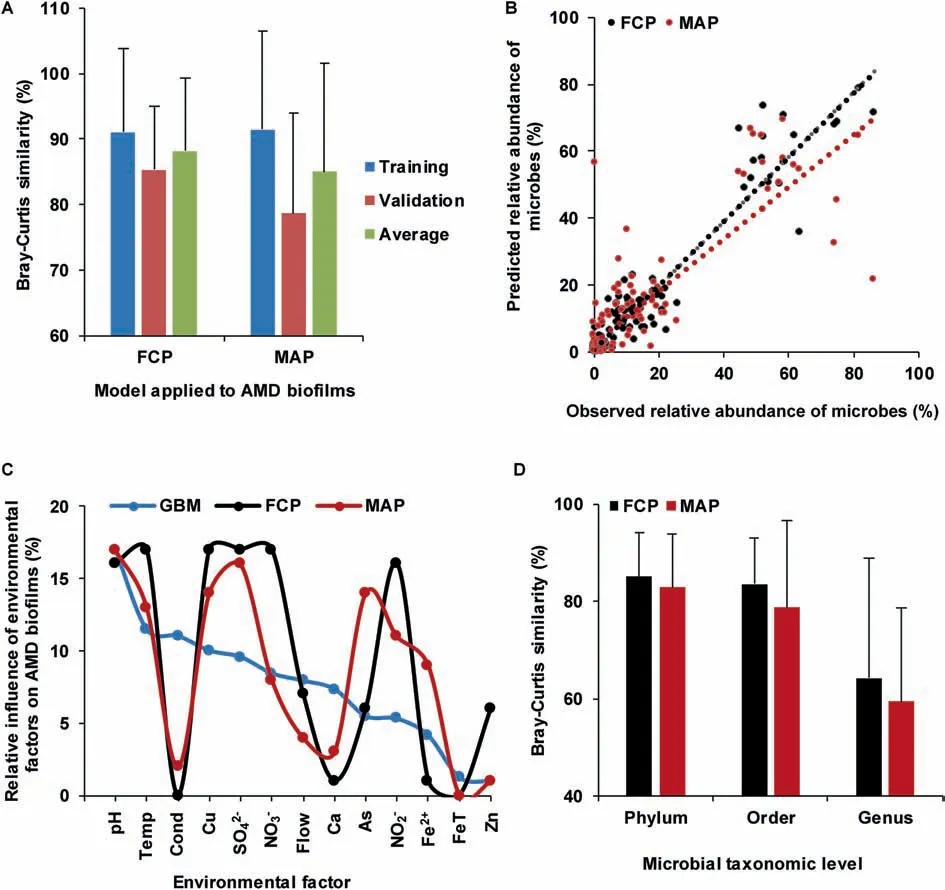
Figure 4 Comparison of prediction accuracies between the FCP and MAP methodsA.Prediction accuraciesof the FCPand MAPmethodsin AMD samples.Theprediction accuraciesfor thetraining dataset and validating dataset in AMD samples are measured using Bray-Curtis similarity,with the average accuracies also shown.B.Cross-validation of the predicted relative microbial abundances with MAP and FCP methods in AMD communities.The linear regression of the FCP model is expressed as y=0.96x+0.003(R2=0.92)and that of the MAP model is expressed as y=0.79x+0.03(R2=0.72),respectively.C.Relative inf luence of environmental factors on AMD biof ilms using GBM,FCP,and MAP methods.D.Comparison of prediction accuracies between the FCP and MAP models in human gut microbiota samples.The accuracies are measured using Bray-Curtis similarity.FCP,functional gene-based composition prediction;MAP,microbial assemblage prediction.
Asmentioned above,wedo not regard the CSSgenesasthe essential genes.To discover the differences among them,we compared CSS genes with the database of essential genes(DEG,http://www.essentialgene.org/)[15].We found that CSS genes were involved in more gene functions about information communication,such as categories X(mobilome:prophages,transposons),N (cell motility),L (replication,recombination and repair),and V (defense mechanisms)(Figure 7A and B)than essential genes.More genes related to categories R(general function prediction only)and S(function unknown)were enriched in the CSSgenes than essential genes.Out of the 1998 hit COGs,672 COGs had unique hit number prof ile.Among them,308 COGs had high probabilities(>0.5)in the CSSgene set and 472 COGs were found in DEG.There were 229 COGs shared by CSS gene set and DEG,and the permutation test showed that this overlap was signif icant (permutation time=10,000, P=0.01)(Table S4).The distribution of these 229 COGs revealed that some genes involved in metabolism and central dogma were both essential genes and CSS genes(Figure 7C).79 COGs,which were probable CSS genes and not f ind in DEG,were enriched in the categories X(mobilome:prophages,transposons),L(replication,recombination and repair),and J(translation,ribosomal structure and biogenesis),which were related to central dogma and mobile genetic elements.243 COGs,found in DEG but not in the CSSgeneset,were mostly related to thecategories J(translation,ribosomal structureand biogenesis),E(amino acid transport and metabolism),C(energy production and conversion),and H(coenzyme transport and metabolism).Among 672 COGs with unique hit number prof ile,there were 144 COGs with probabilities>0.5 in the CSSgene set in all 17 samples.These 144 COGs formed core CSSgene set,which were enriched in E(amino acid transport and metabolism),J(translation,ribosomal structure and biogenesis),and H(coenzymetransport and metabolism),with 30 COGs in E,27 in J,and 17 in H categories,respectively.74.31%(107/144)core CSS genes were found in DEG.The COGs that belonged to core CSS genes but not in DEG(totally 37 COGs)were mostly enriched in the categories S(function unknown),X(mobilome:prophages,transposons),and R(general function prediction only),with 7 COGs in S,6 in X,and 5 in R categories,respectively.
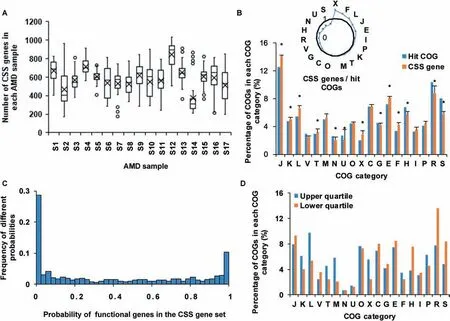
Figure 5 Analyses of CSS genes in AMD samplesA.Numbers of CSSgenes in AMD samples.The circles represent the outlier values and black crosses show the average numbers of CSS genes in corresponding samples.B.Comparison of the distribution of CSSgenes with 1998 hit COGs.The radar map shows the relative size of CSS genes and hit COGs in each COG category.The asterisks show that the enrichments are signif icant(Fisher's exact test,P<0.05).C.The distribution of probabilities of functional genes in the CSS gene set.D.The distribution of functional genes whose probabilities in the CSSgene set are in the f irst 25 percentage(upper quartile)and the last 25 percentage(lower quartile).Details of the COG categories are provided in the legend of Figure 2.CSS,community structure shaping.
We f ind that there are great differences in the contribution levels of each genome to CSSgenes,essential genes,and all hit COGs.Among the total 1998 hit COGs,about 34.3%(680/1998)COGs were only present in bacterial genomes and 32.68%COGs(653/1998)in archaeal genomes in AMD community,indicating that the contribution levels of bacterial and archaeal genomes to all hit COGs were approximately equal.Bacterial genomes contributed much less to CSS genes than to all hit COGs,whereas archaeal genomes contributed more to CSS genes than to all hit COGs and to essential genes.Among 229 COGs shared in CSS gene set and DEG,10.04%(23/229)COGs were included only in bacterial genomesand 29.26%(67/229)only appeared in archaeal genomes.Among 79 COGs which were only present in the CSSgene set,only 1.27%(1/79)COG was from bacterial genomes while 49.37%(39/79)COGs were only present in archaeal genomes.For the 243 COGs which were only present in DEG,0.4%(1/243)COG was only in bacterial genomes,while 19.75%(48/243)were only in archaeal genomes.Therefore,despite of the low relative abundances of archaea,they contributed greatly to maintaining the community structure.
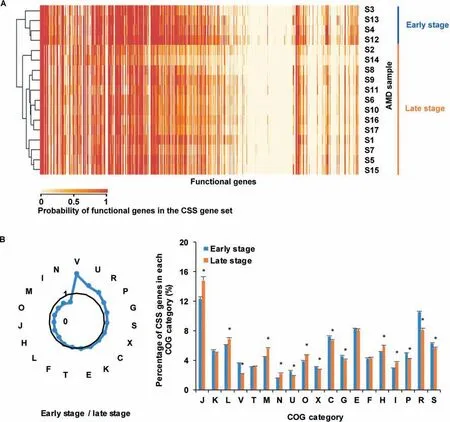
Figure 6 Comparison of CSS genes in AMD samples at the early and late succession stagesA.Cluster analysis of probabilities of functional genes in the CSS gene set in AMD samples.The color in the heatmap shows the probabilities of functional genes in the CSSgene set,with larger values in red while smaller values in yellow.The results show that these functional genes are clustered into two groups.B.Comparison of therelative magnitudes of CSSgenes in theearly and late stagesamples.The radar map shows the relative size of CSSgenes in the early and late succession stage samples in each COG category.The asterisks show that the enrichments are signif icant(Fisher's exact test,P<0.05).Details of the COG categories are provided in the legend of Figure 2.
In the extreme acidic,heated,and high concentration of heavy metals content environment,resisting the pressure from the surroundings becomes one of the greatest challenges to microbes.The size of CSS gene set was decreased as biof ilm matured and CSSgenes involved in lipid transport and metabolism,cell motility,and membrane biogenesis were more abundant at the late developmental stage,indicating an increase in communication and motility in mature microbial communities.Compared to theessential genes,CSSgeneswere focused on genesexchanges and responses to extremeenvironments,as indicated by the discovery that CSSgenes were signif icantly enriched in mobilome and defense mechanism.Meanwhile,CSSgenes shared 229 COGs with essential genes and these COGs mainly were focused on metabolism and central dogma.Theseindicatethat somemetabolism-related genes were crucial for microorganisms no matter they were cultivated alone or inhabited in the natural environments with other microorganisms.Our study shows that CSSgenes could ref lect the selection pressure from environments and relationships between species.It also helps to understand important cellular processes that sustain life in the natural settings.
We also applied the workf low to identify CSS genes in human gut microbiota samples(Figure 8,Table S5).The numbers of CSSgenes in comorbidity,health control,depression,and IBS groups were 1437.38±292.20,1483.35±340.82,1351.80±133.90 and 1585.24±371.92,respectively(Figure 8A).The numbers of CSSgenes in human gut microbiota samples were obviously higher than those of AMD samples.This might be caused by the intrinsic complexity in the human gut microbial communities.We found that there were 226 COGs with high probabilities(probability=1)to be CSS genesin all 54 samples.Compared to all hit COGs(Figure8B),these 226 COGs were enriched in the categories J(translation,ribosomal structure and biogenesis),R(general function prediction only),and S(function unknown).
The differences between CSS genes and essential genes in human gut microbiota were much larger than those in the AMD samples(Figure 8C).In 3689 COGs with unique prof ile,there were 1125 essential genes and 1114 CSSgenes(probability≥0.5).However,only 153 COGs were shared by CSSgenes and essential genes.The permutation test showed that the difference between CSSgenes and essential genes was signif icant(permutation time=10,000,P<1E-4).In the 153 overlapped COGs,20.92%(32/153)belonged to the category J(translation,ribosomal structure and biogenesis).961 COGs,which were CSS genes but not found in DEG,were enriched in the categories S(function unknown),R(general function prediction only),J(translation,ribosomal structure and biogenesis),and C(energy production and conversion).972 COGs,which were found in DEG but not in the CSS gene set,were mostly related to the categories J(translation,ribosomal structure and biogenesis),E(amino acid transport and metabolism),M (cell wall/membrane/envelope biogenesis),and C(energy production and conversion).
In addition,we also examined the COGs with signif icantly different probabilities to be CSSgenes in four groups,including health control group,depression group,IBS group,and comorbidity group.Compared to samples in health control group,we found that 15 COGs were more likely to be CSS genes in IBS group(Student's t test,P<0.01)(Figure 8D,Table S6).Herein,COG2148(sugar transferase involved in lipopolysaccharidebiosynthesis)isinvolved in lipopolysaccharide biosynthesis;COG1883(Na+-transporting methylmalonyl-CoA/oxaloacetate decarboxylase,beta subunit)is involved in the formation of oxaloacetate from pyruvate;and COG1483(predicted ATPase,AAA+ superfamily)is a predicted ATPase.These three COGs were associated with saccharides,which might be utilized by intestinal microorganisms to produce gas, thus resulting in abdominal distension.COG0334(glutamate dehydrogenase/leucine dehydrogenase),COG0119 (isopropylmalate/homocitrate/citramalate synthases),COG0495(leucyl-tRNA synthetase),COG0031(cysteine synthase), COG1185 (polyribonucleotide nucleotidyltransferase; polynucleotide phosphorylase),COG0060(isoleucyl-tRNA synthetase),COG0503(adenine/guanine phosphoribosyltransferase or related PRPP-binding protein), COG0046 (phosphoribosylformylglycinamidine(FGAM)synthase,synthetasedomain),and COG0087(ribosomal protein L3)wereassociated with thesynthesisand metabolism of amino acids,nucleotides,and proteins.Amino acidsare reported to be component of mucin in the intestinal epithelial barrier and thus associated with gut barrier function[42].Herein,glutamine is an energy source of enterocytes[43].Nucleotidesarecrucial for enterocytesin thedevelopment,maturation,and repair of intestine[43].In addition,compared to samples in health control group,we found that 2 COGs were morelikely to beCSSgenesin depression group(Student's t test,P<0.01)(Figure 8E).Herein,COG4627 is a predicted Sadenosyl-L-methionine(SAM)-dependent methyltransferase,which transfersthemethylgroup from SAM to other substrates.For instance,catechol-O-methyltransferase,which belongs to SAM-dependent methyltransferase fold family[44],could methylatecatechol compoundsand inactivatethecatechol neurotransmitter dopaminein theprefrontal cortex[45],thusit has many a times been suggested to be involved in affective disorders,such as depression[46].
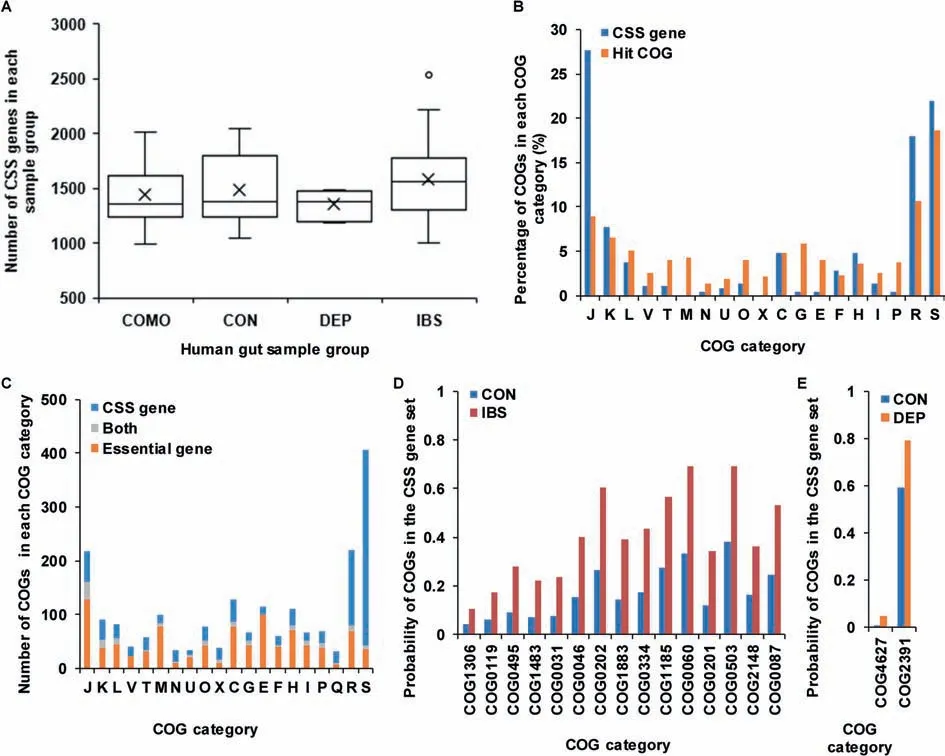
Figure 8 Comparison of CSS genes in different human gut microbiota sample groupsA.Comparison of the numbers of CSS genes in COMO,CON,DEP,and IBS groups in human gut microbiota samples.The circles represent the outlier values and black crosses represent theaverage numbers of CSSgenes in corresponding groups.B.Comparison of the distribution of CSSgenesto all hit COGs in human gut microbiota samples.C.Comparison of thedistribution of CSSgenesand essential genes in all COG categories in human gut microbiota samples.COGs that are present in both the CSSgene set and essential gene set are shown in gray.Blueand orangebarsindicategenesthat only exist in the CSSgeneset and DEG,respectively.D.Comparison of the COGs with signif icantly different probabilities to be CSS genes in CON and IBSgroups.E.Comparison of COGs with signif icantly different probability to be CSSgenes in CON and DEP groups.COMO,comorbidity;CON,health control;DEP,depression;IBS,irritable bowel syndrome;DEG,database of essential genes.
Discussion
To explore the mechanisms of microbial community adapting to thenatural environments,wehaveproposed a novel replicator dynamics model,FCPmodel,based on functional genes of members within the community.With the attempt to integrate metagenomic sequences and environmental factorsto quantify the motive power,we aim to circumvent the limitation of traditional dynamic models.Mainstream analyses in microbial ecology mostly build models with phenotypic parameters,which are often on the macroscopic scale.Herein,our model based on the molecular information and phenotypic parameters is built on both microscopic scale and macroscopic scale.Our study thus provides the insight into linking functional genes with the assembly of microbial communities.Using FCP model,the prediction matches the observed microbial community assemblage in both a relatively simple biological system and a complex one.The mean and variance of predicted values using our model are superior to those obtained using the MAP model,which has been proved to offer good prediction accuracy and widely used[21,36].The similarities of relative inf luence of environmental factors on population compositions obtained using different methods(i.e.,FCP,MAP and GBM models)also demonstrate the accuracy of our model.
Furthermore,we have proposed the concept of CSSgenes,and developed an approach to select CSS genes in microbial community.We rebuild community at the functional level,not at the taxonomic level,which leads to good prediction performance.This suggests that the community structure isdetermined by functional genes rather than species,which might be helpful in holding the key to answer the fundamental question about what determines the composition of local communities[47,48].In addition,our data show that despite of the low relative abundances of archaea,they contribute greatly to maintaining the community structure.It is the minority,not the majority,that plays a far more important role in shaping community structure.
We take the metagenomic data of AMD microbiota as a typical microbial community to build the FCPmodel and identify CSSgenes.An important focus of this study is to analyze how the CSSgenes change during biof ilm maturation.As the biof ilm matures,the size of CSSgene set is decreased,partially due to the increased genomic diversity and physiological shifts.The clustering analysis illustrates that CSSgenes in the different biof ilm growth stages are distinct.Thus,an outline of CSS gene set could be sketched based on the developmental stage.CSSgenesinvolved in genesabout environmental stressessuch as defensemechanisms havea higher probability of presencein the early succession stage,while genes encoding cell motility and membranebiogenesisaresignif icantly increased at thelate succession stage.Moreover,the enrichment of lipid transport and metabolism in mature biof ilms with higher temperature is supported by studiesabout thechanges of lipid composition in membranes of microorganisms under different temperature conditions[49].In summary,we suggest that thetop priority of AMD communities would be to resist pressures from extreme environments during early growth stage.With the development of AMD biof ilms,the pressure resulting from competition for dwindling resources would be increased,thus cells try to move to places with more resources,leading to competition alleviation.
We also apply the model to human gut microbiota samples and identif ied CSSgenesin each sample.Wef ind that thenumbers of CSS genes in human gut microbiota are much higher than those in AMD microbiota.Some COGshave signif icantly higher probability to be CSSgenes in IBSgroup than health control group and they are enriched in the synthesis and metabolism of amino acids,nucleotides,proteins,and lipopolysaccharide.These substances are components of mucin in the intestinal epithelial barrier and thus important for gut integrity and gut barrier function repairment.In addition,these substances are gas producers,consistent with the abdominal distention in IBS group.We also f ind that a predicted SAM-dependent methyltransferase has signif icantly higher probability to be CSS gene in the depression group than in the health control group.This result is supported by many studies about the antidepressant properties of SAM[50,51].
Although delineating the CSSgeneset isstill at a developing stage,our study about identifying CSSgenes might help us to understand critical cellular processes that sustain communities.Also,it may be useful for designing addable gene circuitries to make an artif icial self-sustainable community and treating diseases related to microbiota dysbiosis.There are also some limitationsof our FCPmodel asfollowing.(1)Too high dimensional data(for example,too many environmental factors or taxa)will posea big challengefor prediction.(2)Metagenomics sequences are needed for the FCP model,and this costs much more than the models based on 16SrRNA sequences.(3)The prediction islimited if thebiological system islargely inf luenced by the variables that we do not consider,such as undetected environmental factors.In this paper,we annotate genes with the COG databaseasan examplein FCPmodel and CSSgenes.In fact,we can use gene annotation from any other databases,such as the KEGG(Kyoto Encyclopedia of Genes and Genomes)database.In this study,we have applied our model and CSSgene selection method to AMD samples and human gut microbiota,and it could be expanded to other biological systems,such assoil systemsand deep-sea systems.
Material and methods
Genomic data,gene prediction,and taxonomic classif ication
All genome sequences of the nine microorganisms from AMD samples were downloaded from the NCBI BioProject database(https://www.ncbi.nlm.nih.gov/bioproject/).The BioProject Accession Nos are listed as follows:PRJNA18795(Leptospirillum group II),PRJNA37907(Leptospirillum group III);PRJNA40089 (G-plasma); PRJNA29599 (A-plasma);PRJNA40091 (E-plasma); PRJNA40093 (I-plasma);PRJNA29595(Ferroplasma type I);PRJNA29597(Ferroplasma type II);and PRJNA38565(ARMAN2).All metagenomic sequences of human gut microbiota and clinical parameters were generated by our lab or our collaborators[38].We obtained 28 AMD samples and 60 human gut microbiota samples.Afterward,we removed samples with over half not determined environmental factors.Finally,we got 17 AMD samplesand 54 human gut microbiota samples.Therelativeabundanceof ninespecies accountsfor 97.65±0.79%of the total population of AMD samples after excluding unassigned sequences.In human gut microbiota samples,after excluding unassigned sequences,the relative abundance of taxa accounts for 98.26±3.92%,98.18±2.05%,and 85.02±12.10%of the total population of human gut microbiota samples at phylum,order,and genus level,respectively.
To carry out the analysis of the metagenomes,Quake[52]was used to detect and correct errors in the raw data.Prinseq[53]was used to f ilter out low quality reads.After that,Inte-MAP[54]was used to assemble these preprocessed reads into contigs.MetaGUN[55],a novel geneprediction tool,wasused to predict protein coding genes,and MetaTISA[56]was then applied to revise translation initiation sites of predicted genes.PhymmBL[57,58],the hybrid classif ier combining analysis from both Phymm and BLAST,was used to perform taxonomic classif ication.Default parametersin thesemethodswere used for the related analyses.Each predicted gene was annotated through searching COG database[33,59,60]by BLAST[61]with E-value=1E-5.
Statistical analyses of relationships
To quantify theinf luenceof environmental factorson different microorganisms,we applied MRT and GBM analyses,which work well in interpreting the relationships between complicated ecological systems and their surroundings.To learn the relationships among the relative abundances of microorganisms,we used the CCREPE method.GBM,MRT,and CCREPE analyses were conducted with the gbm(with 5000 trees used for the boosting,5-fold cross-validation and 3-way interactions),mvpart(with default parameters),and ccrepe(with default parameters)package in R statistical computing environment,respectively.GBM is a powerful machine learning method for regression and classif ication problems,and it can givea description of relativeinf luenceof several input variables on the target variations[35].MRT analysis is a statistical technique that can be used to study complicated non-linear relationships by providing a taxonomy-supervised tree[34].CCREPE takes the compositional effect into consideration and establishes corrections based on a null distribution.Cytoscape[62]was used for the biological network visualization.
The FCP model
In thecurrent study,weproposed a mathematical model based on the functional gene usage distribution to simulate and predict microbial population structure.This model was built on themodif ied replicator dynamicswith variablepopulation size.We described the interspecif ic interactions using the functional gene distribution.Then we used the interspecif ic interactions,combined with environmental factors,to quantify the f itness.In detail,for a community with num different kinds of species,we determined f itness with interspecif ic interactions and environmental f iltering as follows:
fnum×1=Anum×numxnum×1+hnum×1
After aligning genomes to all predicted peptides in COG database,we obtained the functional similarity through calculating the Pearson correlation coeff icient between the distributions of functional genes in different species.This functional similarity matrix is denoted as S.The matrix of functional dissimilarity,A,is used to measure the benef it from functional cooperation between two microorganisms, we def ine A=L-S,where L is a matrix whose elements are 1.The matrix A shows that when microorganisms with similar functions meet,there would be likely to have relatively low benef it due to interspecif ic competition.h denotes the relationships between environmental factors and microbes,thereby presenting environmental f ilter tendency.Environmental data are stored in vector e.Column vector h is the product of matrix B and vector e,that is h=B e.Lasso regression,a regression analysis method capable of variable selection,was used to solve linear relationships between h and environmental factor e.Thus,we determined the critical motive for constructing a community by the functional gene distribution and environmental factors.
For a community with num different kindsof species,let ni,,be the number of the i th species at a given time.Then the population size is N=■i∈sniand the rel-ative abundance of the i th species is xi=
The models are given by the following equation:
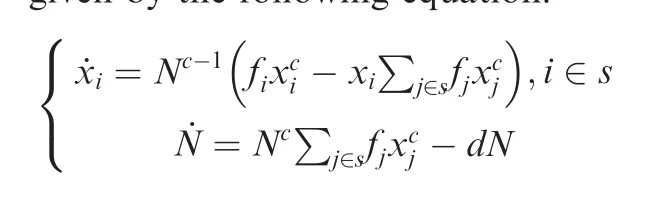
Here,˙xiisthef irst derivativeof xiversustime and˙N is that of N versus time.fiis the f itness of the i th species,and d is the death rate.Growth index c describes how much faster(c>1)or slower(0<c<1)the population size changes with time than exponential growth.Given what we considered is a microbial community under limited conditions,namely the growth of species is sub-exponential,we set 0<c<1.We chose this setting because microbial cells under extreme environments are reported to catabolize 104-to 106-fold slower than organisms in nutrient-rich cultures[63].
Prediction using the FCP model
The FCP model was solved in MATLAB with the f ind minimum of constrained nonlinear multivariable function(FMINCON).The initial values were chosen based on the observed abundance distributions in AMD biof ilms[32].The initial values of human gut microbiota data were from the health control group.In fact,the FCPmodel is insensitive to the initial values of parameters.When other variables were kept the same and the initial relative abundances were altered on a large scale,96.57%(482,829/500,000)of results were converged to a same one.The effect of initial values of population size N and death rate d on results is also limited.When we changed the initial values of N from 1 to 1000,000,only numbers after the 4th decimal place of predictive results were inf luenced;and for d from 0.001 to 1,it was the 3th decimal place.Growth index c has some inf luence on community structure but littleon the average results.Each sample weset 100 different and random initial values of h and c.The consistency of predictions of these 100 tries(the variance of Bray-Curtis similarity is 4.0±3.7%)show the robustness of our FCP model.
CSS genes selection method
Due to the universality of functional redundancies,only several of genesplay an important rolein maintaining thestability of the microbial community structure.These genes are def ined as CSSgenes.Lossof CSSgenesleadsto signif icant changesof the community structure.Thus,we can pick up the CSSgenes by testing the impact of genes on the community structure.
The FCP model allows us to quantify the contribution of each gene to the community structure.Perturbation calculationswere used for measuring changesof the community structure. Bray-Curtis similarities between the perturbed community structures(small stochastic disturbances,10,000 times in each sample)and unperturbed ones were calculated.If the Bray-Curtis similarity is beyond the threshold obtained by Student's t test,we consider that there is a signif icant change in the microbial community structure after perturbation.Through screening genes one by one,we dropped genes which did not inf luence community structure signif icantly.To reducetheimpact of theparameter selection in FCPmodel,we used 50 groups of parameters with good prediction and took the average of these 50 groups as the prediction output.At last,after repeating the steps across all samples,we f igured out all CSSgenes in the natural environments.
Authors’contributions
HZ and QW put forward the research plan and guided theproject.XJ developed the mathematical modeling and analyzed data.XJ,XL,and LY assembled all the f igures and tables and wrotethe manuscript.CL wrotethe program for CSSgene selection and performed the analysis.WC applied the FCP model to human gut microbiota data.All authors read the manuscript and approved the f inal edition.
Competing interests
The authors have declared that no competing interests exist.
Acknowledgments
This work was supported by the National Key R&D Program of China(Grant No.2017YFC1200205),the National Natural Science Foundation of China(Grant Nos.31671366 and 91231119),and the Special Research Project of‘Clinical Medicine+X'by Peking University,China awarded to HZ.Part of the analysis was performed on the High Performance Computing Platform of the Center for Life Science of Peking University.We thank Lu Zhang and others for thoughtful discussion of the manuscript.We would like to thank Dr.Iain Bruce of the University of Calgary for his helpful advices to the writing improvements.
Supplementary material
Supplementary data to this article can be found online at https://doi.org/10.1016/j.gpb.2018.09.003.
 Genomics,Proteomics & Bioinformatics2019年1期
- Genomics,Proteomics & Bioinformatics的其它文章
- Acknowledgments to Reviewers 2018
- GPA:A Microbial Genetic Polymorphisms Assignments Tool in Metagenomic Analysis by Bayesian Estimation
- Agricultural Risk Factors Inf luence Microbial Ecology in Honghu Lake
- Inulin Can Alleviate Metabolism Disorders in ob/ob Miceby Partially Restoring Leptinrelated Pathways Mediated by Gut Microbiota
- Eあects of Proton Pump Inhibitors on the Gastrointestinal Microbiota in Gastroesophageal Ref lux Disease
- Antibiotic Treatment Drives the Diversif ication of the Human Gut Resistome