
Assessment of different mcy genes for detecting the toxic to non-toxic Microcystis ratio in the field by multiplex qPCR*
2018-08-02 02:50:40ZUOJun左俊CHENLiting陳莉婷SHANKun閃錕HULili胡麗麗SONGLirong宋立榮GANNanqin甘南琴
ZUO Jun (左俊) , CHEN Liting (陳莉婷) , SHAN Kun (閃錕) , HU Lili (胡麗麗) SONG Lirong (宋立榮) , GAN Nanqin (甘南琴)
1 State Key Laboratory of Freshwater Ecology and Biotechnology, Institute of Hydrobiology, Chinese Academy of Sciences,Wuhan 430072, China
2 University of Chinese Academy of Sciences, Beijing 100049, China
3 Institute of Electronic Information Technology, Chongqing Institute of Green and Intelligent Technology, Chinese Academy of Sciences, Chongqing 400714, China
Abstract Harmful cyanobacterial blooms, especially Microcystis blooms, occur worldwide and draw widespread attention. The dynamics of microcystin-producing Microcystis and competition between microcystin-producing Microcystis and non-microcystin-producing Microcystis are key to predicting and treating Microcystis blooms. Multiplex qPCR is a useful tool to assess such issues. In this study, we developed multiplex qPCR methods with newly-designed probes and primers for the microcystin-synthesis related genes mcyA and mcyE. We used seven toxic Microcystis strains and four non-toxic Microcystis strains to compare the differences in the ratios of toxic and non-toxic Microcystis in mixed cultures, which were calculated using abundances of the genes mcyA, mcyB, mcyD, mcyE and phycocyanin ( PC). We also compared traditional cell counting and multiplex qPCR. Hierarchical clustering and principal component analysis indicated that mcyD was the most suitable mcy gene for quanti fication in laboratory experiments.mcyB abundances were always higher; we suggest that the amount of toxic Microcystis measured using mcyB might overestimate the actual percentages.
Keyword: Microcystis bloom; toxic Microcystis; multiplex qPCR; mcyA; mcyB; mcyD; mcyE; PCA
1 INTRODUCTION
Cyanobacterial blooms in freshwater bodies are of considerable concern worldwide because they pose a major hazard to human health, livestock, wildlife and the aquatic environment (Bowling et al., 2016). Some cyanobacteria produce toxins, which can cause serious and occasionally fatal human liver, digestive,neurological, and skin diseases (Paerl and Huisman,2008). One of the most pervasive bloom-forming cyanobacteria in freshwater ecosystems is Microcystis,and Microcystis blooms have been reported in 108 countries (Harke et al., 2016). In China, Microcystis blooms occur in many lakes and rivers, such as Lake Taihu and Lake Dianchi (Zhu et al., 2014; Hu et al.,2016b). Microcystis and some other harmful cyanobacteria can produce highly-stable cyclic heptapeptide hepatotoxins known as microcystins(MCs), which share the common structure cyclo(-Adda-D-Glu-Mdha-D-Ala-L-X-D-MeAsp-L-Z),where X and Z represent variable amino acids (Mikalsen et al., 2003). To date, over 100 different MC congeners have been characterized (Puddick et al., 2014).
The gene cluster ( mcy) responsible for MC biosynthesis has been characterized. The mcy gene cluster assembly in Microcystis aeruginosa consists of 10 bidirectionally-arranged genes that reside in two operons ( mcy A–C and mcy D–J), and its products are peptide synthetases and polyketide synthases, a putative ABC transporter, and tailoring enzymes(Nishizawa et al., 1999, 2000; Tillett et al., 2000). In other genera, the gene cluster coding for this enzyme complex consists of 9 or 10 genes (Briand et al., 2009).
Within a species, individual strains can be toxic or nontoxic, and this cannot be distinguished under the microscope (Vezie et al., 1998). It is well-established that cyanobacterial blooms may contain both toxic and non-toxic strains (G?ga?a et al., 2014). Therefore,it is difficult to predict the concentration of MCs in the water during a cyanobacterial bloom. This is partly because of differences in the proportions of MC-producing and non-MC-producing subpopulations within cyanobacterial populations,and partly because of toxin heterogeneity within an MC-producing subpopulation and/or differences in the level of expression of the genes involved in the biosynthesis of MCs (Briand et al., 2009). MCs can reach extremely high levels during Microcystis blooms, for example, 7 300 μg/g dry weight in China,7 100 μg/g dry weight in Portugal, 15.9 mg/L in Japan and 36 mg/L in New Zealand (Harke et al., 2016).
Many laboratory studies have indicated that MC quota is a plastic trait and can be a function of growth rate, nutrient concentrations, temperature, light levels,and grazers (Wood et al., 2011; Horst et al., 2014).MC dynamics in aquatic environments are an important ecological topic and the eventual toxin concentrations in the water are governed: (i) at the cellular level, by the rate of MC production in toxigenic strains; and (ii) by the population size and structure (Hu et al., 2016a). The development of reliable methods for monitoring cyanobacteria in environmental samples has been a concern of many researchers (Sangolkar et al., 2006). The dynamics of Microcystis blooms have been extensively investigated using diverse molecular techniques including cloningsequencing, fingerprinting technology, denaturing gradient gel electrophoresis, restriction fragment length polymorphism, and other molecular techniques with 16S–23S rRNA ITS, PC- IGS and mcy genetic markers (Neilan et al., 1995; Kurmayer et al., 2002;Nonneman and Zimba, 2002; Mikalsen et al., 2003;Via-Ordorika et al., 2004; Kardinaal et al., 2007).With the establishment of quantitative real-time PCR(qPCR) to quantify MC-producing cyanobacteria, an increasing number of researchers have studied the succession of MC-producing genera and monitored toxic bloom formation. The mcy gene cluster was used as gene marker to quantify toxic genotypes,including mcyA (Yoshida et al., 2007; Oh et al., 2013),mcyB (Kurmayer et al., 2003; Martins et al., 2011),mcyD (Rinta-Kanto et al., 2005; Fortin et al., 2010;Pimentel and Giani, 2013), mcyE (Vaitomaa et al.,2003; Conradie and Barnard, 2012; Otten et al., 2012)and mcyJ (Kim et al., 2010; de la Escalera et al., 2017).
It is well known that field experiments are challenging, which means researchers carry out extensive experiments in the laboratory to explore competition and succession among MC-producing cyanobacteria. A great many papers based on laboratory experiments have used qPCR of the mcy gene cluster to study the effect of factors including CO2(Van De Waal et al., 2011; Yu et al., 2015), light intensity (Renaud et al., 2011), UV-B radiation (Yang et al., 2015), and nutrients (Davis et al., 2010; Lei et al., 2015), which effect the competition between MC-producing Microcystis and non-MC-producing Microcystis. Dittmann et al. (1997) obtained a non-MC-producing M. aeruginosa PCC 7806 mcyB-mutant by insertion of the chloramphenicol resistance cassette ( Cm). Briand et al. (2012) used multiplex qPCR to determine the number of non-MC-producing Microcystis (MT) cells via the Cm inserted into the mcyB gene, and the total number of M. aeruginosa cells (WT and MT) via the intergenic spacer region within the phycocyanin ( PC) operon in the competition between wild-type PCC7806 and the PCC7806 mcyB -mutant.
Until now, only two multiplex qPCR methods have been used to determine the cell numbers in competition experiments: mcyB for MC-producing Microcystis and PC for all Microcystis, or Cm for non-MC-producing Microcystis and PC for all Microcystis. If one chooses the Cm/ PC system, one must use PCC7806 and the PCC7806 mcyB-mutant. However,study of the mechanisms of relationships between MC-producing Microcystis and non-MC-producing Microcystis requires the use of a greater variety of Microcystis species. Different gene markers could be used to quantify MC-producing Microcystis, but it is not known which are most accurate. Ideally, multiplex qPCR should be used, because it is more labor-saving,more accurate and cheaper than singleplex qPCR or the SYBR method. In this study, we aimed to: (1)establish multiplex qPCR systems for detection of other mcy genes, and (2) compare the accuracy of using different mcy genes.
2 MATERIAL AND METHOD
2.1 Microcystis strains and cultures
The MC-producing strains M. aeruginosaFACHB-905, M. aeruginosa FACHB-1328,Microcystis. sp. FACHB-1271, M. flos- aquae FACHB-1272, M. aeruginosa FACHB-1279,M. aeruginosa PCC7806, and the non-MC-producing strains M. aeruginosa FACHB-469 and Microcystis.sp. FACHB-1342, were provided by the Freshwater Algae Culture Collection at the Institute of Hydrobiology (FACHB-collection, Wuhan, China).MC-producing strain M. aeruginosa NIES-843 was provided by Professor LI Renhui (Institute of Hydrobiology, Chinese Academy of Sciences), and the non-MC-producing strains M. aeruginosa Taihu98 and M. viridis T100 by Professor LI Tao (Institute of Hydrobiology, Chinese Academy of Sciences). The detailed information of all the strains were listed in Table 1. The cultures were maintained at 23±3°C in BG-11 medium (Rippka et al., 1979) under a constant,cool fluorescent light with intensity 30±5 μmol photons/(m2·s), in a 12 h:12 h light: dark cycle.
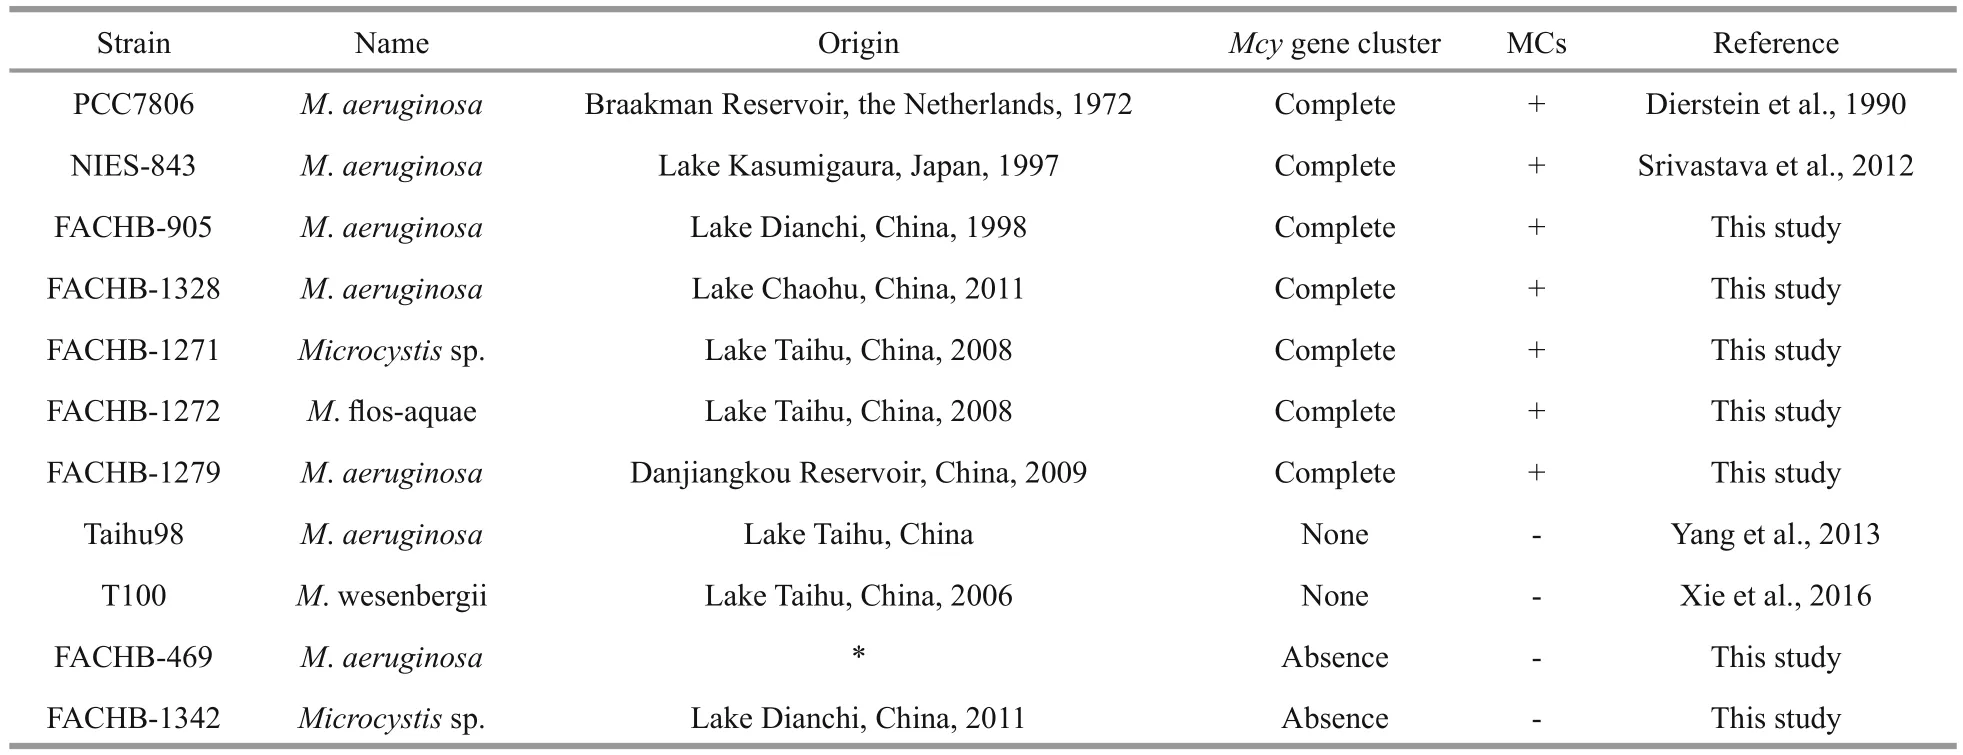
Table 1 Strains of Microcystis used in this study
2.2 Samples and DNA extraction
Ten-milliliter samples of each MC-producing strain (seven strains) mixed with 10-mL samples of each non-MC-producing strain (four strains) yielded 28 combinational samples. The proportion of MC-producing Microcystis in the mixed samples was determined by cell counting and quantitative PCR.Five-milliliter mixed samples were filtered in triplicate onto a 0.22-μm nominal pore-size Nuclepore Track-Etch Membrane (Whatman, GE, USA), which was immediately frozen at -20°C until processing.Genomic DNA was extracted using a MP FastDNA SpinDown Kit (MP Biomedicals, LLC, France)according to the manufacturer’s protocol. The concentration and purity of DNA were determined using comparison of the optical density at 260 and 280 nm by spectrophotometry (NanoDrop 8000,Thermo Fischer Inc., USA), and DNA samples were stored at -20°C.
2.3 Cell counting
One milliliter samples of each strain in triplicate were fixed with 10 μL Lugol’s iodine solution. The fixed samples were mixed to homogeneity, placed in a hemocytometer (QiuJing Factory, Shanghai, China),and counted under a microscope (Eclipse E200,Nikon, Tokyo, Japan). The counting was performed six times for each sample and the cell concentration of each sample was calculated using the mean cell number. The proportion of MC-producing Microcystis in the mixed samples was calculated by the ratio of MC-producing cell numbers to total Microcystis cell numbers (MC-producing cell numbers plus non-MC-producing cell numbers).
2.4 Primer and probe design
A real-time PCR assay was used to quantify the PC-IGS (the intergenic spacer between the two bilin subunit genes of the PC gene) and mcy gene regions( mcyA, mcyB, mcy D, mcyE). M. aeruginosa mcyA and mcyE gene-speci fic primers and probes were from the mcy gene sequences of M. aeruginosa PCC7806(DDBJ/EMBL/GenBank accession No. AF183408.1)and designed using Beacon Designer 7.9 software(Premier Biosoft, USA), which provided the formation of self-dimers or cross-dimers and formation ofhairpin structures. The primer sequence speci ficities were con firmed using NCBI/Primer BLAST in NCBI RefSeq Reference and Representative Genomes,across broad taxonomic groups including eukaryotes,bacteria, archaea, viruses and viroids (www.ncbi.nlm.nih.gov/tools/primer-blast). All the newly designed primers were tested for use in qPCR with SYBR(SYBR Green Real-time PCR Master Mix, Toyobo,Japan) for ampli fication efficiency and analyzed by melting curve for amplicon speci ficity. The TaqMan probe for the PC gene was modi fied 5′- with fluorescent reporter dye CY-5 (5-indocarboxycyanine)and 3′- with fluorescent quencher dye BHQ-2 (black hole quencher-2). The TaqMan probes for all mcy genes were 5′-labelled with FAM(6-carboxy fluorescein) and 3′-labelled with BHQ-1(black hole quencher-1). All the primers and probes used in this study are listed in Table 2 and were synthesized by the Beijing Genomics Institute (BGI),China.
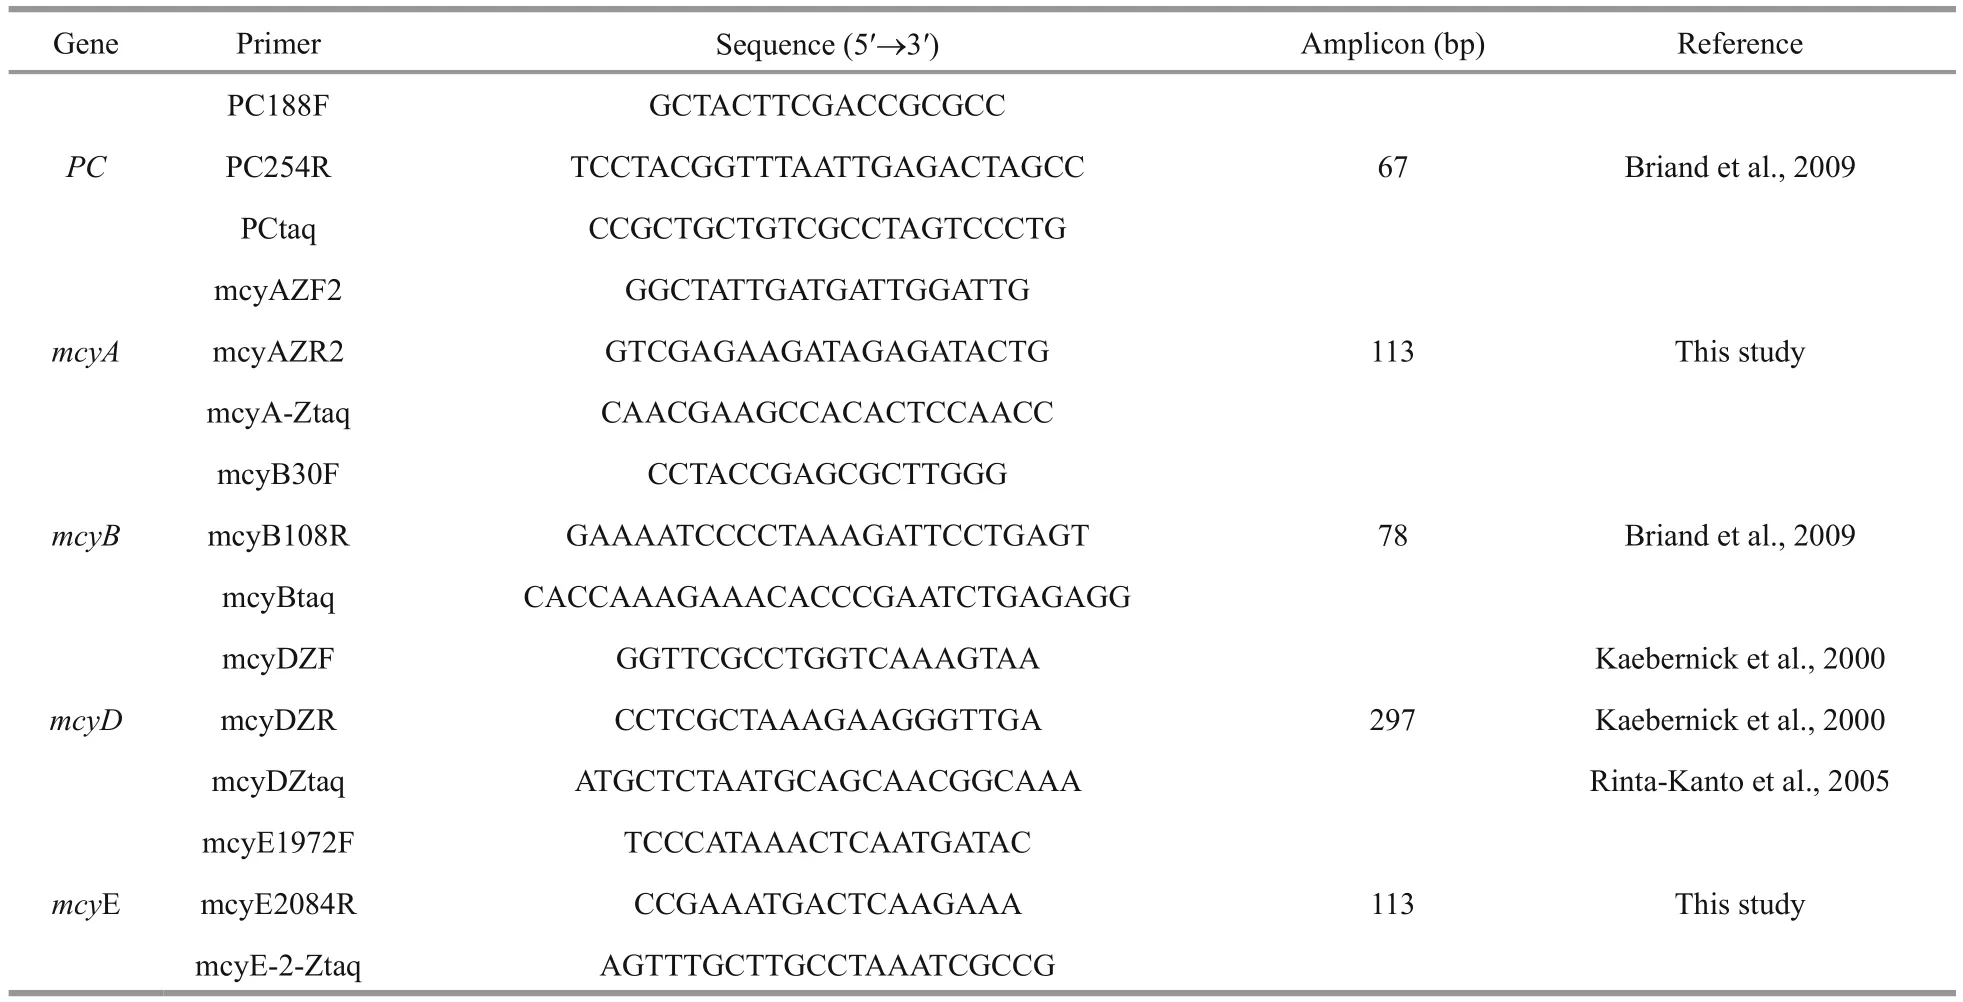
Table 2 Primer and probe sequences
2.5 Standard curve preparation
Microcystis aeruginosa PCC7806 was used as the standard strain for the quanti fication of both total Microcystis and MC-producing Microcystis. The standard curve was established by correlating known DNA concentrations (in cell equivalents) with the threshold cycle (CT) values of diluted samples(Furukawa, 2006). Ten milliliter of culture of strain PCC7806 containing 3.4×10⁷cells/mL (determined by a direct microscopic count) were filtered through a 0.22-μm nominal pore-size Nuclepore Track-Etch Membrane. A series of 10-fold dilutions (ranging from 3.4×10⁶cells to 3.4 cells) of the PCC7806 DNA template standard solution was used as the external standard for the qPCR. CT calculations were completed automatically for each qPCR assay using iQ5 software (version 3.0; Bio-Rad, Hercules, CA)and the maximum correlation coefficient approach. In this approach, the threshold is automatically determined to obtain the highest possible correlation coefficient ( R2) for the standard curve.
2.6 Multiplex quantitative PCR
The cell concentration of MC-producing Microcystis in the mixed samples was determined using qPCR via one gene of the mcy gene cluster( mcyA, mcyB, mcyD or mcy E) and the total cell concentration, including non-MC-producing Microcystis and MC-producing Microcystis, was determined via the intergenic spacer region within the phycocyanin ( PC) operon.
PCR reactions were performed in 20-μL volumes in 96-well plates (Bio-Rad) in a Bio-Rad cycler equipped with the iQ5 real-time fluorescence detection system and software (version 3.0). The multiplex reaction mix contained 10 μL of 2× i Taq Universal Probes Supermix (Bio-Rad), 1 μL bovine serum albumin (3 mg/mL; Sigma), 2 μL of DNA, plus variable concentrations of primers and probes(Table 3), made up to 20 μL with double-distilled H2O. The qPCR program was initiated with a 5-min hold at 95°C, followed by 40 cycles each consisting of a denaturing step at 95°C for 15 s, an annealing step at a temperature depending on the mcy gene(Table 3) for 1 min, and an elongation step at 72°C for 30 s. Triplicate Taq nuclease assays were performed to quantify the gene copies for each sample. Three negative controls without DNA were included in each qPCR run.

Table 3 Concentrations of different components in the multiplex qPCR
2.7 Field samples
Dianchi Lake and Guanqiao Pond were chosen for sample evaluation by qPCR with the four mcy genes.Dianchi Lake is the largest lake in Yunnan Province and the sixth largest freshwater lake in China, and has suffered severe Microcystis blooms for more than two decades (Liu et al., 2006; Wu et al., 2016; Zhou et al.,2016). Water samples were collected in October 2016 at sites #5 (24°55′31.9″N, 102°42′26.2″E) and #9(24°51′46″N, 102°41′20″E). Samples were collected from Guanqiao Pond (30°31′12″N, 114°23′24″E) in Wuhan City, China, in May 2017.
3 RESULT
3.1 Development of and optimization of toxic Microcystis assay by ampli fication of PC and mcyA
The mcyA amplicon (113 bp) had optimal ampli fication efficiency when the melting temperature(TM) was 62°C in optimization by qPCR with SYBR.Before the multiplex qPCR, singleplex qPCR was used to test and validate the ampli fication efficiency of the qPCR with a TaqMan probe. We set up a series of concentrations of primers and probes for the PC and mcyA to determine the optimal concentrations(Table 3).
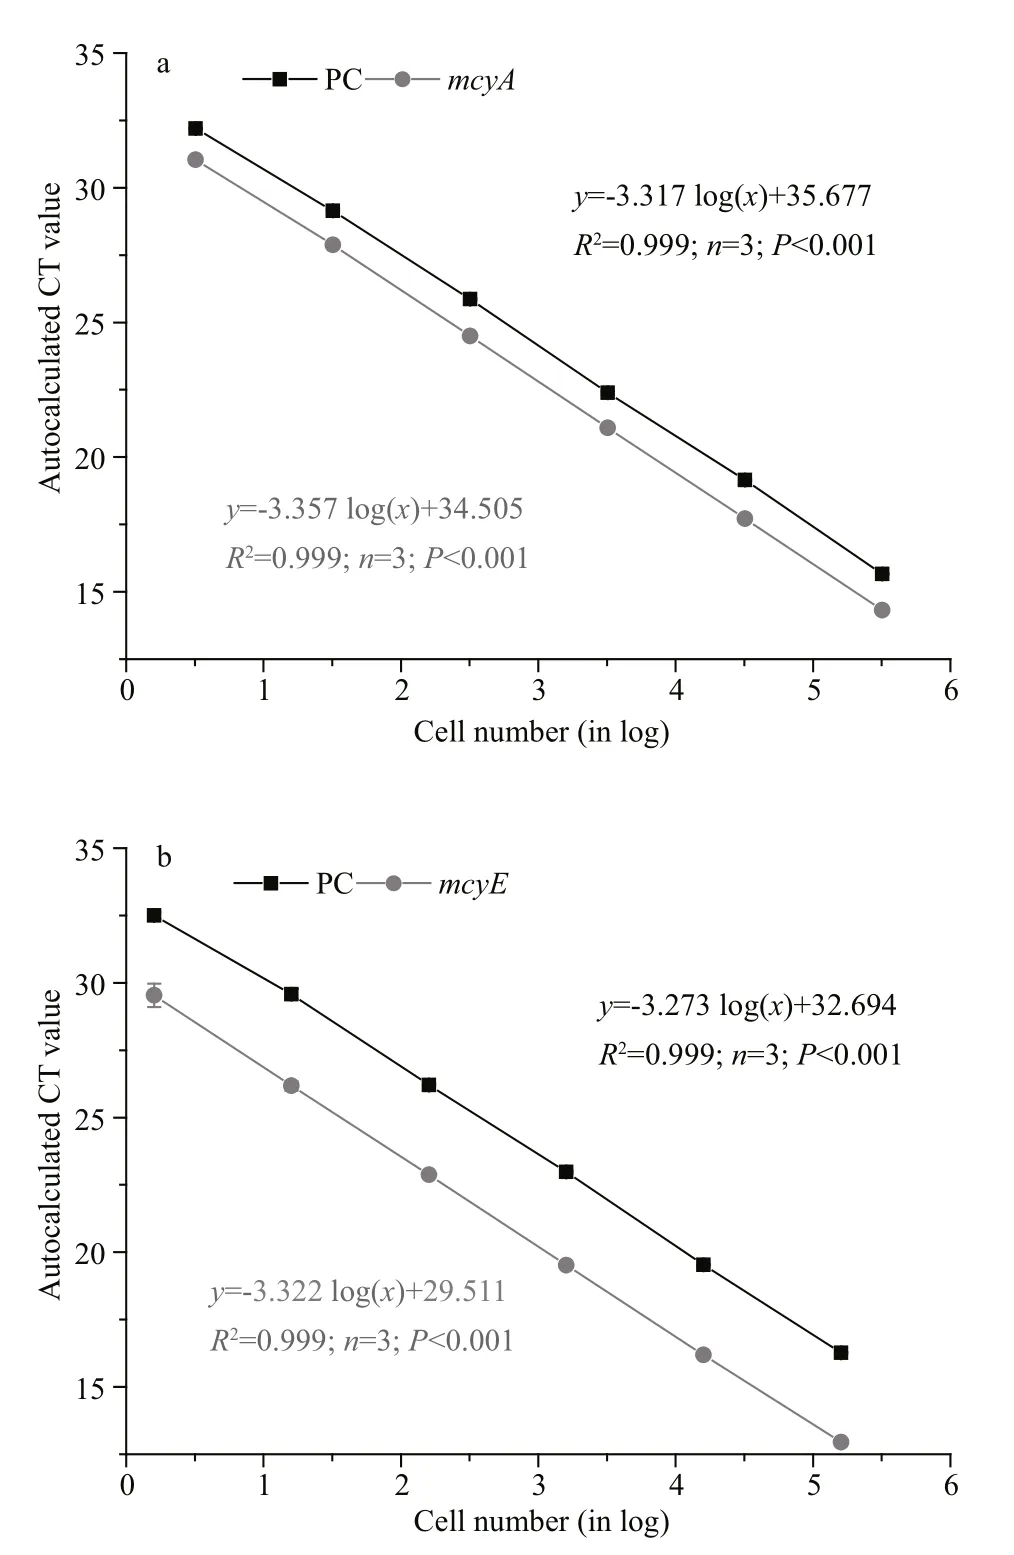
Fig.1 Standard curves for phycocyanin ( PC black squares)and mcy genes ((a) for mcyA and (b) for mcyE, gray circles)
For both the PC and mcyA in the multiplex qPCR,highly signi ficant linear curves between the amount of starting DNA (in cell numbers) and the CT were obtained (Fig.1a). For the PC and mcyA, the regression equations were y=-3.367 log( x)+34.505 ( R2=0.999,n=3, P <0.001) and y=-3.317 log( x)+35.677 ( R2=0.999,n=3, P <0.001), respectively, where x is the amount of starting DNA (given as log10cell number equivalents),and y is the CT at the autocalculated fluorescence threshold (Fig.1a). And the ampli fication efficiency we got were 100.2% for PC and 98.6% for mcyA. The detection limit for both genes was less than 1 cell/mL or 300 cell/L.
3.2 Development of and optimization of toxic Microcystis assay by ampli fication of PC and mcyE
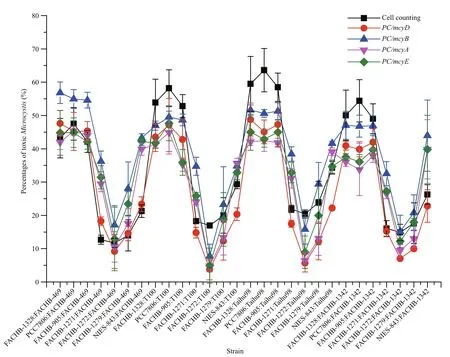
Fig.2 Trends in the percentages of MC-producing Microcystis in 28 combinational samples determined by cell counting and by quanti fication of different mcy genes with multiplex qPCR
The mcyE amplicon was also 113 bp, but had an optimal TM of 59°C. Development of the assay using mcyE was similar to that for mcyA, which is described in detail in Section 3.1. The concentrations of the different components are listed in Table 3. The regression equations for PC and mcyE were y=-3.273 log( x)+32.694 ( R2=0.99, n=3, P <0.001) and y=-3.322 log( x)+29.511 ( R2=0.99, n=3, P <0.001), respectively(Fig.1b). In the same way, the ampli fication efficiency we got were 102.1% for PC and 100.0% for mcyE.
3.3 Comparison of assays of toxic Microcystis levels using four mcy genes
We had 28 combinational samples. These samples yielded 140 datasets: each combinational sample produced cell counting data and qPCR data for four mcy genes ( mcyA, mcyB, mcyD and mcyE). During the samples measurement, the amplicon efficiency for all PCR runs ranged from 95% to 102% (data not shown). The five quantitation methods showed the same trends for the percentage of toxic Microcystis in the 28 combinational samples (Fig.2), thus similar results are obtained by employing different mcy genes, even though there were differences in values between the methos.
In the four sets of quantitative results obtained by qPCR, the amounts of toxic Microcystis varied markedly. Whichever mcy gene was employed, some ratios were lower than that obtained by cell counting,while some ratios were higher. Compared with other mcy genes, mcyA and mcyE always had similar ratios,and the mcyD results were mostly lower (Fig.3a–d).Interestingly, it was clear that the ratios determined using mcyB were higher than those by the other mcy genes in all 28 samples (Fig.3a–d), which indicated that qPCR with mcyB might overestimate the percentage of toxic Microcystis.
3.4 Effect of different Microcystis strains on the measured amount of toxic Microcystis strains
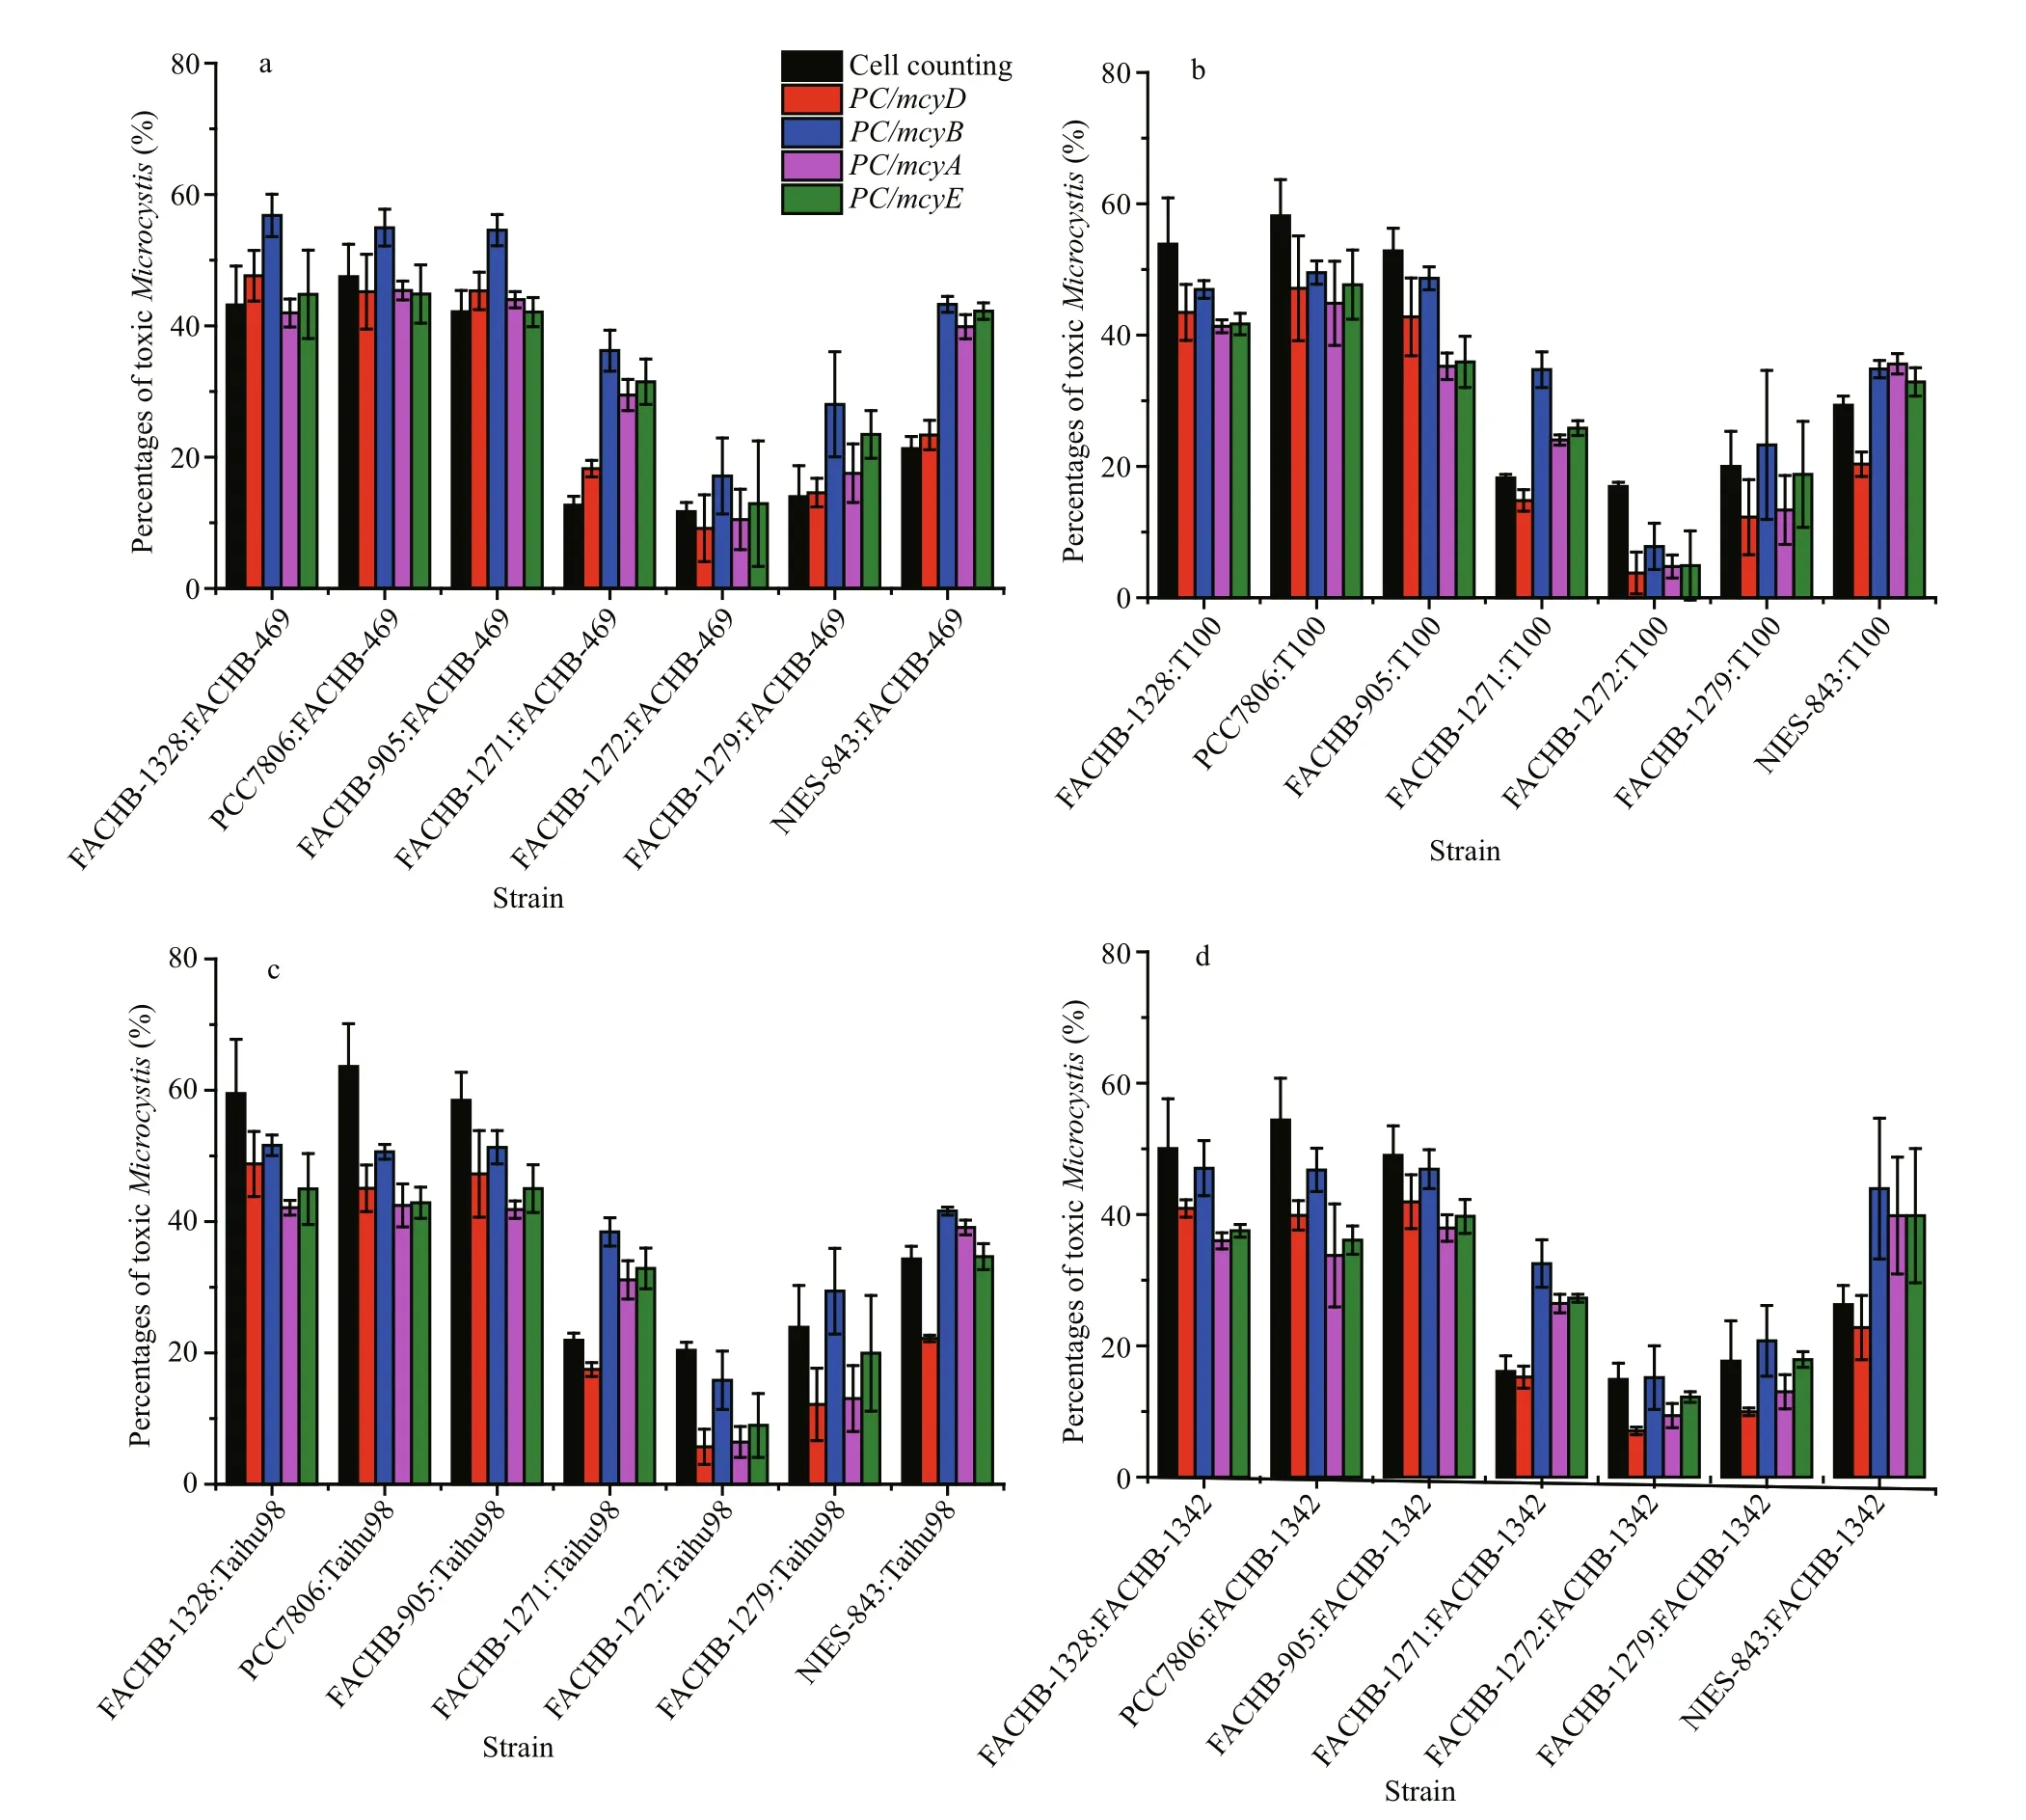
Fig.3 Comparison of percentages of toxic Microcystis measured by cell counting and with four mcy genes by qPCR
We used seven toxic Microcystis and four nontoxic Microcystis strains in our experiments. One of our goals was to determine whether the presence of various toxic Microcystis or non-toxic Microcystis might in fluence qPCR quantitation using mcy genes.We used R to analyze the 140 datasets by hierarchical clustering with Euclidean distance through the single linkage method. There were two branches and four groups: group (1) was strains FACHB-1328, PCC7806 and FACHB-905; group (2) was FACHB-1272 and FACHB-1279; group (3) was FACHB-1271; and group (4) was NIES-843 (Fig.4). All these strains were MC-producers. The 28 samples were therefore divided into groups by the presence of toxic Microcystis strains rather than non-toxic Microcystis,which suggested the measured amount was mainly determined by toxic Microcystis.
3.5 Assessment of the four mcy genes
From the heatmap, we found that mcyD produced the closest result to cell counting, followed by mcyB,mcyA and then mcyE (Fig.4). Euclidean distance hypothesizes that each factor has the same effect on a variable. Obviously, however, the different strains had disparate weights. To evaluate the four mcy genes,we eliminated the effect of strains. Principal component analysis (PCA) by SPSS software (PASW statistics 18.0) was adopted to deal with dimension reduction. We extracted three components by the extraction method with PCA and rotation method with varimax with Kaiser normalization (Table 4),and computed comprehensive marking indexes of the four mcy genes with weight by rotated variance contribution ratio (Table 5). PCA suggested that mcyD was the optimal mcy gene, followed by mcyB and mcyE, and mcyA was the worst.
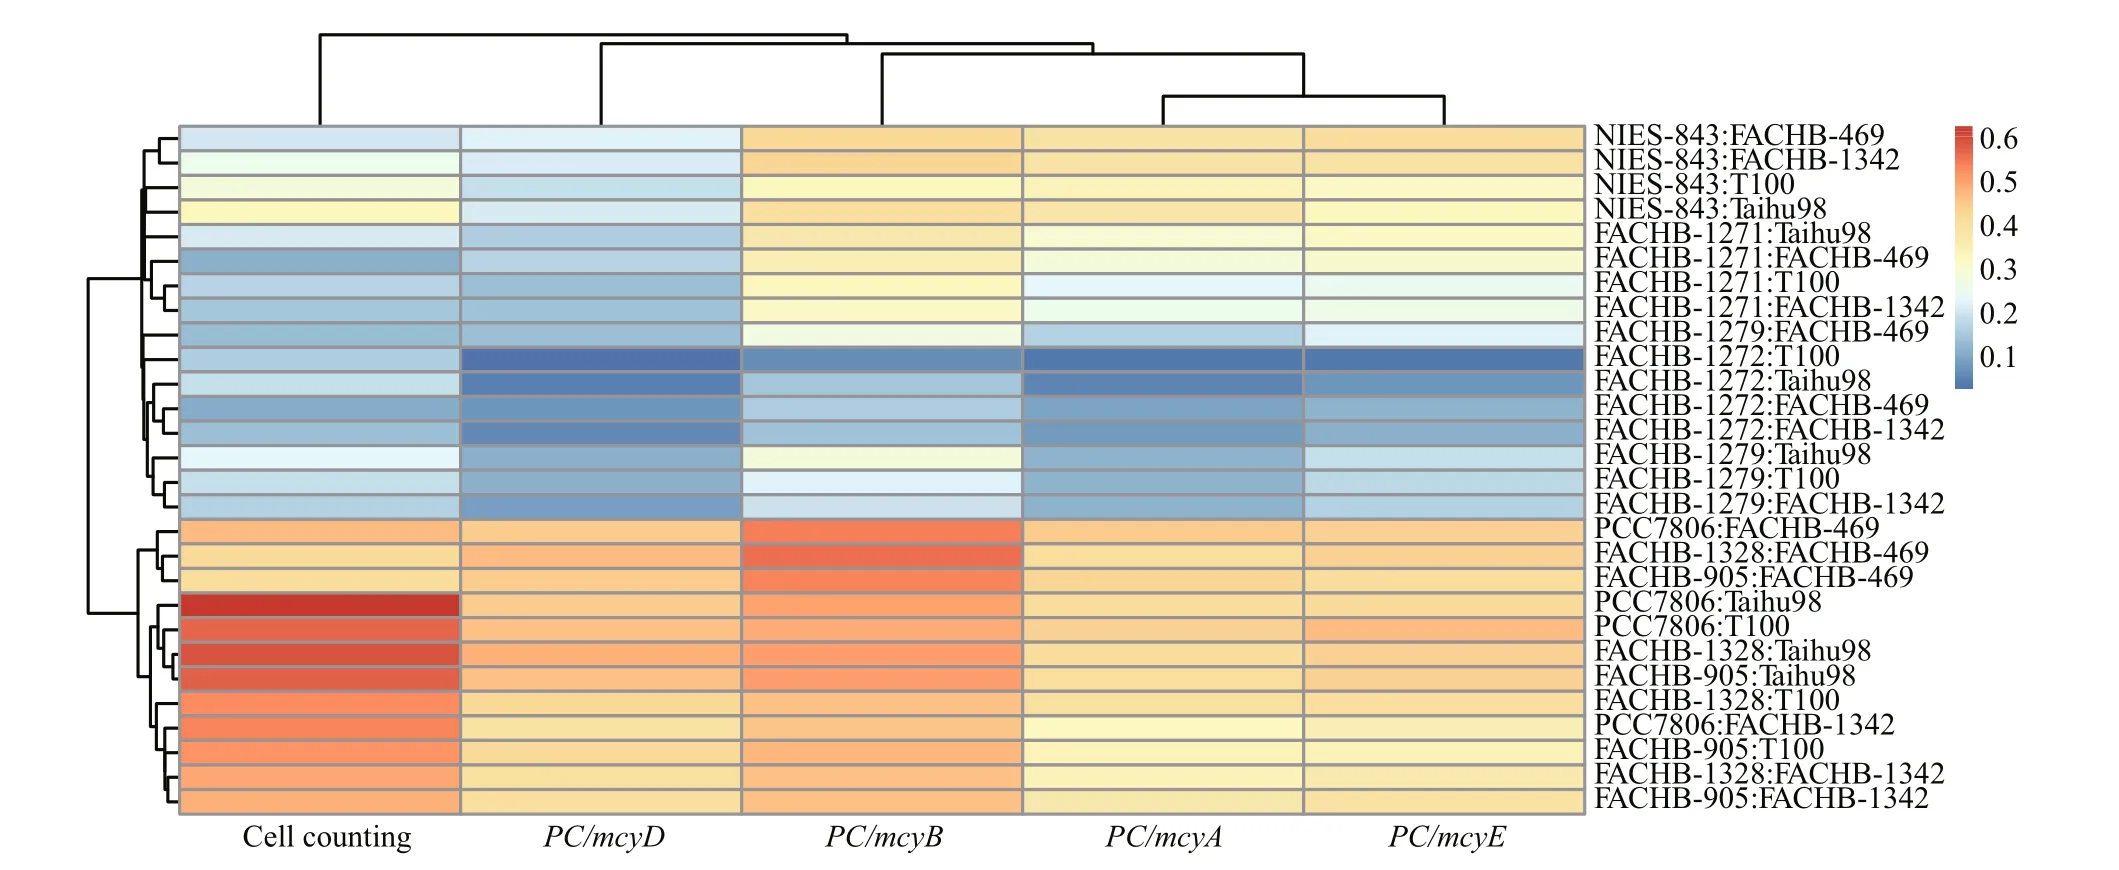
Fig.4 Heatmap by hierarchical clustering with Euclidean distance through the single linkage method to analyze the correlation of the measured MC-producing Microcystis ratio with different Microcystis strains and different quantitative methods

Table 4 Total variance in principal component analysis with Euclidean distance to 28 combinational samples
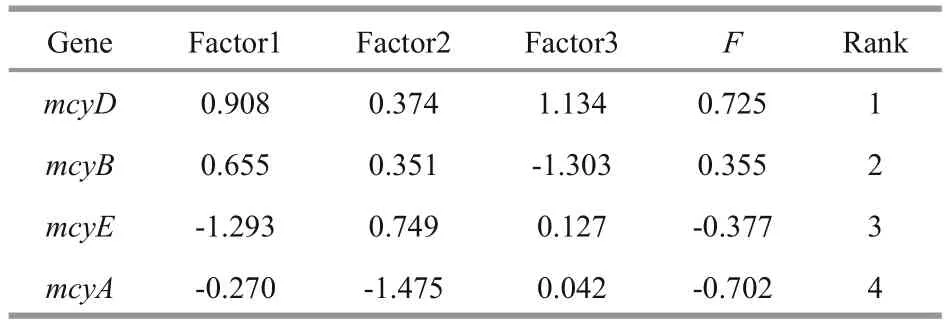
Table 5 Comprehensive marking index of four mcy genes with weight by rotated variance contribution ratio
3.6 Assessment of field samples by qPCR
Dianchi Lake suffered a Microcystis bloom in October, and Guanqiao Pond in May. Microscopic examination indicated that all three sampling sites had high Microcystis biomass, and these were mainly M. viridis and M. wesenbergii at sites #5 and #9 in Dianchi Lake, and M. aeruginosa and M. botrys in Guanqiao Pond. qPCR for the four mcy genes shown higher levels of mcyB than the other mcy genes at the three sites (Fig.5), which was similar to the results from laboratory samples (Fig.2). For all three sites,mcyD indicated the lowest ratio of toxic Microcystis among the four mcy genes (Fig.5).
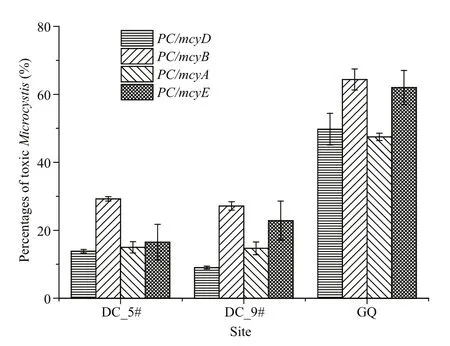
Fig.5 The percentages of MC-producing Microcystis at Dianchi Lake sites #5 and #9 and Guanqiao Pond by multiplex qPCR using different mcy genes
4 DISCUSSION
4.1 Quanti fication of toxic Microcystis
Dynamics of MC-producing Microcystis have long been a key point attracting the attention of ecologists.In the early stage, researchers mainly employed 16S rRNA genes to quantify harmful cyanobacteria.Neilan et al. (1995) developed primers to amplify the PC-IGS to distinguish different toxic harmful cyanobacteria, and since then researchers have tried to use the PC-IGS to quantify Microcystis. The quanti fication of cells via qPCR is based on the assumption that the cell carries a single copy of the chosen gene. However, sequencing efforts have revealed that Microcystis aeruginosa may contain two copies of the 16S rRNA gene (Kaneko et al.,2007; Oh et al., 2013). Therefor the PC gene has been increasingly used instead of the 16S rRNA gene.Several papers showed that the number of toxigenic Microcystis quanti fied by mcy genes exceeded the number of total Microcystis quanti fied by 16S rRNA genes in field samples, which was theoretically impossible (Rinta-Kanto et al., 2005; Ha et al., 2009;Conradie and Barnard, 2012; Beversdorf et al., 2015).In the present study, the hierarchical clustering results showed that the percentage of toxic Microcystis determined was mainly dependent on the type of toxic strain present (Fig.4). The quanti fication of Microcystis via the PC gene was not affected by whether the strain was toxic or non-toxic, which veri fied that the PC gene is more appropriate. Studies and genomic sequences suggest that M. aeruginosa likely carries only one copy of the mcy genes(Kaebernick et al., 2002; Kaneko et al., 2007; Zhao et al., in press). Many efforts have been made to use the ratio between mcy gene copy numbers and PC copy numbers for quanti fication of the percentages of toxic Microcystis in competition experiments or field samples, and to find how that ratio correlates with MC concentrations, and even environmental parameters,to provide a tool for early prediction of toxic Microcystis blooms (Ha et al., 2009; Otten et al.,2012; Zhu et al., 2014; Hu et al., 2016b; Liu et al.,2016).
So far, the majority of researchers have adopted singleplex qPCR to quantify the abundance of toxic Microcystis. Briand et al. (2008) first introduced multiplex qPCR to measure the ratio of MC-producing Planktothrix via mcyA and PC, then the same method was employed to quantify the ratio of toxic Microcystis via mcyB and PC (Briand et al., 2009). Multiplex qPCR would halve labor and time (one sample for one PCR run, rather than two PCR runs), and with the development of chemical synthesis technology, the price of probes has substantially decreased, while most of the components of qPCR mix (dNTPs, DNA polymerase, Mg2+, buffer and so on) have not changed markedly in price. For example, using probes synthesized by BGI, multiplex TaqMan qPCR might save one-half and one-third of the cost compared to singleplex TaqMan qPCR and the SYBR method,respectively. Compared to the traditional SYBR method, TaqMan qPCR has better speci ficity and higher amplicon efficiency.
We developed multiplex qPCR for mcyA and mcyE by newly designing probes and primers. The gene mcyA encodes an NRPS of 315 717 Da, containing two adenylation and thiolation domains, a condensation domain, an N-methyltransferase domain, and an epimerization domain (Tillett et al.,2000). The primers designed in this study for mcyA ampli fied a fragment between bp 4 125 and 4 323,corresponding to a peptide sequence in the condensation domain. The gene mcyE encodes a polypeptide product of mixed polypeptide synthase(PKS) and NRPS function. The amino-terminal region of McyE contains a PKS module consisting of KS, acyltransferase, and ACP domains, linked to a CM domain and a putative aminotransferase domain(Tillett et al., 2000). The nucleotide amplicon of mcyE designed in this study corresponded to a peptide sequence located in the PKS acyltransferase domain.The standard curves show that both had good amplicon efficiency (98.56% for mcyA and 99.99%for mcyE) and linear correlation (Fig.1). We thus provide alternative methods for researchers to measure MC-producing Microcystis.
4.2 The optimal mcy gene for quanti fication
The genetic locus responsible for MC biosynthesis has been identi fied and sequenced, is composed of 10 bidirectionally transcribed open reading frames arranged in two putative operons ( mcyA- C and mcyDJ) in M. aeruginosa, and encodes peptide synthetases and polyketide synthases (Nishizawa et al., 1999,2000; Tillett et al., 2000). Based on these sequences,various DNA probes and primers have been designed and used to discriminate between MC-producing and non-MC-producing genotypes by hybridization and PCR, respectively (Nishizawa et al., 2000; Tillett et al., 2001; Hisbergues et al., 2003; Mikalsen et al.,2003). Later, a variety of qPCRs were developed to measure the MC-producing cyanobacterial abundance via different mcy genes.
In reported studies, five mcy genes have been used to measure the abundance of toxic Microcystis, and there is uncertainty how to compare results from the different mcy genes and which mcy gene(s) might be most suitable. In our previous work, we have noticed that the same samples got the results with huge differences when quanti fied by mcyB and mcyD respectively (data not shown). Here we used two newly-collected samples from Dianchi Lake and one sample from Guanqiao Pond. The results from these field samples showed, as expected, that the ratio of toxic Microcystis calculated by mcyB abundance was higher than those calculated by mcyD abundance and the other two mcy genes abundances measured in this work (Fig.5), which matched laboratory experiments(Fig.3). At first, we thought that this phenomenon might be due to variability of mcyB, as Mikalsen et al.(2003) proposed that different toxic strains containing the B or C type of the mcyB1 module (the adenylation domain in the first module of mcyB) were capable of producing different MCs, and recombination between imperfect repeats, gene loss, and horizontal gene transfer can explain the distribution and variation within the mcyABC operon. However, this might not be the case, because Mikalsen et al. also found that sequencing of the region from 135 bp to 676 bp of mcyAB (a region from part of the mcyA epimerization domain to mcyB1) revealed few differences, and only 11 point mutations were found in this 500-bp region.The primer pair we used for mcyB (30 F and 108 R,from Briand et al., 2009) ampli fied from this conserved region. We think that the ratio of toxic Microcystis determined by mcyB abundance is higher in both laboratory and field samples, which is not caused by variability of mcyB, but might result from sequence characteristics of the mcyB amplicon, which might be more easily ampli fied in a competitive PCR system.
To our knowledge there have been no studies reporting the accuracy issue on quanti fication of toxic Microcystis by different mcy genes measured in field or laboratory samples. PCA for our laboratory samples showed that mcyD was the most suitable mcy gene,rather than mcyA or mcyE (Table 5). This result generally matched the hierarchical clustering result(Fig.4), which indicated that the observed variation is characterized by abstract factors. We concluded that variation was induced by the presence of different toxic strains and mcyD was most appropriate for quanti fication of toxic Microcystis. Beversdor et al.(2015) held the view that mcyA and mcyE gene abundances were not appropriate indicators of MC concentrations in the environment, which, to some extent, matched our laboratory results. When we analyzed field samples, mcyD gave almost the lowest ratios of toxic Microcystis, which revealed that mcyD abundance might be closest to the actual toxic Microcystis level. Rantala et al. (2004) suggested that the microcystin synthetase genes were originally present and that non-MC-producing strains of Microcystis had lost the ability to produce microcystins. It is known that cyanobacteria can contain target mcy genes of interest, and therefore yield a positive result in PCR-based assays, but not produce toxin because of the absence of one or more of the required mcy genes via gene deletion,recombination, or transformation, or due to gene disruption and inactivation by transposons or phage(Beversdorf et al., 2015). In field samples, it is not possible to assess the real ratios, so we cannot determine which mcy gene abundance was closest to the actual portion of MC-producing Microcystis. We conclude that mcyD is most suitable for laboratory samples, and anticipate that it can be used in the field.
From hierarchical clustering results, we found that the difference of determined ratio of toxic- Microcystis mainly depended on the type of MC-producing strain present (Fig.4), which showed that the ratio was decided by MC-producing Microcystis, and we presumed that the mcy gene abundances could re flect the ratio of MC-producing Microcystis. However,some papers, such as Baxa et al., found MC concentrations did not correspond to the frequency of toxic Microcystis cell equivalents in their study(although some studies have shown positive correlations), and Conradie and Barnard (2012),Rinta-Kanto et al. (2009) and Te and Gin (2011) also found the same result as Baxa et al. (2010), but they preferred to consider that MC concentrations correlated roughly with the biovolume of Microcystis,while the relationship between the relative abundance of potentially toxic genotypes and MC concentrations was less prominent. These studies employed 16S rRNA to measure the total Microcystis (or cyanobacteria), and showed that MC concentrations showed strong positive correlation with the abundance of Microcystis 16S rRNA genes as well as mcy genes since they employed copy abundance. We consider that the weak correlation between MC concentrations and the abundance of MC-producing Microcystis can partly explained by 16S rRNA not being appropriate for quanti fication of total Microcystis, as discussed above, and besides, qPCR of DNA provides little information about the levels at which that gene is being expressed and whether, or how much of, the toxin is being produced (Beversdorf et al., 2015).
5 CONCLUSION
We combined seven MC-producing Microcystis strains and four non-MC-producing Microcystis strains, and compared quanti fication differences of toxic and non-toxic Microcystis by traditional cell counting and the qPCR method with different mcy genes. We developed multiplex qPCRs with mcyA and mcyE to determine the ratio of MC-producing Microcystis. Our data showed that the different mcy genes could all be used to determine the abundance of MC-producing Microcystis. We found mcyD was most suitable to quantify MC-producing Microcystis,and suggested the ratio calculated using mcyB would overestimate the MC-producing Microcystis abundance, a finding supported using field samples.
 Journal of Oceanology and Limnology2018年4期
- Journal of Oceanology and Limnology的其它文章
- Editorial Statement
- Effects of seawater acidi fication on the early development of sea urchin Glyptocidaris crenularis*
- Dietary effects of A zolla pinnata combined with exogenous digestive enzyme (Digestin?) on growth and nutrients utilization of freshwater prawn, Macrobrachium rosenbergii(de Man 1879)
- Preliminarily study on the maximum handling size, prey size and species selectivity of growth hormone transgenic and non-transgenic common carp Cyprinus carpio when foraging on gastropods*
- Hydrodynamic characteristics of the double-winged otter board in the deep waters of the Mauritanian Sea*
- De novo transcriptome sequencing reveals candidate genes involved in orange shell coloration of bay scallop Argopecten irradians*