
Agricultural Exports Competitiveness of Pakistan in Global Market
2018-06-14 08:37:44MajidLateefTongGuangjiMuhammadUsmanRiazMazhirNadeemIshaqMuhammadAbdullahandZeeshanAhmad
Majid Lateef, Tong Guang-ji*, Muhammad Usman Riaz, Mazhir Nadeem Ishaq, Muhammad Abdullah, and Zeeshan Ahmad
1 College of Economics and Management, Northeast Forestry University, Harbin 150040, China
2 School of Management, Harbin University of Science and Technology, Harbin 150080, China
3 College of Economics and Management, Northeast Agricultural University, Harbin 150030, China
4 Department of Business Administration, University of Sargodha, Lyallpur Campus, Faisalabad 38000, Pakistan
5 Department of Business Administration, Air University Multan Campus, Multan 60000, Pakistan
Introduction
Agricultural sector has very important contribution in the economy of Pakistan in terms of providing raw materials, employment, export earnings and poverty alleviation. It has 19.8% contribution in GDP and provides employment to 42.3% labor force of Pakistan.The agriculture mix of Pakistan contains important crops (rice, cotton, wheat, maize and sugarcane), other crops (gram, barley, tobacco, lentils, etc.), livestock,forestry and fishing, it accountes for 23.55%, 11.36%,58.55%, 2.06% and 2.17% respectively to agricultural value addition. Agricultural export is major part of the export mix as only textile sector accounted for about 60% of the overall exports of Pakistan Other important agricultural exports include rice, sugar,fruit, vegetable, spice, meat and meat preparation.Government of Pakistan (GOP) is pursuing exportled growth strategy. Recently, they launched strategic trade policy framework (STPF) 2015-2018 that is focused on enhancement of annual exports, improves trade competitiveness, moves towards efficiencydriven and innovation-driven economy and increases share of Pakistan in regional trade (GOP, 2016).
Pakistan has suitable environment and climatic conditions to grow various kinds of agricultural and horticultural products. Export earnings and growth of this sector represent that it has strong competitive advantages in different agricultural products. Member countries of the World Trade Organization (WTO)need to take benefits of comparative and competitive advantages for increasing international competition and effective utilization of resources as guided in WTO's agreement on agriculture and Pakistan also needs to redesign its trade policy based on the concept of comparative advantage (Faruqee, 1995).
Rice, cotton and citrus fruits are most important agricultural products of Pakistan. It not only fulfills the domestic demand of consumers, but also plays a major role in the exports of Pakistan and helps the country to earn a considerable amount of foreign exchange every year. Cotton is an important cash crop of Pakistan. It provides essential raw materials to the textile industry for its survival and expansion.It had 1.0% share in GDP and contributed 5.1% in the agricultural value addition. As per Food and Agriculture Organization (FAO) (2016), Pakistan was the world's 4th largest producer of cotton after China, India and the USA, it was the 12th largest exporter of cotton after the USA, India, Australia,Brazil, Uzbekistan, Burkina Faso, Greece, Mali,Turkmenistan, Benin and C?′te d'Ivoire. From 2003 to 2013, Pakistan produced an average of 1.76 million tons of cotton and it contributed average 0.83% to world exports of cotton. Rice is also an important crop and the 2nd staple food of Pakistan after wheat and it accounts for 3.1% to the value added in agriculture and 0.6% to GDP. Pakistan is the world's 13th largest producer of rice after China, India, Indonesia,Bangladesh, Vietnam, Thailand, Myanmar, Philippines,Brazil, Japan, Cambodia and the USA, it is the 5th largest exporter of rice after Thailand, Vietnam, India and the USA. From 2003 to 2013, Pakistan produced an average of 7.82 million tons of rice and contributed an average of 8.88% to world exports of rice (FAO,2016).
Citrus fruits are also one of the important exports of Pakistan. As per FAO (2016), Pakistan was the world's 12th largest producer of citrus fruits after China,Spain, Turkey, Brazil, Egypt, Japan, Iran, Republic of Korea, Morocco, Italy and the USA, and it is the 5th largest exporter of citrus fruits after Spain, China,Turkey and Morocco. From 2003 to 2013, Pakistan produced an average of 0.45 million tons of citrus and contributed an average of 1.62% of world exports of citrus. Given the importance of these commodities,this study investigated the competitiveness of Pakistan in the world market among the major exporters of these commodities. It would contribute to literature by finding competitiveness of major agricultural exports of Pakistan, i.e. cotton, rice and tangerines by finding revealed competitive advantage (RCA) and revealed comparative advantage (RCA#) indicators for competitiveness.
Materials and Methods
The concept of comparative advantage is theoretically appealing. However, there were some difficulties associated with its measurement in empirical studies.Several researchers used various constructs to measure the comparative advantage as a way of explaining the export performance for specific products. For example,following the Ricardian theory of comparative advantage, Balassa (1965) developed the "Revealed Comparative Advantage" concept, which was used in many empirical analyses subsequently. In contrast,some studies also pointed out certain shortcomings in the Balassa's RCA index (Yeats, 1985; Ballanceet al.,1985).
It was argued that comparative advantage was applied to a world of efficient, well-functioning and undistorted markets, while competitive advantage was applied to a world in which distortions might exist.So, competitive advantage was considered as more applicable to the world trade (Vollrath, 1985; 1991).
Both Balassa (1965) RCA index and Vollrath (1991)RCA# index were used for measuring competitiveness for this study. Many studies used the similar indicators to find comparative and competitive advantages(Balassa, 1989; Scott and Vollrath, 1992; Hsu and Wann, 2001; Bender and Li, 2002; Hinloopen and Van,2004; Mahmood and Nishat, 2004).
Some recent studies also employed these techniques to find competitiveness of agricultural products (Akhtaret al., 2009; Hatab, 2011; Muhammadet al., 2015).
Specifications to find out RCA and RCA# as followed by Akhtaret al. (2009), Hatab (2011) and Muhammad and Nishat (2015) were as the followings:
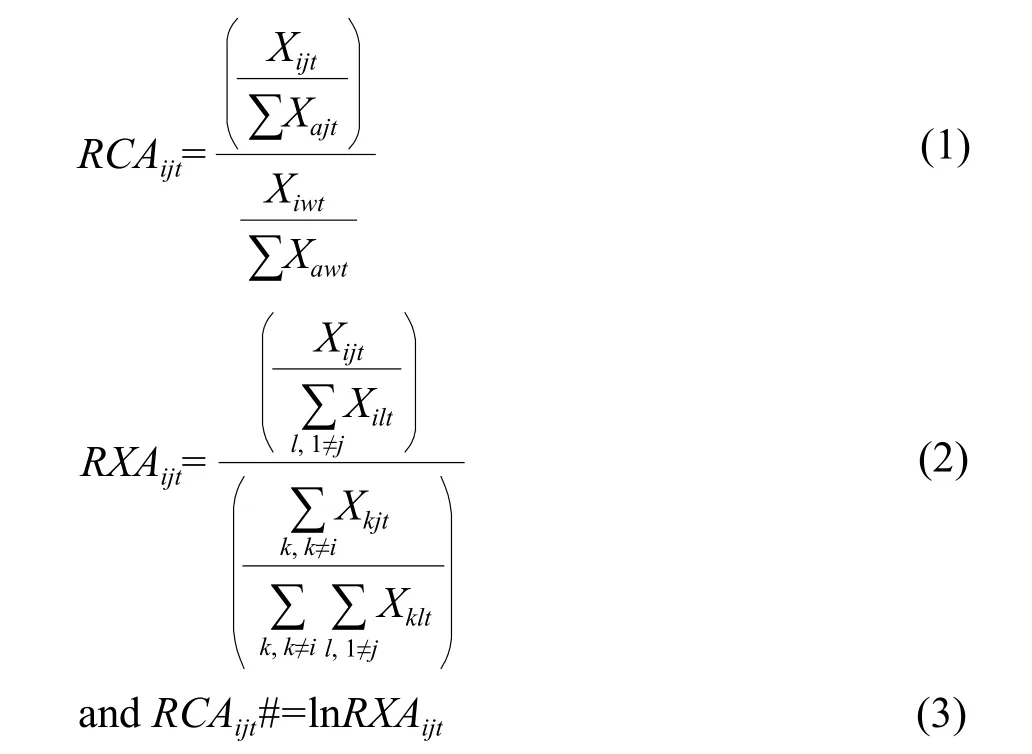
Where,RCAijtwas an index of relative comparative advantage for productiin countryjat timet,Xijtrepresented the export of productiof countryjat yeart,Xijtrepresented the export of productiby countryjat yeart,Xiwtwas the total world export of productiat yeart,∑Xajtwas the total volume of exports from a countryjat yeart, and∑Xawtwas the total volume of world exports at yeart.RCAindex revealed a comparative advantage in the export of commodityiby countryj, when the index value was greater than one and revealed a comparative disadvantage in the export of commodityiby countryj, if the index's value was less than one.
RXAijtwas an index of relative export advantage.Xijtrepresented the exports of product from a countryjat timet;epresented the total exports of countryjminus exports of productiat timerepresented the total world exports at timet, andrepresented the total world export minus export of countryjat timet.
RCAijt# represented the natural logarithm of relative export advantage index (RXAijt). If the result ofRCAijt#was in a positive value it was considered as comparative/competitive advantage and if the result ofRCAijt# was in a negative value, it was considered as comparative/competitive disadvantage.
Data
Data from 2003 to 2013 (11 years) regarding production, exports, imports and population of top 10 major exporter countries of each category were extracted from FAO statistics database. Data regarding the total world exports of selected products were collected from the World Integrated Trade Solutions (WITS) database.Per-capita consumption was calculated by adding production and imports, subtracted from exports, and then divided by population.
Results and Discussion
Cotton
Table 1 contained information about the percentage contribution of Pakistan and other world exporters of cotton in financial terms from 2003 to 2013. During the study period, Pakistan contributed more in 2012 and gradually increased its share in the world market of cotton. A mixed pattern in parentage contribution could be observed by comparing the overall share of all the years. The USA had a major contribution and its share increased from 2003 to 2008 and from 2010 to 2011, then in 2012 and 2013, there was a major decrease in its share in the global market.
It showed that the USA lost its percentage contribution of cotton exports during these years. India &Brazil had a mixed kind of trend but their contribution increased over the period of time. Turkey, China,Paraguay continued the decreasing trend in the selected sample years in cotton exports. Australia seemed in the struggling phase but from 2011 to 2013,Australia achieved its maximum share in the cotton exports. Mexico also had a mixed trend in terms of percentage contribution but slightly increased its share to the world exports throughout the study period.
Pakistan's per-capita consumption of cotton was very high during 2004 to 2008, but it was decreased after this. Although the consumption was high,RCA and RCA# indicators showed that competitiveness was greater throughout the study period as compared to the other exporters around the world and from 2010 to 2012 there was a significant increase in competitiveness. India had almost similar con-sumption throughout the study period but indicators showed that competitiveness increased because the production of cotton was increased and consumption remained the same. Turkey had greater consumption results, so the competitiveness decreased. In case of the USA, consumption decreased but the competitiveness remained almost the same for study period.
Table 2 contained the information about annual percapita cotton consumption for the selected sample,Table 3 interpreted the competitiveness indicator RCA and Table 4 defined the competitiveness indicator RCA# for 10 major cotton exporters around the world.

Table 1 Percentage contribution in world's cotton exports (in terms of Dollar value)

Table 2 Annual per-capita consumption of cotton
Vietnam increased its per-capita consumption so the competitiveness of Vietnam was almost equal to zero and it was the least competitive country in the sample mainly because its local consumption of cotton in-creased nearly 400% during the study period. It was the least competitive country because RCA was less than one. China also increased its domestic consumption of cotton and Table 3 showed that China did not remain a competitive country. Brazil had a mixed kind of consumption throughout the study period but the competitiveness increased over the years.
In case of Australia, results found that the production was greater than the consumption for most of the years. Tables 3 and 4 also showed that Australia had the 2nd best competitiveness after Paraguay and from 2010 to 2013 it had the more competitive advantage than Paraguay. Mexico gradually decreased its consumption and increased competitiveness.Paraguay was the major exporter of cotton in the overall world trade of cotton.

Table 3 Competitiveness indicators (RCA) of major cotton exporters

Table 4 Competitiveness indicators (RCA#) of major cotton exporters
From 2003 to 2009, Paraguay had the best competitive advantage but from 2010 to 2013, Australia had more competitive advantage than Paraguay, it also had competitiveness because its RCA was greater than one and RCA# was also positive throughout the study period.
Rice
Table 5 contained the information about the percentage contribution of Pakistan and other world exporters of rice in financial terms from 2003 to 2013.For the period under investigation, Pakistan contributed more in 2006 and 2010, but it did not increase its share in the world market. Pakistan decreased its share over the years under study and percentage contribution to the world market was not increased.Thailand had a major percentage contribution of rice in the overall world trade but a mixed trend over the years could also be observed and the percentage contribution decreased gradually. India also had a mixed trend for the study period, but during 2012 and 2013, the growth was exceptionally well, it was doubled in 2012 and almost tripled in 2013 as compared to 2003. The USA had a decreasing trend over the period. Vietnam had an increasing trend in the percentage contributions of the overall rice exports from 2003 to 2012. However,in 2013 there was a massive decrease in the percentage contribution as compared to the last year. Uruguay and Egypt also had a decreasing trend. Cambodia,Brazil and Argentina were in its struggling phase,but the overall share increased in the world rice exports.
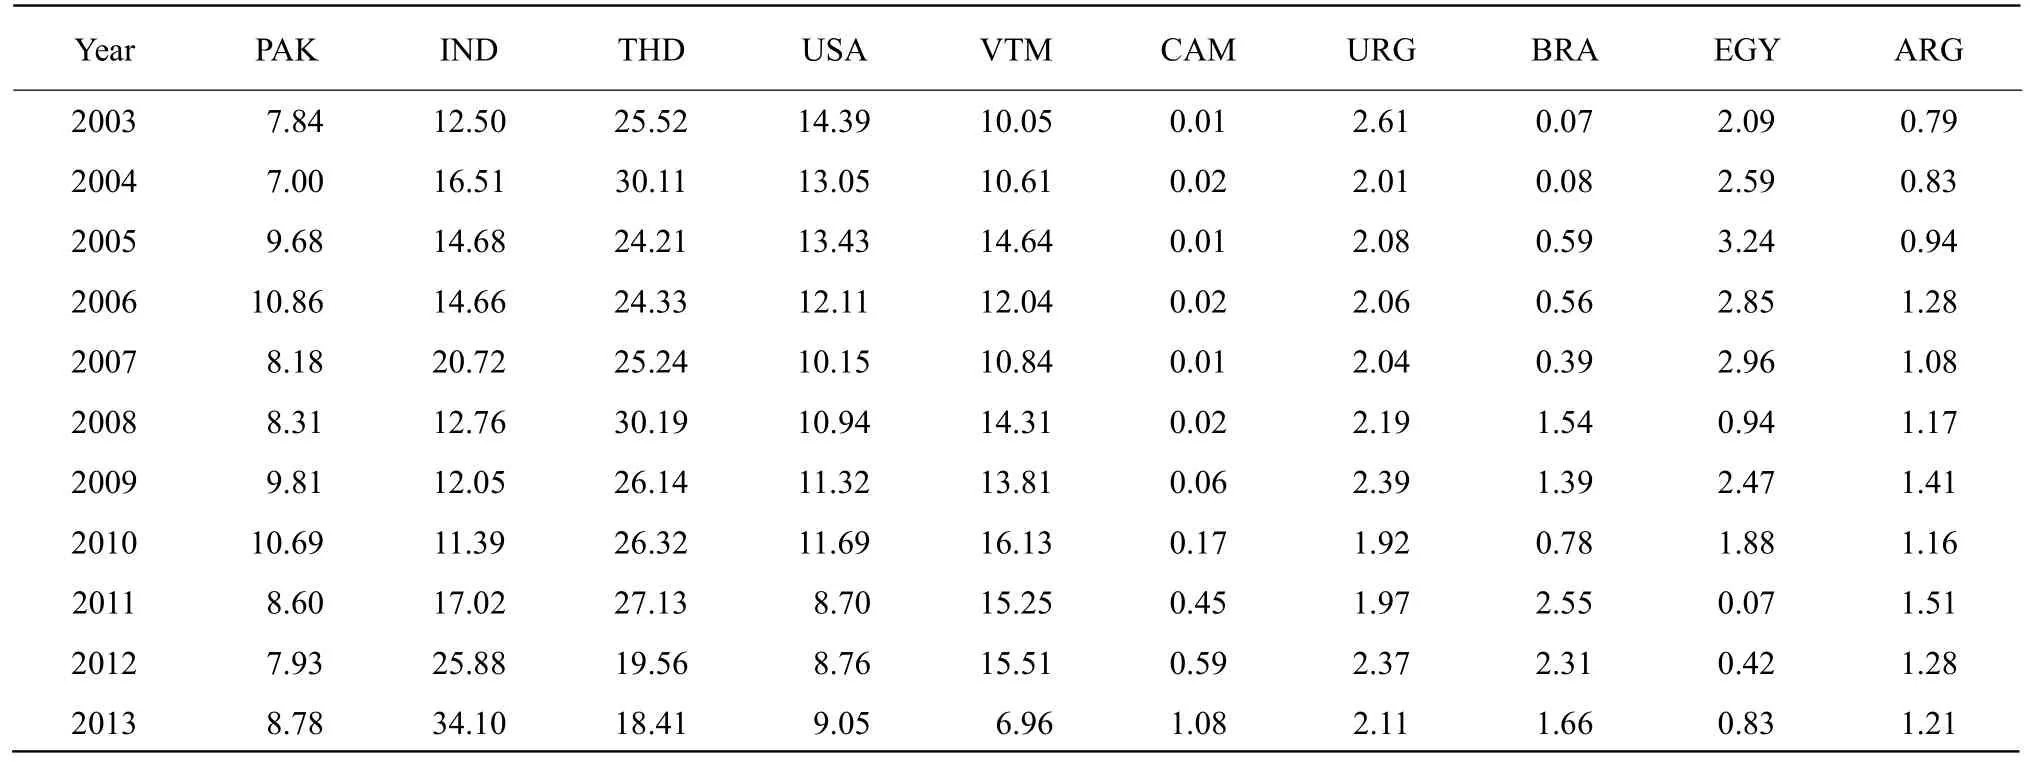
Table 5 Percentage contribution in world's rice exports (in terms of Dollar value)
Table 6 calculated the annual per-capita rice consumption of 10 major rice exporters for 11 years.According to Table 6, the per-capita rice consumption of Pakistan decreased throughout the study period except 2008 and 2009. Competitiveness indicators RCA and RCA# indicated that Pakistan's competitiveness also increased in 2008 and 2009 despite the fact that its consumption increased during this period. India had an increasing trend for consumption of rice as it was the 2nd favorite staple food and the consumption increased as the population increased.Indicators showed that competitiveness decreased in case of India except for the years 2012 and 2013 where it showed the upward trend.
Thailand had an increasing consumption pattern for the selected sample years of study. Tables 7 and 8 also confirmed that Thailand had decreased its competitiveness over the years except 2004 and 2008. The USA had a mixed consumption pattern, and it was neither increased nor decreased greatly during these 11 years. Competitiveness also showed the same results,but in general competitiveness decreased and RCA#was not competitive, because it was less than one for all the years. Vietnam and Thailand increased their consumption greatly during all the years except 2005 to 2007. Competitiveness was massively decreased in case of Vietnam especially for 2012 and 2013.Cambodia appeared as a massive rice consuming country, its consumption pattern indicated that consumption rose over the study period. Competitiveness indicators RCA and RCA# showed that Cambodia was not competitive at all from 2003 to 2009 as RCA# was negative during these years.
Table 7 explained that Cambodia had been competitive for the years from 2010 to 2013, because during these three years it greatly increased its exports.Table 8 indicated the competitiveness indicator RCA# for 10 major rice exporters around the world.Uruguay was the major exporter of rice to the world and it had a mixed kind of consumption results for the selected years of study. Although Uruguay was the great exporter of rice, its competitiveness also decreased over the years and the results showed that there was a massive decrease from 2003 to 2013.However, it was still the most competitive country for the rice exports.
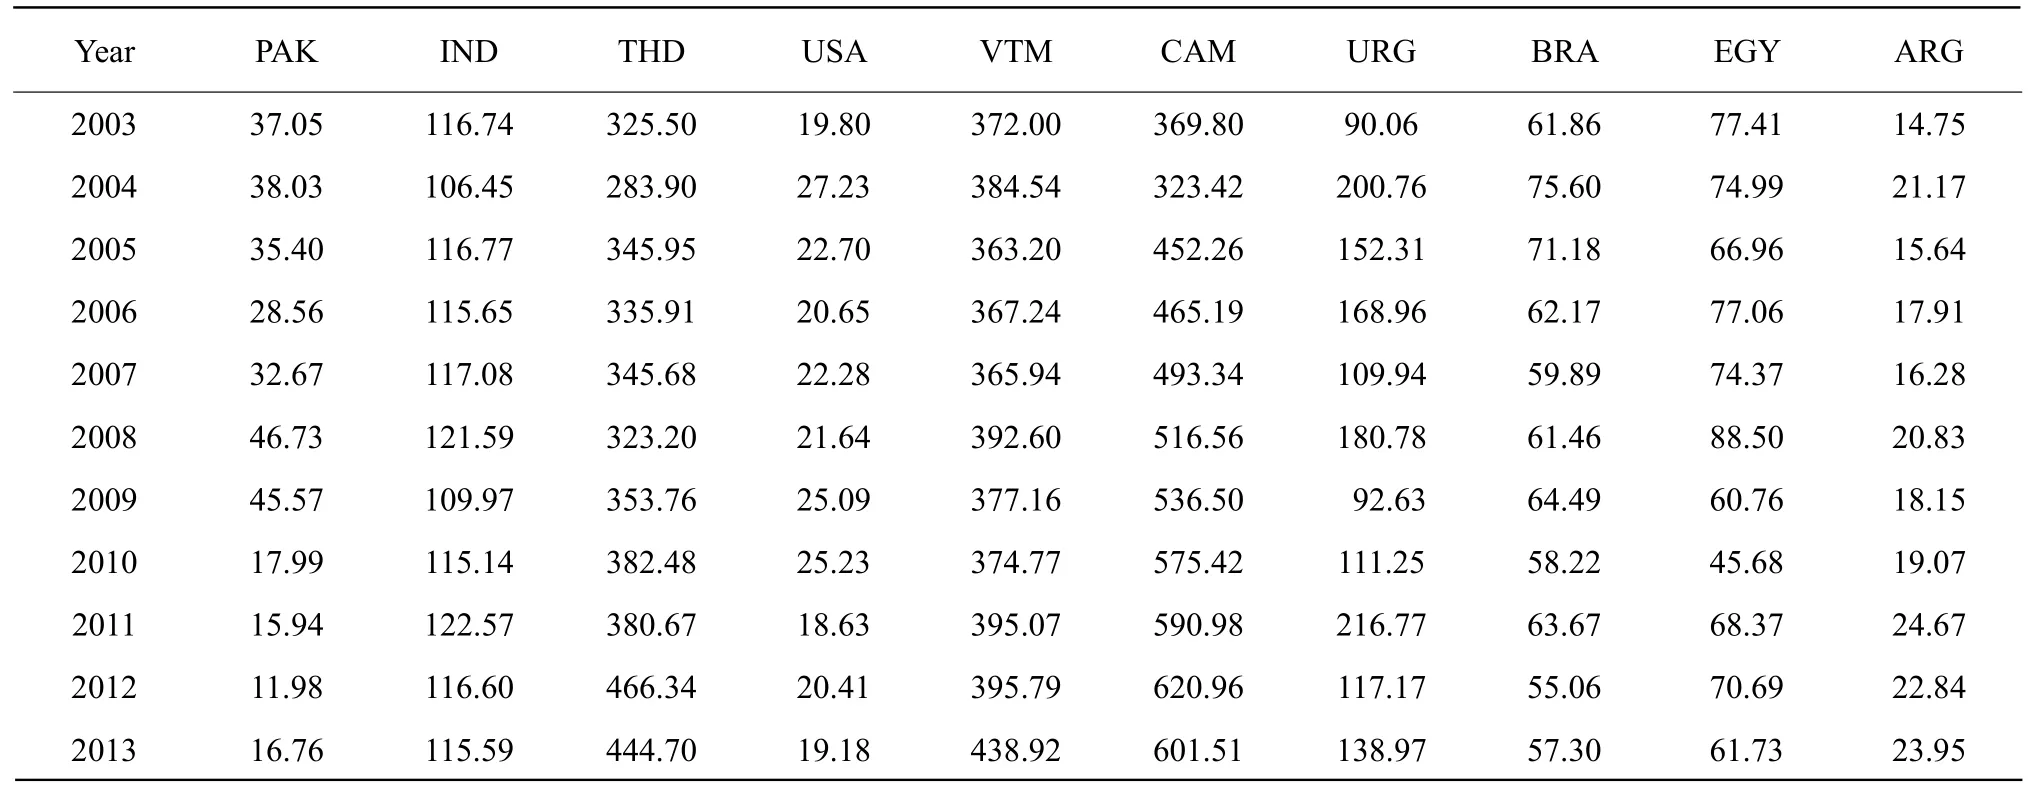
Table 6 Annual per-capita consumption of rice

Table 7 Competitiveness indicators (RCA) of major rice exporters
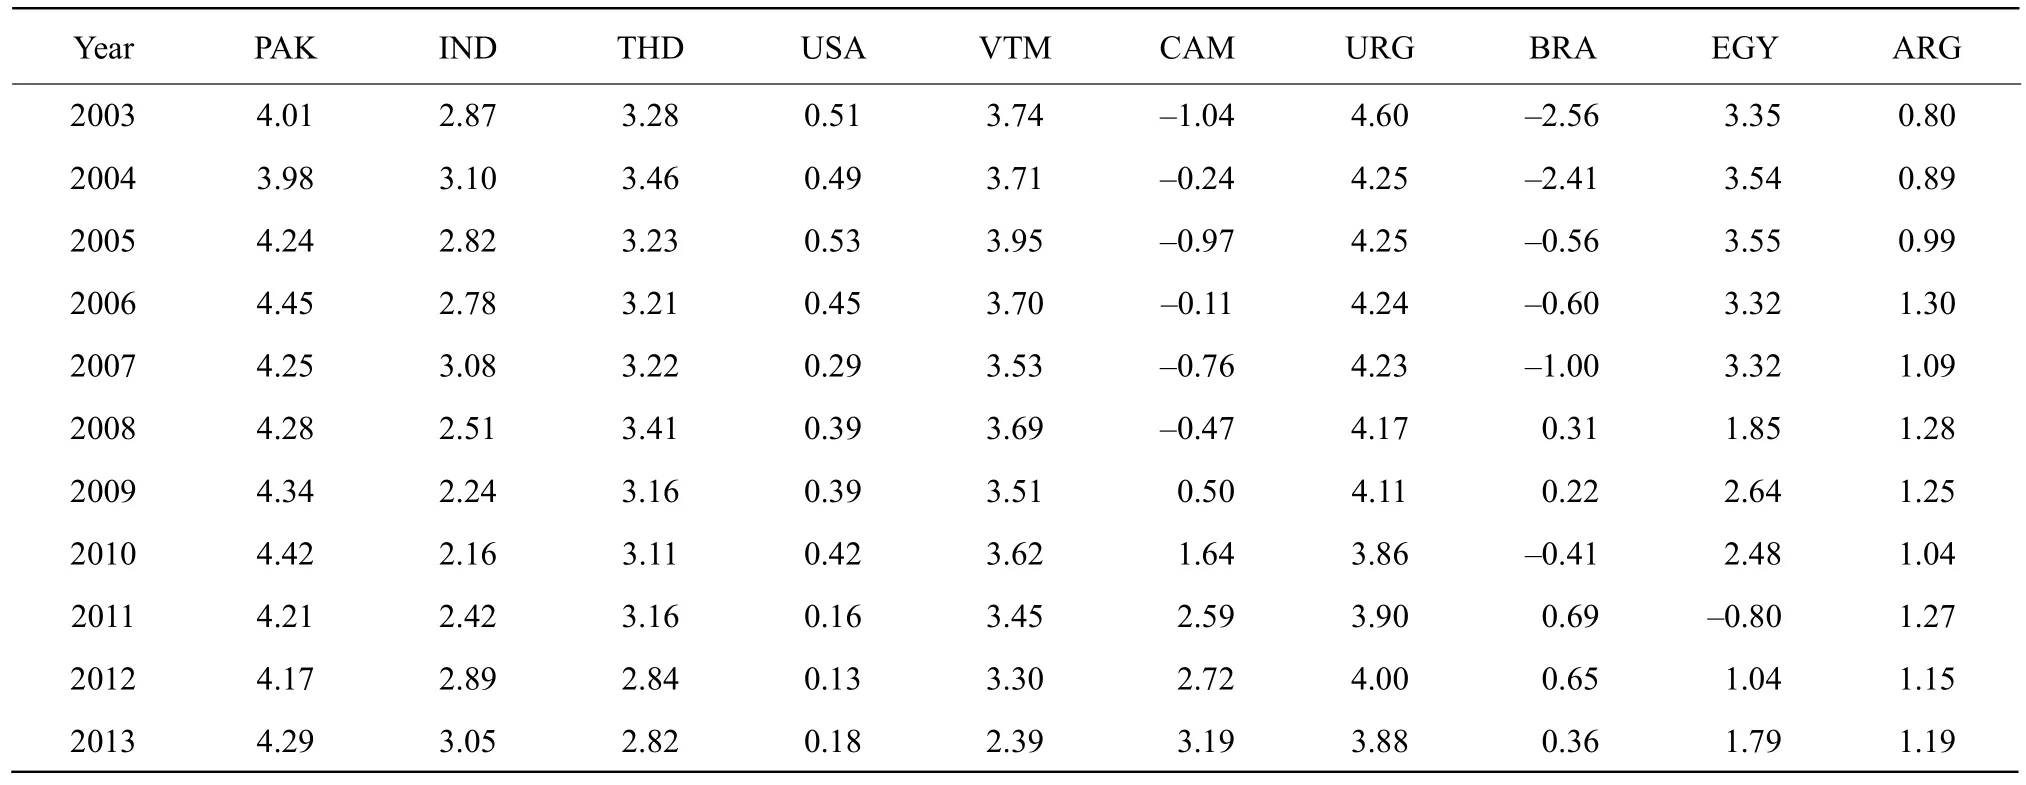
Table 8 Competitiveness indicators (RCA#) of major rice exporters
Brazil had mixed consumption results throughout the years of investigation. Competitiveness indicators RCA and RCA# also confirmed that it was not a competitive country in the overall world rice exports as RCA# was negative for most of the years. Egypt had a decreasing consumption pattern during the study period except in 2008. However, its competitiveness also had a declining trend and it was declined massively in 2008 and then from 2011 to 2013. Argentina had a mixed kind of consumption results, but its consumption increased over the years and its competitiveness also increased, but very minor level.
Tangerines
Table 9 contained the information about the percentage contribution of Pakistan and other world exporters of tangerines for our selected sample years. For the period under investigation, Pakistan's contribution was increased significantly. Pakistan contributed more in 2012 as compared to other focused years and gradually increased its share. Egypt and South Africa slightly increased its share. The USA also increased its share.Turkey significantly increased its export share. Italy also had mixed results. China had phenomenal growth during the study period and emerged as the biggest exporter in this category. Brazil had a decreasing trend.Share of Mexico remained the same over the study period. Spain had a major contribution in the overall world exports of tangerines. However, it showed a downward trend in the percentage contribution. China grabbed the market so quickly and took the advantage to become a major exporter to the world in the category of tangerines.
Table 10 represented the annual per-capita tangerine consumption for 10 big tangerine exporters for the period of 11 years. Table 11 showed the competitiveness indicator RCA and Table 12 indicated the competitiveness indicator RCA# for the selected exporters around the world. Pakistan's per-capita consumption of tangerines decreased throughout the study period except 2005 and 2006. Competitiveness indicators RCA and RCA# indicated that Pakistan had the 2nd best competitive advantage in the world export of tangerines after Spain. Egypt had increased its consumption gradually over time, it was not a competitive country as its RCA was less than one and RCA# had negative values for seven years of our study period except 2009 and then 2011 to 2013. The USA had a mixed consumption pattern and also was not a competitive exporter of tangerines. Competitive indicator RCA was less than one throughout the years under investigation.
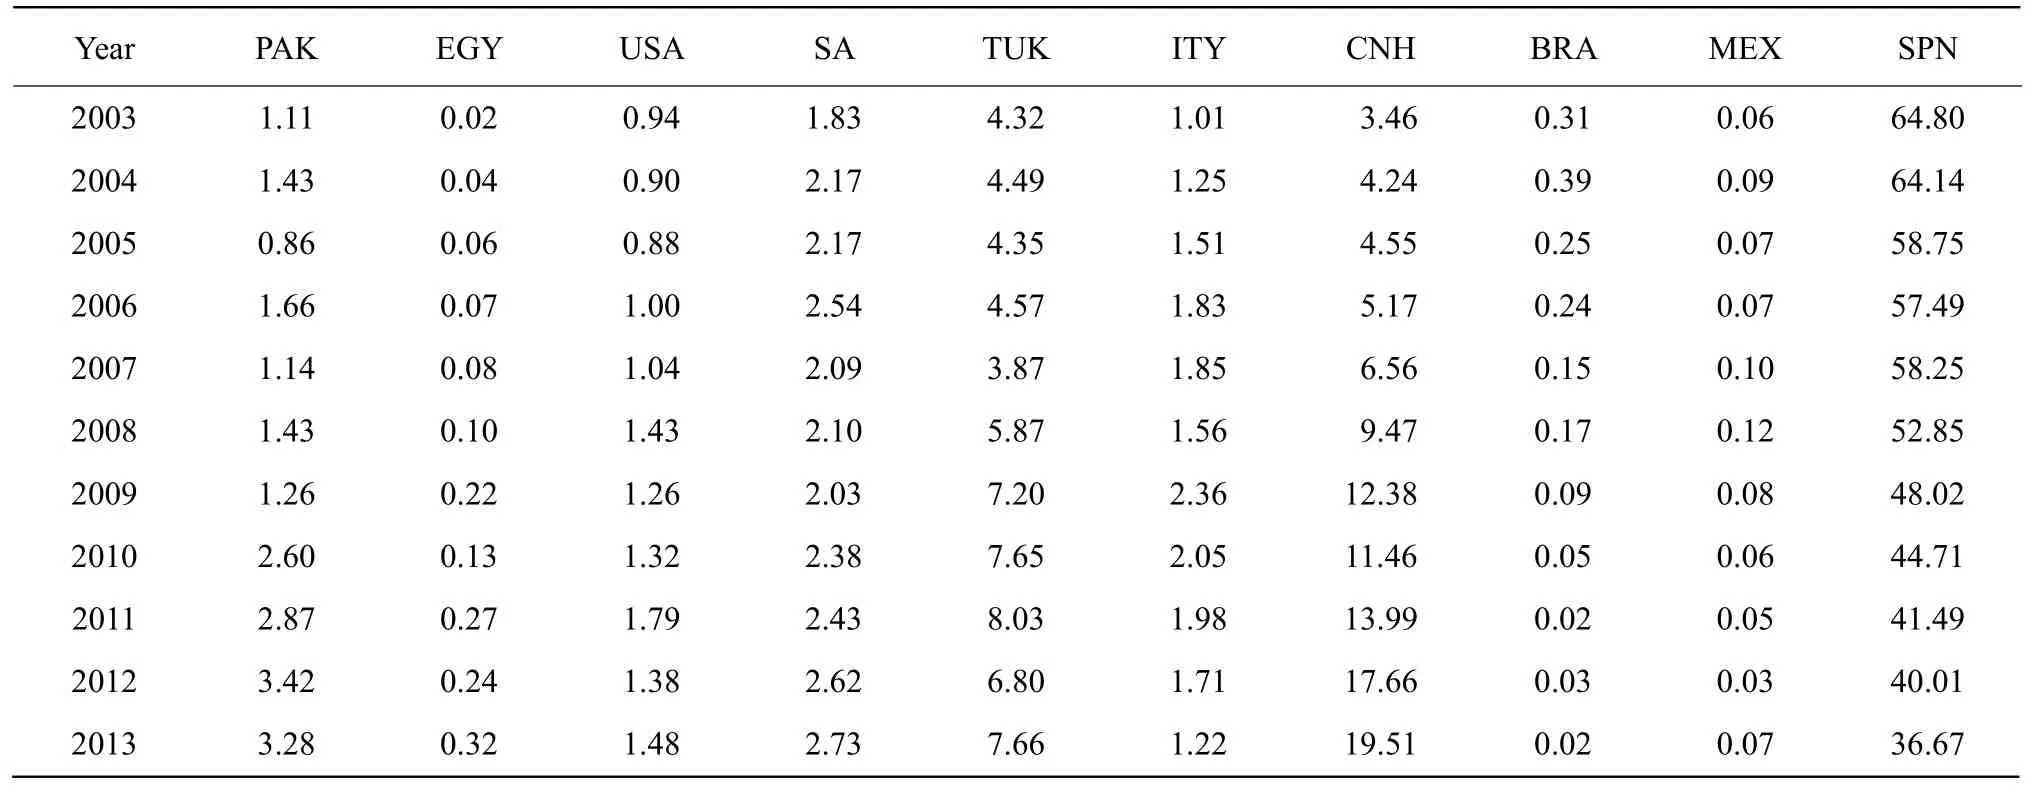
Table 9 Percentage contribution in world's tangerines exports (in terms of Dollar value)

Table 10 Annual per-capita consumption of tangerines
South Africa decreased its consumption except 2005 and 2006. Its competitiveness increased gradually.Turkey showed mixed consumption results from 2003 to 2013. Moreover, competitive indicators RCA and RCA# confirmed that Turkey was a totally competitive country. Italy increased its consumption and found that it was not a competitive country for the export of tangerines from 2003 to 2013, because competitiveness indicator RCA# had negative values during all the years. In case of China, consumption was increased except years 2007 to 2009. From 2003 to 2007, China was not a competitive country, but after that it became very competitive.
Tables 11 and 12 confirmed that China had a value of RCA greater than one and RCA# did not have negative values. Brazil had decreased its consumption over the years, but this decreased consumption did not affect its export. Its competitiveness decreased, RCA was less than one and RCA# was also negative from 2003 to 2013. Mexico's consumption of tangerines remained the same for the selected sample years. The point to notice was that Mexico remained competitively disadvantaged country throughout the period under investigation.It was among the last number of ranking with the least competitive advantage for the world exports of tangerines. Spain was a major exporter of tangerines;its consumption was also found greater than any other countries among the samples. Competitiveness indicator RCA had a little variation, but RCA# remained almost constant throughout the study period. It was evident that competitiveness of Spain in tangerine exports was neither increased nor decreased.

Table 11 Competitiveness indicators (RCA) of major tangerines exporters
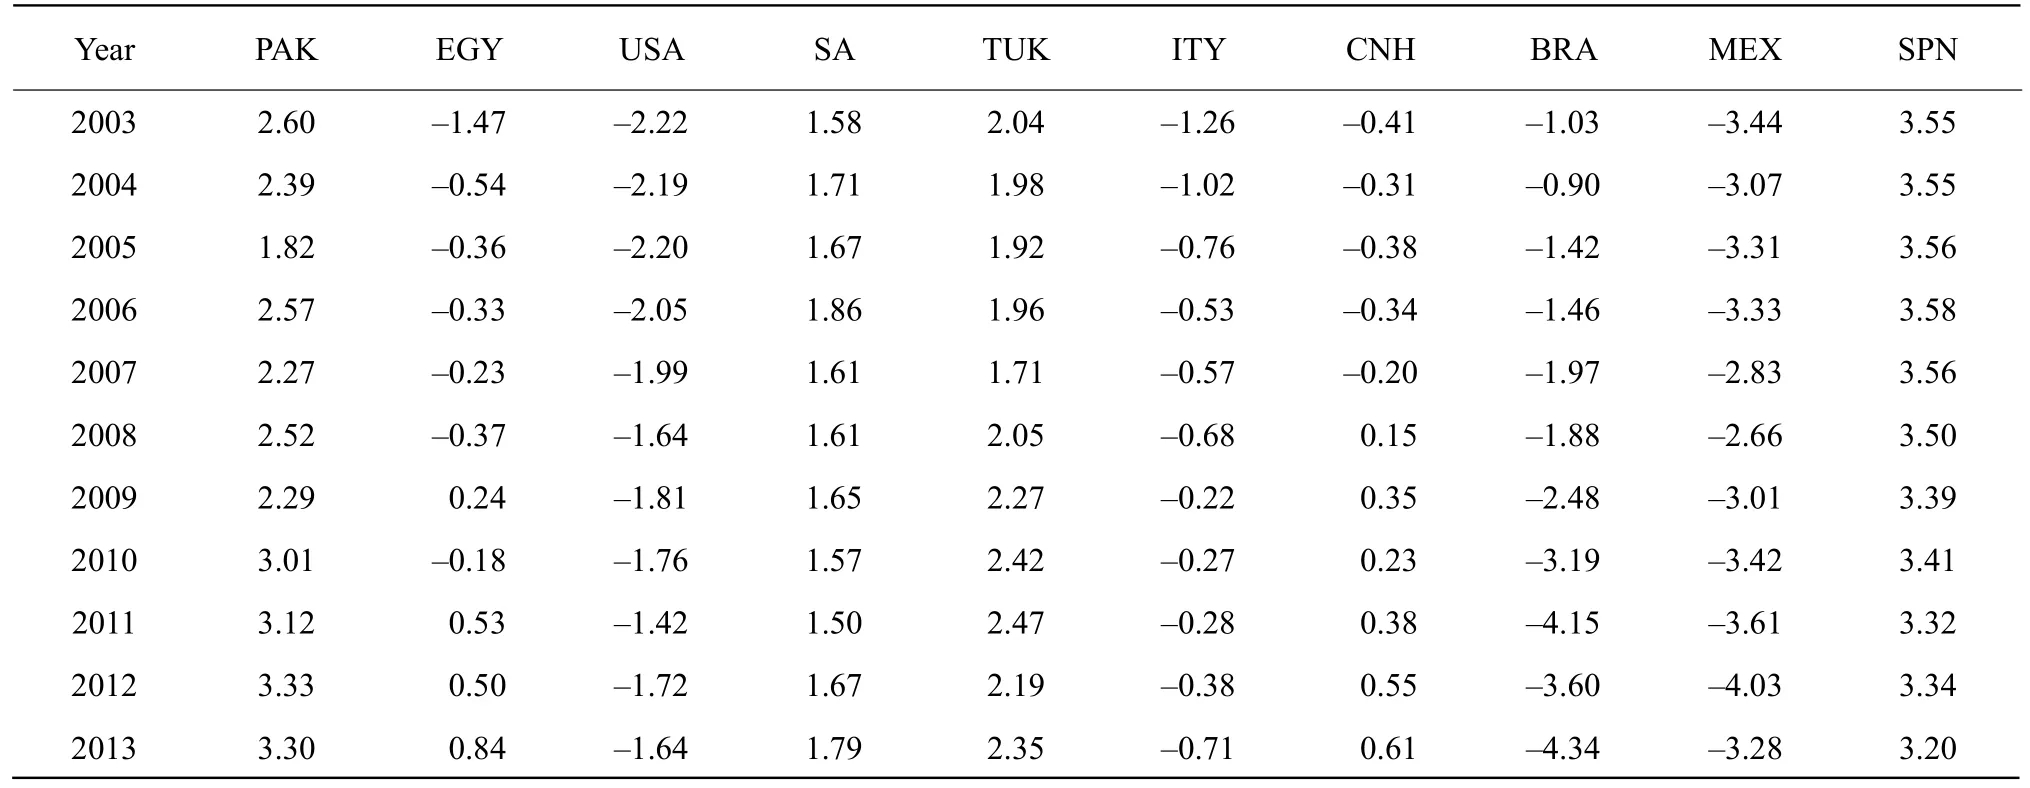
Table 12 Competitiveness indicators (RCA#) of major tangerines exporters
Conclusions
Export competitiveness of Pakistan for cotton, rice and tangerines were analyzed. Data of top exporters of these agricultural products for 11 years were used to calculate the percentage contribution of each country in the world exports, per-capita consumption patterns,RCA and RCA# indicators in order to explore the comparative and competitive advantages. Pakistan had gradually improved its share in the world exports of cotton and reduced its per-capita consumption.Results showed that Pakistan had higher comparative and competitive advantages in the export of cotton.Percentage contribution of Pakistan to the world rice exports almost remained the same. However, percapita consumption was decreased by 55% for the study period. Moreover, RCA and RCA# indicators showed Pakistan had strong comparative and competitive advantages in the export of rice among major rice exporting countries around the world. Percentage contribution of Pakistan to the world tangerine export had increased by 195%, while the per-capita consumption was also increased about 122%, during the study period. The analysis of RCA and RCA# showed that Pakistan gradually improved competitiveness of its tangerines. It was found that Pakistan had the comparative and competitive advantages in the exports of cotton, rice and tangerine. It could be further improved by promoting export-led growth policy.
Akhtar W, Sharif M, Shah H. 2009. Competitiveness of Pakistani fruits in the world market.The Lahore Journal of Economics, 14(2):125-133.
Balassa B. 1965. Trade liberalization and revealed comparative advantage.The Manchester School of Economics and Social Studies,33(2): 99-123.
Balassa B. 1989.Comparative advantage,trade policy and economic development. Harvester Wheat Sheaf. London. pp. 25-27
Ballance R, Forstner H, Murray T. 1985. On measuring comparative advantage: a note on Bowen's indices.Review of World Economics,121(2): 346-350.
Bender S, Li K W. 2002.The changing trade and revealed comparativeadvantages of Asian and Latin American manufacture exports.Economic Growth Center, New Haven, United States. pp. 841-843.
FAO. 2016. Food & agriculture organization, statistic division.http://www.fao.org.
WITS. 2016. World integrated trade solutions.http://wits.worldbank.org.
Faruqee R. 1995.Structural and policy reforms for agricultural growth: the case of Pakistan. Agriculture and Natural Resource Division, South Asia Department, the World Bank. pp. 14-33.
GOP. 2016. Economic survey of Pakistan 2015-16.http://finance.gov.pk.
Hatab. 2011.Determinants of Egyptian agricultural exports with special reference to the potential opportunities in the Chinese market. Northwest A and F University, Yangling, China.
Hinloopen J, Van M. 2004. Dynamics of Chinese comparative advantage.https://ssrn.com/abstract=524722.
Hsu J L, Jjw W. 2001. Competitiveness and consumer preferences of U.S. fruits in Taiwan.Agribusiness, 20(20488): 433-448.
Mahmood A, Nishat M. 2004. Export competitiveness and comparative advantage of Pakistan's non-agricultural production sectors: trends and analysis.Pakistan Development Review, 43(4): 541-561.
Abdullah M, Ghazanfar S, Ahmad J,et al.2015. Where Pakistan stands among top rice exporting countries, an analysis of competitiveness.Journal of Northeast Agricultural University(English Edition), 22(2): 80-86.
Scott L, Vollrath T L. 1992.Global competitive advantages and overall bilateral complementarity in agriculture:a statistical review.Statistical Bulletin, USA. pp. 1-12
Vollrath T L. 1985.Dynamics of comparative advantage and the resistance to free trade. Economic Research Service, USA. pp. 1-18
Vollrath T L. 1991. A theoretical evaluation of alternative trade intensity measures of revealed comparative advantage.Weltwirtschaftliches Archiv, 127(2): 265-280.
Yeats A J. 1985. On the appropriate interpretation of the revealed comparative advantage index: implications of a methodology based on industry sector analysis.Weltwirtschaftliches Archiv,121(1): 61-73.
 Journal of Northeast Agricultural University(English Edition)2018年2期
- Journal of Northeast Agricultural University(English Edition)的其它文章
- Research on Market Risk Assessment of Dairy Farms: Taking 75 Dairy Farms in Heilongjiang Province as Examples
- New Islanding Detection Method with Better Performance in Presence of Non-resistive Load
- Design of Greenhouse Environment Control System Based on Internet of Things
- Identification and Genetic Diversity Analysis of Chinese Mitten Crab(Eriocheir sinensis) in the Liao River Area
- Effect of Lactobacillus acidophilus as a Dietary Supplement on Nonspecific Immune Response and Disease Resistance in Juvenile Common carp, Cyprinos carpio
- Evaluation of Post-operative Anti-stress Response of Dexmedetomidine in Dogs