
When and how will the Millennium Silk Road witness 1.5 °C and 2 °C warmer worlds?
2018-05-24 01:41:47ZHOUTinJunSUNNingZHANGWenXiCHENXioLongPENGDongDongLIDongHunRENLiWenndZUOMeng
ZHOU Tin-Jun, SUN Ning, ZHANG Wen-Xi, CHEN Xio-Long, PENG Dong-Dong, LI Dong-Hun,REN Li-Wen nd ZUO Meng
aLASG, Institute of Atmospheric Physics, Chinese Academy of Sciences, Beijing, China; bUniversity of Chinese Academy of Sciences, Beijing, China;
cClimate Change Research Center, Chinese Academy of Sciences, Beijing, China
1. Introduction
The Silk Road is a historically important international trade route between China and the Mediterranean. As a network of trade routes, formally established during the Han Dynasty of China around 130 BCE (before common era) to open trade with the west, the Millennium Silk Road has served as a thoroughfare from east to west and linked the regions of the ancient world in commerce. Because China’s silk comprised a large proportion of the trade along this ancient road, in 1877 it was named the ‘Silk Road’by the German geographer and traveler Ferdinand von Richthofen. Western China and central Asia are positioned centrally along the Silk Road (Figure 1), and together are regarded as the Millennium Silk Road core region (hereinafter, the SRC region), important in linking the Eurasian continent’s east and west coasts. The SRC region, consisting of five provinces of Northwest China (Xinjiang, Qinghai,Ningxia, Shaanxi, and Gansu) and five central Asian countries (Kazakhstan, Uzbekistan, Kyrgyzstan, Turkmenistan,and Tajikistan) (Figure 1(a)), is dominated by arid and semi-arid climate (Figure 1(b)). The development of society and economy here relies heavily on water resources,and is one of the ‘hot spots’ in climate research identified as particularly sensitive to climate change. Reliable information on climate change in the SRC region is of crucial importance to the successful implementation of ‘the Belt and Road Initiatives (The Silk Road Economic Belt and the 21st-century Maritime Silk Road is a development strategy proposed by Chinese Government that focuses on connectivity and cooperation between Eurasian countries.)’.However, to date, the availability of such information has been quite limited.
Recent decades have seen a wetting trend along with warming conditions in some regions of the Millennium Silk Road. Efforts have been devoted to understanding observed past changes. A warming trend larger than the global mean during recent decades has been found for Northwest China (Hu et al. 2014; Li, Chen, and Shi 2012).Meanwhile, associated with the increased specific humidity and southward displacement of the Asian subtropical westerly jet, a significant wetting trend has been seen in this region (Peng and Zhou 2017). Many factors have been suggested to affect the climate of central Asia, including the interannual variability of the Asian westerly jet (Zhao et al. 2014), El Ni?o–Southern Oscillation (Mariotti 2007),the Indian summer monsoon (Wei et al. 2017), and circumglobal teleconnection (Ding and Wang 2005; Huang et al. 2015). These studies generally focused on interpreting observed climate changes, whereas less effort has been devoted to climate change projection (Huang et al. 2014;Wang et al. 2017), as compared to the many publications on the projection of East and South Asian climate change(Chen, Xu, and Yao 2015; Chen and Zhou 2015; Chen and Zhou 2017; Guo et al. 2016, 2017; He and Zhou 2015; Kitoh et al. 2013; Li, Zou, and Zhou 2017; Peng et al. 2016; Xu et al. 2017; Zou and Zhou 2015, 2016).
The parties of the United Nations Framework Convention on Climate Change (UNFCCC) signed the Paris Agreement in December 2015. The Paris Agreement stated a long-term goal for climate protection as ‘holding the increase in the global average temperature to well below 2.0 °C above pre-industrial levels and pursuing efforts to limit the temperature increase to 1.5 °C above pre-industrial levels, recognizing that this would significantly reduce the risks and impacts of climate change.’ (UNFCCC 2015).As a result of the Paris Agreement, there is considerable interest in the scientific community to provide input on the projected climate impacts under a climate warming scenario that stabilizes at 1.5 °C, in terms of water availability, temperature and precipitation extremes, as well as ecological and agricultural impacts (Hulme 2016; King,Karoly, and Henley 2017; Li et al. 2018; Mitchell et al. 2016;Schleussner et al. 2016a, 2016b). For China specifically,extreme precipitation days (annual number of days with precipitation greater than 50 mm) and total precipitation during days when daily precipitation exceeds the 99th percentile, are projected to increase by 25.81% and 69.14%,respectively, with respect to the 1971–2000 base period, as determined by model ensemble data from phase 5 of the Coupled Model Intercomparison Project (CMIP5; Guo et al. 2016). The Intergovernmental Panel on Climate Change(IPCC) has accepted an invitation from the UNFCCC to provide a special report on the impacts of global warming of 1.5 °C above pre-industrial levels. However, information on climate change over the regions of the Millennium Silk Road in a 1.5 and 2 °C global warming world remains quite limited. Accordingly, this study aims to answer the following questions: (1) How will temperature and precipitation change over the SRC region in the coming century under different warming scenarios? (2) When will the Millennium Silk Road witness warming of 1.5 and 2 °C? (3) How will the mean state and extreme climate events change over the SRC region in a 1.5 and 2 °C global warming future?
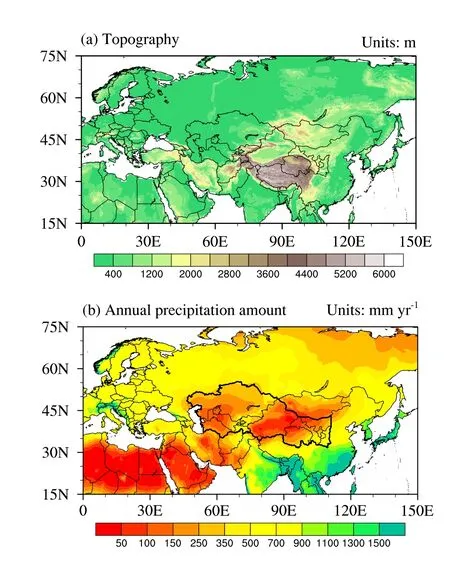
Figure 1. The (a) topography (units: m) and (b) annual mean precipitation amount (units: mm yr?1) over the Eurasian continent.The thick black lines indicate the Silk Road core region.
2. Data and methods
The historical simulations and projections under different Representative Concentration Pathways (RCPs) from coupled climate models in CMIP5 (Taylor, Stouffer, and Meehl 2012) are analyzed. The models used in the construction of the analysis fields given in this study vary with the research focus, since we hope to use as many model results as possible to reduce the uncertainties. As summarized in Table 1, data from 24 models are used to calculate the regional average annual mean surface air temperature (SAT) and precipitation under all four RCP scenarios (RCP2.6, RCP4.5,RCP6.0, and RCP8.5), shown in Figure 2. The projected SAT under two RCPs (RCP4.5 and RCP8.5) is derived from 40 CMIP5 climate/earth system models (Table 1) and used to calculate the 1.5 and 2 °C threshold-crossing times shown in Figure 3. Taking 2 °C warming for example, this is de fined as the SAT anomalies larger than 2 °C relative to the mean state during 1861–1890 in the historical simulation. To reduce the uncertainty in calculating the threshold-crossing time due to interannual variability, a nine-year running average is used to smooth the time series of SAT anomalies. Then, the 2 °C threshold-crossing time is de fined as thefirst year when the SAT anomalies reach 2 °C. The model outputs are remapped onto a 5° × 5° grid by bilinear interpolation for reliable large-scale information.
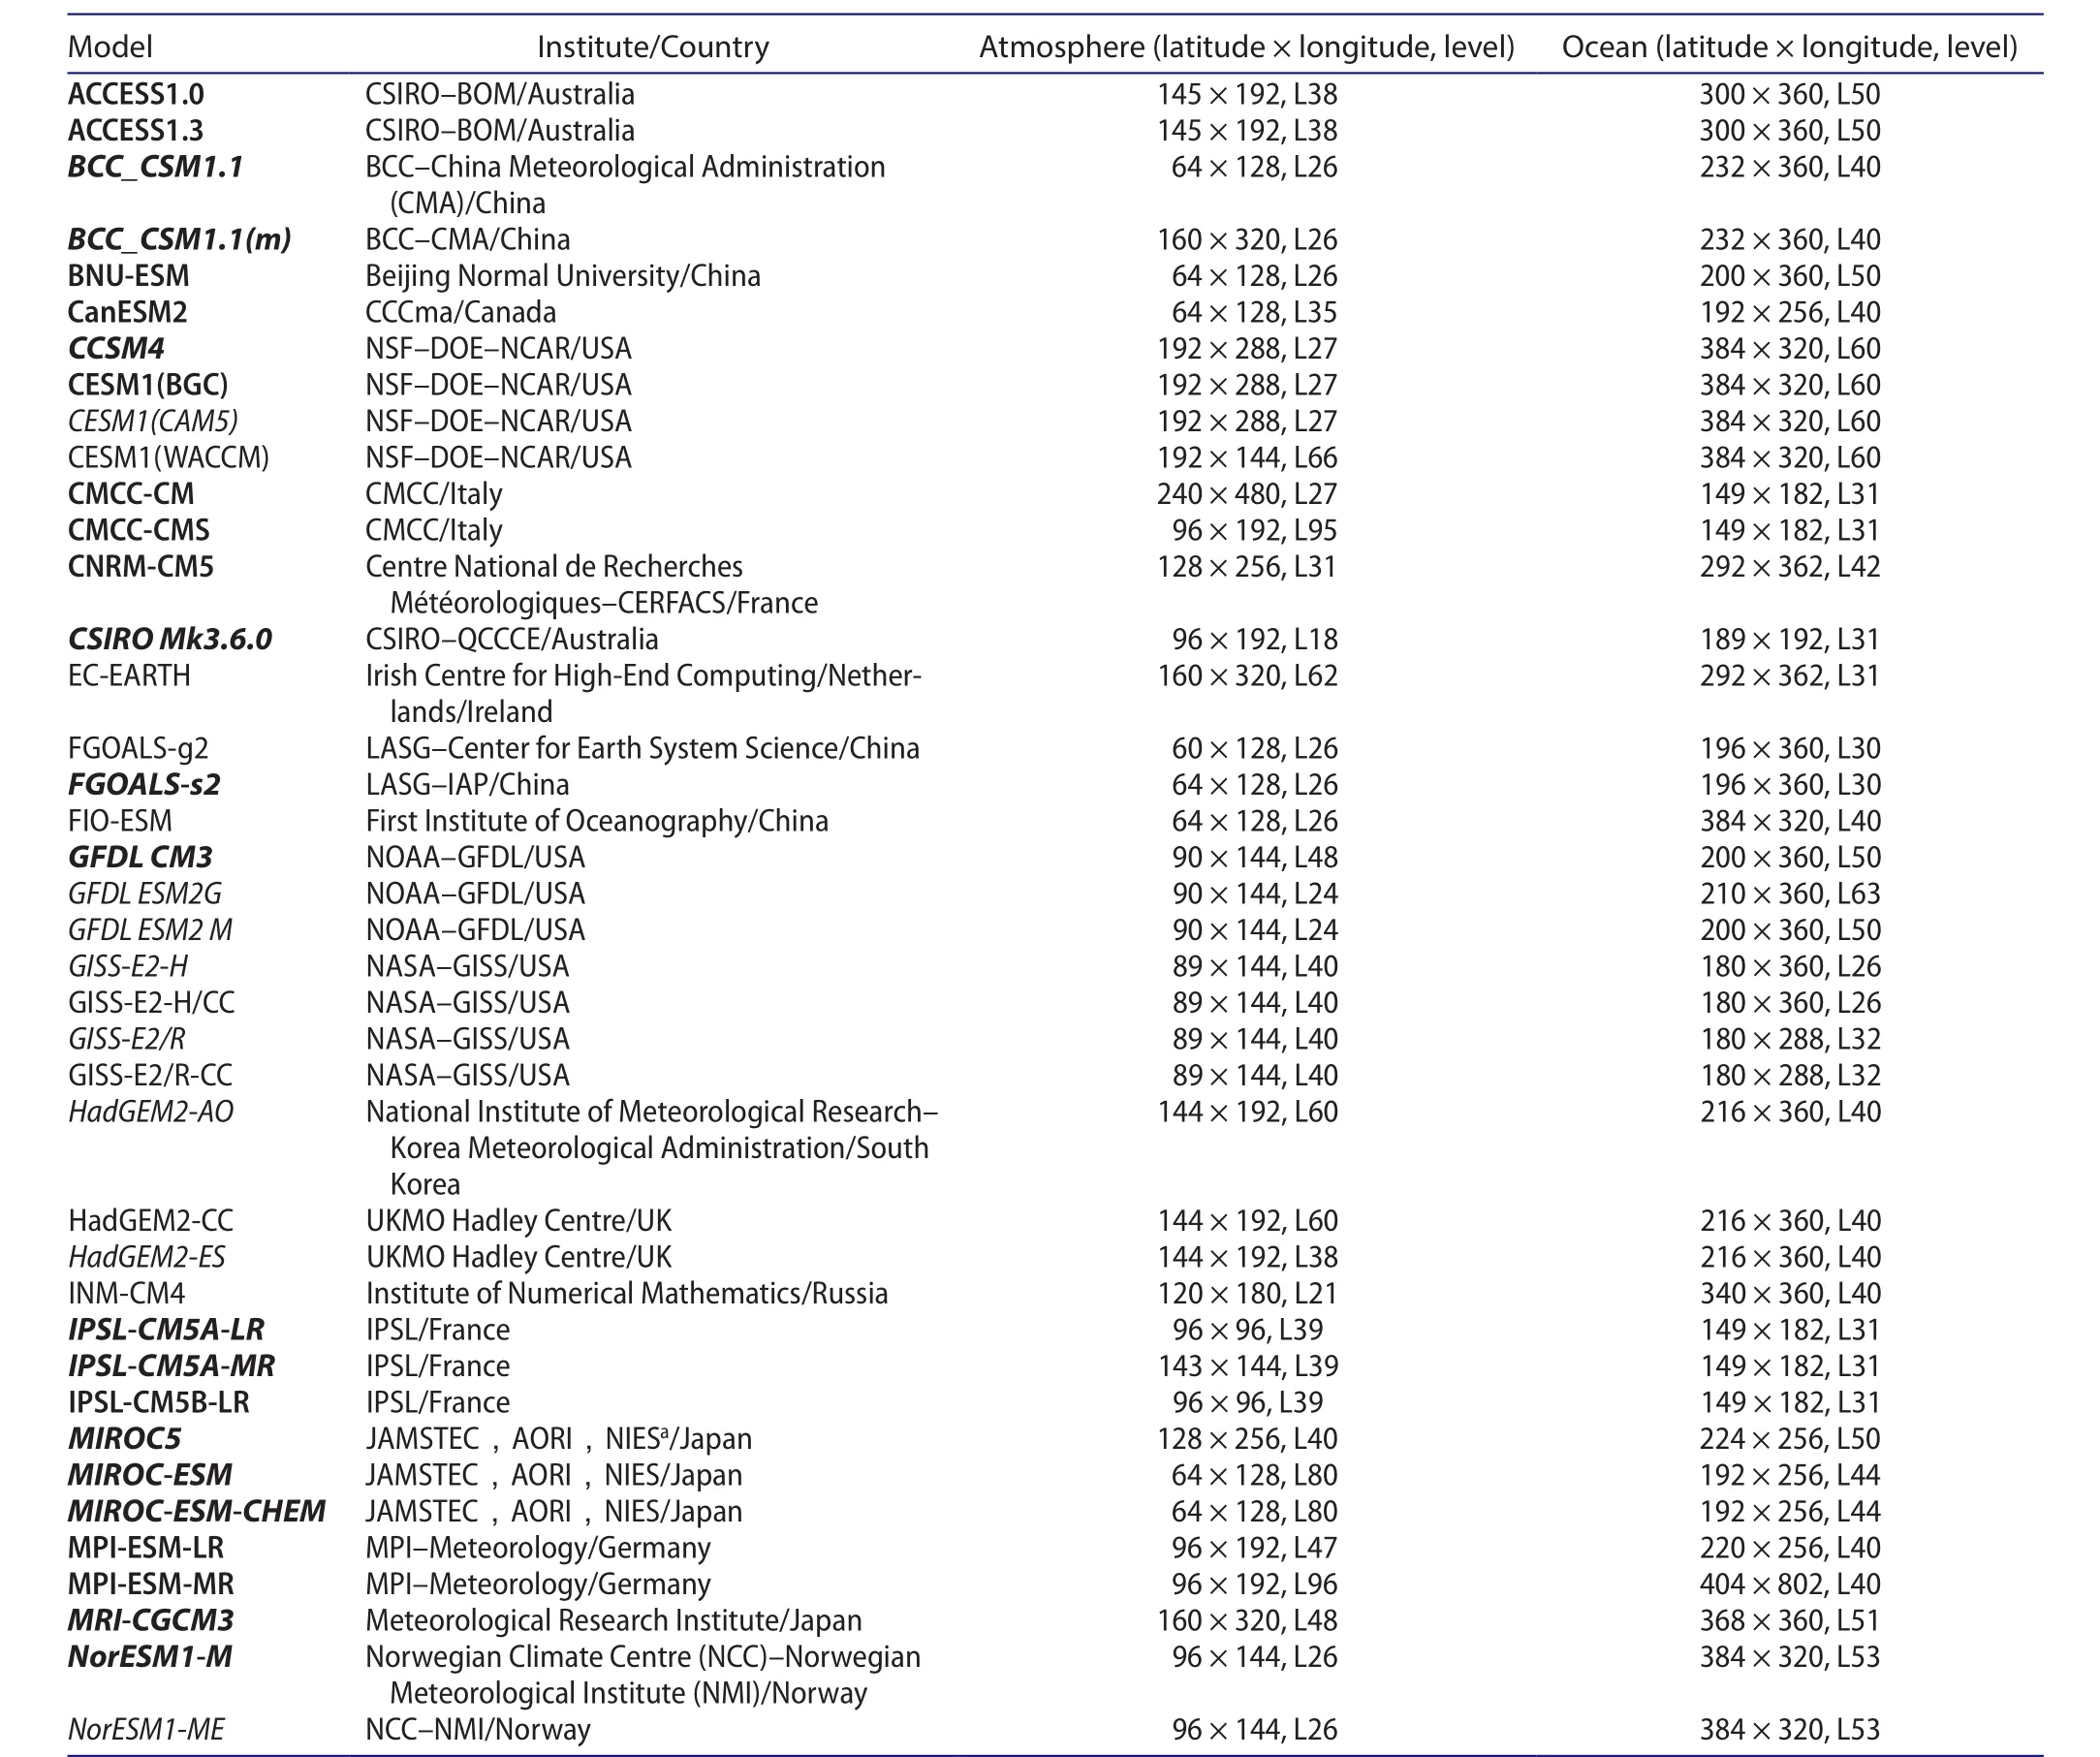
Table 1. Details of the CMIP5 models. All the models are used to derive the 1.5 and 2 °C threshold-crossing time in Figure 4. The models in italic type provide projections under all four RCP scenarios, and are thus used in Figures 2 and 3. The models in bold type are used to derive the extreme indices in Figures 6 and 7, based on daily data availability.
The data from the 24 models in bold type in Table 1 are used to derive the extreme indices presented later in the paper because daily data is only provided by these models. The standard de finitions of the extreme indices are adapted from the Expert Team on Climate Change Detection and Indices (Zhang et al. 2011). Two indices are used in our analysis. The first is ‘consecutive dry days’ (CDD),which is de fined as the largest number of consecutive days with daily precipitation less than 1 mm. The second is‘extreme heat event’, which is de fined as the annual count of days when the daily maximum temperature is greater than 35 °C. The extreme indices are calculated on the native grids of the individual models and then regridded to a common resolution of 1° × 1° to derive multi-model ensembles.
In our analysis, to account for future deviations from the current climate, a common reference period of 1986–2005 is referred to as the baseline scenario. The results for the 1.5 and 2 °C warming scenarios are aggregated from the nine-year windows centered on the years when 1.5 and 2 °C warming above pre-industrial levels (1861–90)is reached. The climate changes in a 1.5 or 2 °C warmer world are calculated for each model separately to derive multi-model ensembles.
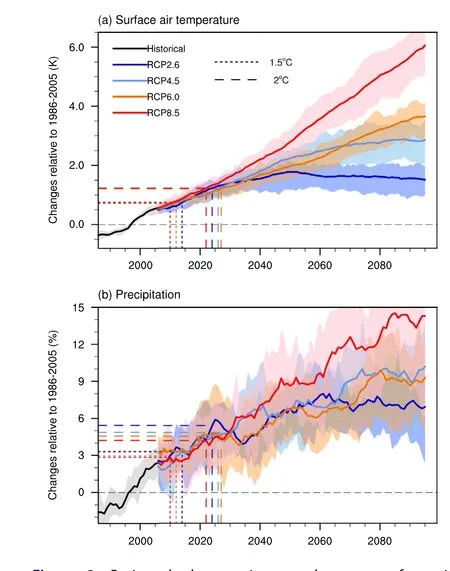
Figure 2. Projected changes in annual mean surface air temperature and precipitation over the Silk Road core (SRC)region (outlined in black in Figure 1). Changes are relative to the 1986–2005 mean, with nine-year smoothing applied. Thick lines show the multi-model mean, and shading the interquartile ranges. Dotted (dashed) lines show the timing of 1.5 °C (2 °C)warming over the SRC region and the corresponding changes in the multi-model mean.
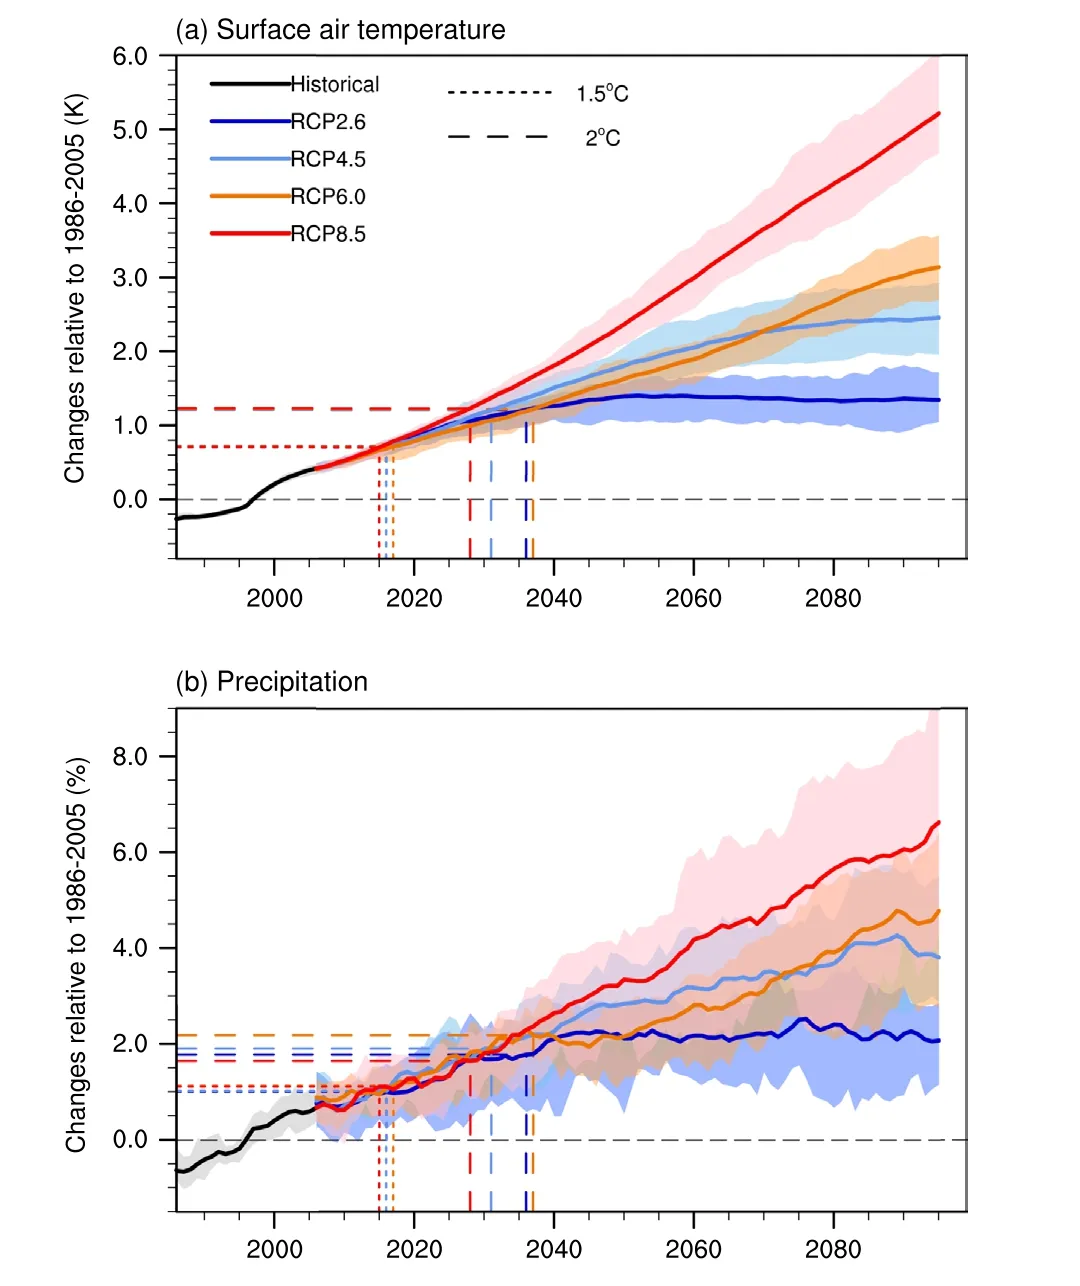
Figure 3. Projected changes in annual mean surface air temperature and precipitation over the global land region(66°S–75°N). Changes are relative to the 1986–2005 mean, with nine-year smoothing applied. Thick lines show the multi-model mean, and shading the interquartile ranges. Dotted (dashed)lines show the timing of 1.5 °C (2 °C) warming over the global land region and the corresponding changes in the multi-model mean.
3. Results
We begin the analysis from the projected changes of annual mean SAT and precipitation over the SRC region (Figure 2). Analysis of the changes over the SRC region is carried out along with a comparison with the changes averaged over the global land area and entire globe (Figures 3 and 4). Warming over the SRC region under different emission scenarios generally follows that of the global mean, but the magnitude is larger (Figures 3 and 4; also see Figure 12.5 in IPCC AR5, albeit the numbers of models used are slightly different). By the end of the twenty- first century,the multi-model ensemble mean projects a warming of~1.5, 2.9, 3.6, and 6.0 °C under RCP2.6, 4.5, 6.0, and 8.5,respectively, relative to the 1986–2005 baseline (Figure 2).These warming magnitudes are around 0.2–0.8 °C greater than the global land average, and 0.5–2.0 °C greater than the global mean (Figures 3 and 4). The more severe the emissions scenario, the greater the difference in warming.Such an amplification of warming in dry regions is related to the positive land surface feedback, as reported in Huang et al. (2017).
The annual mean precipitation amount increases consistently across all RCPs, although the model spread is large(Figure 2(b)). The percentage increases are faster than the global average (Figures 3(b) and 4(b)). For example, the annual mean precipitation amount is projected to increase by ~14% with respect to 1986–2005 over the SRC region by the end of the twenty- first century, as compared to ~6.5%for the global land area and ~6.8% for the global mean,under RCP8.5 (compare Figure 2(b) with Figures 3(b) and 4(b)).
But when will the Millennium Silk Road reach a 1.5 and 2 °C warming? The respective timings under different emission scenarios and the corresponding changes are shown in Figure 2. Also, more specifically, we show the spatial patterns of the 1.5 and 2 °C threshold-crossing time under the RCP4.5 and RCP8.5 scenarios over the Eurasian continent in Figure 5. For the multi-model ensemble mean, the 1.5 °C threshold-crossing time in the SRC region is projected to be reached before 2020, under all the emission scenarios.The 2 °C threshold is projected to be breached no later than 2030. Under RCP8.5, this could be as early as 2022. It is unsurprising to see an expected earlier threshold-crossing time under the higher emission scenarios. However,it should be noted that there is large spread among the CMIP5 models in the projection of the 1.5 and 2 °C threshold-crossing times (not shown), which can be explained in terms of different climate sensitivities to anthropogenic forcing in different models (Chen and Zhou 2016).
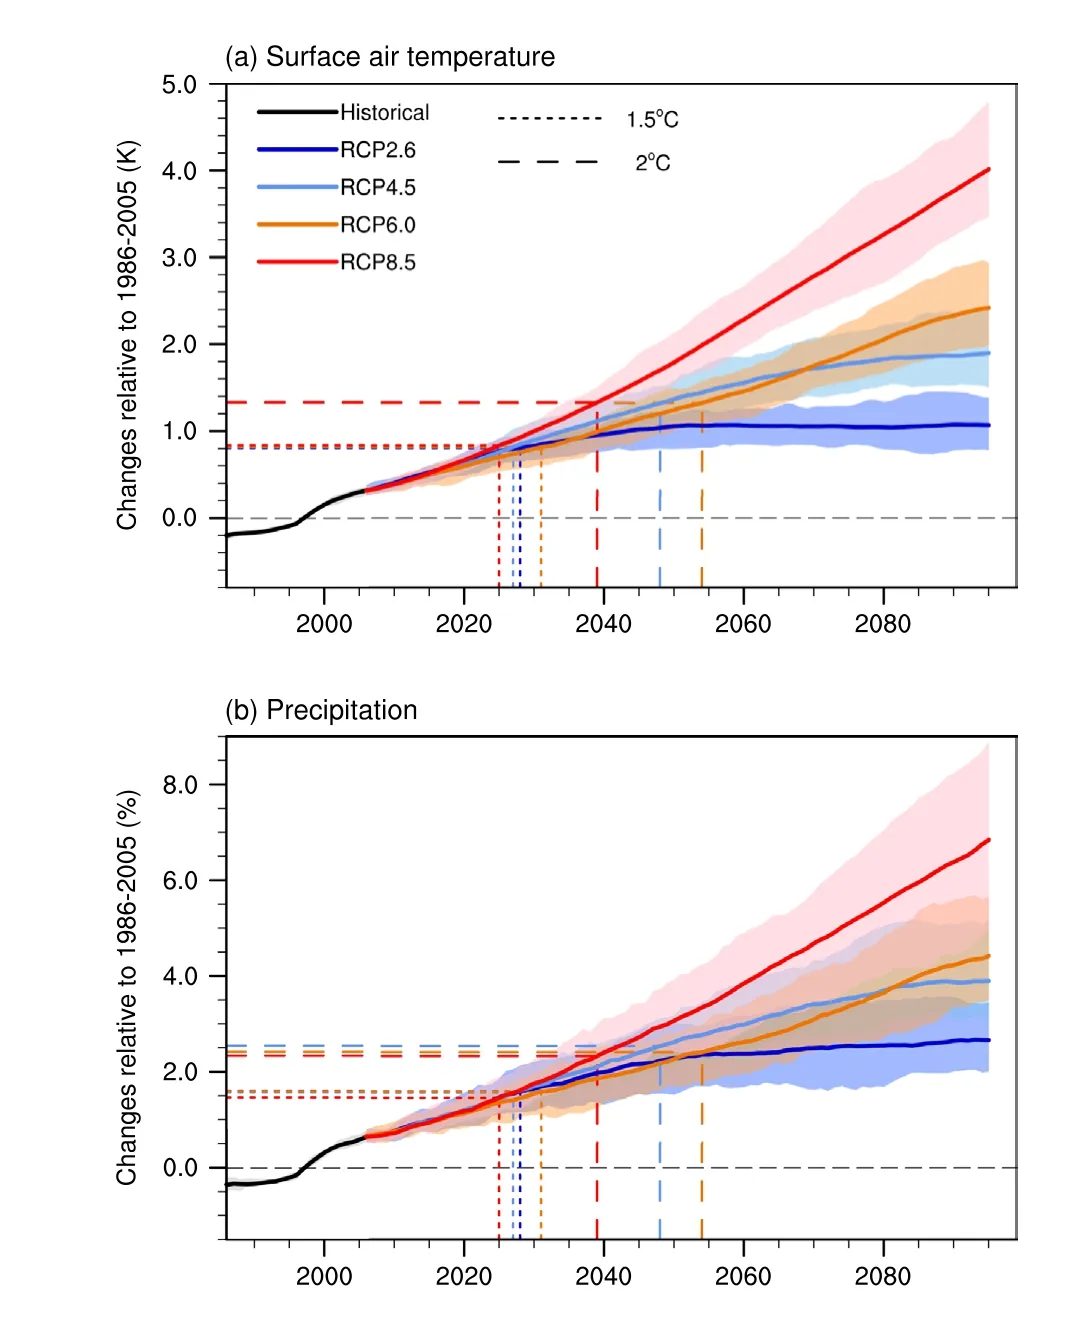
Figure 4. Projected changes in annual mean surface air temperature and precipitation over the globe. Changes are relative to the 1986–2005 mean, with nine-year smoothing applied. Thick lines show the multi-model mean, and shading the interquartile ranges. Dotted (dashed) lines show the timing of 1.5 °C (2 °C) warming over the globe and the corresponding changes in the multi-model mean. Note that 2 °C warming will not be reached under RCP2.6.
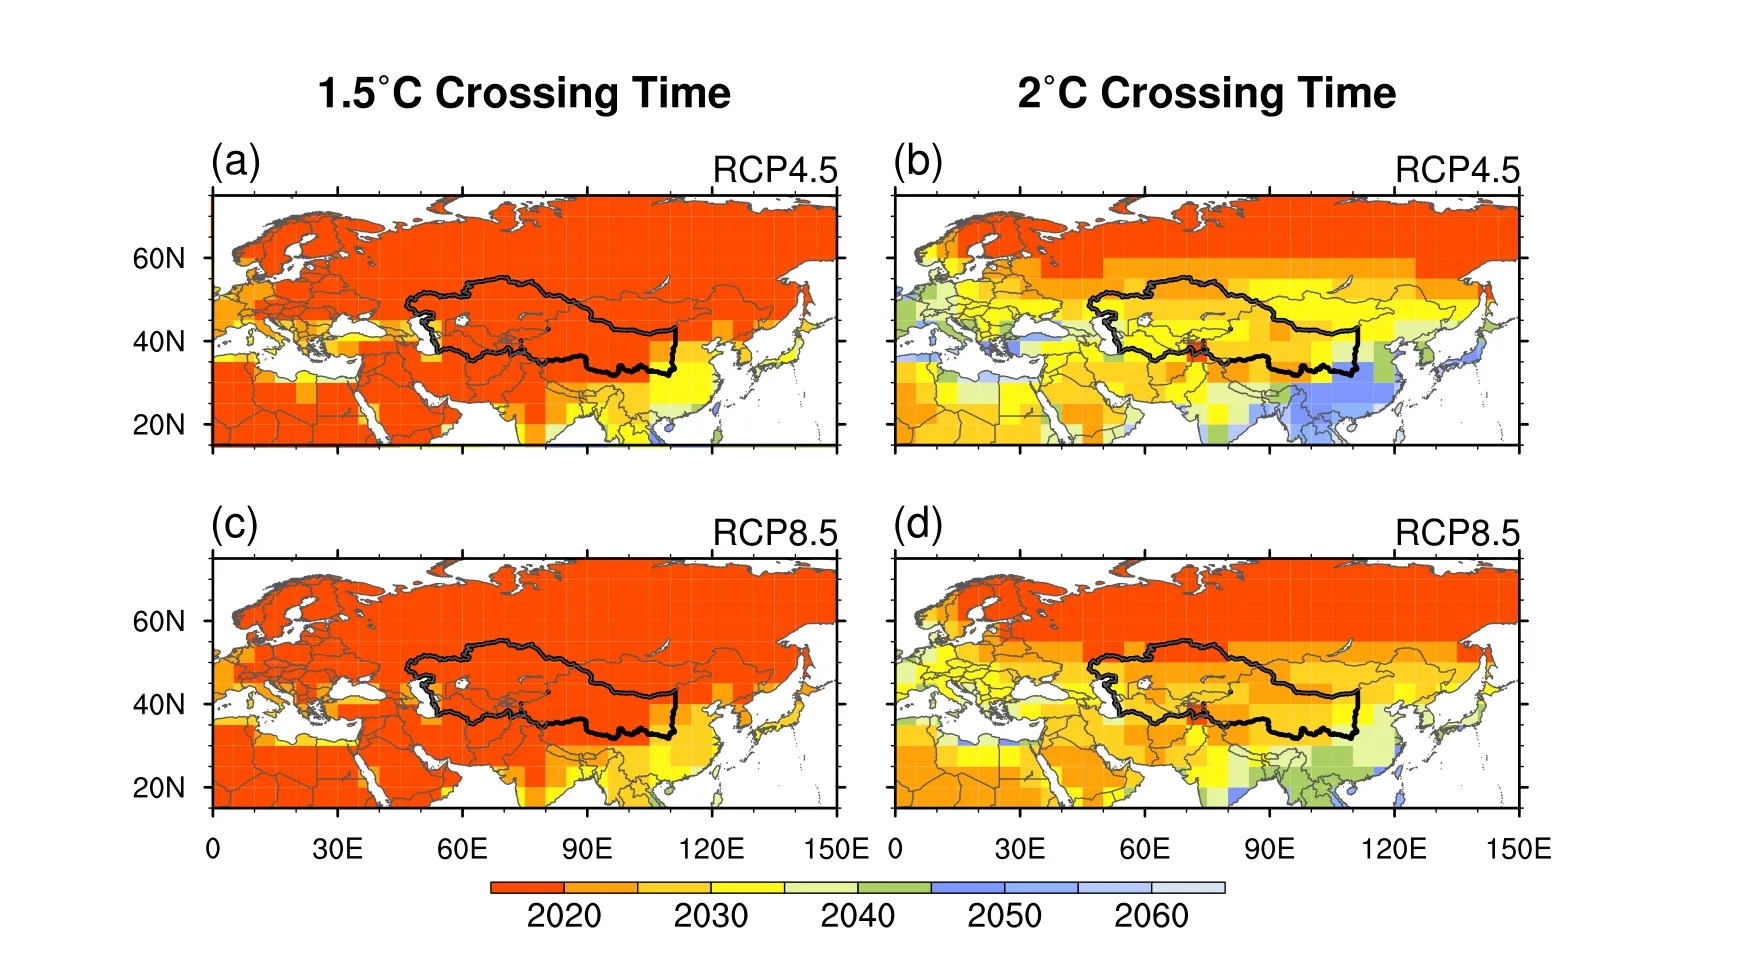
Figure 5. The (a, c) 1.5 °C and (b, d) 2 °C threshold-crossing time under the (a, b) RCP4.5 and (c, d) RCP8.5 scenarios over the Eurasian continent. The black outline denotes the Silk Road core region.
The threshold-crossing time over the SRC region is earlier than that over the global land area or global mean(compare Figure 2(a) with Figures 3(a) and 4(a)). Under the RCP8.5 scenario, for example, a regional 1.5 °C (2 °C)warming over the SRC region is breached in 2010 (2022),whereas over the global land area and for the global mean the years are 2015 (2028) and 2025 (2039), respectively.
But how will the pattern of annual mean SAT and precipitation change over the regions of the Millennium Silk Road under the 1.5 and 2 °C global warming scenarios? Based on Figure 6, we examine the multi-model ensemble mean changes of annual mean SAT between the 1.5 or 2.0 °C warmer world relative to the base period (1986–2005).Crucially, although generally a warmer and wetter climate mean state is expected under the 1.5 and 2 °C global warming scenarios, the specific changes between a 1.5 and 2 °C warmer world are regionally dependent. For instance, a 1.5 °C warmer world induces a regional annual mean warming of 1.24 °C relative to the 1986–2005 base period over the SRC region, with an interquartile range of 0.92–1.63 °C. Compared with the 1.5 °C warmer world,however, the additional 0.5 °C under global warming of 2 °C leads to a further warming by 0.73 °C (interquartile range is 0.49–0.94 °C, similarly hereinafter) over the SRC region, which is much greater than the global mean level.The annual mean precipitation amount increases by 4.77% (2.31%–8.59%) under warming of 1.5 °C relative to the baseline, but the extra 0.5 °C under warming of 2 °C brings a further 2.72% (0.47%–3.82%) increase in precipitation over the SRC region. The spatial pattern features significant increases against model uncertainty between the two warming levels in the eastern part of the Silk Road(Figure 6(f)).
Changes in climate extremes may have larger impacts than mean-state changes. But how will extreme climate events change over the regions of the Millennium Silk Road in a 1.5 and 2 °C global warming future? Based on Figure 7, we examine the multi-model ensemble median changes in CDD between a 1.5 or 2.0 °C warmer world and the baseline period (1986–2005). The changes in CDD with warming exhibit a dipole pattern over Eurasia, featuring longer dry spells in the Asian monsoon–Mediterranean region and shorter dry spells in the vast northeastern Asia. The SRC region lies between, thus exhibiting longer dry spells in the southwestern part and shorter ones in the northeastern part. Among the SRC subregions, the reduction in CDD over the regions of Qinghai Province and northern Xinjiang Province is significant. The additional 0.5 °C under the warming of 2 °C increases (decreases) CDD by up to six ( five) days in the southwestern (northeastern)part of SRC region.
Based on Figure 8, we further examine the changes in extreme heat between a 1.5 or 2.0 °C warmer world and the baseline period (1986–2005). The changes in extreme heat events associated with warming exhibit a uniform increase over the SRC region, especially over central Asia (38°–50°N,50°–70°E) and Xinjiang Province (38°–45°N, 65°–90°E).Changes over most of the SRC region are statistically significant at the 0.1% level, except those in Qinghai Province and southern Gansu Province. The additional 0.5 °C under warming of 2 °C increases the number of extreme heat days by 4.2 over the whole SRC region, and by up to 8 days in the southwestern part of the SRC region.
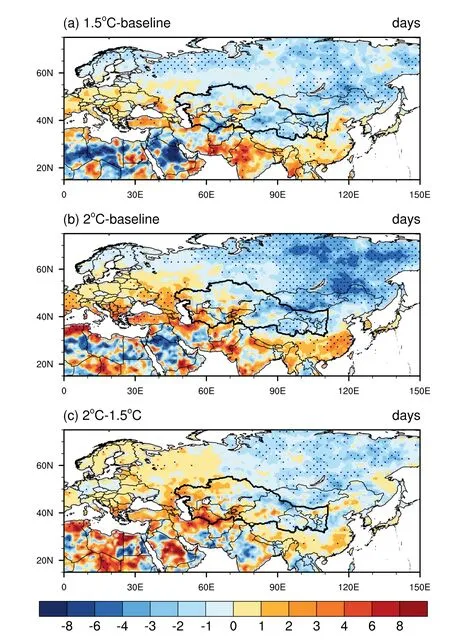
Figure 7. Multimodel ensemble median changes in consecutive dry days (a) between a 1.5 °C warmer world and the 1986–2005 baseline period, (b) between a 2 °C warmer world and the baseline period, and (c) between a 2 and 1.5 °C warmer world. Projections under RCP8.5 are employed. Dots denote where at least twothirds of the models agree in the sign of change.

Figure 8. Multi-model ensemble median changes in extreme heat(a) between a 1.5 °C warmer world and the 1986–2005 baseline period, (b) between a 2 °C warmer world and the baseline period,and (c) between a 2 and 1.5 °C warmer world. Projections under RCP8.5 are employed. Dots denote where the changes reach the 0.001 significance level.
4. Summary and concluding remarks
Western China and central Asia are positioned centrally along the Silk Road, and are together referred to as the Millennium SRC region. This region encompasses arid and semi-arid climate and is thus sensitive to climate change.The Belt and Road Initiative is a sophisticated network of trade corridors, power plants, and industrial infrastructure that will share the bene fits of more than $1 trillion in economic development. Thus, information on the potential change in climate over the SRC region is of crucial importance to planning future economic activities and hence the successful implementation of the Belt and Road Initiative.In this study, both mean and extreme climate changes projected by the ensemble mean of CMIP5 models are presented. The major findings are summarized in Table 2, but explained in slightly more detail as follows:
(1) By the end of the twenty- first century, the multi-model ensemble mean projects a warming of~1.5, 2.9, 3.6, and 6.0 °C under RCP2.6, 4.5, 6.0,and 8.5, respectively, with respect to the 1986–2005 baseline. These warming magnitudes are around 0.2–0.8 °C greater than the global land average, and 0.5–2.0 °C greater than the global mean. Annual mean precipitation increases consistently across all RCPs. Under RCP8.5, the annual mean precipitation amount increases by ~14%with respect to 1986–2005 over the SRC region by the end of twenty- first century, as compared to ~6.5% for the global land area and ~6.8% for the globe as a whole.
(2) The Millennium Silk Road is projected to witness a 1.5 and 2 °C warming earlier than the global land area and the global average. A regional warming of 1.5 °C (2 °C) over the SRC region is reached before 2020 (2030) under all the emission scenarios. The 2020s and 2030s see a 2 °C warming world, depending on whether RCP8.5 or RCP4.5 is used in the projection.
(3) A 1.5 °C warmer world is projected to induce a regional annual mean warming of 1.24 °C over the SRC region relative to the 1986–2005 baseline period, with an interquartile range of 0.92–1.63 °C. The extra 0.5 °C under global warming of 2 °C leads to a further warming by 0.73 °C (0.49–0.94 °C), which is much greater than the global mean level. The annual mean precipitation amount increases by 4.77% (2.31%–8.59%) at the 1.5 °C warming level, with the extra 0.5 °C under warming of 2 °C expected to induce an additional 2.72% (0.47%–3.82%) increase in precipitation.
(4) Changes in CDD are regionally dependent, with longer (shorter) dry spells in the southwestern(northeastern) part. The additional 0.5 °C under warming of 2 °C increases (decreases) the CDD by up to six ( five) days in the southwestern(northeastern) part of the SRC region. A uniform increase in extreme heat is seen across the SRC region under the 1.5 °C warming scenario, with the additional 0.5 °C under the 2 °C global warming scenario significantly increasing the number of extreme heat events.
In summary, our comparison of mean and extreme climate changes under 1.5 °C and 2 °C global warming scenarios highlight the impacts that can be avoided by achieving global warming of half a degree lower. If we pursue efforts to limit the temperature increase to 1.5 °C above pre-industrial levels, as compared to holding the increase in the global average temperature to well below 2.0 °C, a further warming of 0.73 °C (0.49–0.94 °C), as well as increased extreme heat events, could be avoided in the SRC region, at a cost of a reduced increase of 2.72%(0.47%–3.82%) in annual precipitation.
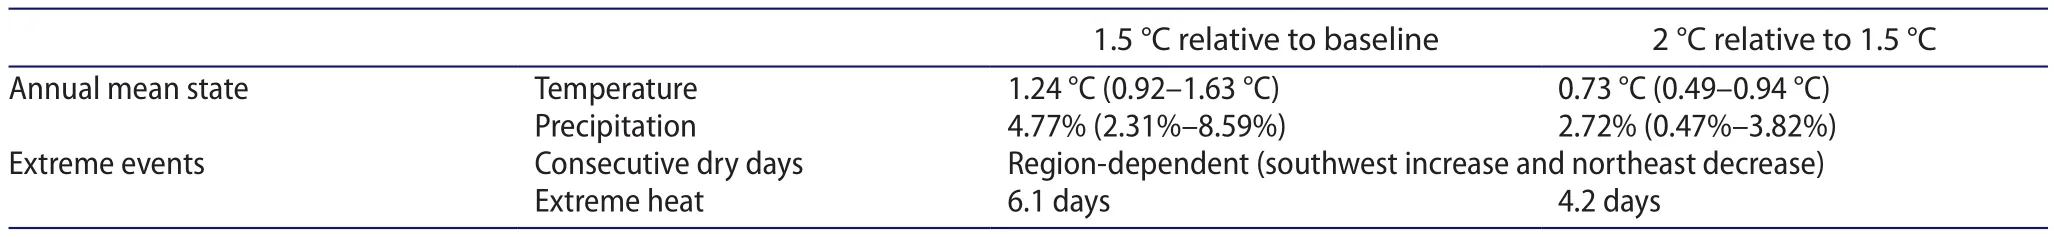
Table 2. Projected changes over the SRC region under global warming of 1.5 °C relative to the 1986–2005 baseline period and the extra 0.5 °C warming relative to 1.5 °C warming using CMIP5 models. The numbers in parentheses represent inter–quartile ranges of projected changes.
Acknowledgments
We appreciate the World Climate Research Programme Working Group on Coupled Modeling for organizing the CMIP5 project and releasing the model data.
Funding
This work is jointly supported by the National Natural Science Foundation of China [grant numbers 41330423, 41420104006,and 41605057].
References
Chen, X. C., Y. Xu, and Y. Yao. 2015. “Changes in Climate Extremes over China in a 2 °C, 3 °C, and 4 °C Warmer World.”Chinese Journal of Atmospheric Sciences39 (6): 1123–1135.doi:10.3878/j.issn.1006-9895.1502.14224. (in Chinese).
Chen, X. L., and T. Zhou. 2015. “Distinct Effects of Global Mean Warming and Regional Sea Surface Warming Pattern on Projected Uncertainty in the South Asian Summer Monsoon.”Geophysical Research Letters42: 9433–9439.doi:10.1002/2015GL066384.
Chen, X. L., and T. Zhou. 2016. “Uncertainty in Crossing Time of 2 °C Warming Threshold over China.”Science Bulletin61 (18):1451–1459. doi:10.1007/s11434-016-1166-z.
Chen, X. L., and T. Zhou. 2017. “Surface Air Temperature Projection under 1.5 °C Warming Threshold Based on Corrected Pattern Scaling Technique.”Advances in Earth Science32 (4): 435–445.doi:10.11867/j.issn.1001-8166.2017.04.0435. (in Chinese).
Ding, Q., and B. Wang. 2005. “Circumglobal Teleconnection in the Northern Hemisphere Summer.”Journal of Climate18(17): 3483–3505. doi:10.1175/JCLI3473.1.
Guo, X., J. Huang, Y. Luo, Z. Zhao, and Y. Xu. 2016. “Projection of Precipitation Extremes for Eight Global Warming Targets by 17 CMIP5 Models.”Natural Hazards84 (3): 2299–2319.
Guo, X., J. Huang, Y. Luo, Z. Zhao, and Y. Xu. 2017. “Projection of Heat Waves over China for Eight Different Global Warming Targets Using 12 CMIP5 Models.”Theoretical and Applied Climatology128 (3): 507–522.
He, C., and T. Zhou. 2015. “Responses of the Western North Pacific Subtropical High to Global Warming under RCP4.5 and RCP8.5 Scenarios Projected by 33 CMIP5 Models: The Dominance of Tropical Indian Ocean – Tropical Western Pacific SST Gradient.”Journal of Climate28: 365–380.
Hu, Z., C. Zhang, Q. Hu, and H. Tian. 2014. “Temperature Changes in Central Asia from 1979 to 2011 Based on Multiple Datasets.”Journal of Climate27 (3): 1143–1167.
Huang, A., Y. Zhou, Y. Zhang, D. Huang, Y. Zhao, and H. Wu. 2014.“Changes of the Annual Precipitation over Central Asia in the Twenty-First Century Projected by Multimodels of CMIP5.”Journal of Climate27 (17): 6627–6646.
Huang, W., J. H. Chen, X. Zhang, S. Feng, and F. Chen. 2015.“De finition of the Core Zone of the ‘Westerlies–Dominated Climatic Regime’, and Its Controlling Factors during the Instrumental Period.”Science China. Earth Sciences58 (5): 676.doi:10.1007/s11430-015-5057-y.
Huang, J., H. Yu, A. Dai, Y. Wei, and L. Kang. 2017. “Drylands Face Potential Threat under 2 °C Global Warming Target.”Nature Climate Change7 (6): 417.
Hulme, M. 2016. “1.5 °C and Climate Research After the Paris Agreement.”Nature Climate Change6: 222–224.
King, A. D., D. J. Karoly, and B. J. Henley. 2017. “Australian Climate Extremes at 1.5 °C and 2 °C of Global Warming.”Nature Climate Change7: 412–416.
Kitoh, A., H. Endo, K. Krishna Kumar, I. F. A. Cavalcanti, P.Goswami, and T. Zhou. 2013. “Monsoons in a Changing World: A Regional Perspective in a Global Context.”Journal of Geophysical Research: Atmospheres118: 3053–3065.doi:10.1002/jgrd.50258.
Li, B., Y. Chen, and X. Shi. 2012. “Why Does the Temperature Rise Faster in the Arid Region of Northwest China?”Journal of Geophysical Research: Atmospheres117 (D16): 115.doi:10.1029/2012JD017953.
Li, D. H., T. Zhou, L. Zou, W. Zhang, and L. Zhang. 2018. “Extreme High Temperature Events over East Asia in 1.5 °C and 2 °C Warmer Futures: Analysis of NCAR CESM Low-Warming Experiments.”Geophysical Research Letters45: 1541–1550.doi:10.1002/2017GL076753.
Li, D. H., L. W. Zou, and T. Zhou. 2017. “Changes of Extreme Indices over China in Response to 1.5 °C Global Warming Projected by a Regional Climate Model.”Advances in Earth Science32(4): 446–457. doi:10.11867/j.issn.1001-8166.2017.04.0446. (in Chinese).
Mariotti, A. 2007. “How ENSO Impacts Precipitation in Southwest Central Asia.”Geophysical Research Letters34 (16): 370–381.doi:10.1029/2007GL030078.
Mitchell, D., R. James, P. M. Forster, R. A. Betts, H. Shiogama, and M. Allen. 2016. “Realizing the Impacts of a 1.5 °C Warmer World.”Nature Climate Change6: 735–737.
Peng, D. D., and T. Zhou. 2017. “Why Was the Arid and Semiarid Northwest China Getting Wetter in the Recent Decades?”Journal of Geophysical Research: Atmosphere122: 9060–9075.doi:10.1002/2016JD026424.
Peng, D. D., T. Zhou, L. Zou, L. Zhang, and X. Chen. 2016.“The FGOALS–G2 Simulation of Global Monsoon Extreme Precipitation and Future Projection.”Chinese Journal of Atmospheric Sciences40 (5): 1059–1072. doi:10.3878/j.issn.1006-9895.1512.15243. (in Chinese).
Schleussner, C. F., T. K. Lissner, E. M. Fischer, J. Wohland, M.Perrette, A. Golly, J. Rogelj, et al. 2016a. “Differential Climate Impacts for Policy–Relevant Limits to Global Warming: The Case of 1.5 °C and 2 °C.”Earth System Dynamics7: 327–351.
Schleussner, C. F., J. Rogelj, M. Schaeffer, T. Lissner, R. Licker, E. M.Fischer, R. Knutti, A. Levermann, K. Frieler, and W. Hare. 2016b.“Science and Policy Characteristics of the Paris Agreement Temperature Goal.”Nature Climate Change6: 827–835.
Taylor, K. E., R. J. Stouffer, and G. A. Meehl. 2012. “An Overview of CMIP5 and the Experiment Design.”Bulletin of the American Meteorological Society93: 485–498.
UNFCCC (United Nations Framework Convention on Climate Change). 2015. “Adoption of the Paris Agreement.” Conference of the Parties, Paris, France, November 30–December 11.
Wang, Y. J., B. T. Zhou, D. H. Qin, J. Wu, R. Gao, and L. C. Song.2017. “Changes in Mean and Extreme Temperature and Precipitation over the Arid Region of Northwestern China:Observation and Projection.”Advances in Atmospheric Sciences34 (3): 289–305. doi:10.1007/s00376-016-6160-5.
Wei, W., R. Zhang, M. Wen, and S. Yang. 2017. “Relationship between the Asian Westerly Jet Stream and Summer Rainfall over Central Asia and North China: Roles of the Indian Monsoon and the South Asian High.”Journal of Climate30 (2):537–552. doi:10.1175/JCLI-D-15-0814.1.
Xu, Y., B. T. Zhou, J. Wu, Z. Y. Han, Y. X. Zhang, and J. Wu. 2017. “Asian Climate Change under 1.5–4 °C Warming Targets.”Advances in Climate Change Research8 (2): 99–107. (in Chinese).
Zhang, X., L. Alexander, G. C. Hegerl, P. Jones, A. K. Tank, T.C. Peterson, B. Trewin, and F. W. Zwiers. 2011. “Indices for Monitoring Changes in Extremes Based on Daily Temperature and Precipitation Data.”Wiley Interdisciplinary Reviews:Climate Change2 (6): 851–870.
Zhao, Y., M. Z. Wang, A. N. Huang, H. J. Li, W. Huo, and Q. Yang.2014. “Relationships between the West Asian Subtropical Westerly Jet and Summer Precipitation in Northern Xinjiang.”Theoretical & Applied Climatology116 (3–4): 403–411.
Zou, L. W., and T. J. Zhou. 2015. “Asian Summer Monsoon Onset in Simulations and CMIP5 Projections Using Four Chinese Climate Models.”Advances in Atmospheric Sciences32 (6):794–806. doi:10.1007/s00376-014-4053-z.
Zou, L., and T. Zhou. 2016. “Future Summer Precipitation Changes over CORDEX–East Asia Domain under the RCP8.5 Scenario Downscaled by a Regional Ocean–Atmosphere Coupled Model: A Comparison to the Stand–Alone RCM.”Journal of Geophysical Research – Atmospheres121: 2691–2704. doi:10.1002/2015JD024519.
 Atmospheric and Oceanic Science Letters2018年2期
- Atmospheric and Oceanic Science Letters的其它文章
- On assessing haze attribution and control measures in China
- Preface
- Assessing satellite-derived net surface radiative flux in the Arctic
- Revisiting the intraseasonal, interannual and interdecadal variability of tropical cyclones in the western North Pacific
- Regional earth system modeling: review and future directions
- Exploring the relationship between the cloud-top and tropopause height in boreal summer over the Tibetan Plateau and its adjacent region