
Evaluation of the zonal wind stress response to SST in the CMIP5 AMIP simulations
2018-05-24 01:41:44TANGShaoLeiandYUYongQiang
TANG Shao-Lei and YU Yong-Qiang
aLASG, Institute of Atmospheric Physics, Beijing, China; bCollege of Earth Science, University of Chinese Academy of Sciences, Beijing, China
1. Introduction
El Ni?o–Southern Oscillation (ENSO) is characterized by the irregular occurrence of warm or cold sea surface temperature (SST) anomalies in the equatorial eastern Pacific,and usually reaches its peak in boreal winter (Rasmusson and Carpenter 1982). As an oscillation of the ocean–atmosphere system, ENSO is the dominant mode of interannual climate variability, and in fluences weather and climatic patterns worldwide (Bove et al. 1998; McPhaden, Zebiak, and Glantz 2006; Liu and Alexander 2007). Accordingly, being able to predict ENSO events well in advance has practical significance for economic development and social stability.Over the last 30 years, the theoretical understanding of ENSO has advanced significantly with the increasing availability and quality of observational data and paleo proxies (Wang and Picaut 2004); plus, climate model performance has also continually improved (Zhang and Jin 2012; Chen, Yu, and Sun 2013; Bellenger et al. 2013).Nonetheless, it remains difficult to accurately simulate and predict ENSO with coupled atmosphere–ocean general circulation models (CGCMs)–even the state-of-theart models involved in phase 5 of the Coupled Model Intercomparison Project (CMIP5) (Bellenger et al. 2013;Chen et al. 2017)–because of the complex interplay between various oceanic and atmospheric processes and the relatively short observational record. Process- and feedback-based metrics and diagnostics provide us with some objective ways to locate errors exhibited by CGCMs and understand related dynamics, which is helpful in tackling the challenges that lie ahead.
Zonal wind stress–one of the major variables involved in Bjerknes feedback (Bjerknes 1969)–affects not only ENSO amplitude (Lloyd et al. 2009; Lai, Herzog,and Graf 2015) but also other characteristics such as asymmetry and meridional width (Zhang et al. 2013;Zhang and Sun 2014). Based on NCEP–NOAA reanalysis data, Lai, Herzog, and Graf (2015) found that strong and sustained westerly wind anomalies in the western Pacific are needed to trigger an Eastern Pacific El Ni?o. Through observational and theoretical analyses, Zhang et al.(2013) concluded that a systematic weak trade-wind bias can lead to weak ocean meridional currents and eventually contribute to the narrow bias of the simulated ENSO meridional scale. By conducting wind-forced ocean GCM experiments, Zhang and Sun (2014) suggested that the stronger time-mean zonal winds and weaker asymmetry in the interannual anomalies of the zonal winds in Atmospheric Model Intercomparison Project (AMIP)models can both be a contributing factor to a weaker ENSO asymmetry in the corresponding coupled models.Currently, most models still fail to simulate the zonal wind stress correctly. For example, examining the representation of CMIP5 models, Abellán, McGregor, and England (2017) found that most models tend to underestimate the magnitude of the zonal wind stress anomalies, which is consistent with the results of Bellenger et al. (2013). Several CGCM analyses have pointed out that,through modifying deep convection schemes, characteristics associated with wind stress simulated by CGCMs have changed (Guilyardi et al. 2009; Zhang et al. 2009). It is generally accepted that the mechanism of the atmospheric response to changes in SST consists of the Gill mode (Gill 1980) and the Lindzen–Nigam mode (Lindzen and Nigam 1987). To simulate tropical low-level circulation accurately, the Gill mode and the Lindzen–Nigam mode should be combined (Wang and Li 1993). So far, a number of studies have focused on the oceanic dynamics and atmospheric thermodynamic processes (e.g.Lloyd, Guilyardi, and Weller 2011; Bellenger et al. 2013)and, generally, they agree that the SST–cloud shortwave radiance feedback is the main source of erroneous ENSO in CGCMs. However, little research has been devoted to the atmospheric dynamic processes, especially those associated with zonal wind stress. At the same time,since the role of the atmospheric component of CGCMs in shaping the modeled ENSO is dominant (Watanabe et al. 2010; Lloyd, Guilyardi, and Weller 2011), and it is relatively easy to establish a clear causality, analysis of AMIP model performance provides a simple yet powerful way to uncovering the potential source of modeled errors. In this paper, we present an assessment of the basic ENSO-related zonal wind stress response in CMIP5 AMIP simulations and attempt to discern the mechanisms responsible for bias in the simulated stress over the central tropical Pacific.
2. Datasets and methods
The zonal wind stress in 18 atmosphere-only GCMs (Table S1) from CMIP5 AMIP runs is evaluated. Detailed information on the individual models is available in Taylor,Stouffer, and Meehl (2012). For comparison with the model results, wind stress data from the Simple Ocean Data Assimilation (Carton and Giese 2008) are adopted,in which the surface winds are a combination of ERA-40 and Quick Scatterometer satellite data. Observations of precipitation are obtained from the Global Precipitation Climatology Project (Huffman et al. 2009). The validation of sea level pressure uses National Centers for Environmental Prediction–Department of Energy Reanalysis II data(Kanamitsu et al. 2002).
In this study, we consider the period 1979–2008 for all the datasets, with a monthly temporal resolution adopted throughout. The anomalies for all variables are de fined as the deviations from the 1979–2008 climatological mean.Model outputs are examined at native grid resolution and then interpolated to the same grid as observations,to facilitate comparison with the measurement record and assessment of the multi-model means. The selection of El Ni?o and La Ni?a events is based on the threshold of one standard deviation from the wintertime (December–February, DJF) mean Ni?o3.4 index, which is de fined as the area-averaged SST anomaly (SSTA) over the region(5°N–5°S, 170°–120°W). Following this criterion, we find in the observations six El Ni?o events (1982/1983, 1986/1987,1991/1992, 1994/1995, 1997/1998, and 2002/2003) and four La Ni?a events (1988/1989, 1998/1999, 1999/192000,and 2007/2008) during the period 1979–2008. As ENSO events typically peak near the end of the calendar year, we composite during DJF regardless of the event peak, and focus on the performance of the multi-model ensemble(MME) mean.
3. Results
3.1. Southern Oscillation Index in AMIP simulations
During recent decades there has been steady progress in the simulation of ENSO using CGCMs (AchutaRao and Sperber 2002; Randall et al. 2007). One of the typical characteristics of ENSO is a seesaw pattern in sea level pressure,associated with a modulation of the trade winds and a shift in tropical Pacific precipitation. To gain insight into the performance of CMIP5, Figure 1 shows the time series of Southern Oscillation Index (SOI) simulated by the MME,which is one measure of the large-scale fluctuations in air pressure occurring between the western and eastern tropical Pacific (i.e. the state of the Southern Oscillation) during El Ni?o and La Ni?a episodes. As expected, although some of the finer details are not captured, the variation in SOI is reproduced by the MME, with roughly the correct magnitude. For example, the ensemble displays extreme negative SOI values in 1982/1983 and 1997/1998 and exhibits moderate values throughout the year when relatively weak El Ni?o or La Ni?a events develop. The correlation between the MME and observations for SOI is 0.87, and exceeds the 0.05 significance level.
3.2. Responses of zonal wind stress anomalies to El Ni?o and La Ni?a events
As mentioned earlier, zonal wind stress plays an important role in the development of ENSO (Chen et al. 2015; Fedorov et al. 2014). Because the two phases of ENSO, i.e. El Ni?o and La Ni?a, are not mirror images of each other (Burgers and Stephenson 1999; Okumura and Deser 2010; Zhang and Sun 2014; Im et al. 2015), and the relative importance of the physical processes involved in the oscillation may be different, model biases also tend to differ in these two phases, and it is therefore preferable to evaluate related ENSO characteristics in the two phases separately.
Figure 2 presents the composite zonal wind stress anomalies during El Ni?o and La Ni?a events from the MME and observations, separately. In general, the MME displays comparable behavior to the observations.However, although the distribution of the ensemble-mean zonal wind stress anomalies is qualitatively similar to those observed, some differences can be seen: (i) the magnitudes of the ensemble-mean anomalous wind stress for both warm events (area-averaged over (5°N–5°S, 160°–220°E)) and cold events (area-averaged over (5°N–5°S,150°–210°E)) are weaker than their observed counterparts,perhaps indicating that the weak zonal wind stress represented by coupled models and shown by Bellenger et al. (2013) and Abellán, McGregor, and England (2017)do indeed derive from atmospheric model errors; (ii) the location of the wind stress response simulated by the MME is somewhat different from that observed. The main bias associated with warm events in the ensemble is a severe underestimation of westerly (positive) wind stress anomalies over the western and central tropical Pacific. In contrast, the zonal wind stress response shows a further westward extension during the cold phase. Here, we focus on the bias in the intensity of the wind stress response and find that the error associated with warm events is larger than that with cold events. Figure 3(a) shows a quantitative measure of the westerly wind stress anomalies associated with El Ni?o events over the region where the response is evident in the central Pacific (denoted by the solid blue line in Figure 2). Most models tend to underestimate El Ni?o–related wind stress anomalies, and the response intensity of the MME only accounts for about 60% of the observed one. In comparison, the bias in the ensemble-simulated wind stress anomaly associated with La Ni?a events is smaller, with an intensity comparable to that observed(not shown). The reason for the underestimated response in the zonal wind stress anomalies associated with El Ni?o events is analyzed in the next section.
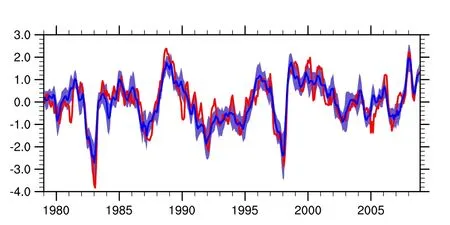
Figure 1. Three-month smoothed time series of Southern Oscillation index (SOI): observation (red curve); MME (blue curve),with blue shading denoting the standard deviation from each MME value, representing the monthly spread and variation across models.Note: The SOI is computed following the method described on the following website: https://www.ncdc.noaa.gov/teleconnections/enso/indicators/soi/.
3.3. Attribution of atmospheric model bias in the zonal wind stress
As is well known, the interannual variability of zonal wind stress is closely related to that of the diabatic heating resulting from convective precipitation (Guilyardi et al.2009; Watanabe et al. 2011). According to the Gill mode(Gill 1980), low-level wind can be driven by diabatic heating, and the response of wind is stronger with more anomalous heating. The relationship between precipitation and zonal wind stress over the tropical Pacific is examined, in which we use precipitation to represent diabatic heating.A scatterplot of the area-averaged precipitation and zonal wind anomalies is provided in Figure 3(a). The precipitation anomalies are averaged over the area where most precipitation anomalies are observed in the central and eastern Pacific,as indicated by the blue frame in Figure 4. As shown in Figure 3(a), the zonal wind stress is positively correlated with the rainfall, with a correlation coefficient of 0.50, exceeding the 0.05 significance level. This illustrates the important role that the Gill mode plays in modulating zonal wind changes. At the same time, it is notable that an apparent discrepancy exists between the simulated and observed precipitation and wind stress in terms of intensity. Specifically, the simulated precipitation anomalies are a little stronger compared to those observed, whereas the simulated wind stress anomalies are much weaker than observed. This discrepancy implies that the mechanism of the zonal wind stress response to the SSTA cannot be as simple as stated above. There must be some other mechanisms involved that in fluence the zonal wind stress over the central Pacific.
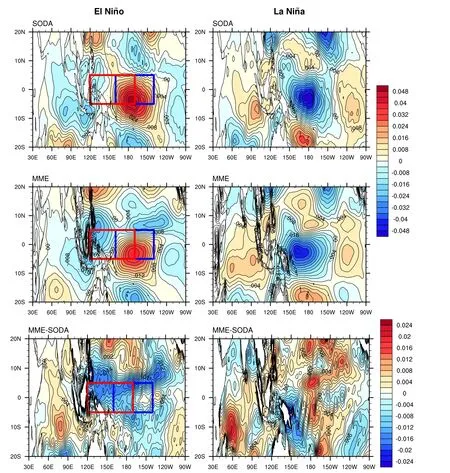
Figure 2. Spatial distributions of composite zonal wind stress anomalies (units: N m?2) during El Ni?o (left column) and La Ni?a (right column) events, from observation (upper panels) and the MME (middle panels), and their differences (lower panels).Notes: The blue frame (5°N–5°S, 160°–220°E) and red frame (5°N–5°S, 120°–190°E) are used in Figure 3(a) and (b) to calculate the correlation between the modeled precipitation and zonal wind stress.
To understand the cause of the opposite model–observation relationship between precipitation and wind stress, we focus on the bias in the simulated precipitation. Several previous CGCM analyses have pointed out the important role played by the Indian Ocean in shaping modeled ENSO characteristics (Kug, Kirtman,and Kang 2006; Santoso, England, and Cai 2012; Wieners,Dijkstra, and de Ruijter 2017), giving us a clue to the potential mechanism responsible for the weaker zonal wind stress. As shown in Figure 4, there are systematically weaker negative precipitation anomalies over the entire eastern Indian Ocean and the Maritime Continent during El Ni?o events. In comparison, the bias in the eastern Indian Ocean is less consistent during La Ni?a events.Of note is that, although both the eastern Indian Ocean and the Maritime Continent have positive precipitation biases, they exert different impacts on the zonal wind stress across the western and central Pacific. As shown in Figure S1, the correlation coefficients over the Indian Ocean are negative, whereas those across the western and central Pacific are positive, with regions over 100°–140°E acting as a transition zone. Accordingly, the main cause of the negative biases in zonal wind stress over the western and central Pacific may be the positive biases across the eastern Indian Ocean in the modeled precipitation anomalies. Using the Center for Ocean–Land–Atmosphere Studies interactive ensemble coupled model, Kug, Kirtman, and Kang (2006) showed that anomalous Indian Ocean warming can induce anomalous easterlies over the western Pacific by in fluencing the Walker circulation. Consistent with these results, in this study, compared with observations, the MME underestimates the negative precipitation anomalies over the eastern Indian Ocean, and at the same time simulates weaker westerly wind anomalies over the western Pacific. To check the relationship between eastern Indian Ocean precipitation and western Pacific Ocean zonal wind stress, we produce scatterplots of these two variables (Figure 3(b)) averaged over regions where their responses are evident, as indicated by the red frames in Figures 2 and 4, respectively. To a large extent, strong precipitation over the eastern Indian Ocean tends to be accompanied by strengthened easterly wind stress in the western tropical Pacific Ocean, as shown in Figure 3(b). The correlation coefficient between these variables is 0.76, which is even larger than that between precipitation and wind stress averaged over the central Pacific.This indicates that the Indian Ocean plays an important role in the ENSO cycle and contributes considerably to the modulation of ENSO variability. The mechanism by which precipitation over the eastern Indian Ocean affects easterly wind stress in the western Pacific Ocean is in exact accordance with the Gill mode, in which eastward Kelvin waves can induce easterly winds east of the heating source region (Gill 1980). In contrast, there is no coherent precipitation anomaly bias across the eastern Indian Ocean during La Ni?a events, which contribute to the better simulation of zonal wind stress in the central Pacific than that during El Ni?o events.
The above analysis explores the causes of the simulated weaker westerly zonal wind stress in the MME over the central Pacific Ocean. This bias may be mainly attributable to the stronger precipitation anomalies simulated across the eastern Indian Ocean. Through the Gill-like mode, positive precipitation anomalies in the central Pacific Ocean induce westerly wind anomalies over the central Pacific, and at the same time the simulated positive precipitation bias in the eastern Indian Ocean causes an easterly wind bias over the western and central Pacific. These two effects counteract each other and eventually contribute collectively to the weaker zonal wind stress anomalies over the central Pacific during El Ni?o events.
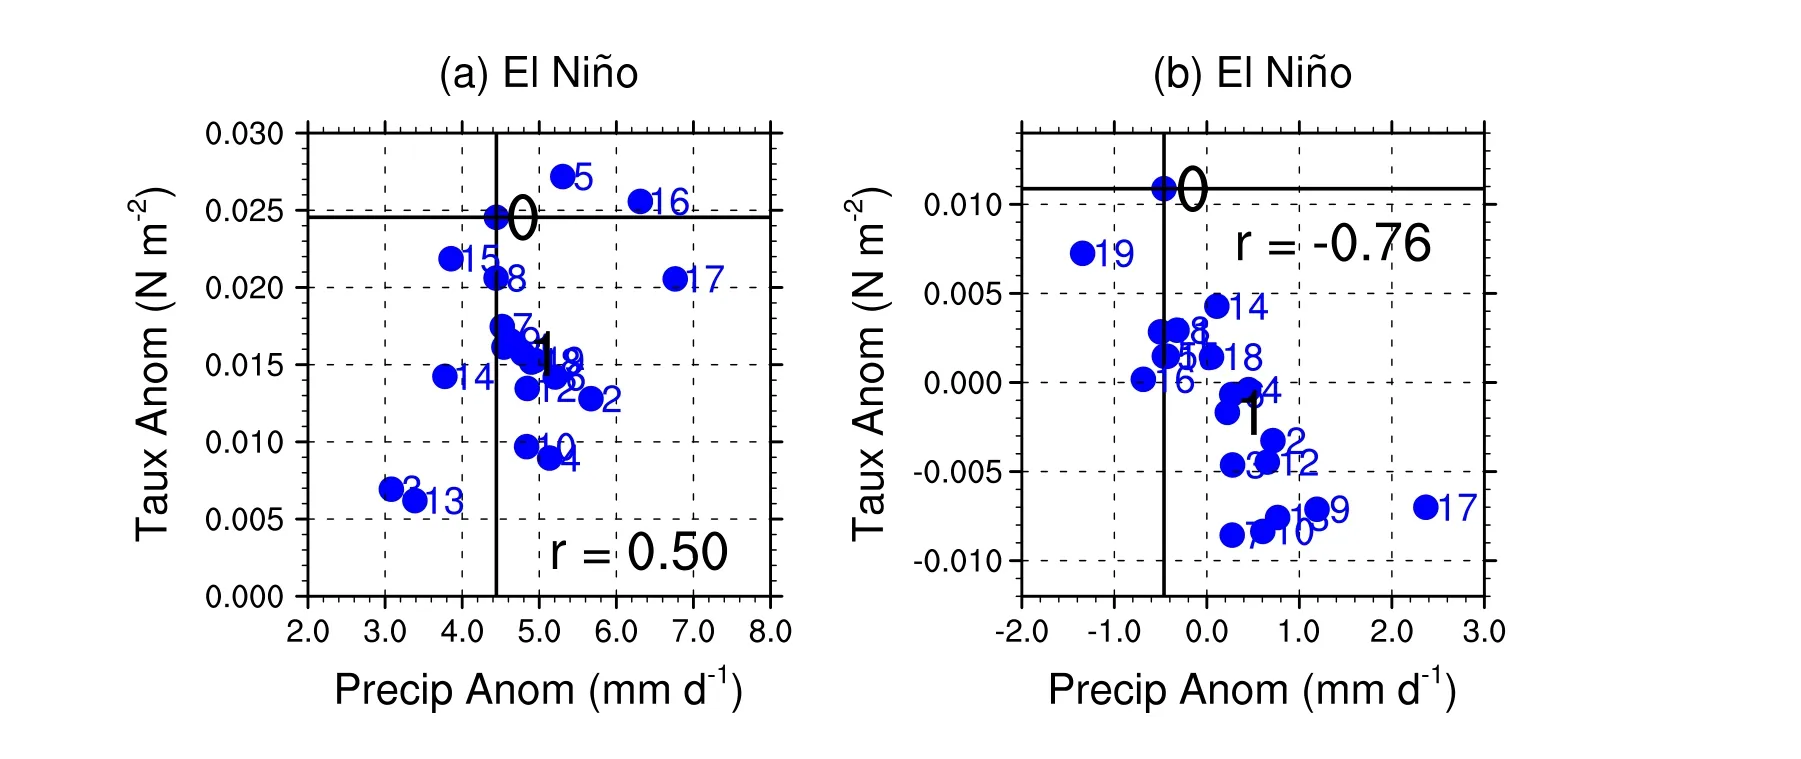
Figure 3. Scatterplot of composite zonal wind stress anomalies and precipitation anomalies from observation and models: (a)precipitation and zonal wind stress in the central Pacific, denoted by the blue frame in Figures 2 and 4, respectively; (b) precipitation in the eastern Indian Ocean and zonal wind stress in the western Pacific Ocean, denoted by the red frame in Figures 2 and 4, respectively.Notes: The horizontal and vertical black solid lines indicate the observed zonal wind stress and precipitation anomalies, respectively. Zero represents observation;1 represents the MME; 2–19 represent the model outputs.

Figure 4. Spatial distributions of composite precipitation anomalies (units: mm d?1) during El Ni?o (left column) and La Ni?a (right column) events, from observation (upper panels) and the MME (middle panels), and their differences (lower panels).Note: The blue frame (5°N–5°S, 170°–240°E) and red frame (5°N–5°S, 80°–100°E) are used in Figure 3(a) and (b) to calculate the correlation between the modeled precipitation and zonal wind stress.
4. Summary and discussion
In this study, the interannual variability of zonal wind stress simulated by the AMIP simulations over the tropical Pacific Ocean is evaluated, and the origin of the associated biases is preliminarily investigated. It is found that, compared with observation, the MME produces weaker zonal wind stress anomalies in response to SST anomalies during both El Ni?o and La Ni?a events, and the model bias in the former is much larger than that in the latter. These findings agree with the results from CGCMs reported by Bellenger et al. (2013) and Abellán, McGregor, and England(2017), indicating that the atmospheric models may play a key role in simulating zonal wind stress anomalies at the interannual timescale. At the same time, the location of the zonal wind stress response differs to the observed one,with a further eastward extension during the warm phase but a further westward extension during the cold phase.The reason for the severely weaker zonal wind stress produced in El Ni?o events is examined and is attributed to the apparent underestimation of negative precipitation anomalies over the eastern Indian Ocean during warm events. According to the Gill mode (Gill 1980), a heating source that is symmetric about the equator will induce low-level easterly flow to the east of it and westerly flow to the west. In this study, precipitation anomalies associated El Ni?o events over the central Pacific result in westerly wind in the central Pacific Ocean, whereas a positive precipitation bias across the eastern Indian Ocean induces easterly wind in the western and central Pacific. These two different responses of zonal wind stress to the prescribed SSTAs cancel each other out to some extent, and ultimately result in the weakened response of westerly wind anomalies to the observed SSTAs over the central Pacific Ocean.Overall, the bias in the simulated zonal wind stress anomalies is much larger during El Ni?o events than during La Ni?a events. The reason is that, during El Ni?o events, most models simulate a large area of weaker negative precipitation anomalies across the eastern Indian Ocean, which has a strong impact on the simulated zonal wind stress anomalies in the central Pacific. In contrast, there is no consistency in the error of simulated precipitation anomalies in the eastern Indian Ocean during La Ni?a events, which has little effect on the simulated zonal wind stress anomaly in the central Pacific.
Given the Indian Ocean dipole (IOD) signal in the observation and model biases shown in Figure 4, we also check whether the performance of the MME changes dramatically with and without IOD occurrence. What we find is that both groups show the typical zonal wind stress response associated with El Ni?o, meaning that–compared to the IOD–El Ni?o events play a dominant role in zonal wind stress anomalies. On the other hand, although a weaker wind stress response over the western and central Pacific can be found in both groups, larger biases exist in the group without IOD occurrence (Figures S2 and S3). One possible explanation is that El Ni?o tends to co-occur with the Indian Ocean basin mode (IOBM) in non-IOD cases, and the IOBM induces stronger easterly anomalies in the western and central Pacific during boreal winter than the IOD (Santoso, England, and Cai 2012), resulting in larger zonal wind stress anomaly biases.
It is important to note that the mechanisms affecting the zonal wind stress response that we talk about in this paper are all related to the Gill mode. However, there may not be a one-to-one correspondence between the heating intensity in the Gill mode and the magnitude of precipitation anomalies. The heating intensity in the Gill mode may be more related to the vertical heating pro file. In addition,the response of zonal wind stress is related not only to diabatic heating but also to the SST gradient (Lindzen and Nigam 1987). Nevertheless, it is difficult to separate their relative roles using GCMs. On the other hand, the present study highlights the importance of representing precipitation in the Indian Ocean precisely in AMIP simulations.However, numerical experiments should be carried out in future to fully understand the mechanism by which precipitation in the Indian Ocean in fluences the zonal wind stress over the Pacific. In addition, the sensitivity of the simulated zonal wind stress to the choice of physical parameterization schemes or the dynamic core of atmospheric models also needs further analysis in future work.
Disclosure statement
No potential conflict of interest was reported by the authors.
Funding
This work was supported by the National Natural Science Foundation of China [grant number 41530426].
References
Abellán, E., S. McGregor, and M. H. England. 2017. “Analysis of the Southward Wind Shift of ENSO in CMIP5 Models.”Journalof Climate30 (7): 2415–2435. doi:10.1175/jcli-d-16-0326.1.
AchutaRao, K., and K. Sperber. 2002. “Simulation of the El Ni?o Southern Oscillation: Results from the Coupled Model Intercomparison Project.”Climate Dynamics19 (3): 191–209.doi:10.1007/s00382-001-0221-9.
Bellenger, H., E. Guilyardi, J. Leloup, M. Lengaigne, and J.Vialard. 2013. “ENSO Representation in Climate Models: From CMIP3 to CMIP5.”Climate Dynamics42 (7–8): 1999–2018.doi:10.1007/s00382-013-1783-z.
Bjerknes, J. 1969. “Atmospheric Teleconnections from the Equatorial Pacific.”Monthly Weather Review97 (3): 163–172.doi:10.1175/1520-0493(1969)097<0163:atftep>2.3.co;2.
Bove, M. C., J. J. O’Brien, J. B. Eisner, C. W. Landsea, and X.Niu. 1998. “Effect of El Ni?o on US Landfalling Hurricanes,Revisited.”Bulletin of the American Meteorological Society79(11): 2477–2482. doi:10.1175/1520-0477(1998)079<2477:eo enoo>2.0.co;2.
Burgers, G., and D. B. Stephenson. 1999. “The “Normality” of El Ni?o.”Geophysical Research Letters26 (8): 1027–1030.doi:10.1029/1999gl900161.
Carton, J. A., and B. S. Giese. 2008. “A Reanalysis of Ocean Climate Using Simple Ocean Data Assimilation(SODA).”Monthly Weather Review136 (8): 2999–3017.doi:10.1175/2007mwr1978.1.
Chen, L., Y. Yu, and D.-Z. Sun. 2013. “Cloud and Water Vapor Feedbacks to the El Ni?o Warming: Are They Still Biased in CMIP5 Models?”Journal of Climate26 (14): 4947–4961.doi:10.1175/jcli-d-12-00575.1.
Chen, D., T. Lian, C. Fu, M. A. Cane, Y. Tang, R. Murtugudde, X.Song, Q. Wu, and L. Zhou. 2015. “Strong In fluence of Westerly Wind Bursts on El Ni?o Diversity.”Nature Geoscience8 (5):339–345. doi:10.1038/ngeo2399.
Chen, L., T. Li, Y. Yu, and S. K. Behera. 2017. “A Possible Explanation for the Divergent Projection of ENSO Amplitude Change under Global Warming.”Climate Dynamics49 (11–12): 3799–3811. doi:10.1007/s00382-017-3544-x.
Fedorov, A. V., S. Hu, M. Lengaigne, and E. Guilyardi. 2014. “The Impact of Westerly Wind Bursts and Ocean Initial State on the Development, and Diversity of El Ni?o Events.”Climate Dynamics44 (5–6): 1381–1401. doi:10.1007/s00382-014-2126-4.
Gill, A. 1980. “Some Simple Solutions for Heat-induced Tropical Circulation.”Quarterly Journal of the Royal Meteorological Society106 (449): 447–462. doi:10.1256/smsqj.44904.
Guilyardi, E., P. Braconnot, F.-F. Jin, S. T. Kim, M. Kolasinski,T. Li, and I. Musat. 2009. “Atmosphere Feedbacks during ENSO in a Coupled GCM with a Modified Atmospheric Convection Scheme.”Journal of Climate22 (21): 5698–5718.doi:10.1175/2009jcli2815.1.
Huffman, G. J., R. F. Adler, D. T. Bolvin, and G. Gu. 2009.“Improving the Global Precipitation Record: GPCP Version 2.1.”Geophysical Research Letters36 (17): 153–159. doi:10.10 29/2009gl040000.
Im, S.-H., S.-I. An, S. T. Kim, and F.-F. Jin. 2015. “Feedback Processes Responsible for El Ni?o-La Ni?a Amplitude Asymmetry.”Geophysical Research Letters42 (13): 5556–5563.doi:10.1002/2015gl064853.
Kanamitsu, M., W. Ebisuzaki, J. Woollen, S.-K. Yang, J. J. Hnilo,M. Fiorino, and G. L. Potter. 2002. “NCEP–DOE AMIP-II Reanalysis (R-2).”Bulletin of the American Meteorological Society83 (11): 1631–1643. doi:10.1175/bams-83-11-1631(2002)083<1631:nar>2.3.co;2.
Kug, J.-S., B. P. Kirtman, and I.-S. Kang. 2006. “Interactive Feedback between ENSO and the Indian Ocean in an Interactive Ensemble Coupled Model.”Journal of Climate19(24): 6371–6381. doi:10.1175/jcli3980.1.
Lai, A. W.-C., M. Herzog, and H.-F. Graf. 2015. “Two Key Parameters for the El Ni?o Continuum: Zonal Wind Anomalies and Western Pacific Subsurface Potential Temperature.”Climate Dynamics45 (11–12): 3461–3480. doi:10.1007/s00382-015-2550-0.
Lindzen, R. S., and S. Nigam. 1987. “On the Role of Sea Surface Temperature Gradients in Forcing Low-level Winds and Convergence in the Tropics.”Journal of the Atmospheric Sciences44 (17): 2418–2436. doi:10.1175/1520-0469(1987)044<2418:otross>2.0.co;2.
Liu, Z., and M. Alexander. 2007. “Atmospheric Bridge, Oceanic Tunnel, and Global Climatic Teleconnections.”Reviews of Geophysics45 (2): RG2005. doi:10.1029/2005rg000172.
Lloyd, J., E. Guilyardi, H. Weller, and J. Slingo. 2009. “The Role of Atmosphere Feedbacks during ENSO in the CMIP3 Models.”Atmospheric Science Letters10 (3): 170–176. doi:10.1002/asl.227.
Lloyd, J., E. Guilyardi, and H. Weller. 2011. “The Role of Atmosphere Feedbacks during ENSO in the CMIP3 Models.Part II: Using AMIP Runs to Understand the Heat Flux Feedback Mechanisms.”Climate Dynamics37 (7–8): 1271–1292. doi:10.1007/s00382-010-0895-y.
McPhaden, M. J., S. E. Zebiak, and M. H. Glantz. 2006. “ENSO as an Integrating Concept in Earth Science.”Science314 (5806):1740–1745. doi:10.1126/science.1132588.
Okumura, Y. M., and C. Deser. 2010. “Asymmetry in the Duration of El Ni?o and La Ni?a.”Journal of Climate23 (21): 5826–5843.doi:10.1175/2010jcli3592.1.
Randall, D. A., R. A. Wood, S. Bony, R. A. Colman, V. Kattsov, A.Pitman, J. Shukla, et al. 2007. “Climate Models and Their Evaluation.” Chap. 8 inClimate Change 2007: The Physical Science basis. Contribution of Working Group I to the Fourth Assessment Report of the IPCC on Climate Change. Cambridge:Cambridge University Press.
Rasmusson, E. M., and T. H. Carpenter. 1982. “Variations in Tropical Sea Surface Temperature and Surface Wind Fields Associated with the Southern Oscillation/El Ni?o.”Monthly Weather Review110 (5): 354–384. doi:10.1175/1520-0493(1982)110<0354:vitsst>2.0.co;2.
Santoso, A., M. H. England, and W. Cai. 2012. “Impact of Indopacific Feedback Interactions on ENSO Dynamics Diagnosed Using Ensemble Climate Simulations.”Journal of Climate25(21): 7743–7763. doi:10.1175/jcli-d-11-00287.1.
Taylor, K. E., R. J. Stouffer, and G. A. Meehl. 2012. “An Overview of CMIP5 and the Experiment Design.”Bulletin of the American Meteorological Society93 (4): 485–498. doi:10.1175/bams-d-11-00094.1.
Wang, B., and T. Li. 1993. “A Simple Tropical Atmosphere Model of Relevance to Short-term Climate Variations.”Journal of the Atmospheric Sciences50 (2): 260–284. doi:10.1175/1520-0469(1993)050<0260:astamo>2.0.co;2.
Wang, C., and J. Picaut. 2004. “Understanding Enso Physics – A Review.” Chap. 2 inEarth’s Climate: The Ocean-Atmosphere Interaction, 21–48. Washington, DC: American Geophysical Union.
Watanabe, M., T. Suzuki, R. O’ishi, Y. Komuro, S. Watanabe,S. Emori, T. Takemura, et al. 2010. “Improved Climate Simulation by MIROC5: Mean States, Variability, and Climate Sensitivity.”Journal of Climate23 (23): 6312–6335.doi:10.1175/2010jcli3679.1.
Watanabe, M., M. Chikira, Y. Imada, and M. Kimoto. 2011.“Convective Control of ENSO Simulated in MIROC.”Journal of Climate24 (2): 543–562. doi:10.1175/2010jcli3878.1.
Wieners, C. E., H. A. Dijkstra, and W. P. de Ruijter. 2017. “The In fluence of the Indian Ocean on ENSO Stability and Flavor.”Journal of Climate30 (7): 2601–2620. doi:10.1175/jcli-d-16-0516.1.
Zhang, W., and F.-F. Jin. 2012. “Improvements in the CMIP5 Simulations of ENSO-SSTA Meridional Width.”Geophysical Research Letters39 (23): L23073. doi:10.1029/2012gl053588.Zhang, T., and D.-Z. Sun. 2014. “ENSO Asymmetry in CMIP5 Models.”Journal of Climate27 (11): 4070–4093. doi:10.1175/jcli-d-13-00454.1.
Zhang, T., D.-Z. Sun, R. Neale, and P. J. Rasch. 2009. “An Evaluation of ENSO Asymmetry in the Community Climate System Models: A View from the Subsurface.”Journal of Climate22(22): 5933–5961. doi:10.1175/2009jcli2933.1.
Zhang, W., F.-F. Jin, J.-X. Zhao, and J. Li. 2013. “On the Bias in Simulated ENSO SSTA Meridional Widths of CMIP3 Models.”Journal of Climate26 (10): 3173–3186. doi:10.1175/jcli-d-12-00347.1.
 Atmospheric and Oceanic Science Letters2018年2期
- Atmospheric and Oceanic Science Letters的其它文章
- On assessing haze attribution and control measures in China
- Preface
- Assessing satellite-derived net surface radiative flux in the Arctic
- Revisiting the intraseasonal, interannual and interdecadal variability of tropical cyclones in the western North Pacific
- Regional earth system modeling: review and future directions
- When and how will the Millennium Silk Road witness 1.5 °C and 2 °C warmer worlds?