
Assessment of the regional source contributions to PM2.5 mass concentration in Beijing
2018-05-24 01:41:42HANXiaoandZHANGMeiGen
HAN Xiao and ZHANG Mei-Gen
aState Key Laboratory of Atmospheric Boundary Layer Physics and Atmospheric Chemistry, Institute of Atmospheric Physics, Chinese Academy of Sciences, Beijing, China; bCollege of Earth Science, University of Chinese Academy of Sciences, Beijing, China
1. Introduction
Particulate matter with an aerodynamic diameter less than 2.5 μm (PM2.5) is the most important atmospheric environmental pollution issue in China (Wang et al. 2014). Even though the average mass burden of PM2.5in 74 pilot cities located in East China has slowly declined following the‘Air pollution prevention action plan’ released by the State Council of China, Beijing, the capital city and a megacity located at the northern tip of the North China Plain (NCP),has still suffered from air quality deterioration in the past few years since 2013 (Guo et al. 2014; Zhu et al. 2016). The atmospheric pollution here has serious adverse effects on public health and visibility and can lead to huge economic losses. For example, the direct cost to health and transportation due to the severe haze event that took place in January 2013 over the NCP was at least 23 billion RMB(Mu and Zhang 2013). Previous studies have shown that the components of PM2.5and its precursors are extremely complex (Yuan et al. 2015; Sun et al. 2016), and the pollutants are emitted from various anthropogenic sources(Xu et al. 2013; Zhao et al. 2015). In addition, the formation of secondary aerosols, which provides about 60% of the contribution to PM2.5concentration in Beijing (Han et al. 2015), includes numerous chemical and microphysical processes. Therefore, it is necessary to identify the major source contributions and draft appropriate PM2.5control strategies to mitigate air pollution in this region.
Several control strategies for improving the air quality have been implemented in Beijing during recent years.As reported by the Beijing Environmental Status Bulletin(http://www.bjepb.gov.cn/bjhrb/xxgk/ywdt/hjzlzk/hjzkgb65/index.html), the emissions of sulfur dioxide (SO2),nitrogen oxides (NOx), and ammonia-nitrogen stably reduced during the past three years, with annual average reductions of 12.38%, 9.57%, and 8.40%, respectively. The annual average mass concentration of PM2.5in Beijing in 2013 was 89.5 μg m?3, which then reduced to 73 μg m?3in 2016. However, the reduction in the ambient PM2.5mass concentration did not exactly coincide with the reduction in emissions during the last three years. The number of serious pollution days was 46 in 2015, which was one more day than in 2014. The indication, therefore, is that the air pollution in this region is probably affected by high emissions combined with complex impact factors, such as the regional transport due to Beijing’s unique geography and distinctive weather patterns (Ren et al. 2003).
Approaches that determine the contributions of sources help with investigating the features of regional transport in the neighboring area of a polluted city. Several studies have applied source apportionment methods,such as Positive Matrix Factorization or Chemical Mass Balance, to identify the source contribution to multiple aerosol components in Beijing (Yu et al. 2013; Yao et al.2016), and have obtained numerous valuable results.Compared with traditional source apportionment analysis,a chemistry and transport model combined with source apportionment technology can be an effective method to reasonably capture the nonlinear interaction among pollutants at high temporal resolution. However, related research using appropriate numerical simulation tools is lacking, and a comprehensive understanding of the source contributions in the NCP has yet to be achieved. Therefore,in the present study, a source apportionment tool, ISAM(Integrated Source Apportionment Method), coupled with a regional air quality modeling system, RAMS-CMAQ(Regional Atmospheric Modeling System and Community Multiscale Air Quality), was applied to provide a high temporal resolution analysis of the contributions from local and regional sources to the PM2.5mass burden in Beijing.
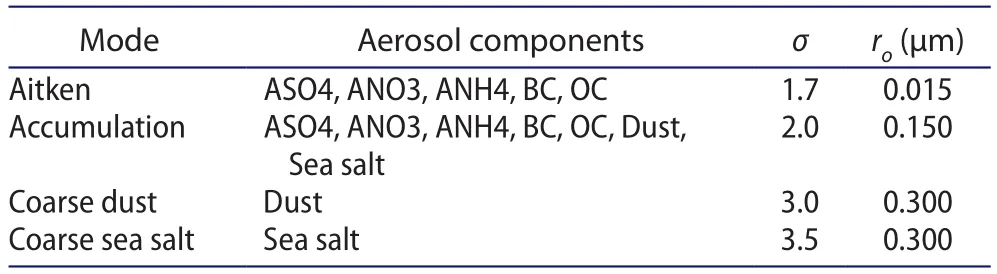
Table 1. Aerosol components, geometric standard deviation (σ),and geometric mean radius (ro) of each size distribution mode.
2. Methods
The RAMS-CMAQ modeling system was used to simulate the transport, transformation and deposition of aerosols and their precursors. The major component of this modeling system is CMAQ (version 5.0.2), released in 2014 by the US Environmental Protection Agency for simulating a variety of environmental issues (Eder and Yu 2006; Mathur et al. 2008) including tropospheric ozone, haze pollution,and acid deposition. In the modeling system, the SAPRC99(Statewide Air Pollution Research Centre) and ISORROPIA(Nenes, Pandis, and Pilinis 1998) schemes were chosen to estimate the gas-phase concentrations and aerosol particles, respectively. The sixth-generation modal CMAQ aerosol model (AERO6) were applied to simulate the gas-phase chemistry mechanisms and formation, dynamic processes of aerosols. The size distributions of aerosols were treated as three modes (Aitken, accumulation, and coarse) following a log normal distribution, as shown in Table 1. The numerical prediction model, RAMS (version 6.0) (Cotton et al. 2003), was coupled with CMAQ offline to provide the meteorological field. The ECMWF reanalysis datasets(spatial resolution: 1° × 1°) were used to supply the background meteorological fields and sea surface temperature.The emissions inventory used was as follows: The anthropogenic emissions of primary aerosols and their precursors were obtained from the latest version (base year: 2012) of the MIX Asian Emissions Inventory developed for MICS-ASIA III (Model Inter-Comparison Study for Asia, phase III) (Lei et al. 2011; Lu, Zhang, and Streets 2011). This is a monthly based inventory, with a spatial resolution of 0.25° × 0.25° and, involves eight types of pollutants: carbon monoxide, NOx, SO2, volatile organic compounds, black carbon (BC), organic carbon (OC), PM2.5,and PM10(coarse particulate matter). Additionally, the NOxand ammonia from agriculture and NOxemissions from aircraft and lightning were provided by REAS (Regional Emissions Inventory in Asia; http://www.jamstec.go.jp/frsgc/research/d4/emission.htm) and the Emissions Database for Global Atmospheric Research (Olivier et al.1994), respectively. The Global Fire Emissions Database,Version 3 (van der Werf et al. 2010), was used for the biomass-burning emissions from forest wild fires, savanna burning, and slash-and-burn agriculture.
A powerful and efficient implementation of ISAM coupled online with CMAQ was used to track the PM2.5from emission regions surrounding Beijing. Compared with its previous version, Tagged Species Source Apportionment(Wang, Chien, and Tonnesen 2009), ISAM improved the approach for the advection of tagged tracers and the tracking of precursor reactions, and increased the flexibility of application by minimizing data preparation (Kwok,Napelenok, and Baker 2013). Brie fly, the major linear processes, including advection transport, vertical diffusion,and dry deposition, were treated as parallel processes based on the CMAQ calculation. An updated piecewise parabolic algorithm was also applied for reasonably estimating the advection flux. The nonlinear processes,including cloud processes, aerosol processes, and wet deposition, were treated as independent mechanisms based on weighting the aerosol generation or scavenging. In addition, the nonlinear gas-phase chemical interactions was difficult in balancing computational efficiency and accuracy. Therefore, a hybrid approach, which employs the direct sensitivity methods as linear equations using Lower Upper decomposition (Yang, Wilkinson, and Russell 1997),was applied in ISAM for solving the variation of tagged bulk concentration. In this study, ISAM was set to track the transport and chemical reactions of the major aerosol components (sulfate, nitrate, ammonium, BC, and OC) and their precursors. The in fluence of the tagged grid could be quantitatively aggregated from the output results of ISAM-CMAQ.
A coarse domain covering East Asia with a total area of 6654 km × 5440 km along with a two-way nested with inner domain (Figure 1) with a 16 km × 16 km resolution was established. The inner domain covered the major regions of the NCP. The simulations used 15 vertical levels,of which nearly half were concentrated in the lowest 2 km,to improve the simulation of the atmospheric boundary layer. In addition, it has been demonstrated that the modeling system performs well when simulating the spatial and temporal distribution of China’s major aerosol components (Han, Zhang, and Tao 2013; Han et al. 2014, 2016).Therefore, we had con fidence in the applicability and reliability of the simulation results obtained in our study.
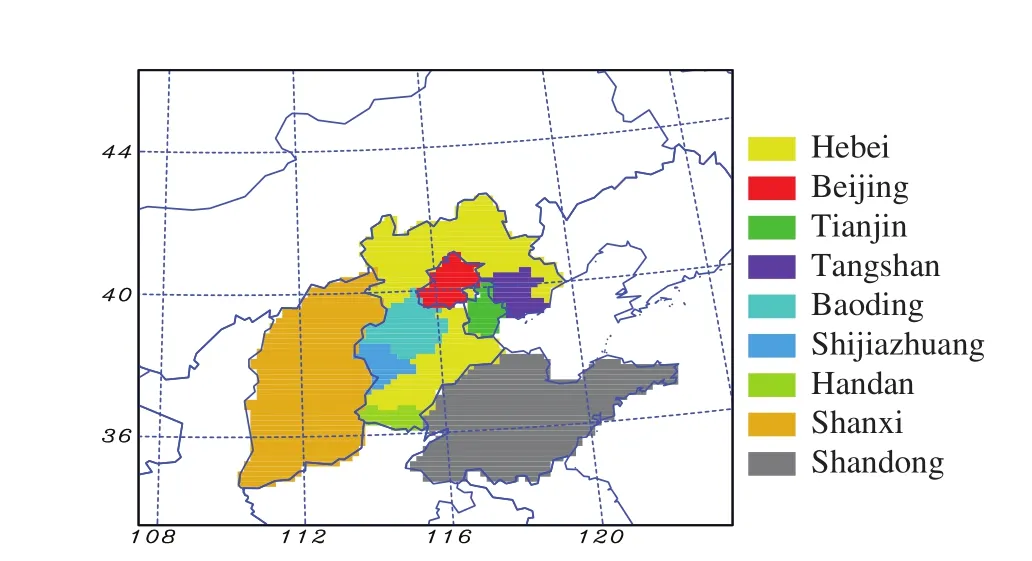
Figure 1. Model domain used in this study and the geographic locations of Hebei, Beijing, Tianjin, Tangshan, Baoding,Shijiazhuang, Handan, Shanxi, and Shandong.
3. Results and discussion
The mass concentrations of the major aerosols (sulfate,nitrate, ammonium, BC, OC, dust, and sea salt) over the NCP in July 2016 were simulated by the modeling system.Figure 2(a) presents the monthly average PM2.5mass burden spatial distribution and surface wind field in July. The air quality remained at Grade II standard (35–75 μg m?3)in Beijing and Tianjin. However, the PM2.5mass concentration was higher than 100 μg m?3in the southern part of Hebei Province and western part of Shandong Province.The southerly wind field dominated the model domain in this month, indicating that air masses could be transported from the polluted regions in the south. Furthermore,Figure 2(b)–(e) show the PM2.5contribution percentage of Beijing, Tianjin, Hebei, Shandong, and Shanxi, respectively.Generally, the PM2.5particles emitted from local sources in Beijing and Tianjin were mainly concentrated in their own urban regions, and the percentage could exceed 30%. The contribution to the PM2.5from Tianjin was higher than 8%in the southern part of Beijing. However, the contribution from Beijing and Tianjin was quite small (lower than 5%) in other regions, which indicated that the in fluence of PM2.5particles from Beijing and Tianjin was probably small over the whole NCP area. The local sources generally provided a contribution of more than 30% in Hebei Province, and the highest values (more than 50%) were mainly concentrated in its southern (Baoding–Shijiazhuang–Handan)and eastern (Tangshan) parts. The mass burden of PM2.5in Beijing was obviously in fluenced by that from Hebei,because the percentage shown in Figure 2(d) reached 20%–30%. However, the PM2.5contribution from Hebei to that in Shandong was generally lower than 5%. As shown in Figure 2(e), the PM2.5mass concentration in Shandong Province was mainly derived from local emissions, and the contribution percentage could exceed 50% over the whole province. This was probably the main reason for the small contribution from other regions. Moreover, the contribution from Shandong to the PM2.5concentration in Beijing was also very strong, and the percentage could reach 10%–15%. On the other hand, the contribution from Shanxi to that in Beijing, Tianjin, and Hebei was very small,and the main reason was probably the barrier to pollutant transport imposed by the Taihang Mountains located in the east of Shanxi Province. In conclusion, the PM2.5mass burden in Beijing was mainly contributed by its own local emissions (10%–40%), but still significantly disturbed by regional transport from other surrounding regions, such as the provinces of Hebei and Shandong.
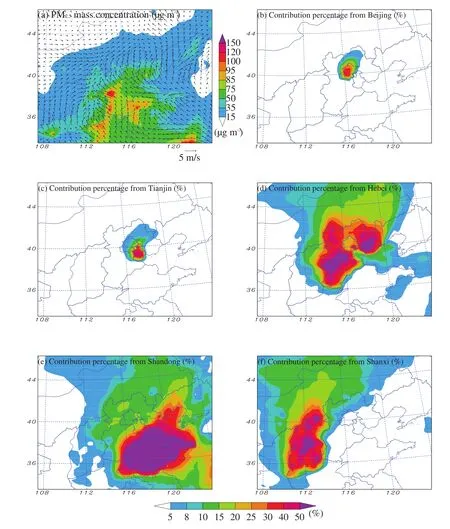
Figure 2. (a) Horizontal distribution of the monthly average mass concentration of PM2.5 and the surface wind field in July 2015. (b–f)Contribution percentage to the PM2.5 mass concentration from Beijing, Tianjin, Hebei, Shandong, and Shanxi.
Figure 3 presents the hourly regional average mass concentration of PM2.5and the contribution from local sources and regional transport (Tianjin, Hebei, Shandong, Shanxi,and other regions) to Beijing in July. Figure 3(a) shows that the mass burden of PM2.5exceeded the clean-air level of 75 μg m?3on several days in July, and the daily variation was also obvious. Even though the monthly average air quality was good, pollution still occurred in almost half of the month. As analyzed above, most of the PM2.5mass burden in Beijing was contributed by pollutants from Hebei,Shandong, Tianjin, and local sources (about 70%). The percentage fluctuated obviously with the diurnal variation of the PM2.5mass concentration. In addition, the aerosols from the provinces of Shandong and Hebei provided the highest contribution to the PM2.5concentration in Beijing in the first half and second half of the month, respectively.This phenomenon was probably caused by the impact of different meteorological fields. Table 2 presents the contribution percentage of the PM2.5mass concentration to Beijing from heavy pollution regions, other background regions, and boundary and initial conditions against backgrounds of clear air, moderate pollution, and serious pollution. The de finitions of the different air quality levels based on the mass concentration of PM2.5were released by the Ministry of Environmental Protection of China, and are as follows: clean air is below 75 μg m?3; moderate pollution is 75–140 μg m?3; and serious pollution is above 140 μg m?3. The regional average contribution in Beijing from local emissions was 20%–25.9%, which was obviously lower than the high value in the urban district. In addition,the contribution from Hebei was comparable with that from the local area (both about 25%) against a clear-air background, and even increased (27.37% against a moderate pollution background and 30.81% against a serious pollution background) when the air quality became worse in Beijing. This phenomenon also occurred for the contribution from Shandong, Tianjin, and Shanxi. The percentage for Shandong and Tianjin increased from 11.89% to 15.94% and 8.45% to 12.33%, respectively, when the air quality changed from clean air to serious pollution. On the other hand, the local contribution in Beijing reduced to its lowest value of 20.01% against the serious pollution background. The percentage of the contribution from other clean regions also reduced, from 15.17% to 8.39%.These findings suggest important roles played by the PM2.5emissions of surrounding pollution regions in affecting the air quality of Beijing during pollution periods.
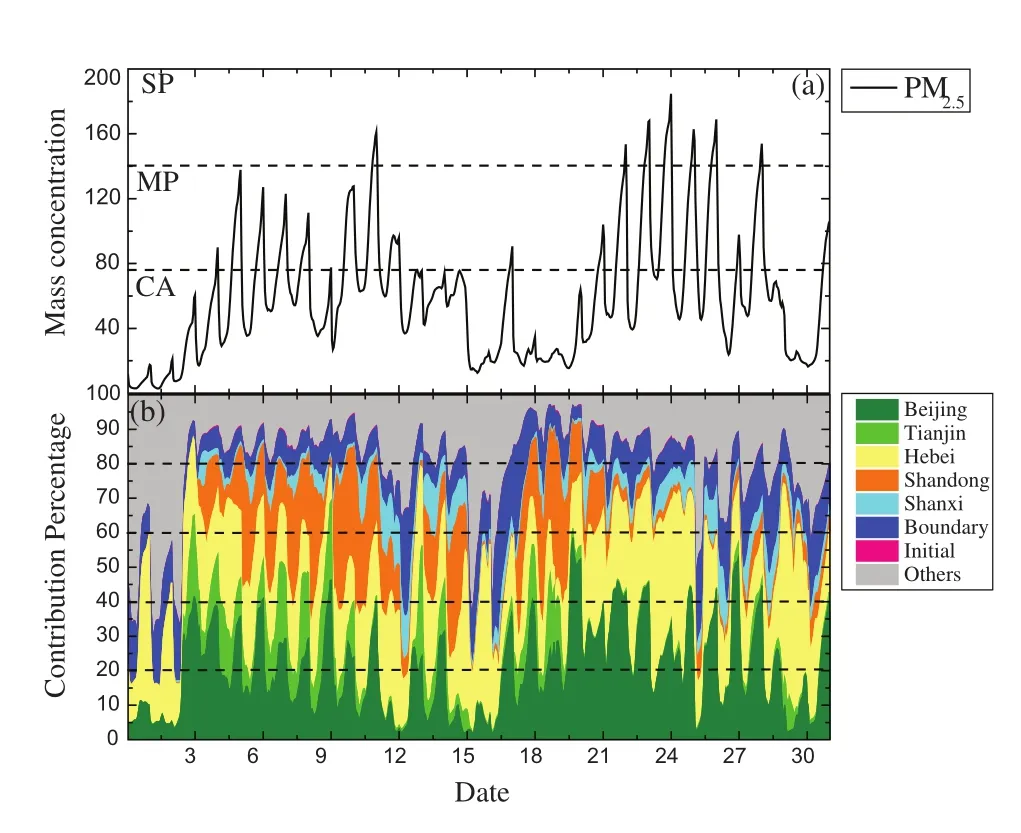
Figure 3. (a) Time series of the regional average PM2.5 mass concentration (μg m?3, in which CA, MP and SP represent clear air, moderate pollution, and serious pollution, respectively. (b)Contribution percentage (% to the PM2.5 mass concentration from local and regional transport sources.
4. Conclusions
A source apportionment tool, ISAM, coupled with an air quality modeling system, RAMS-CMAQ, was applied to simulate the aerosol mass concentrations and investigate the contribution features of regional transport to the PM2.5mass burden in Beijing. All major aerosol components were considered in the modeling system, and the contributions from local and surrounding sources (Tianjin,Hebei, Shandong, and Shanxi) to Beijing were estimated and analyzed.
The simulation results indicated that the in fluence of PM2.5particles emitted from Beijing and Tianjin mainly concentrated in their own urban areas, and the major contributors to the PM2.5mass concentration in the NCP were the emissions from Hebei and Shandong. At least 30% of the PM2.5mass concentration in the NCP was provided by the sources in these two provinces. However, the contribution from Shanxi province was very low due to the barrier of the Taihang Mountains. Focusing on Beijing, the effect of emissions control strategies executed in recent years was obvious, and the local contribution to the PM2.5concentration in July was just 20%–30%. In addition, the southerly wind, which can carry pollutants from the southern regions, was an important factor impacting the aerosol loading in Beijing. About 50% of the PM2.5mass concentration was contributed by the regional transport from Hebei,Shandong, and Tianjin. The most important surrounding contributor to the PM2.5mass concentration in Beijing was Hebei, which contributed more than 25%. Considering the hourly variation, the contribution percentage varied significantly with the mass burden of PM2.5. An important phenomenon was that the contribution from surrounding regions enhanced obviously when the air quality became worse, indicating regional transport provides more to the PM2.5mass burden against a pollution background in Beijing. Therefore, it is suggested that regional-scale collaborations should be implemented based not only on abating local emissions, but also the coordinated control of emissions from surrounding areas, especially during pollution periods in Beijing.
In future work the modeling system will be used to provide detailed information on the components of Beijing’s PM2.5pollution. In addition, the nonlinear relationships between secondary aerosols and their precursors should be investigated to clarify the contributions from surrounding regions and explore more effective strategies to improve the air quality and prevent the occurrence of haze in Beijing.
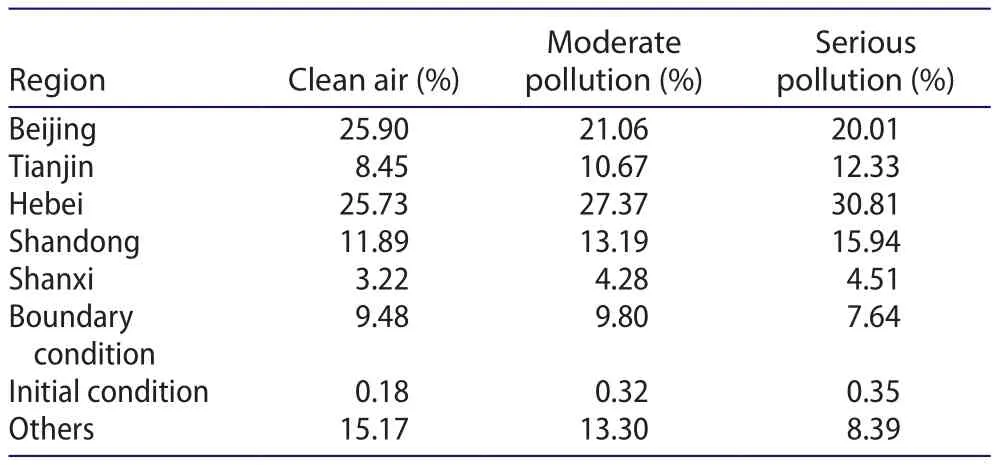
Table 2. Contribution percentages of the PM2.5 mass concentration to Beijing from several regions against different air quality backgrounds.
Disclosure statement
No potential conflict of interest was reported by the authors.
Funding
This work was supported by the National Basic Research Program of China [grant number 2014CB953802]; the National Natural Science Foundation of China [grant number 91544221],[grant number 41475098]; and the Russian Scientific Fund[grant number 14-47-00049].
References
Cotton, W., R. Pielke, G. Walko, G. Liston, C. Tremback, H. Jiang, R.McAnelly, et al. 2003. “RAMS 2001: Current Status and Future Directions.”Meteorology and Atmospheric Physics82: 5–29.
Eder, B., and S. Yu. 2006. “An Evaluation of Model Performance of EPA Models-3/CMAQ.”Atmospheric Environment40: 4811–4824.
Guo, S., M. Hu, M. Zamora, J. Peng, D. Shang, J. Zheng, Z. Du, et al. 2014. “Elucidating Severe Urban Haze Formation in China.”Proceedings of the National Academy of Sciences111: 17373–17378.
Han, L., S. Cheng, G. Zhuang, H. Ning, H. Wang, W. Wei, and X.Zhao. 2015. “The Changes and Long-Range Transport of PM2.5in Beijing in the past Decade.”Atmospheric Environment110:186–195.
Han, X., M. Zhang, J. Gao, S. Wang, and F. Chai. 2014. “Modeling Analysis of the Seasonal Characteristics of Haze Formation in Beijing.”Atmospheric Chemistry and Physics14: 10231–10248.Han, X., M. Zhang, and J. Tao. 2013. “Modeling Aerosol Impacts on Atmospheric Visibility in Beijing with RAMS-CMAQ.”Atmospheric Environment72 (2): 177–191.
Han, X., M. Zhang, L. Zhu, and A. Skorokhod. 2016. “Assessment of the Impact of Emissions Reductions on Air Quality over North China Plain.”Atmospheric Pollution Research7 (2): 249–259.
Kwok, R., S. Napelenok, and K. Baker. 2013. “Implementation and Evaluation of PM2.5Source Contribution Analysis in a Photochemical Model.”Atmospheric Environment80: 398–407.
Lei, Y., Q. Zhang, K. He, and D. Streets. 2011. “Primary Anthropogenic Aerosol Emission Trends for China, 1990–2005.”Atmospheric Chemistry and Physics11: 931–954.
Lu, Z., Q. Zhang, and D. Streets. 2011. “Sulfur Dioxide and Primary Carbonaceous Aerosol Emissions in China and India, 1996–2010.”Atmospheric Chemistry and Physics11: 9839–9864.
Mathur, R., S. Yu, D. Kang, and K. Schere. 2008. “Assessment of the Winter-Time Performance of Developmental Particulate Matter Forecasts with the Eta-CMAQ Modeling System.”Journal of Geophysical Research113: D02303.
Mu, Q., and S. Zhang. 2013. “An Evaluation of the Economic Loss due to the Heavy Haze during January 2013 in China.”China Environmental Sciences11: 034.
Nenes, A., S. N. Pandis, and C. Pilinis. 1998. “ISORROPIA: A New Thermodynamic Equilibrium Model for Multiphase Multicomponent Inorganic Aerosols.”Aquatic Geochemistry4: 123–152.
Olivier, J., A. Bouwman, C. Maas, and J. Berdowski. 1994.“Emission Database for Global Atmospheric Research.”Environmental Monitoring and Assessment31: 93–106.
Ren, Z., Q. Gao, F. Su, Y. Wang, Z. Zhang, and X. Yang. 2003. “The Regional Characteristics of the Atmospheric Environment and the Impact of Dust Storm in Beijing.”Engineering Sciences5: 49–56. (in Chinese).
Sun, Y., Q. Jiang, Y. Xu, and Z. Li. 2016. “Aerosol Characterization over the North China Plain: Haze Life Cycle and Biomass Burning Impacts in Summer.”Journal of Geophysical Research121 (5): 2508–2521.
Wang, Z., C. Chien, and G. Tonnesen. 2009. “Development of a Tagged Species Source Apportionment Algorithm to Characterize Three-Dimensional Transport and Transformation of Precursors and Secondary Pollutants.”Journal of Geophysical Research114: D21206.
Wang, Y., L. Yao, L. Wang, Z. Liu, D. Ji, G. Tang, J. Zhang, et al. 2014.“Mechanism for the Formation of the January 2013 Heavy Haze Pollution Episode over Central and Eastern China.”Science China Earth Science57 (1): 14–25.
van der Werf, G., J. Randerson, L. Giglio, G. Collatz, M. Mu, P.Kasibhatla, D. Morton, et al. 2010. “Global Fire Emissions and the Contribution of Deforestation, Savanna, Forest,Agricultural, and Peat Fires (1997–2009).”Atmospheric Chemistry and Physics10: 11707–11735.
Xu, W., C. Zhao, L. Ran, Z. Deng, N. Ma, P. Liu, W. Lin, et al. 2013.“A New Approach to Estimate Pollutant Emissions Based on Trajectory Modeling and Its Application in the North China Plain.”Atmospheric Environment71: 75–83.
Yang, Y., J. Wilkinson, and A. Russell. 1997. “Fast, Direct Sensitivity Analysis of Multi-Dimensional Photochemical Models.”Environmental Sciences Technology31 (10): 2859–2868.
Yao, L., L. Yang, Q. Yuan, C. Yan, C. Dong, C. Meng, X. Sui, et al.2016. “Sources Apportionment of PM2.5in a Background Site in the North China Plain.”Science of the Total Environment541:590–598.
Yu, L., G. Wang, R. Zhang, L. Zhang, Y. Song, B. Wu, X. Li, et al.2013. “Characterization and Source Apportionment of PM2.5in an Urban Environment in Beijing.”Aerosol and Air Quality Research13 (2): 574–583.
Yuan, Q., W. Li, S. Zhou, L. Yang, J. Chi, X. Sui, and W. Wang. 2015.“Integrated Evaluation of Aerosols during Haze-Fog Episodes at One Regional Background Site in North China Plain.”Atmospheric Research156: 102–110.
Zhao, H., Q. Zhang, D. Guan, S. Davis, Z. Liu, H. Huo, J. Lin, et al.2015. “Assessment of China’s Virtual Air Pollution Transport Embodied in Trade by Using a Consumption-Based Emission Inventory.”Atmospheric Chemistry and Physics15 (12): 5443–5456.
Zhu, X., G. Tang, B. Hu, L. Wang, J. Xin, J. Zhang, Z. Liu, et al. 2016.“Regional Pollution and Its Formation Mechanism over North China Plain: A Case Study with Ceilometer Observations and Model Simulations.”Journal of Geophysical Research121:14574–14588.
 Atmospheric and Oceanic Science Letters2018年2期
- Atmospheric and Oceanic Science Letters的其它文章
- On assessing haze attribution and control measures in China
- Preface
- Assessing satellite-derived net surface radiative flux in the Arctic
- Revisiting the intraseasonal, interannual and interdecadal variability of tropical cyclones in the western North Pacific
- Regional earth system modeling: review and future directions
- When and how will the Millennium Silk Road witness 1.5 °C and 2 °C warmer worlds?