
Changes in Global Vegetation Distribution and Carbon Fluxes in Response to Global Warming: Simulated Results from IAP-DGVM in CAS-ESM2※
2022-07-13 06:20:36XiaofeiGAOJiawenZHUXiaodongZENGMinghuaZHANGYongjiuDAIDuoyingJIandHeZHANG
Advances in Atmospheric Sciences 2022年8期
Xiaofei GAO , Jiawen ZHU , Xiaodong ZENG,3 , Minghua ZHANG ,Yongjiu DAI , Duoying JI , and He ZHANG
1International Center for Climate and Environment Sciences,Institute of Atmospheric Physics,Chinese Academy of Sciences,Beijing 100029,China
2University of Chinese Academy of Sciences,Beijing 100049,China
3Collaborative Innovation Center on Forecast and Evaluation of Meteorological Disasters,Nanjing University of Information Science and Technology,Nanjing 210044,China
4School of Marine and Atmospheric Sciences,Stony Brook University,NY 11790,USA
5School of Atmospheric Sciences,Sun Yat-Sen University,Guangzhou 510275,China
6College of Global Change and Earth System Science,Beijing Normal University,Beijing 100875,China
ABSTRACT Terrestrial ecosystems are an important part of Earth systems, and they are undergoing remarkable changes in response to global warming. This study investigates the response of the terrestrial vegetation distribution and carbon fluxes to global warming by using the new dynamic global vegetation model in the second version of the Chinese Academy of Sciences(CAS) Earth System Model (CAS-ESM2). We conducted two sets of simulations, a present-day simulation and a future simulation, which were forced by the present-day climate during 1981-2000 and the future climate during 2081-2100,respectively, as derived from RCP8.5 outputs in CMIP5. CO2 concentration is kept constant in all simulations to isolate CO2-fertilization effects. The results show an overall increase in vegetation coverage in response to global warming, which is the net result of the greening in the mid-high latitudes and the browning in the tropics. The results also show an enhancement in carbon fluxes in response to global warming, including gross primary productivity, net primary productivity, and autotrophic respiration. We found that the changes in vegetation coverage were significantly correlated with changes in surface air temperature, reflecting the dominant role of temperature, while the changes in carbon fluxes were caused by the combined effects of leaf area index, temperature, and precipitation. This study applies the CAS-ESM2 to investigate the response of terrestrial ecosystems to climate warming. Even though the interpretation of the results is limited by isolating CO2-fertilization effects, this application is still beneficial for adding to our understanding of vegetation processes and to further improve upon model parameterizations.
Key words: global warming,vegetation distribution,carbon flux,leaf area index,surface air temperature
1.Introduction
Terrestrial ecosystems are an important part of Earth systems. They regulate the exchanges of energy and water mass between the land surface and atmosphere via evapotranspiration and provide organic carbon via photosynthesis.The change in terrestrial ecosystems is tightly coupled with climate, which is undergoing significant warming (Diffenbaugh and Field, 2013; Zhu et al., 2016; Yin et al., 2018;Liu et al., 2019). How terrestrial ecosystems respond to global warming has been a hot research topic as the responses are of great significance for accurately projecting future vegetation dynamics and climate change (Woodward and Williams, 1987; Nemani et al., 2003; Schaphoff et al.,2016; Eric Dusenge et al., 2019; Fan and Fan, 2019).
In response to global warming, land vegetation distribution and productivity have shown considerable changes over the past few decades (Cramer et al., 2001; Fraser et al.,2011; Cao et al., 2019). One of the significant changes is a poleward “greening” expansion in the middle and high latitudes (Sturm et al., 2001; Walker et al., 2006; Bi et al.,2013; Mao et al., 2016; Zhu et al., 2016; Piao et al., 2020;T?mmervik and Forbes, 2020). For example, forests in Europe were projected to expand northward and contribute to a shrinkage of the tundra area (Shiyatov et al., 2005;Frost and Epstein, 2014; Kreplin et al., 2021), with a similar expansion found in North America (Field et al., 2007, Yu et al., 2014). In Northeast China, Hu et al. (2021) found obvious vegetation greening. The results shown by Madani et al.(2020) indicated an increasing trend in annual gross primary productivity (GPP) in the northern tundra and boreal ecosystems. The greening of Arctic ecosystems has shown increased biomass and abundance in boreal shrubs (Myers-Smith et al., 2011, 2020; Mekonnen et al., 2021). Several studies have reported that warming is a key factor that accelerates the “greening” by enhancing vegetation photosynthesis and extending the length of the growing season (Piao et al.,2007; Andreu-Hayles et al., 2011; Keenan and Riley, 2018).In the tropics, the response of vegetation to warming is different from that found in mid-high latitudes (Corlett, 2011). Several studies have shown a decrease in the tropical forest growth rate and productivity in response to warming, which could be the consequence of a reduction in leaf photosynthesis under higher temperatures (Clark et al., 2003; Doughty and Goulden, 2008; Gao et al., 2019; Huang et al., 2019). The decrease in the availability of water associated with higher temperatures is reported to result in a decrease in leaf area index (LAI) and net primary productivity (NPP) in the Amazon and South Africa and a decrease in forest coverage in central and southern Mexico (Mackay, 2008; Yu et al., 2014;Gang et al., 2017). These studies all indicate that terrestrial ecosystems have undergone remarkable changes in vegetation distribution and productivity due to global warming,and these changes will continue should global warming continue in the future.
Dynamic Global Vegetation Models (DGVMs) have recently become widely used tools to investigate and predict the responses of terrestrial ecosystems to future climate change. They can simulate and project the patterns, dynamics and structure, and biogeochemical cycles of vegetation under past, present, and future climatic conditions (Scheiter et al., 2013; Smith et al., 2014). Many DGVMs have been used to run offline simulations with different climatic scenarios to predict the responses of vegetation to changes in climate or atmospheric CO2(Woodward and Lomas, 2004; Shafer et al., 2015; Zhang et al., 2015). In addition, some DGVMs are coupled with general circulation models (GCMs) to investigate interactions between vegetation dynamics and climate change (Raddatz et al., 2007; Brovkin et al., 2009; Quillet et al., 2010; Hawkins et al., 2019; Wu et al., 2019; Arora et al.,2020; Yu et al., 2021).
However, the simulated vegetation responses to climate change by DGVMs remain uncertain (Prentice et al., 2007;Sitch et al., 2008; Liu et al., 2018; Sulman et al., 2019;Scheiter et al., 2020; Horvath et al., 2021). Falloon et al.(2012) reported that DGVMs simulated different, and even opposite, vegetation changes in the northern high latitudes in response to climate change. In the North China Plain, the predicted potential vegetation is bare ground, whereas, in fact, it is dominated by irrigated cropland (Kang and Eltahir,2018). South Asian savanna ecosystems are often misinterpreted by DGVMs as degraded forests (Kumar and Scheiter,2019). In addition, the estimation of GPP often differed among DGVMs (McGuire et al., 2001; Jung et al., 2007;Piao et al., 2013; Anav et al., 2015) due to different representations of ecological processes and parameter uncertainties(Knorr and Heimann, 2001; Gurney et al., 2004; De Kauwe et al., 2014). Gang et al. (2017) argued that large uncertainties among DGVMs may relate to the differences in recognition of the vegetation types and the land surface processes that evolved. These reported uncertainties reflect the complexity of the vegetation response to climate change, and thus more investigation is needed to better understand vegetation processes and parameterizations in DGVMs.
A new DGVM developed at the Institute of Atmospheric Physics (IAP-DGVM; Zeng et al., 2014) was coupled with the second version of the Chinese Academy of Sciences Earth System Model (CAS-ESM2). The coupled results showed a good performance in reproducing the present-day vegetation distribution and carbon fluxes (Zhu et al., 2018b).In addition, the IAP-DGVM simulated a positive trend in LAI over northern mid-high latitudes during the period 1972-2004, which was consistent with that of LAI3g, with a significant correlation coefficient of 0.48 (Prob<0.05,where Prob is the probability of statistical significance of the linear correlation coefficient) (Fig. S1 in the Electronic Supplementary Materials). This consistency illustrates that the IAP-DGVM has a good ability to reproduce the greening trend of vegetation over northern mid-high latitudes in response to climate change during the historical period.Thus, this study focuses on the IAP-DGVM projections of vegetation distribution and carbon fluxes in response to global warming in the future. To narrow down the uncertainties in the forcing datasets, we present a method (see section 2) that is used to produce the forcing datasets based on multi-model outputs from the Coupled Model Intercomparison Project Phase 5 (CMIP5) instead of using them directly.Here, we report the simulated changes in vegetation distribution and carbon fluxes in response to global warming, and more importantly, we further investigate the dominant driver of the changes and discuss the underlying causes.The investigation will support a better understanding of vegetation processes, and in doing so, contribute to future improvements of the model parameterizations. Moreover, the results provide a valuable sample for comparison not only for the CAS-ESM2 community but also for other model communities.
The remainder of this paper is organized as follows. Section 2 describes the model physics and experimental design,section 3 presents the results of the experiment, section 4 provides a discussion and interpretation of results, and section 5 provides a brief summary.
2.Model description and experimental design
2.1.Model description
The IAP-DGVM, which was first released in 2014(Zeng et al., 2014), was used in this study. The IAP-DGVM classifies natural plants into 14 plant functional types (PFTs)and does not currently simulate crops (Table S1 in the ESM). The vegetation model has made significant developments that mainly include the shrub sub-model (Zeng et al.,2008; Zeng, 2010), the process-based fire parameterization of intermediate complexity (Li et al., 2012), and the new establishment and competition parameterization schemes(Song et al., 2016). These characteristics improve the performance of the IAP-DGVM in simulating the fractional coverage of present-day vegetation and land carbon fluxes (Zeng,2010; Zeng et al., 2014; Zhu et al., 2018b). Thus, the IAPDGVM has been coupled with the CAS-ESM2 to investigate vegetation-climate interactions (Zhu et al., 2018a; Zhang et al., 2020).
2.2.Experimental design
This study aims to investigate the possible changes in vegetation distribution and carbon fluxes under global warming. The scenario corresponding to the Representative Concentration Pathway 8.5 (RCP8.5) was selected to represent a possible scenario of future global warming and the climate for the period 2081-2100 to represent the future climate.We downloaded atmospheric forcing variables, six-hourly precipitation and solar radiation, three-hourly surface air temperature, surface pressure, specific humidity, and wind, from outputs of historical and RCP8.5 simulations of the 16 models that are participating in the Coupled Model Intercomparison Project Phase 5 (CMIP5) (Table S2 in the ESM). We recalculated the RCP8.5 outputs as the following.

This study conducted a few simulations, including the spin-up simulation (Fig. S2). We first ran a global spin-up simulation by driving the IAP-DGVM from a bare ground condition for 660 model years to approach an equilibrium state by cycling the atmospheric forcing data during the period 1972-2004 from Qian et al. (2006). Then, we further conducted two sets of simulations, the present-day simulation(hereafter Pre) and the future simulation (hereafter RCP8.5).The Pre simulation was forced by the atmospheric data during 1972-2004 from Qian et al. (2006) and ran for 33 model years, while the RCP8.5 simulations were forced by the recalculated datasets described above and ran for 600 model years to approach another equilibrium state. We compared the results between the Pre simulation for the period 1981-2000 and the RCP8.5 simulations for the period 2081-2100. To investigate the effects of climate factors on vegetation dynamics, we fixed atmospheric CO2concentration at a constant value of 367.00 ppm in all simulations to isolate the effects of CO2fertilization. All the simulations were run with a T85 resolution (128 × 256 grid cells).Finally, we obtained future changes in vegetation distribution and carbon fluxes from the differences between the results of one present-day simulation and 16 RCP8.5 simulations.To reduce the effects of cropland, we weighted the vegetation coverage by a factor of (100% -FCcrop) in each grid cell,where FCcroprepresents the fractional coverage of crops in CLM surface dataset (Zeng et al., 2014).
3.Results
3.1.Surface climate change
The projected future land surface shows an overall warm and wet change relative to the present day (Fig. 1).Globally, the annual mean surface air temperature in the future is 4.87±1.14 K higher than that in the present day.The positive temperature anomalies are stronger over northern high latitudes than in other regions and are projected by all 16 selected models (Fig. 1a). Meanwhile, the projected global mean precipitation is 0.45±0.07 mm d-1higher than that in the present day. The positive precipitation anomalies are more pronounced in several regions, such as western and eastern North America, Europe, northeast and southeast Asia, equatorial Africa, and southern South America. In contrast, negative precipitation anomalies are seen over the Amazon, however, it is worth noting that the Amazon region shows larger uncertainties for projected precipitation among the models than do other regions (Fig. 1b). These climate anomalies are qualitatively consistent with a large body of published studies that reported future predictions of global warming and the possible drying of tropical regions in the future (Yu et al., 2014; Yin et al., 2018; T?mmervik and Forbes, 2020; Wibowo et al., 2020).

Fig. 1 Projected future changes of (a) annual surface air temperature (K) and (b)precipitation (mm d-1) based on the 16 CMIP5 models. The stippled regions represent grids where at least 14 of 16 models agree with the multi-model ensemble mean.
3.2.Vegetation distribution
We first analyzed the changes in vegetation distributions for the four aggregated vegetation types (trees, shrubs,grasses, and bare ground) between the RCP8.5 experiments and the present-day experiment. In general, there is a greening anomaly in the middle and high latitudes of the northern hemisphere (30°N-90°N) with 10.10% more projected vegetation. Trees and grasses contribute the most to the positive anomaly, while shrubs show a negative anomaly (Table 1).In contrast, there is a slight negative anomaly in the tropics(30°S-30°N) with 3.72% less projected vegetation. Grasses and shrubs contribute the most to the negative anomaly,while trees show almost no changes (Table 1).
Figure 2 shows a poleward expansion of the projected vegetation. The vegetation-growing regions in the RCP8.5 experiments are farther north than those in the present-day experiment, with 10°, 5°, and 7° for trees, shrubs, and grasses, respectively. The spatial distribution shows that the poleward expansion mainly occurred in northern Canadaand Siberia for trees and grasses, and in northeastern Canada for shrubs (Fig. S3 in the ESM). These results are qualitatively consistent with previous studies based on other multiple GCMs (Alo and Wang, 2008; Yu et al., 2014;Gang et al., 2017) and with some observational-based studies(Speed et al., 2010; Vickers et al., 2016), indicating a poleward expansion of vegetation over mid-high latitudes in the future.

Table 1. The changes of trees, shrubs, and grasses between RCP8.5 experiments and the present-day experiment in 30°-90°N and 30°S-30°N, respectively.

Fig. 2 Differences in fractional coverage (units: %) of (a) trees, (c) shrubs, (e) grasses, and (g) bare ground between the present-day experiment (Pre) and the RCP8.5 experiments (RCP8.5) (RCP8.5 minus Pre). The stippled regions represent grids where at least 14 of 16 models agree with the multi-model ensemble mean. (b),(d), (f), and (h) are the zonal average fractional coverage (units: %) of trees, shrubs, grasses, and bare ground in Pre (blue) and RCP8.5 (red). The shaded red areas represent one standard deviation.
The changes in vegetation distribution can be seen more directly by an estimation of the differences in the four aggregated vegetation types between the two scenarios(Fig. 2). Over northern mid-high latitudes, the increase in trees in the RCP8.5 experiments occurs mainly in Alaska,eastern Canada, and Siberia. However, a decrease in trees is also seen in central Canada, Western Siberia, and Northeast China. The decreased shrubs mainly occurred in northwestern Canada, western America, and eastern Siberia; these areas are replaced by increased grasses. Over the tropics, grasses and shrubs decreased mainly in tropical Africa and Australia, with reductions of 8.57% and 3.00%, respectively(Fig. 2). Trees in tropical America decreased by 4.89%,even though, on the whole, tropical trees showed almost no changes. Figure 2 also illustrates that the changes in the projected vegetation in the above-mentioned regions are consistent among the selected 16 models.
To figure out the contribution of each PFT to the four aggregated vegetation types, we further compared the fractional coverage of vegetation at the PFT level in the two scenarios (Fig. 3). The increased trees are shown in Fig. 2. The dominant contribution of these trees comes from the category of “broadleaf deciduous temperate tree” (BDM; 3.37%),while the “needleleaf evergreen boreal tree” (NEB) makes the largest negative contribution of -1.13%. The decreased shrubs in the future are dominated by reductions in“broadleaf deciduous boreal shrub” (BDBsh; -5.18%). For the increased grasses, positive contributions are mainly from “C3 arctic grass” (C3Ar; 3.74%) and “C3 non-arctic grass” (C3NA; 4.17%), but “C4 grass” (C4) makes a negative contribution of -2.01%. The six mentioned PFTs show the largest sensitivities to global warming and are the main contributors to the global vegetation changes.
3.3.LAI
Over the whole globe, the projected LAI in the RCP8.5 experiments increased by 0.65±0.30 m2m-2, relative to the present-day experiment. This increase is seen over most latitudes, especially in the middle and high latitudes (Fig. 4b).Figure 4a shows the spatial pattern of the differences in LAI between the RCP8.5 experiments and the present-day experiment. Over the northern mid-high latitudes, the increased LAI mainly occurred in Alaska, eastern Canada, central North America, and eastern Siberia, with more than 2.00 m2m-2. However, a strong decrease in LAI is also seen in central Canada, Western Siberia, and Northeast China,which correspond to the regions that show a projected replacement of trees and shrubs by grasses (Fig. 2). Over the tropics, the projected LAI decreased in the Amazon and equatorial Africa by values that exceeded 1.00 m2m-2, while southeastern Asia showed an increase in the projected LAI by more than 1.00 m2m-2.
3.4.Carbon fluxes
The analysis here focuses on the changes of carbon fluxes for the GPP, NPP, and autotrophic respiration (Ra)between the RCP8.5 experiments and the present-day experiment. Globally, positive anomalies were observed for all three carbon fluxes (Fig. 5). GPP shows the largest anomaly with 18.36%±5.52%, which is followed by Ra and NPP,with 12.32%±3.24% and 6.04%±2.42%, respectively. Considering that the CO2concentration is the same in all simulations, the overall positive anomalies in GPP and NPP are caused by the warmer and wetter climate in the future, a favorable climatic condition that can enhance photosynthesis by lengthening the growing season or by reducing water limitation. Further analysis is shown in section 4.
Figure 6 clearly shows that positive anomalies occurred over most of the latitudes, while negative anomalies were only seen over a few tropical latitudes. The spatial patterns further show that the positive anomalies are more globally widespread than the negative anomalies (Figs. 6a, c, e).Over middle and high latitudes, the regions with remarkable positive anomalies are mainly in Alaska, eastern North America, Europe, eastern Siberia, and southern South America.Regions with negative or slightly positive anomalies are seen in Northeast China and Western Siberia. Over the tropics, the negative anomalies for the three carbon fluxes are observed mainly in the Amazon, while tropical Asia shows remarkable positive anomalies. Figure 6 also illustrates that the projected positive anomalies are more consistent than the projected negative anomalies among the 16 RCP8.5 experiments, which reflects more uncertainty for the projected carbon fluxes over regions with negative changes.

Fig. 3 Global weighted average fractional coverage (%) of each PFT for Pre (blue) and RCP8.5 (red). The abbreviations of the PFT correspond to the information in Table S1.

Fig. 4 (a) Spatial distribution of differences in leaf area index (LAI) between Pre and RCP8.5 (RCP8.5 minus Pre). The stippled regions represent grids where at least 14 of 16 models agree with the multi-model ensemble mean and the bars in the left bottom represent the global means of LAI in Pre (blue) and RCP8.5(red). (b) The zonal average of LAI in the present-day experiment (Pre; blue) and the RCP8.5 experiments(RCP8.5; red), respectively. The shaded red areas represent one standard deviation. All units are m2 m-2.
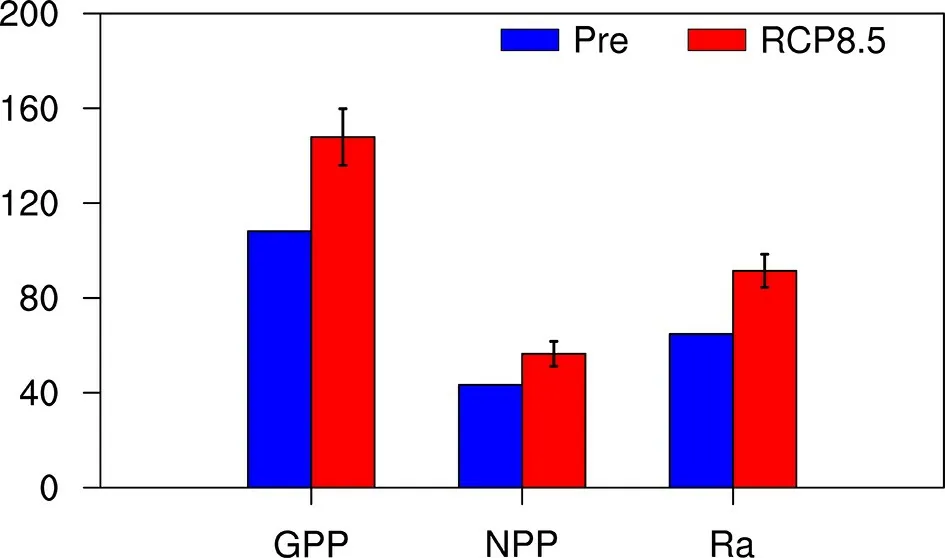
Fig. 5 Global means of carbon fluxes in Pre (blue) and RCP8.5 (red). The bars represent one standard deviation. All units are PgC yr-1.
4.Discussion
4.1.Linkage between climate and vegetation anomalies
To investigate drivers of the changes in vegetation distribution, we further analyzed the relationships between the changes in fractional coverage (FC) of the above-mentioned six PFTs and the temperature and precipitation, respectively(Fig. 7). The temperature changes exhibit significant negative correlations with the changes in the PFT categories of “needleleaf evergreen boreal tree” (NEB), “broadleaf deciduous boreal shrub” (BDBsh), and “C4 grass” (C4), with correlation coefficients (cc) of -0.89, -0.65, and -0.51, respectively. In contrast, significantly positive correlations are seen between the changes in temperature and “broadleaf deciduous temperate tree” (BDM; cc= 0.88), “C3 arctic grass” (C3Ar; cc=0.85), and “C3 non-arctic grass” (C3NA; cc= 0.64). Figure 7b shows that the changes in precipitation are significantly correlated with the changes in NEB (cc= -0.48), BDBsh (cc=-0.60), and C3Ar (cc= 0.63), while the correlations for the other three PFTs are not significant. Together with the partial correlation coefficients (Table S3), the stronger correlations between fractional coverage of vegetation and surface air temperature indicate that temperature is the dominant driver of the changes in vegetation distribution as opposed to precipitation.
The dominant role of surface air temperature in driving vegetation distribution strongly suggests that temperature is a key limiting factor for vegetation growth. The warmer climate in the future can lead to an expansion of the growing season and increased photosynthesis rates in the boreal and temperate regions. High temperatures also lead to higher mortality rates for boreal woods (NEB and BDBsh) due to heat stress and thus a decrease in FC. However, the heat stress is neglected in DGVMs, because temperate vegetation adjusts to the warmer climate and thus results in an increase in FC for BDM and C3 grasses. For C4 grass that grows in the tropics (Fig. S4), warming has little or even a negative impact on the rate of photosynthesis but significantly increases the rate of respiration, thus suppressing productivity and leading to decreased FC.
We next investigate the relationship between the projected changes in the three categories of carbon fluxes and changes in LAI, surface air temperature, and precipitation.The three carbon fluxes are known to be impacted greatly by LAI, temperature, and precipitation. Their net effects can be very different in different ecosystems, so the changes in the three carbon fluxes show large differences. Thus, we selected six regions (Table S4 in the ESM) to discuss these differences by using regional boundaries defined in previous studies (Giorgi and Francisco, 2000; Xue et al., 2010). In these regions, the projected changes for the three carbon fluxes have either remarkably increased, slightly increased,or decreased (Fig. S5 in the ESM).

Fig. 6 Spatial distribution of differences between the present-day experiment (Pre) and the RCP8.5 experiments (RCP8.5) (RCP8.5 minus Pre) in (a) GPP, (c) NPP, and (e) Ra. (units: gC m-2 yr-1). The stippled regions represent grids where at least 14 of 16 models agree with the multi-model ensemble mean.(b), (d), and (f) are the zonal average (units: kgC m-2 yr-1) of GPP, NPP, and Ra in Pre (blue) and RCP8.5(red). The shaded red areas represent one standard deviation.
Over northern mid-high latitudes, it is known that an increase in LAI, temperature, and precipitation is generally favorable for an increase in GPP, NPP, and Ra. Figure 8 shows a remarkable increase in the projected carbon fluxes in Alaska (ALA), Northern Europe (NEU), and eastern North America (ENA) due to the combined effects of LAI,temperature, and precipitation. However, in Western Siberia(WSI), the replacement of trees and shrubs by grasses (Fig.S6 in the ESM) leads to a decrease in LAI and in the carbon fluxes, which partly offsets the increase in the carbon fluxes caused by the increased temperature and precipitation. The net result ultimately leads to a slight incremental increase of the carbon fluxes by no more than 0.50 PgC yr-1in WSI.
Over the tropics, warmer climate anomalies may reduce vegetation productivity due to a suppression of photosynthesis caused by a higher vapor pressure deficit, while wetter climate anomalies can enhance vegetation productivity by reducing water stress. Figure 8 shows weaker positive anomalies for the projected temperature and stronger positive anomalies for the projected precipitation in Southeast Asia (SEA) than for the Amazon Basin (AMZ). These differences, on one hand, explain the opposite responses regarding the carbon fluxes for the two regions. On the other hand, the increased LAI caused by increased trees in SEA also makes large contributions to the enhanced carbon fluxes, while the decreased LAI, caused by decreased trees in the AMZ, makes large contributions to the decreased carbon fluxes. Overall, the combination of the effects caused by LAI, temperature, and precipitation result in opposite behaviors between SEA and the AMZ regarding the response to carbon fluxes.

Fig. 7 Relationship between the changes in fractional coverage (FC, %) of the six PFTs (NEB, BDM, BDBsh, C3Ar,C3NA, C4) with (a) annual mean surface 2-m temperature (K), and (b) precipitation (mm d-1) among the 16 ensembles. The changes in fractional coverage have been standardized. The lines represent the corresponding regression lines. The abbreviations of the PFT correspond to the information in Table S1.

Fig. 8 Changes in carbon fluxes (GPP, NPP, and Ra; PgC yr-1), LAI (m2 m-2), temperature (T; K), and precipitation (P;mm d-1) over the six selected regions. The abbreviations of these regions correspond to the information in Table S4.
4.2.Uncertainties and significance
This work mainly focuses on the impact of climate warming on vegetation dynamics and carbon fluxes, so the atmospheric CO2concentration is kept at a constant value in all simulations to isolate the CO2fertilization effects. This set of our simulations may add to our full understanding of vegetation responses. Thus, we further conducted a simulation with an elevated CO2of 850 ppm (hereafter eCO2) by referring to Yu et al. (2014). We compared the results with the above results to discuss the differences in the effects of global warming and CO2fertilization on vegetation dynamics and carbon fluxes.
The results show that the eCO2simulation also produced more vegetation than the Pre simulation. The value of the greening anomaly is comparable to that of the RCP8.5 simulation (Fig. S7 in the ESM). However, there is no poleward expansion of vegetation in the eCO2simulation over the northern high latitudes (Fig. S8 in the ESM). The three carbon fluxes are also enhanced in the eCO2simulation relative to the Pre simulation. Their global annual totals are comparable to those in the RCP8.5 simulation (Fig. S9 in the ESM). The spatial distribution shows that the enhancement of the three carbon fluxes of the eCO2simulation is seen over almost all vegetated land grids (Fig. S10 in the ESM), while the RCP8.5 simulation shows a negative anomaly in the three carbon fluxes over more vegetated grids (Fig. 6). The comparable results between the RCP8.5 and eCO2simulations illustrate that the effects of global warming on vegetation dynamics and carbon fluxes are just as important as those of CO2fertilization.
Furthermore, in our study, the projected results were based on the forcing from the RCP8.5 scenario, which corresponds to a very high baseline emission scenario to maximize the climate signal (Taylor et al., 2012). Liu et al. (2020)assessed the future changes in the climate-vegetation system over East Asia under different emission scenarios. They found a slight increase in vegetation cover over most of the region and the magnitude of these changes increased gradually from low to high RCPs. Thus, more simulations and analyses are needed to investigate the dependence of the results on the scenarios at the global scale.
Despite the uncertainties mentioned above, our study makes a valuable contribution to the development of the model and the understanding of the responses of vegetation to global warming. First, the results show opposite responses to warming between the PFT categories, “needleleaf evergreen boreal tree” (NEB) and “broadleaf deciduous temperate tree” (BDM) due to the different values for heat stress threshold in the model. This phenomenon reveals that the differences in parameters assigned to PFTs have significantly different effects on the vegetation in response to future climate changes. Meanwhile, this result also reminds us that it is necessary to further improve the parameterization of heat stress in IAP-DGVM because of the limitation of the different heat stress threshold settings for different PFT categories Thus, optimizing the parameterization of vegetation processes in the model is crucial for simulating a more realistic vegetation change. Second, this study demonstrates an application of the CAS-ESM2 for studying the response of vegetation dynamics to climate change. In the process of developing the IAP-DGVM, this application represents a new frontier after the successful coupling of IAP-DGVM with CAS-ESM2, and provides a valuable sample for comparison with both the CAS-ESM2 community and other model communities. We have coupled IAP-DGVM with the atmospheric general circulation model (IAP-AGCM; Zhang et al.,2013), so CAS-ESM2 can be used to investigate interactions between vegetation dynamics and climate. We now are able to use this coupled version of CAS-ESM2 to run the Diagnostic, Evaluation, and Characterization of Klima (DECK) experiments of phase 6 of the Coupled Model Intercomparison Project (CMIP6). Third, the poleward expansion of vegetation in northern mid-high latitudes simulated in our work is consistent with numerous studies on future projections(Mahowald et al., 2016; Yu et al., 2016; Gang et al., 2017;Tharammal et al., 2019) and with recent observations (Zhu et al., 2016; Zeng et al., 2018; Yao et al., 2019), indicating that the “greening” trend may continue in the future. This greening can provide critical feedback to the local climate by shading, changing surface albedo, and regulating the partitioning of evapotranspiration between evaporation and transpiration (Blok et al., 2010; Zhu and Zeng, 2015, 2017). Our investigation further shows the dominant role of surface air temperature in the greening phenomenon. The investigation provides for a better understanding of vegetation processes and expands upon our knowledge of model behavior in response to global warming, which favors projections of changes in terrestrial ecosystems and climate in the future.Overall, this work evaluates the responses of vegetation to global warming and shows the tight linkage between vegetation and climate changes, which is a necessary step for model development and a significant foundation for further study of vegetation-climate interactions.
5.Summary
This study investigated the changes in the distribution of vegetation and carbon fluxes in response to global warming by using IAP-DGVM in CAS-ESM2. The results, based on the present-day simulation and RCP8.5 simulations, showed a greening in the northern middle- and high-latitudes and a slight browning in the tropics. The results also showed positive anomalies in GPP, NPP, and Ra over most latitudes,while negative anomalies occurred, with higher uncertainty,in the Amazon. We argue that surface air temperature is the dominant driver in changing the vegetation distribution, as opposed to precipitation, and that the changes in GPP, NPP,and Ra can be explained by the combined effects of LAI, temperature, and precipitation.
The results of this investigation not only remind us that optimizing the parameterization of vegetation processes in the model is crucial, but also provides a better understanding of vegetation processes that could prove beneficial in the design and improvement of model parameterizations for simulating a more realistic vegetation change.
Acknowledgements.This work was supported by the National Natural Science Foundation of China (Grant No.41705070), the Major Program of the National Natural Science Foundation of China (Grant No. 41991282) and the National Key Scientific and Technological Infrastructure project “Earth System Science Numerical Simulator Facility” (EarthLab).
Electronic supplementary material:Supplementary material is available in the online version of this article at https://doi.org/10.1007/s00376-021-1138-3.
 Advances in Atmospheric Sciences2022年8期
- Advances in Atmospheric Sciences的其它文章
- Preface to the Special Issue on Carbon Neutrality: Important Roles ofRenewable Energies, Carbon Sinks, NETs, and non-CO2 GHGs※
- Electronic Supplementary Material to:The Chinese Carbon-Neutral goal:Challenges and Prospects*
- Electronic Supplementary Material to:The Variability of Air-sea O2 Flux in CMIP6:Implications for Estimating Terrestrial and Oceanic Carbon Sinks*
- Electronic Supplementary Material to:The Synergism between Methanogens and Methanotrophs and the Nature of their Contributions to the Seasonal Variation of Methane Fluxes in a Wetland:The Case of Dajiuhu Subalpine Peatland*
- Electronic Supplementary Material to:Ocean-atmosphere Teleconnections Play a Key Role in the Interannual Variability of Seasonal Gross Primary Production in China*
- Electronic Supplementary Material to:Changes in Global Vegetation Distribution and Carbon Fluxes in Response to Global Warming:Simulated Results from IAP-DGVM in CAS-ESM2*