
Analysis of forest cover change at Khadimnagar National Park, Sylhet, Bangladesh, using Landsat TM and GIS data
2014-04-20 06:58:42MohammadRedowanSharminAkterNusratIslam
Journal of Forestry Research 2014年2期
Mohammad Redowan ? Sharmin Akter ? Nusrat Islam
Introduction
Monitoring forest cover is essential for efficient forest management (Singh 1989). Accurate information on forest cover in the form of maps and statistical data is crucial for spatial planning of forest activities, investigating forest degradation, inventorying forest resources, formulating policy decisions and preparing forest management plans (Karia et al. 2001). Forest change detection using satellite imagery is the most powerful monitoring tool for conservation agencies, local administrations and nongovernment organizations (Panigrahy 2010).
Bangladesh is the most densely populated country in the world (1045 people per sq. km) and has limited natural resources. The forests of Bangladesh are important natural resources and, under constant pressure, have already been drastically degraded and fragmented. Eleven percent of the total landmass (2.52 million ha) of the country is designated as forest (Mukul et al. 2008) but the actual tree cover is estimated at around 8%-9%. Bangladesh loses 3.5% of her forest every year (FAO 2006). The annual rate of negative change of forest cover during 2000-2005 was 2000 ha per year or 0.3% (FAO 2006). Deforestation is likely to continue and forests are likely to disappear very fast in Bangladesh (Nishorgo 2012). The main causes of forest degradation are encroachment, illegal felling, increased demand of fuel wood, forest land conversion into settlement, agricultural land and farm land and also unplanned industrialization (ADB 2002; Iftekhar et al. 2003).
Conventional ground methods of forest cover monitoring are labor intensive, insufficient, time consuming, and are done infrequently. Resulting maps soon become obsolete, particularly in rapidly changing environments. More recently, remote sensing data, because of their temporal resolution, larger synoptic view and digital format, have become the foremost data source for change detection applications during recent decades. Satellite data yield more accurate assessments than do traditional inven-tory methods (Franklin et al. 2000). The digital nature of remote sensing permits advanced computer analysis, classification and compatibility with geographic information systems (Li et al. 2007). In response to increasing rates of deforestation, operational forest monitoring at regional and national levels using remote sensing are now feasible goals in most developing countries.
In recent years, fine and high resolution imageries (e.g. from Quick Bird, IRS, IKONOS, ALOS, or CASI) enable forest cover change detection and mapping with high accuracy (80%-90%) but they are costly. Lower-cost options have been used to monitor change in forest cover, land use, and landscape ecology using medium and coarse resolution satellite data (Landsat TM, ETM+, SPOT etc) with acceptable levels of accuracy (Vina et al. 2004; Browder et al. 2005; Roy and Giriraj 2008). These inexpensive or no-charge data sources provide opportunities to forest managers and scientists, especially in developing countries such as Bangladesh, to study forest change while incurring little or no cost for data acquisition.
Several studies in Bangladesh analyzed land cover change using satellite imagery in recent decades (Uddin and Gurung 2005; Dewan and Yamaguchi 2008). But few studies updated the forest cover change of forest sites of Bangladesh (Islam and Quadir 1988; Quadir et al. 1998; Islam et al. 2006; USAID 2006; Halim et al. 2008). The forest management approach common to sustainable development strategies is largely theoretical and typically lacks information on forest structure and cover change in Bangladesh. Even though most developing countries have compiled detailed information on forest cover, Bangladesh suffers from a lack of spatial information regarding forest resources. Khadimnagar National Park (KNP) is a protected forest of Bangladesh of national ecological and economic importance. Yet changes in forest cover over time at KNP have not been well studied. Our study objective was to estimate the change in forest cover at KNP from 1988-2010 using Landsat Thematic Mapper (TM) imagery.
Materials and method
Study area
KNP is located in the Khadimnagar Union of Sylhet Sadar Upazila at 24°56′-24°58′ N and 91°55′-91°59′E. The park is under the authority of Khadimnagar forest beat of North Sylhet Range-1 under Sylhet forest division (Fig. 1). The park is situated approximately 15 km northeast of Sylhet city. KNP was declared a national park in 2006 under the Wildlife Preservation Amendment Act 1974 with an area of 678.8 ha for the purpose of preservation of remaining natural hill forest in Khadimnagar Reserve Forest. The forest is a semi-deciduous tropical forest where the tallest trees are deciduous and the understory is evergreen (IPAC 2009). KNP undulates with slopes and hillocks, locally called “tilla” at heights of 10-50 m. KNP is drained by several watersheds locally called “chore”. The park is surrounded by eight tea gardens (pers. commun). The natural forest was was comprised of stands of inferior quality natural bamboos that were gradually felled and converted to plantations during the early 1960s to create a tropical forest look (IPAC 2009). Plantation in Khadimnagar Reserve Forest started from 1951 and continued to 2004. Long-rotation species were planted first, including Garjan (Dipterocarpus turbinatus), Champa (Michelia champaca), Dhaki jam (Syzygium grande), Teak (Tectona grandis), Chapalish (Artocarpus chaplasha). From the early 1990s planting shifted to short-rotation monoculture plantation mainly with exotic and rapid growing species such as Akashmoni (Acacia auriculiformis), Chickrashi (Chickrassia tabularis), Champa (Michelia champaca), Mangium (Acacia mangium) and others. Bamboo and cane was also planted. Fauna of KNP includes 20 species of amphibians, 9 species of reptiles, 28 species of birds and 26 species of mammals. Soil ranges from clay loams to pale brown (acidic) clay loams. The climate is warm and humid. A tropical monsoon climate prevails with average maximum temperature 30.7°C and average minimum temperature 18.9°C. Average annual rainfall is 3931 mm most of which falls between June-September (BBS 2005).
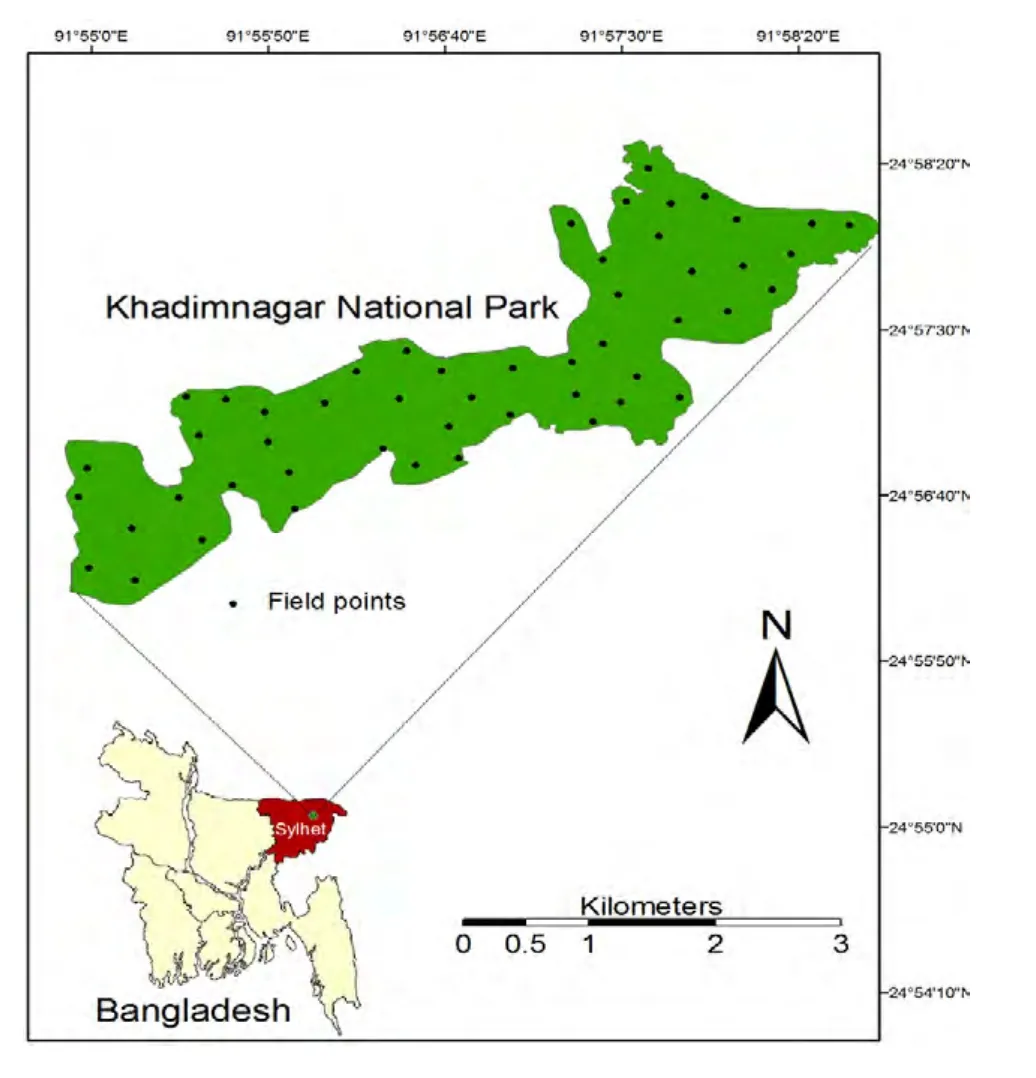
Fig. 1: Location of Khadimnagar National Park, Sylhet, Bangladesh.
Methodology
Our methodical approach is shown as a schematic diagram in Fig. 2.
Acquisition of satellite imageries
We acquired two images taken by the Landsat TM sensor of the study site dated 10 November 1988 and 8 February 2010. Scenes of KNP were subsets from the full scenes (185 km × 185 km) and were identified using a park boundary shape file in ERDAS (Fig. 3). Subset images were cloud and defect free. Landsat TM acquires images in seven spectral bands; three in the visible spec-trum (bands 1, 2 and 3), one in the near infrared (band 4), two in the middle infrared spectrum (bands 5 and 7), and one in the thermal infrared (band 6). Bands 1-5 and 7 have 30 × 30 m spatial resolution and were used in this analysis. Band 6 was not used as it thermal and not generally used in remote sensing of vegetation and has coarse spatial resolution of 120 × 120 m (Fraser et al. 2005; Hossain 2005) (Tables 1 and 2).
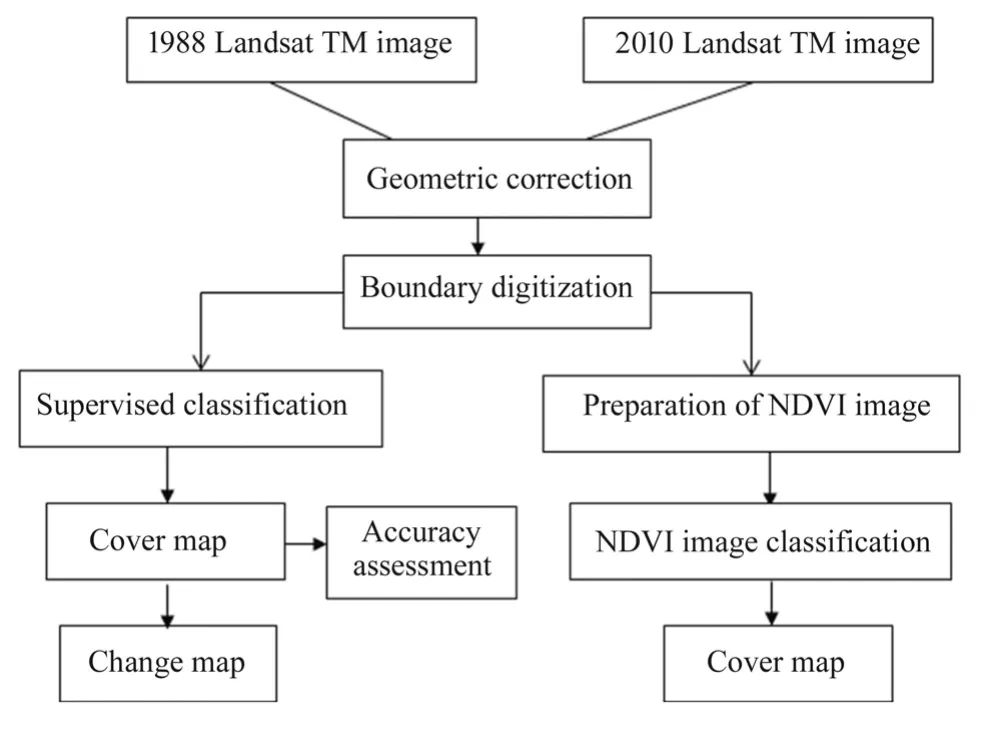
Fig. 2: Schematic diagram of the research approach
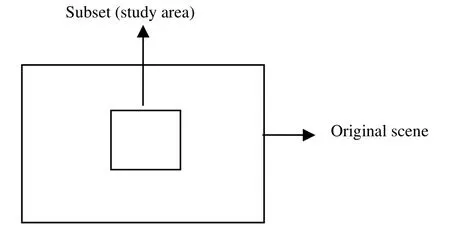
Fig. 3: Subsetting process

Table 1: Characteristics of the imagery used in this study
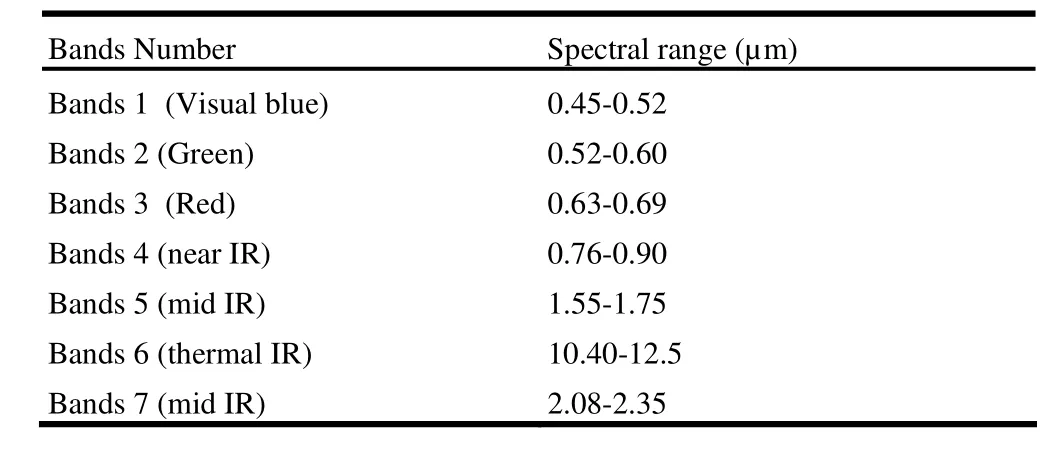
Table 2: Properties of Landsat TM image
Our Landsat TM image dated 2010 was geometrically corrected to Universal Transverse Mercator (UTM) zone 46N with datum WGS84 coordinate system. It was used as a master image for image-to-image co-registration of the 1988 image (Lillesand and Kiefer 2000). We used 13 Ground Control Points (GCPs) taken at crossroads, road carvings, trail crossings, canal bands and crosses (RMSE 0.4732). We used a first order polynomial equation with maximum likelihood resampling approach for image transformation in the geometric correction process. All these operations were performed using ERDAS IMAGINE 9.2, ENVI 4.3 and Arc GIS 9.3 software.
Field sampling
Field work was carried out during January 2011 for collecting ground training and validating data and for defining the characteristics of each land cover class. We applied stratified adaptive sampling with strata based on available forest types (plantation and natural) and cover classes resulting from the unsupervised classification of 2010 images (Phong 2004). For classification and validation of the 2010 image, we sampled a total of 50 points. For the 1988 image 40 points were sampled based on the existing analog historical forest map of KNP and by visual interpretation of the image based on some developed interpretation keys. At the selected field points, latitude and longitude, forest cover classes, dominant life form, disturbance factor (clear felling, encroachment, conversion of land use, fire) were recorded.
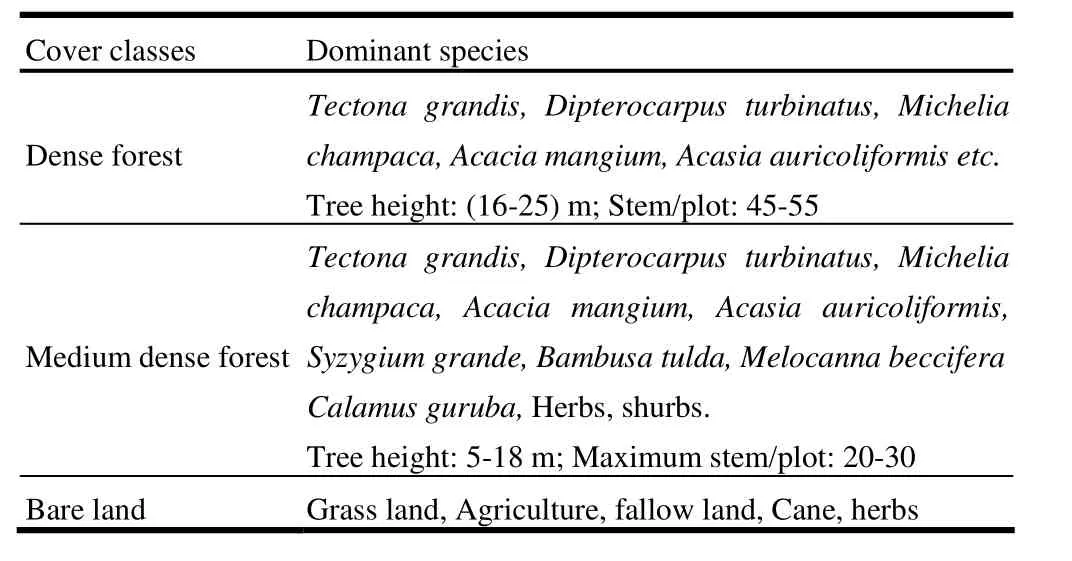
Table 3: Characteristics of forest cover classes
Satellite image classification and accuracy assessment
After preprocessing the imageries, we performed supervised classification of both imageries with maximum likelihood classification algorithm in ERDAS IMAGINE 9.2 using the field data to produce three cover classes, namely dense forest, medium dense forest and bare land (Table 3). Two thirds of the samples were used for training while one-third were used for accuracy assessment. Training and validation points were separated randomly using Hawth’s tool extension in ArcGIS. After classification in ERDAS, the classified imageries were exported to ArcGIS for map production and generating forest cover statistics.
Classified maps are seldom used without assessment of their accuracy because quality of the classified maps depends on the accuracy of classification. We used error matrix (confusion matrix) and kappa statistics to assess the accuracy of the forest cover maps (Congalton and Green 1999).
Preparation of normalized difference vegetation index (NDVI) image and classification
The NDVI is the normalized ratio of reflectance value at red and near infrared part of the electromagnetic spectrum. NDVI is used widely for monitoring vegetation health. A value of NDVI ranges from -1 to +1. Minus (-) value of NDVI corresponds to nonvegetated surfaces such as water bodies, road surfaces, or settlements. Zero (0) NDVI values correspond to no vegetation while 1 corresponds to lush-green, dense vegetation. NDVI is the most widely used of all vegetation indices because it only requires data from the red and near infrared portion of the electromagnetic spectrum and it can be applied to virtually all multispectral data types. For Landsat TM imageries, NDVI is calculated using the following formula:
NDVI = (band 4-band 3)/ (band 4+ band 3)
NDVI for 1988 and 2010 imageries were calculated separately using the above formula in ENVI 4.3. NDVI images pixels were then classified into three cover classes: dense forest, medium dense forest and bare land; with highest NDVI values corresponding to dense forest, mid values corresponding to medium dense forest and lowest values corresponding to bare land.
Creation of forest change map
Image differencing is probably the most widely applied change detection algorithm (Singh 1989) and was used in this study. Image differencing involves subtracting imagery taken on one date from imagery taken on a second date that has been precisely registered to the first. Image differencing appears to perform generally better than other methods of change detection (Fraser et al. 2004; Deng et al. 2008). The change map was produced by differencing classified imageries of 1988 (the before-image) and 2010 (the after-image) in ERDAS IMAGINE.
Instrument and accessories
The following instruments and accessories were used:
Forest cover map of KNP (at 8 inch to 1 mile scale) was collected from forest Beat office and was used for field navigation and sample plot selection.
Megallan handheld GPS unit was used for recording coordinates of field sample points.
ArcGIS 9.3, ERDAS IMAGINE 9.2, ENVI 4.3, SPSS and MS-Word and MS Excel were used for satellite and field data analysis and report write up.
Results
Forest cover maps
Forest cover maps for 1988 and 2010 were developed from supervised classification of Landsat TM imageries and are presented in Fig. 4. Cover maps from NDVI image classification are presented in Fig. 5. Three forest cover classes include dense forest, medium dense forest and bare land.
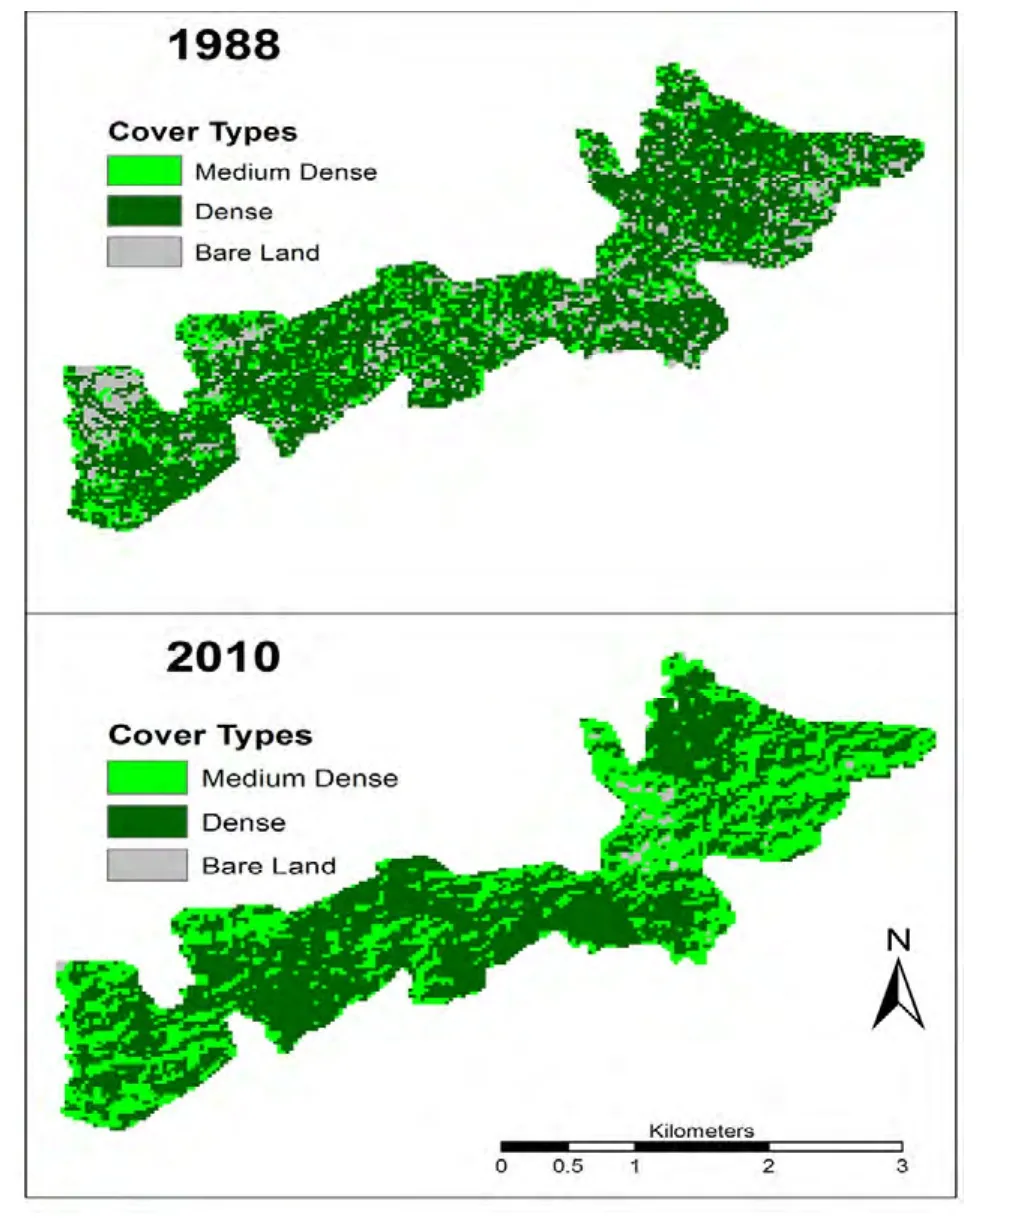
Fig. 4: Forest cover maps of 1988 and 2010 resulting from supervised classification.

Fig. 5: Forest cover maps of 1988 and 2010 resulted from NDVI image classification.
Forest change statistics
Summary statistics of forest cover classes of KNP obtained from the supervised classification are listed in Table 4 (and a diagrammatic representation is shown as Fig. 6). Dense forest declined from 526 ha (67%) to 417 ha (59%) in 1988 to 2010 respectively whereas medium dense forest increased from 155 ha (20%) to 317 ha (40%). Bare land has significantly decrease from 104 ha (13%) to 8 ha (1%).
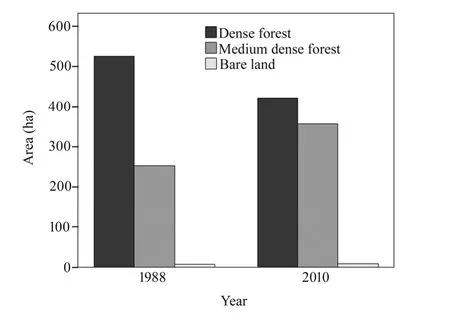
Fig. 6: Areas of forest cover classes derived from supervised classification.
Forest cover areas resulting from NDVI classification are listed in Table 5 (and a diagrammatic representation of the same is shown as Fig. 7). In this classification, from 1988 to 2010, dense forest decreased from 525 ha (67%) to 421 ha (53%) whereas medium dense forest increased from 253 ha (32%) to 356 ha (45%). Bare land remained unchanged.
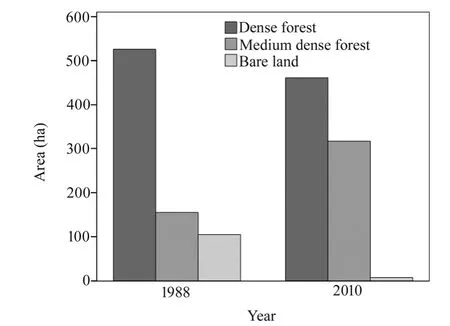
Fig. 7: Areas of forest cover classes derived from NDVI classification
Cover class statistics obtained from both supervised and NDVI image classification showed similar trends in forest change, i.e. decreased area of dense forest and increased area of medium dense forest. In supervised classification, dense forest decreased by 8%, where as in NDVI classification, dense forest decreased by 13%. Medium dense forest increased by 21% in supervised classification (Table 4) and 13% in NDVI classification (Table 5).

Table 4: Area (in hectares) of forest cover classes resulted from supervised classification.

Table 5: Area (in hectares) of forest cover classes resulted from NDVI classification.
Forest change map was prepared by differencing supervised classification maps of 1988 and 2010 images as before image and after image. Areas with 25% change have been marked as increase or decrease. Red areas correspond to decrease whereas green areas correspond to increase of forest cover. Areas marked white indicate no change (Fig. 8).
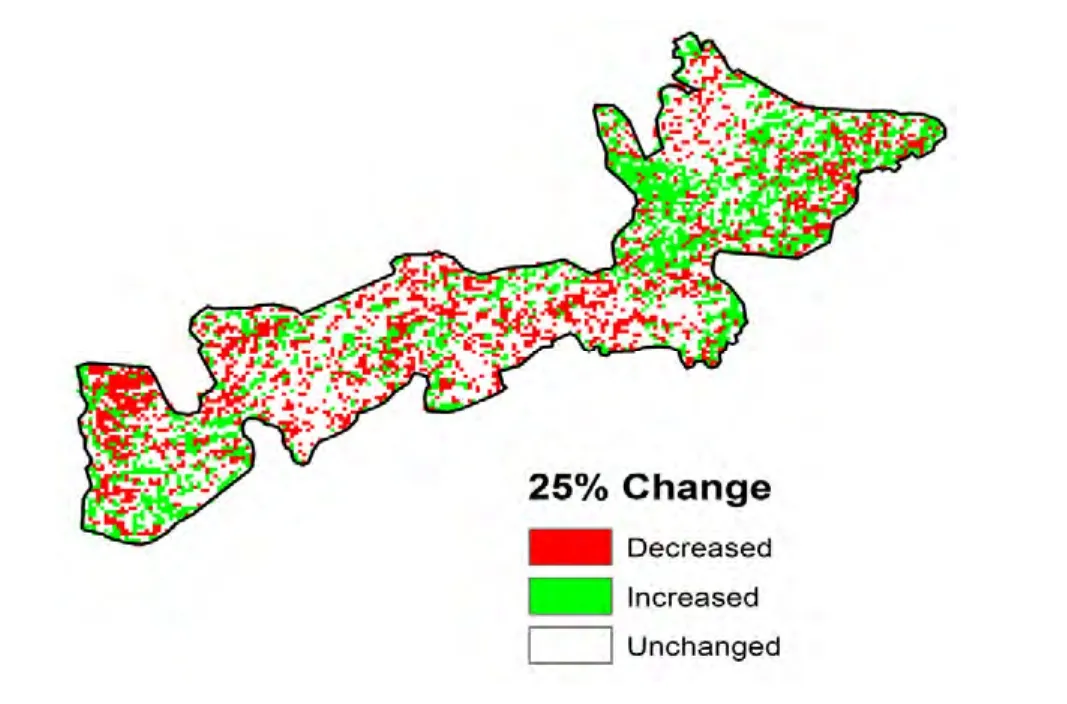
Fig. 8: Forest cover change map obtained by differencing supervised classified 1988 image as before image and 2010 image as after image in ERDAS.
Map accuracy assessment
For assessing the accuracy of the forest cover maps, error matrices (confusion matrices) were generated. Error matrices of 1988 and 2010 maps have been presented in Table 6 and Table 7 respectively. Overall accuracy, user accuracy, producer accuracy and kappa statistic (or kappa coefficient) were calculated. The overall accuracy of 1988 map is 84.6% (with associated kappa value 0.75) and of 2010 map is 87.5% (with associated kappa value 0.80). Kappa is intended to give the reader a quantitative measure of the magnitude of agreement between observers. Kap-pa value 0.75, for example, indicates that produced map is 75% better than that would have been made by chance.
For the 1988 map, 9 of 13 validation field samples were correctly classified. One validation point on bare land was classified as dense forest while one dense forest point was classified as medium dense forest (Table 6).
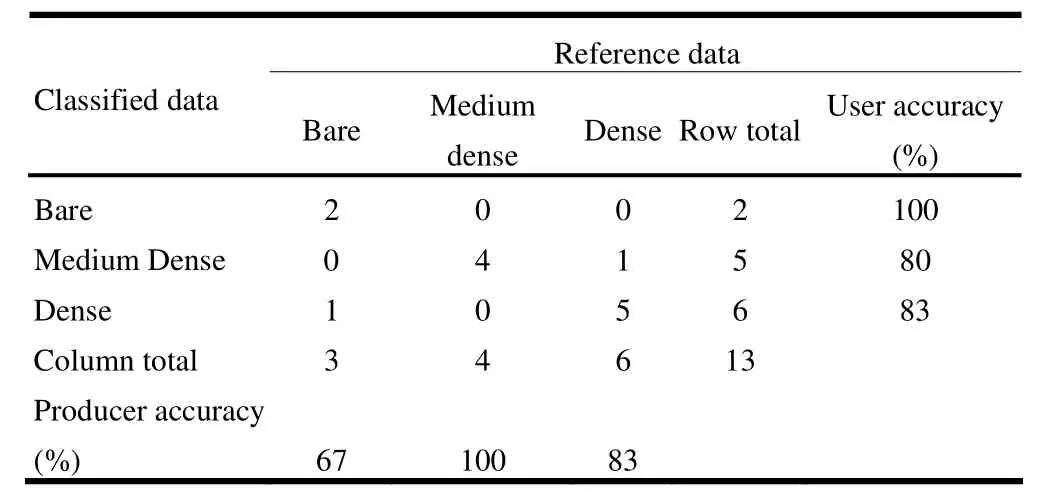
Table 6: Error matrix of forest cover map produced by supervised classification of 1988 image, with Overall Accuracy, Producer Accuracy and User Accuracy and Kappa statistic.
For the 2010 map, 13 of 16 validation samples were correctly classified. The main classification confusions were between dense forest and medium dense forest classes with one validation point in dense forest classified as medium dense forest while one point in medium dense forest was classified as dense forest (Table 7).
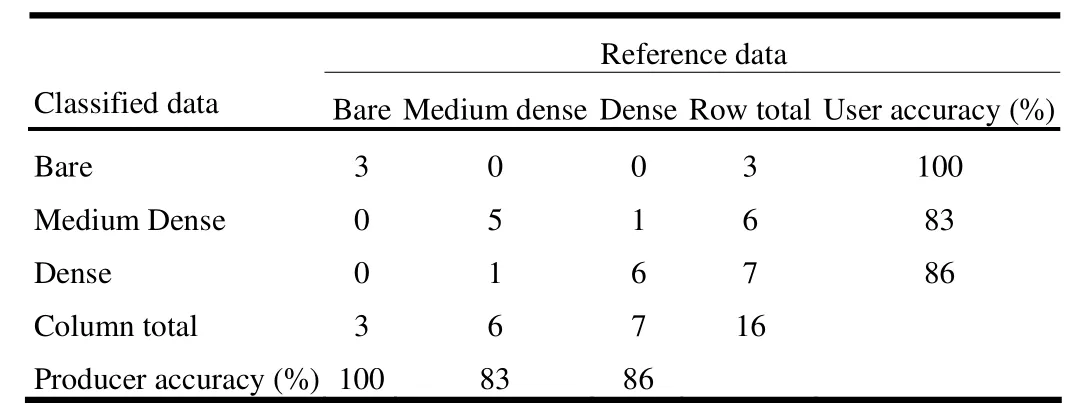
Table 7: Error matrix of forest cover map produced by supervised classification of 2010 image, with Overall Accuracy, Producer Accuracy and User Accuracy and Kappa statistic.
Discussion
Remote sensing and GIS implications
To minimize error in estimating area of change, satellite imageries should be of the same date of the year. Difference in irradiance recorded by the sensor at the top of the atmosphere can vary due to differences in land cover or other factors such as atmospheric condition, sun angle, or soil moisture. It is, however, difficult to obtain matching-date imageries, especially free of cost. Acquisition dates of the Landsat TM imageries used in this study were 10 November 1988 and 8 February 2010. Different dates of imageries can affect the accuracy of the forest cover maps. However, dry winter season prevails in the image acquisition months (November-February) in Bangladesh and no marked change in vegetation phenology is normally observed between these months in the tropical monsoon forest of KNP. We therefore expected errors in image classification to be minimal.
Supervised classification and NDVI methods were used for image classification. Both methods proved to be straightforward techniques and easy to use. We did not assess the accuracy of cover maps produced by the NDVI method but instead used this approach as a crosscheck to the statistics calculated by supervised classification. Both classification approaches produced similar statistics of forest change and therefore the statistics were confirmed. The amount of bare land (104.94 ha) indicated in the 1988 map by supervised classification was, however, many times greater than the result from NDVI classification (8.19 ha) for the same year. This discrepancy might have resulted from classification confusion between medium dense forest and bare land. In this case, NDVI classification is likely to be most trustworthy than supervised classification because NDVI is based on the spectral characteristics of vegetation and is an unbiased record of vegetation health.
Several areas of dense and medium dense forest were mixed in pixel-level classification. This possibly happened because spectral overlapping resulted from the discontinuity of the forest cover classes. Also it was difficult to distinguish dense from medium dense forest, probably because the reflectance of tall trees in dense forest was sometimes similar to that of thick herb and shrub cover of medium dense forests.
Map accuracies were high for both classification approaches. Accuracy of the change map depends on the accuracy of the independent maps from which it is calculated. Therefore, accuracy of the change map was also high too. Use of mediumresolution imageries such as Landsat TM proved useful in estimating forest cover change in tropical monsoon forest at KNP.
Error might propagate in image classification due to ‘selective availability’ (SA) error of GPS in field training and validation data collection. SA error for Magellan GPS as used in this study was 10 meters: the real location of a field point might shift 10 meters in any direction from the position recorded by the GPS receiver. To minimize propagation of SA error in the image classification, a stratified adaptive sampling strategy was applied and samples were taken such that there was continuation of similar cover class even 20-30 meter away in any direction from the observed points. A number of studies recommended a similar sampling technique combined with increased numbers of sample units to enable more robust and precise change estimation (Achard et al. 2002; Eva et al. 2009). Use of differential GPS (DGPS) can reduce SA error to centimeter level but expense and lack of availability precluded use of DGPS in this study.
Distribution and rate of forest cover change at KNP
Both supervised and NDVI classifications showed similar trends in forest change over 22 years: a decrease of dense forest and an increase of medium dense forest. Because the study area was constant for 1988 and 2010, we conclude that dense forest was been converted to medium dense forest. Dense forest, as categorized in this study, included various important tree species with heights of 45-55 m with 50-60 stems per 30 m square plot. Medium dense forest category had growing stock of 20-30 stems per plot at heights of 5-18 m. The phenomenon of forest change from dense to medium dense over most of KNP, or ‘degradation’of the growing stock, can be attributed to several factors acting locally. These include close proximity to settlements, absence of zoning, felling history, plantation rotation, illicit felling and also the management effort of the park.
Five tea estates were located adjacent to the national park at distances of 1-3 km and others were located outside the park at distances of 1-5 km. People of 22 villages depended on a wide range of forest products for their daily needs and incomes (IPAC 2009). Unlike some other hill forests of Chittagong hill tracts and Cox’s Bazar of Bangladesh at higher elevation and with steeper terrain, KNP protects plains and undulating hillocks (10-50 m, also known as ‘tilas’) where access is much easier. Accessibility is an important factor determining forest degradation (Karia et al. 2001; Fraser 2005; Bentum 2009). Because KNP is surrounded by tea estates, roads and transport systems are well developed. Therefore, human interference is the vital issue of deforestation at KNP. Vina et al. (2004) reported that 30% of the deforestation of Colombia occurred within 5 km of a road. Pong (2004) studying forest cover change at Bach Ma National Park in Thailand found distance of forest from village and population density negatively related to deforestation. Rahman (2000) denoted that the main causes of deforestation in Chittagong forest division, Bangladesh were settlement of rural people in and around forests, logging and excess interference with the forest floor.
Co-management systems have proven helpful in conserving forest. Quadir et al. (1998) and Halim et al. (2008) found forest cover was drastically reduced during 1988-1996 and gradually increased from 1996 after practice of forest co-management involving local people. Co-management led to introduction of alternative livelihoods that reduced human encroachment, illicit felling and other misuse of forest resources. One alternative approach to forest management at KNP can be the introduction of co-management.
Zoning of protected areas is another popular management strategy for sustainable forest management (Islam et al. 2006). Buffer zones are used to protect the ecosystem, forest stock, biodiversity as well as floral and faunal composition of the core zone. In KNP, no buffer zones have been demarcated and disturbances to mainstream forest resources are immense (pers. commun, ).
One of the reasons for the increase in area of medium dense forest and the decline in area of bare land in KNP is the forest plantation undertaken by the park authority. Plantation in KNP started from the 1960s. IPAC (2009) reports that about 846 ha (2090.50 acres) were planted to long-rotation (LR) species from 1951 to 2004. Furthermore, 81 ha of short-rotation (SR) species were planted from 1987 to 1989. From 1981 to 2004, bamboo and cane plantation were established on 250 and 228 ha, respectively. A large plantation of SR species (Acacia auriculiformis, A. mengium, Eucalyptus camaldulensis, Pinus spp, Albizia chinensis) and bamboo and cane species was established from 1980-1995. The LR plantations were felled periodically after maturity. In the meantime, several SR plantations (1991, 1992, 1993, 1994, 1987, and 1989) have matured and were identified as medium dense forest in the classified image for 2010. In the northeast quadrant of the 1988 map (Fig. 4 and 5) dense forest cover was detected but on the 2010 map, the areas had been converted into medium dense forest. This area was planted to longrotation plantation in the early 1960s and had matured by 1988 (Anon 2010) to dense forest. After 1980, this area was gradually harvested and replanted to a short-rotation plantation of Dhaki jam, Chapalish, Acasmoni, Chompa, Meheguni in 1991, 1992, 1993, 1994 plantation years (Anon 2010). By 2010, the plantations were mature and appeared as medium dense forest on the 2010 map.
Similarly, reduced area of bare land (indicated in supervised classification) can be attributed to the increased afforestation efforts of the forest department with short-rotation plantations. On the 1988 map, large expanses in the northwest part of the study area were classified as bare land. In that period, SR plantation of 1988 and 1985 were established and LR plantations of 1963 and 1964 were harvested (Anon 2010). But on the 2010 image, those areas were indicated as medium dense, as the SR plantations reached maturity. Similarly, bamboo plantation area that appeared to be bare on the 1988 image might have been classified as medium dense forest on the 2010 image because of natural regeneration and maturation.
Conclusion
We mapped forest cover and estimated change over 22 years, from 1988 to 2010, at Khadimnagar National Park, Sylhet, using Landsat TM imageries and other ancillary GIS data with supervised and NDVI image classification approaches. Accuracy of the forest change map depends on the accuracy of the individual forest cover maps. Forest cover maps of 1988 and 2010 developed by supervised classification had high levels of accuracy (overall accuracy 84.6 and 87.5%, respectively). Accuracy of the NDVI image maps was not evaluated but the classification was used as a crosscheck to confirm the forest cover statistics that resulted from the supervised classification. Statistics of both supervised and NDVI approaches showed similar trends of forest change, i.e. reduced area of dense forest and increased area of medium dense forest. Bare land area declined in the supervised classification but there was no change in the NDVI classification. This discrepancy might have been caused by SA error during GPS field data collection in training imageries for supervised classification. Afforestation by the forest department in different years contributed in the increase in area of medium dense forest while human interference and illicit felling were the principal causes of the decline in area of dense forest cover. Forest departments should undertake appropriate measures to scientifically manage and conserve the existing forest stock at KNP.
Achard F, Eva HD, Stibig HJ, Mayaux P, Gallego J, Richards T, Malingreau J. 2002. Determination of deforestation rates of the world's humid tropical forests. Science, 297(5583): 999-1002.
Asian Development Bank (ADB). 2002. Country Assistance Plans - Bangladesh: III. Sector Strategies. Available at: http://www.abd.org. [Last access on 23 November 2010].
Bangladesh Bureau of Statistics (BBS). 2005. Compendium of environment statistics of Bangladesh. Ministry of Planning, Government of the People’s Republic of Bangladesh, pp 226-227.
Bentum EK. 2009. Detection of land use and land cover change in the Accra Metropolitan Area (Ghana) from 1990 to 2000. M.sc. thesis, Royal institute of technology, Sweden.
Browder JO, Wynne RH, Pedlowski MA. 2005. Agroforestry diffusion and secondary forest regeneration in the Brazilian Amazone: further findings from the Rondonia Agroforestry Pilot Project (1992-2002). Agroforestry System, 65: 99-111.
Congalton RG, Green K. 1999. Assessing the Accuracy of Remotely Sensed Data: Principles and Practices, Map Sciences Series. Florida: Lewis Publishers, Boca Raton, p.137.
Deng JS, Wang K, Deng YH. 2008. A PCA base land use change detection and analysis using multitemporal and multispetial satellite data. Remote Sensing of Environment, 30: 1054-1060.
Dewan AM, Yamaguchi Y. 2008. Using remote sensing and GIS to detect and monitor land use and land cover change in Dhaka Metropolitan of Bangladesh during 1990-2005. Environmental Monitoring and Assessment, 25(9): 23-24.
Eva H, Carboni S, Achard F, Stach N, Durieux L, Faure JF, Mollicon D. 2009. Monitoring forest areas from continental to terrestrial levels using a sample of medium spatial resolution satellite imagery. ISPRS Journal of Photogrammetry and Remote Sensing, 10(1016): 1-7.
FAO (Food and Agriculture Organization of the United Nations). 2006. Global Forest Resources Assessment 2005. Rome, Italy. ISBN 92-5-105481-9
Franklin J, Woodcock CE, Warbington R. 2000. Multi attribute vegetation maps of Forest Service lands in California support resource management decisions. Photogrammetric Engineering and Remote Sensing, 6: 1209-1217
Fraser RH, Abuelgasim A, Latifovic R. 2005. A method for detecting large scale forest cover change using coarse spatial resolution imagery. Remote Sensing of Environment, 95: 414-427.
Halim MA, Chowdhury MSH, Nahar MN, Sohel MSI, Jahangir NM, Koike M. 2008. Evaluation of land use pattern change in West Bhanugach Reserved Forest, Bangladesh, using remote sensing and GIS technique. Journal of Forestry Research, 19(3): 193-198.
Hossain A. 2005. Remote sensing in Bangladesh. In: Bangladesh Review, January-March, 2005. Department of Films and Publications, Ministry of Information, Government of the People’s Republic of Bangladesh, pp. 56-62
Iftekhar MS, Hoque AKF, Islam MR. 2003. Root causes of forest encroachment: A critical analysis for Bangladesh. Integrated Coastal Zone Management, Ministry of Water Resource, pp.1-11.
Infrared Processing and Analysis Center (IPAC). 2009. Site level field appraisal for integrated protected area co-management Khadimnagar National Park. Available at: http://www.nisorgo.org. [Last access on 6 December 2010]
Islam J, Ahmed AN, Hossain MA, Rashid MM, Atauzzaman M. 2006. Deforestation study of Dinajpur Sal Forest using GIS and remote sensing techniques. J Subtrop Agric Res Dev, 4(1): 47–54.
Islam J, Quadir DA. 1988. Modhupur forest map based on digital classification of Landsat TM data. Dhaka, Bangladesh: SPARRSO (Space Research and Remote Sensing Organization)
Jensen JR. 1996. Introductory digital image processing. New Jersay: Prentice Hall.
Karia JP, Porwal MC, Roy PS, Sandhya G. 2001. Forest change detection in Kalarani Round, Vadodara, Gujarat- A remote sensing and GIS approach. Journal of the Indian Society of Remote Sensing, 29(3): 129-135.
Li XY, Wang ZM, Song KS, Zhang B, Liu DW, Gue ZX. 2007. Assessment for salinized wasteland expansion and land use change using GIS and remote sensing in the West Part of Northeast China. Environmental Monitoring and Assessment, 131: 421-437.
Lillesand TM, Kiefer RW. 2000. Remote Sensing and Image Interpretation. John Wiley and Sons, New York.
Mukul SA, Uddin MB, Uddin MS, Khan MASA, Marzan B. 2008. Protected area of Bangladesh: Current status and efficacy for biodiversity conservation. Pakistan Academy of Science, 45(2): 59-68.
Nishorgo. 2008. Protected Area Co-management Where Poverty and Forest Intersect: Lesson From Nishorgo in Bangladesh. In: DeCosse PJ, Thompson PM, Ahmad IQ, Sharma RA, Mazumder AH (eds). Nishorgo Network, a joint venture protected area co-management programme of USAID and Bangladesh Forest Department.
Panigrahy RK, Kale MP, Dutta U, Mishra A. 2010. Forest cover change detection of Western Ghats of Maharashtra using satellite remote sensing based visual interpretation technique. Current Science, 98(5): 657-664.
Phong LT. 2004. Analysis of forest cover dynamics and their driving forces in Bach Ma National Park and its buffer zone using remote sensing and GIS. M.sc Thesis, Faculty of Geo-information Science and Earth Observation (ITC), University of Twente, the Netherlands.
Quadir DA, Rahman A, Haque F, Ahmed IU, Runkel M. 1998. Monitoring of forest cover in Chittagong forest division of Bangladesh using remote sensing and GIS techniques. Journal of Remote Sensing and Environment, 2: 1–18.
Roy PS, Giriraj A. 2008. Land use and land cover analysis in Indian Context. Journal of Applied Sciences, 8(8): 1346-1353.
Singh A. 1989. Digital change detection technique using remotely sensed data. International Journal of Remote Sensing, 10(6): 989-1003.
Uddin K, Gurung DR. 2005. Land cover change in Bangladesh- a knowledge based classification approach. (Available at: http://geoportal.icimod.org. [Last access on 19 November, 2010]
United States Agency for International Development (USAID). 2006. Landuse/Land cover maps of six protected areas of nishorgo support project (NSP). Available at: http://www.nisorgo.org. [Last accessed on 13 December, 2010]
Vina A, Echavarria FA, Rundquist DC. 2004. Satellite change detection analysis of deforestration rates and patterns along the Colombia- Ecuador Border. Royal Sewdish Academic of Sciences, 33(3): 117-127.
 Journal of Forestry Research2014年2期
- Journal of Forestry Research的其它文章
- Compatibility and complementarity of indigenous and scientific knowledge of wild plants in the highlands of southwest Saudi Arabia
- Fragmentation patterns and systematic transitions of the forested landscape in the upper Amazon region, Ecuador 1990?2008
- Carbon sequestration in Chir-Pine (Pinus roxburghii Sarg.) forests under various disturbance levels in Kumaun Central Himalaya
- Genetic variability and divergence studies in pod and seed traits of Pongamia pinnata (L.) Pierre., accessions in Bay Islands
- Spatial distributions of tropical tree species in northern Vietnam under environmentally variable site conditions
- Goal programming approach for sustainable forest management (case study in Iranian Caspian forests)