
Rank correlation among different statistical models in ranking of winter wheat genotypes,
2014-03-13 05:51:30MozffrRoosteiRezMohmmdiAhmedAmri
The Crop Journal 2014年1期
Mozffr Roostei,Rez Mohmmdi*,Ahmed Amri
aDryland Agricultural Research Institute(DARI),Maragheh,Iran
bDryland Agricultural Research Institute(DARI),P.O.Box 67145-1164,Kermanshah,Iran
cInternational Center for Agricultural Research in the Dry Areas(ICARDA),Rabat,Morocco
1.Introduction
In crop breeding programs,genotypes are evaluated in multienvironment trials (METs) for testing their performance across environments and selecting the best genotypes in specific environments.Genotype × environment (GE) interaction is an important issue faced by plant breeders in crop breeding programs.A significant GE interaction for a quantitative trait such as grain yield can seriously limit progress in selection.Variance due to GE interaction is an important component of the variance of phenotypic means in selection experiments[1].GE interactions complicate the identification of superior genotypes [2] but their interpretation can be facilitated by the use of several statistical modeling methods.These methods may use linear models,such as joint regression analysis [3–5],multivariate analytical methods such as AMMI(additive mean effects and multiplicative interaction) analysis[6,7],or GGE(genotype plus GE interaction)biplot analysis[8,9].
The linear regression of genotype values on environmental mean yield [3,4],frequently termed joint regression analysis,is undoubtedly the most popular method for analyzing GE interaction,owing to its simplicity and the ready applicability of its information on adaptive responses to locations other than the chosen test sites.Earlier,Finlay and Wilkinson [4]proposed the use of linear regression slopes as a measure of stability.Eberhart and Russell [5] further proposed that both regression coefficients and deviations from linear regression(S2di) should be taken into consideration in identifying stable genotypes,and suggested that a genotype with b = 1.0 and S2di = 0 would be regarded as stable.
The AMMI model uses analysis of variance (ANOVA,an additive model) to characterize genotype and environment main effects and principal component analysis(a multiplicative model) to characterize their interactions (IPCA).The AMMI analysis has been shown to be effective; it captures a large portion of the GE sum of squares,clearly separating the main and interaction effects; and the model often provides an agronomically meaningful interpretation of the data[7].Another powerful statistical model that addresses some of the disadvantages of AMMI is the GGE biplot.The method is effective for identifying the best-performing cultivar across environments,identifying the best cultivars for mega-environment differentiation,and evaluating the yield and stability of genotypes[8,9].According to the GGE biplot,a highly stable genotype would have a shorter projection on to the average environment coordinate (AEC)abscissa,irrespective of its direction[9].
Recent review articles[10–12]have compared these statistical models.Gauch[10]and Gauch et al.[12]reviewed the AMMI and GGE literature,favoring AMMI.Yan et al.[11]responded to those articles,favoring GGE.Several studies have also been performed comparing GGE biplots and YSi in bean [13],maize [14],and durum wheat[15];GGE biplots and JRA in maize[16]and triticale[17]; and JRA and AMMI models in cereal crops [18] for stability analysis.However,little is known about rank correlation among the four statistical methods(AMMI analysis,GGE biplot,JRA,and YSi statistic)applied in a single study.The main objectives of the present study were to(i)compare the statistical methods(AMMI analysis,GGE biplot,JRA,and the YSi statistic)in the ranking of 20 winter wheat genotypes for yield,stability,and yield–stability and(ii)evaluate rank correlations among the statistical methods on the basis of yield ranks,stability ranks,and yield–stability ranks.
2.Materials and methods
2.1.Experimental data
Grain yield data obtained from 20 winter wheat genotypes,consisting of 18 breeding lines(G1–G18)and two check cultivars(G19 and G20,representing the landrace “Sardari” and the released cultivar “Azar-2”,respectively),grown in eight test locations representative of winter wheat growing areas in Iran for three consecutive cropping seasons (2003–2005),were subjected to analysis of rank correlation among the four statistical procedures(AMMI,GGE biplot,JRA,and YSi statistic)in the rankings of genotypes.In each environment (location–year combination),the experimental layout was a randomized complete block design with four replicates.The plot size was 7.2 m2(6 rows,6 m long,20 cm row spacing).The fertilizer rate was 50 kg N ha-1and 50 kg P2O5ha-1applied at planting stage.
2.2.Statistical analysis
Combined analysis of variance(ANOVA)for grain yield data was performed to determine the effects of environment,genotype,and GE interaction.Four statistical methods were applied to evaluate GE interaction in the wheat MET data.Regression analysis was performed for each of the 20 wheat genotypes based on the method of Eberhart and Russell [5].The performance of each genotype in each environment was regressed on the means of all genotypes in each environment.Genotypes with regression coefficient (b) of unity and variance of regression deviations(S2di)equal to zero will be highly stable.
The yield stability (YSi) statistic was generated as described by Kang [19] and applied for selecting high-yielding and stable genotypes.Ranks were assigned for mean yield,with the genotype with the highest yield given a rank of 20.Similarly,ranks were assigned for the stability parameter with the lowest estimated value receiving the rank of 1.Stability ratings were computed as follows:-8,-4,and-2 for stability measures significant at P <0.01,0.05,and 0.10,respectively;and 0 for the non-significant stability measure.The stability ratings of-8,-4,and-2 were chosen because they changed the genotype ranks from those based on yield alone[19].
AMMI analysis was performed with IRRISTAT 5.1 software[20].AMMI analysis combines additive components in a single model for the main effects of genotypes and environments,as well as multiplicative components for the interaction effect.Genotypes(or environments)with large IPC scores(either positive or negative)have large interactions,whereas genotypes(or environments)with IPC1 scores near zero have small interactions.
To further describe stability using AMMI analysis,the AMMI statistic coefficient (D) was calculated as follows,[21] and is referred to as AMMI distance:
where D is the distance of the interaction principal component (IPC) point from the origin in space,N is the number of significant IPCs,and γisis the score of genotype i in IPC.The greater the D value of a genotype,the greater the distance of the genotype from the origin of the IPCs.The genotype with the lowest value of the D statistic is considered the most stable[21].
The GGE biplot analysis was generated using the GGE biplot software[22].With the GGE biplot model,genotypes are evaluated for their combined G and GE interaction effects [8].For genotype evaluation,the basic features of a GGE biplot are as follows:a small circle in the center of a biplot indicates the average environment coordinate(AEC)which is the average of the environmental PC1 and PC2 scores.The single-arrowed line passing through the small circle and the biplot origin(0,0)is called the AEC abscissa with its arrow pointing towards the increasing yield.The AEC ordinate (the double-arrowed line perpendicular to the AEC abscissa passing through the biplot origin) indicates stability/instability.The genotypes are ranked along the AEC abscissa and their stability is projected as a vertical line from the AEC abscissa.A highly unstable genotype will have a longer projection from the AEC abscissa irrespective of its direction[9,22].
Spearman's rank correlation coefficients were calculated among the ranks given by the four statistical methods.For each method three kinds of rank (yield,stability,and yield–stability ranks)were determined.The ranks were determined as follows:
In JRA the ranks were assigned as follows:(i)the yield ranks were determined by giving the best rank (rank of 1) to the genotype having the highest regression coefficient and the last rank to the genotype having the lowest regression coefficient;(ii) the stability ranks were obtained by assigning the highest rank to the genotype with the lowest S2di; and (iii) the yield–stability ranks were determined as the sum of yield and stability ranks[16].
In AMMI the ranks were assigned as follows: (i) the yield ranks were determined by giving the highest rank to the genotype having the highest “nominal” yield (expected yield from the AMMI model equation without environmental deviations)[23];(ii)the stability rankings were obtained by assigning the highest rank to the genotype with the smallest AMMI distance(D)and(iii)the yield–stability ranks were determined as the sum of yield and stability ranks.
In GGE biplot the ranks were assigned as follows: (i) the yield ranks were determined by giving the best rank(rank of 1)to the ideal genotype,found at the far right-hand side,and the last rank to the genotype on the far left-hand side of the biplot; (ii) the stability ranks were determined as the visual ratings of the projections of genotypes on the AEC ordinate,with a shorter projection corresponding to a higher stability ranking;and(iii)the yield–stability ranks were determined as the sums of GGE yield and stability ranks [16].Yield–stability is also equal to GGE distance,which is a measure of the distance to the “ideal” genotype.Genotypes are evaluated in terms of both mean performance and stability [22].
For the YSi statistic,the yield ranks were obtained from the phenotypic adjusted yield data [19].The stability ranks were obtained by assigning the best rank(rank of 1)to the genotype with the lowest Shukla's [24] stability variance (σ2); and the yield–stability ranking were determined as the sums of yield and stability ranks.
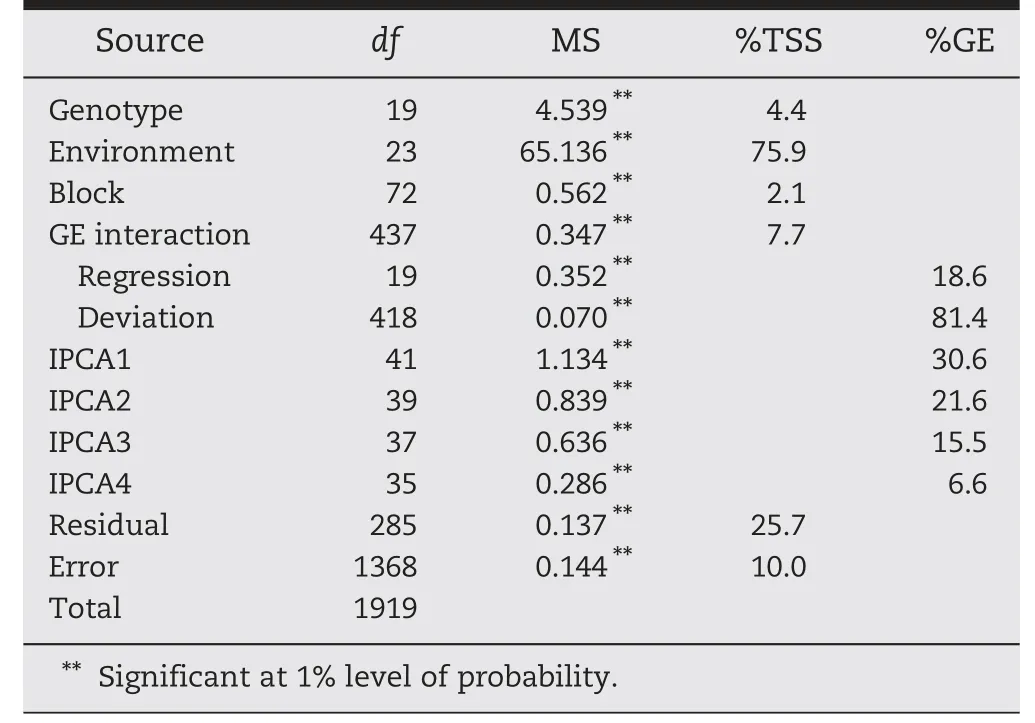
Table 1-Combined analysis of variance,joint regression,and AMMI analyses for 20 bread wheat genotypes grown in 24 environments.
3.Results
3.1.Combined ANOVA
The combined analysis of variance(ANOVA)revealed that the grain yield was significantly affected by the environment,followed by GE interaction and genotype effects (Table 1).Environment accounted for 75.9% of the total sum of squares(TSS),followed by the GE and G effects accounting for 7.7 and 4.4,respectively.Most of the TSS was explained by the environment,reflecting a much wider range of environment main effects than genotype main effects.
3.2.Genotype comparison and selection
3.2.1.Joint regression analysis
About one fifth of the significant GE interaction was attributed to heterogeneity among regressions,while the remaining variance was attributed to deviation mean squares (S2di) (Table 1).A large proportion of the GE interaction was due to a nonlinear component,which maybe regarded as a very important parameter for the selection of stable genotypes.The average grain yield of genotypes over 24 environments varied from 1.891(corresponding to G6)to 2.682 t ha–1(corresponding to G4).According to the Finlay and Wilkinson method,genotypes G15,G17,and G18 were identified as highly stable genotypes,as their regression coefficients were within one standard error(SE)of the overall average coefficient of regression (Fig.1).Genotypes G18 and G17 would be considered well suited to the environments tested,as they had the highest grain yield within the range of stability.According to Fig.1,genotypes G4,G10,G1,G20,and G8 with b >(1.0 + 1SE) had below-average stability and were adapted specifically to high-performing environments,while genotypes G9,G6,G13,and G2 with b <(1.0-1SE)had belowaverage stability and were poorly adapted to all environments owing to their low mean yield performance.Using the Eberhart and Russell method,G20,G19,and G1 were considered stable with grain yields above the overall average yield (Fig.2),and genotypes G6,G5,and G9 with the highest value of S2di were the most unstable genotypes,with low yield performance.G8,followed by G4,G10,G17,and G18 were relatively unstable genotypes with high yield performance(Fig.2).
3.2.2.Yield stability (YSi)statistic
Simultaneous selection for yield and stability performances using the YSi statistic indicated that genotypes G4,G10,G17,G19,G18,and G1 were both high-yielding and stable.In addition to these genotypes,G12,G20,G15,and G11 had YSi values greater than the mean(Table 2)and can be regarded as desirable genotypes.
3.2.3.AMMI analysis
The choice of the AMMI-1 biplot instead of AMMI-2 was made to allow comparison with the output of other statistical methods presenting both yield and stability statistics simultaneously.In the AMMI-1 biplot(Fig.3),the abscissa represents main effects(G and E) and its ordinate represents IPC1 scores.It thus provides a means of simultaneously visualizing both mean performance (G) and stability (IPC1) of genotypes.The IPC1 accounted for a total of 30.6%of the GE interaction,with 9.4%for the corresponding interaction degrees of freedom in the model.The AMMI-1 biplot accounted for 90.3% of the total SS and is thus suitable for interpreting the GE interaction and main effects.Genotypes G1 and G4 with mean yields greater than the overall mean and low IPC1 scores had a high combination of yield and stability performances.Genotypes G10 and G17 were similar to G1 and G4 in the main effect but tended to contribute more to GE interaction.These genotypes were superior to the checks (G19 and G20) with respect to yield and stability performances.The two genotypes G6 and G9,with mean yields less than the overall mean and with the highest distance from the IPC1 = 0 level,tended to contribute highly to GE interaction and accordingly can be regarded as the most unstable genotypes.
3.2.4.GGE biplot analysis
Fig.4 shows the ranking of the 20 bread wheat genotypes based on their mean yield and stability performances.According to the GGE biplot,the ideal genotype must have a high PC1 value(high mean productivity) and a PC2 value near zero (high stability).Thus,based on the graphical interpretation,genotypes G4 and G10 followed by G18,G11,and G1 with high mean yield and stability performances can be considered as ideal genotypes.The other genotypes lying on the right side of the line with double arrows had yield performance greater than the mean and the genotypes on the left side had yields lower than the mean.Genotypes with high yield but low stability were G19,G20 (control),and G8,while those with average yield and highest stability were G12,G15,and G7.Since GGE represents G + GE and since the AEC abscissa approximates the genotypes'contributions to G,the AEC ordinate must approximate the genotypes' contributions to GE,which is a measure of their stability or instability.Thus,G18,G12,and G2 were the most stable genotypes,as they were located almost on the AEC abscissa and had a near-zero projection onto the AEC ordinate,indicating that their ranks were highly consistent across environments.In contrast,G8,G6,and G9 were among the genotypes with the lowest stability and with higher (G8) and lower (G6 and G9) mean yield performances than the overall mean.
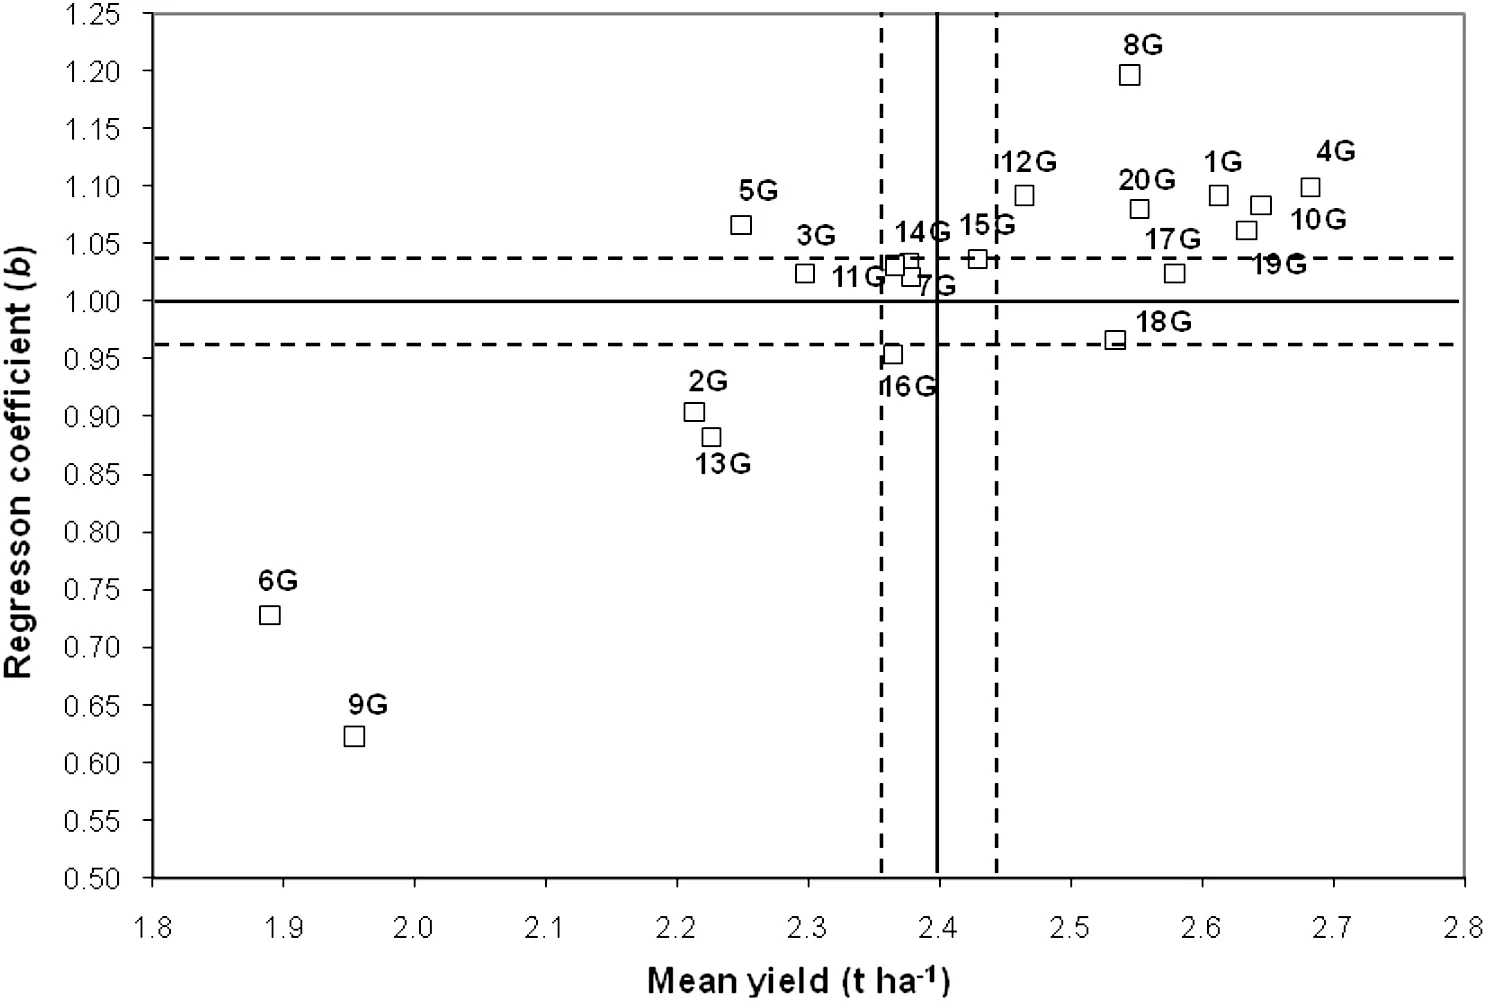
Fig.1-Scatter plot of regression coefficients against mean yields of 20 bread wheat genotypes (G1-G20)grown in 24 environments.The horizontal solid line represents the mean coefficient of regression and the vertical solid line denotes the mean grain yield.The standard error(±1SE)is included and represented by the dotted lines for both yield and regression coefficients.
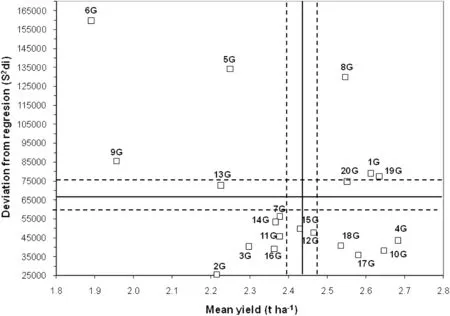
Fig.2-Scatter plot of variance of regression deviations(S2di)against mean yields of 20 bread wheat genotypes(G1-G20)grown in 24 environments.The horizontal solid line represents the mean coefficient of regression and the vertical solid line denotes the mean grain yield.The standard error (±1SE) is represented by the dotted lines for both yield and S2di values.
3.3.Comparison of statistical methods in the ranking of genotypes
The yield,stability and yield–stability ranks for 20 tested genotypes in 24 environments based on each of the statistical methods mentioned above are given in Table 3.Comparison of the statistical methods based on the yield ranks showed that the methods generally gave similar results in the ranking of genotypes.For example,the five top-ranked genotypes based on AMMI were G4,followed by G10,G19,G1,and G17;based on the GGE biplot were G4 followed by G10,G1,G19,and G17; based on JRA were G8,G4,G1 = G12,and G10;and based on the YSi statistic were G4,G10,G19,G1,and G17.

Table 2-Estimates of the yield-stability(YSi)statistic for 20 bread wheat genotypes over 24 environments.
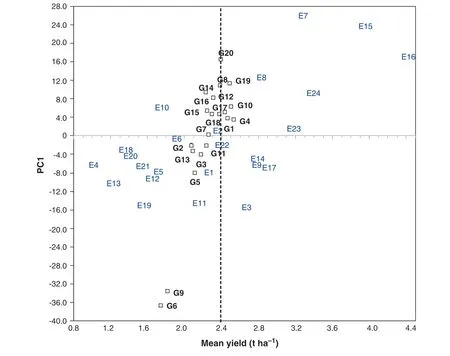
Fig.3-AMMI-1 biplot of first IPCA scores vs.genotypic and environmental mean yields.G1-G20 are the genotype codes and E1-E24 are the environment codes.
With respect to stability ranks,genotypes G2,G15,G12,G11,and G17 were found to be stable based on AMMI distance,whereas the five top-ranked genotypes based on the GGE biplot were G18 = G12 = G2,G14,and G3,showing that AMMI and the GGE biplot gave similar results in identifying two of the five top-ranking genotypes as stable.According to JRA the most desirable genotypes based on stability ranks were G2,G17,G10,G16,and G3,and based on the YSi statistic the most stable genotypes were G2,G17,G3,G16,and G18.Similar stability ranks were assigned by the JRA method and YSi statistic,as they identified four of the five top-ranking genotypes as stable.
For yield–stability,the AMMI analysis identified G10 followed by G17,G3,G15,and G12 as the top-ranking high-yielding and stable genotypes; whereas G18 followed by G17 = G12 and G4 = G10 were characterized by the GGE biplot as high-yielding and stable.According to JRA,the top-ranking high-yielding and stable genotypes were G10,followed by G4,G12,G17,and G3,and based on the YSi statistic the highest-ranking genotypes were G4 = G10,G17,G19,and G1 =G18.All four methods identified G10 and G17 as among the five top-ranking high-yielding and stable genotypes.
3.4.Relationships among the statistical methods
Significant rank correlations were found between the statistical methods in the ranking of genotypes for yield,stability and yield–stability (Table 4).
With respect to yield,the statistical methods were significantly correlated (P <0.01) in the ranking of genotypes.The correlations varied from 0.72 (JRA–YSi; P <0.01) to 0.99 (GGE–AMMI;P <0.01)indicating that AMMI and the GGE biplot agreed most closely in ranking genotypes for yield.
The statistical methods were positively correlated in identifying stable genotypes.The Spearman's rank correlations for stability indices ranged from 0.53 (GGE–YSi;P <0.05)to 0.97(JRA–YSi).The AMMI distance (AMMID)was highly correlated with the stability indices in JRA (r = 0.83;P <0.01) and YSi (r = 0.86; P <0.01).These three stability indices(AMMID,S2di,and σ2)showed moderate correlations with the stability index in the GGE biplot.The correlations varied from 0.53(GGE–YSi;P <0.05)to 0.56(GGE–AMMID and GGE–JRA;P <0.05).
For yield–stability,rank correlation coefficients between the statistical methods varied from 0.64 (P <0.01) for JRA and YSi to 0.89 (P <0.01) for AMMI and YSi,indicating that AMMI and the YSi are better correlated than the other methods for ranking genotypes based on integrating yield with stability performance.The GGE biplot had the highest rank correlation with YSi (r = 0.70; P <0.01).
Positive rank correlations ranging from 0.55(for JRA;P <0.05)to 0.73(for AMMI;P <0.01)were found between yield ranks and yield–stability ranks,indicating that the yield–stability indices represent a dynamic concept of stability.Selection based on yield–stability indices would be most useful if the breeder were interested primarily in yield.Stable genotypes,according to these indices,would be recommended for favorable environments.With this type of stability,stable genotypes show yield performance relative to the yield potential of the different environments.However,if selection of stable genotypes is based on these methods,a genotype with low general adaptability but high specific adaptability may be discarded.
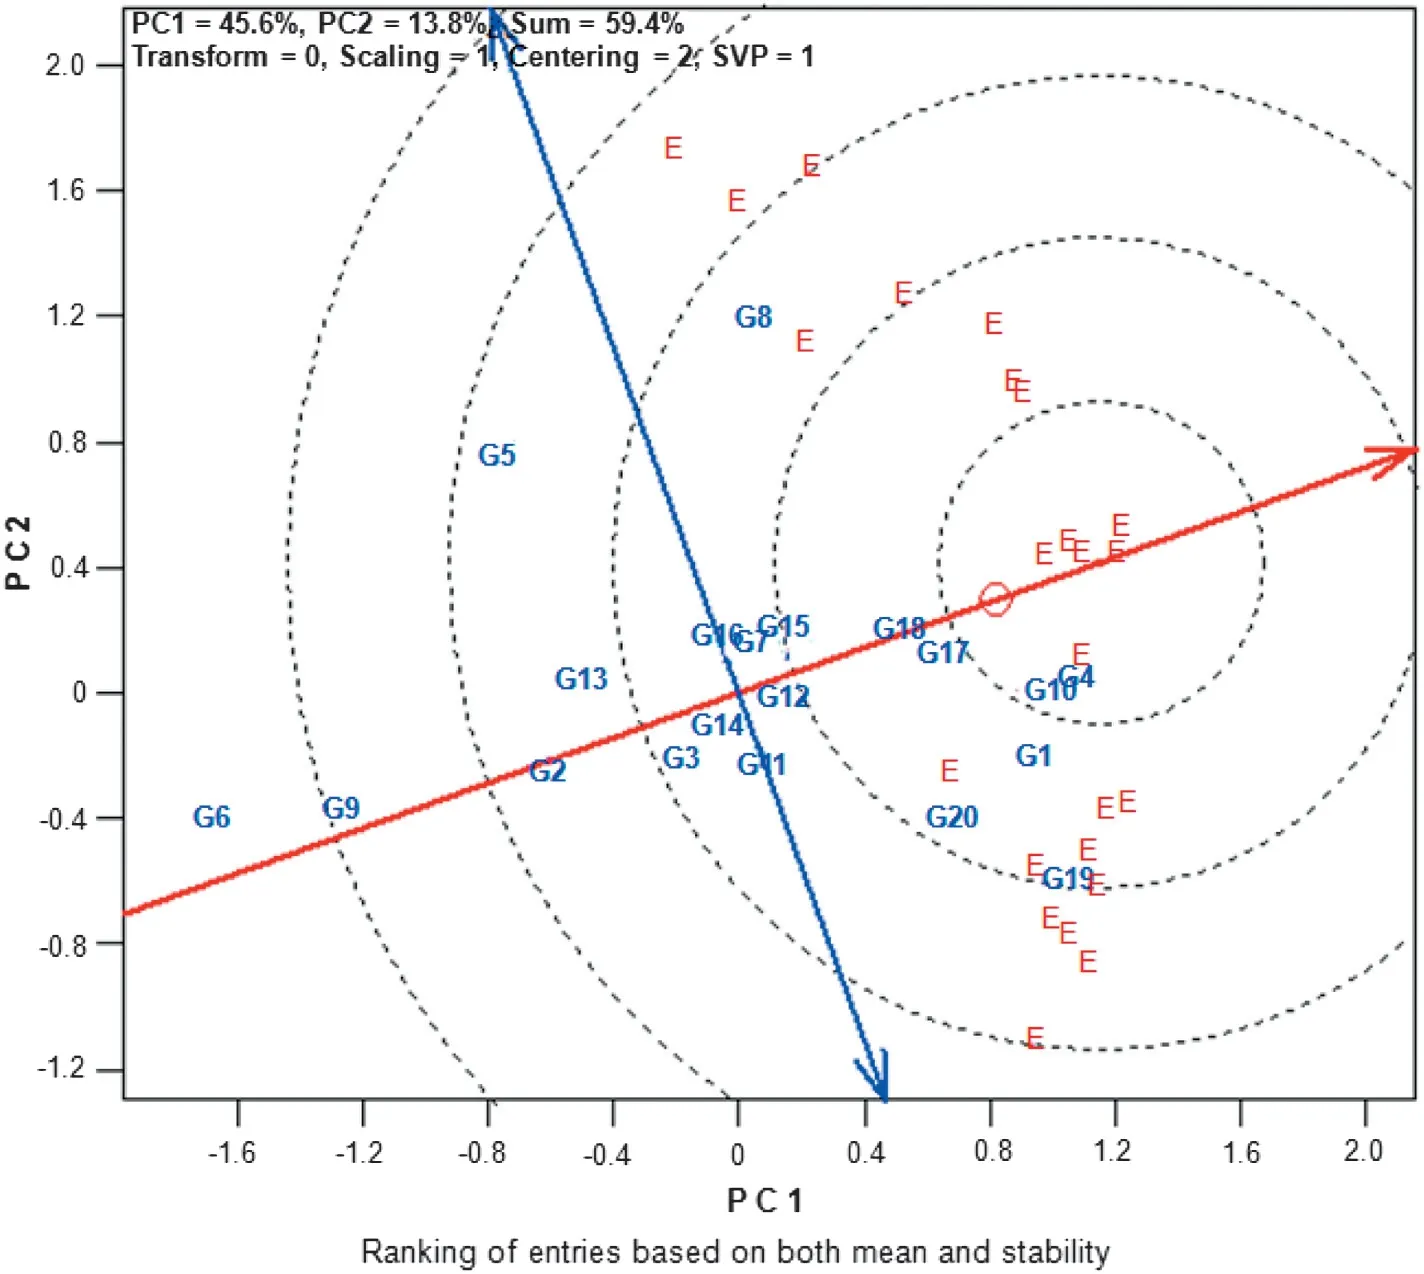
Fig.4-GGE biplot showing the ranking of 20 genotypes (G1-G20)for both mean yield and stability based on the “average environment coordinate”(AEC).The data were not transformed(“Transform = 0”)and were not scaled(“Scaling = 1”)but were environmentally-centered(“Centering = 2”).The biplot was based on a genotype-focused singular-value partitioning(“SVP =1”)and therefore is appropriate for visualizing the similarities among genotypes.

Table 3-Yield ranks,stability ranks,and yield-stability ranks given by each statistical method for 20 winter wheat genotypes across 24 test environments.
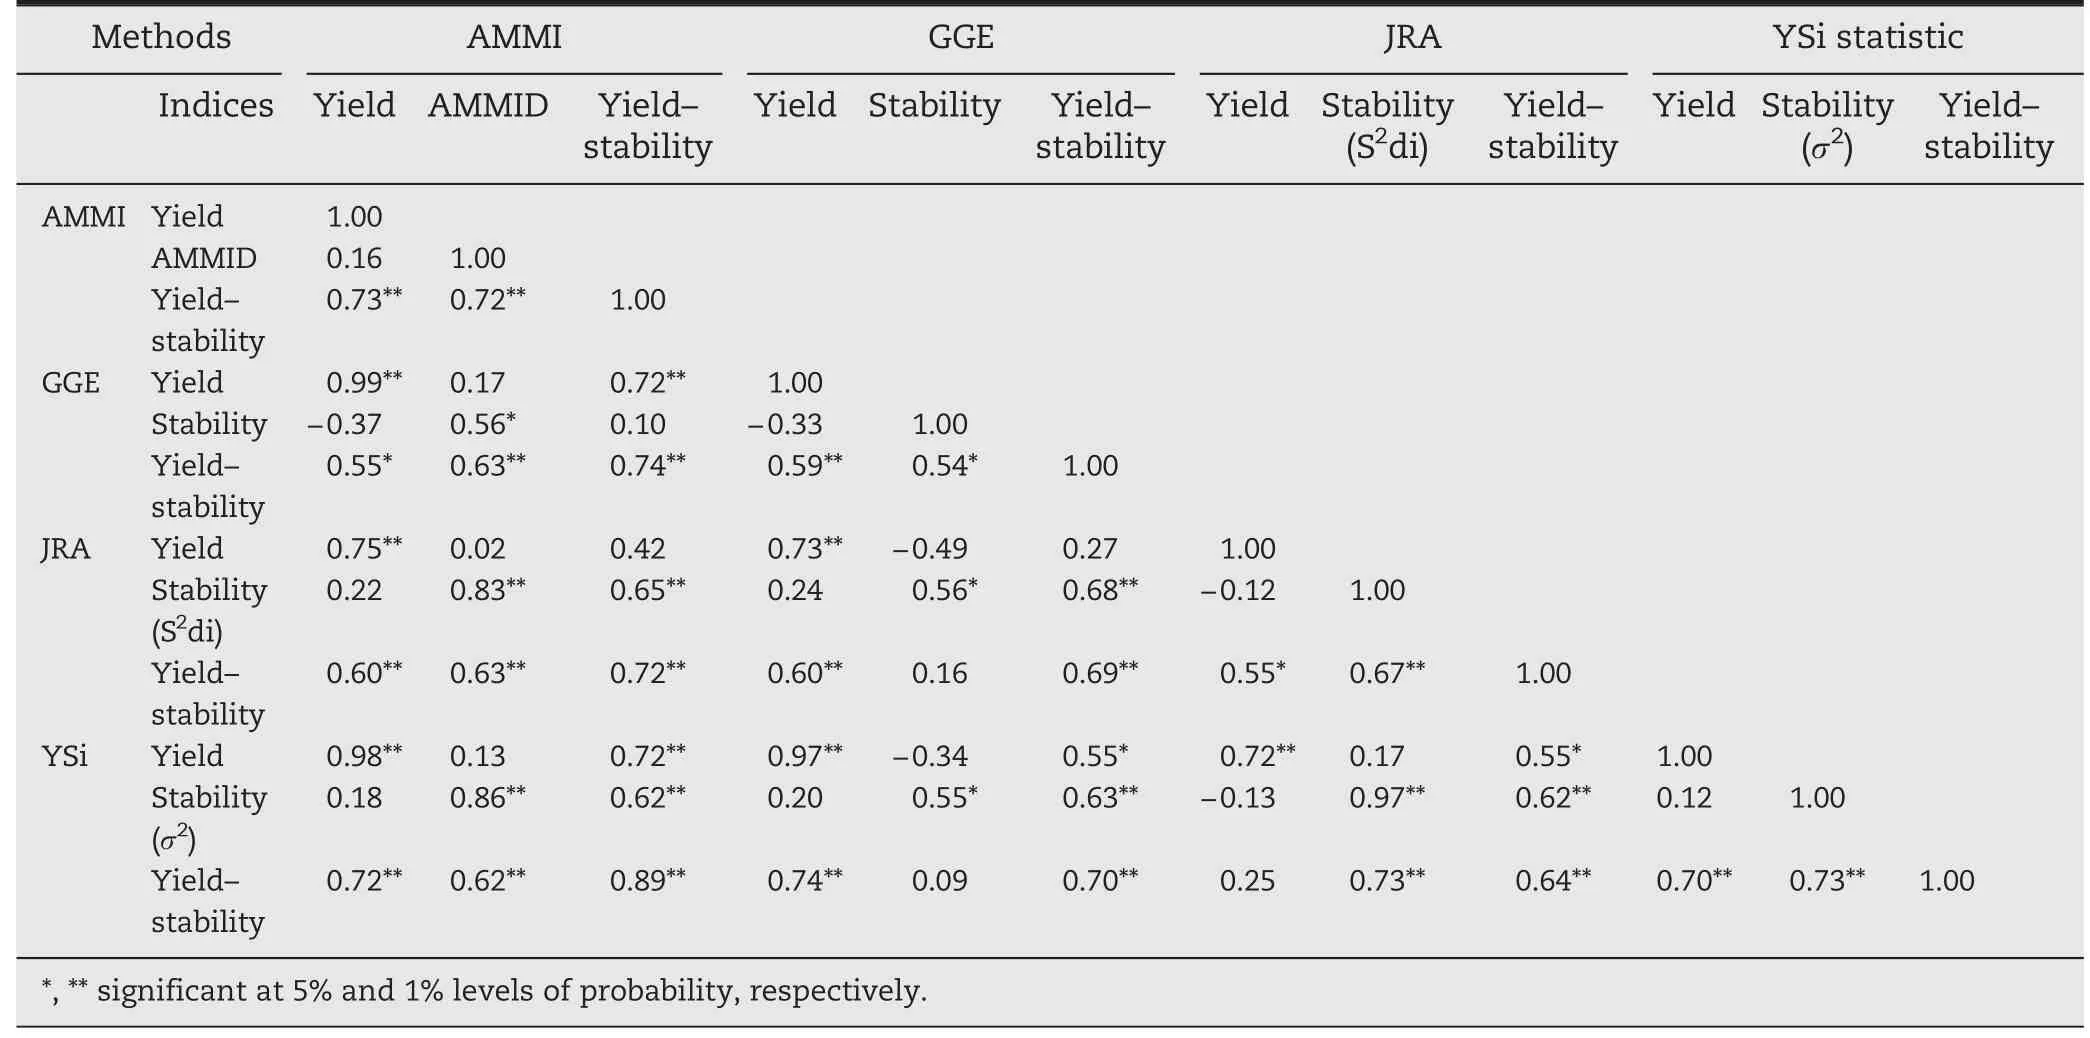
Table 4-Spearman's rank correlations among four statistical methods based on yield ranks,stability ranks,and yieldstability ranks for 20 winter wheat genotypes across 24 test environments.
The significant positive correlations (P <0.01) between σ2,S2di,and AMMID suggest that these three stability indices from three statistical methods (YSi,JRA,and AMMI,respectively) were significantly correlated in the ranking of genotypes for stability.The moderate correlation(P <0.05)between the GGE stability index and the three other stability indices suggests that the GGE biplot was in moderate agreement with the other three statistical methods for stability rankings.
4.Discussion
The results from this study suggest that a marked degree of GE interaction is present in the bread wheat MET data.Evaluation of genotypes using MET data appears to improve genotype evaluation and would enable the characterization of stability performance of tested genotypes over unpredictable environments.For the majority of MET,environment accounts for most of variation[9,14,16,25].The observed pattern of GE interaction for grain yield in this winter wheat MET supports a hypothesis of the presence of differentially adapted winter wheat genotypes and the need for stability analysis.
Owing to its simplicity,the joint regression model has been the most popular approach for analysis of adaptation [26,27].However,the method has some statistical limitations.Caution should be applied with low numbers of genotypes and locations,especially when extreme values of site mean yield are represented by just one location [28,29].Significant rank correlation(r = 0.72; P <0.01) was observed between regression correlation and original yield data,suggesting that JRA results were generally in agreement with the original data.
The GGE biplot mainly allows the visualization of any crossover GE interaction,an important advantage for a breeding program.Moreover,the GGE biplot provides greater insight,as it illustrates the relationship between the genotype and its GE interaction [8].However,the GGE biplot results need to be validated with the original data.According to the original data,genotypes G4 and G6 had respectively the highest and lowest mean yield performances across environments,an inference supported graphically by fitting the GGE model to the original data(Fig.4 and Table 1),suggesting that the GGE biplot results are in agreement with the original yield data.These results are in accord with those of other studies [16,17] that found agreement between GGE biplot results and the original yield data.
Phenotypic yield stability is a trait of special interest for plant breeders and farmers.This trait can be quantified if genotypes are evaluated in different environments [30].No correlation was found between yield ranks and stability ranks that were based on measuring GE interaction,including AMMI distance in the AMMI model;stability index in the GGE biplot;S2di in the JRA;and σ2in the YSi statistic,indicating that these stability indices describe static stability and accordingly could be used if selection is to be based primarily on stability.This conclusion is in agreement with other reports on cereal crops for which stability indices based on measuring GE effects are not correlated with mean yield in bread wheat,durum wheat and barley [31].It is also supported by other reports [32–36].Helms[32]found that the correlations of oat yield with σ2and S2di were poor.Jalaluddin and Harrison [33] reported no correlation of wheat grain yield with σ2or S2di.Sneller et al.[35] also found no relationship of soybean yield with the statistics AMMI,σ2,and S2di.
Many statistical methods have been developed to analyze data from MET to gain a better understanding and interpretation of observed GE interaction patterns,with the aim of identifying outstanding new cultivars with high stability in crop breeding programs.A worthwhile discussion of many of these methods and their efficiency in identifying superior genotypes in MET data can be found in reviews[10–13,16–18].Fan et al.[14] and Mohammadi et al.[15] reported high rank correlations between GGE and YSi and concluded that YSi should be useful in selecting superior genotypes in the absence of GGE biplot software.Baxevanos et al.[37]also reported a high correlation between YSi and GGE distance.Goyal et al.[17]reported some agreement between JRA and GGE biplot methods in identifying stable genotypes with high yield performance.According to Goyal et al.[17],S2di and GGE biplot models were not in general agreement in identifying high-yielding and stable genotypes,a conclusion differing from that of Alwala et al.[16].
Our results suggest that it is advisable to use all methods to improve efficiency of identifying superior genotypes.Compared to the joint regression and YSi statistics,AMMI and GGE biplot analysis provide biplots and information on the main and interaction effects.They provide useful information on the similarities of locations for genotype adaptive responses,thereby supporting decisions about the definition of subregions,adaptation targets,and test sites.They allow visual examination of the relationships among test environments,genotypes,and GE interaction[11].However,in this paper our objective was to evaluate the rank correlations among the statistical methods for yield,stability and yield–stability.The four methods result in identifying similar dominant genotypes with high yield and stability,a trait of special interest for plant breeders and farmers.However,integrating yield and stability of genotypes tested in unpredictable environments is a common breeding objective and would be useful in practice to enhance yield and stability in breeding programs.Based on the results of the four statistical models,breeding lines G17,G10,G4,and G18 maybe regarded as the most highly recommended genotypes for release in rainfed winter wheat-growing areas of Iran.
5.Conclusion
Rank correlation analysis revealed the highest (i) similarity between the GGE biplot and AMMI in ranking genotypes for yield,(ii) correlations between JRA,AMMI,and YSi statistic for ranking genotypes for stability,and (iii) agreement between AMMI and YSi in ranking genotypes for integrating yield with stability.Although the four methods gave generally similar results in identifying superior genotypes,the GGE biplot was more versatile and flexible,and provided a better understanding of GE interaction,than the other methods.Positive increases in yield and yield stability are attributable primarily to the genetic improvement of wheat breeding lines.Increased yields have resulted from the trend in wheat breeding programs to test and develop wheat breeding materials for wide adaptation,which has also increased yield stability.The yield stability of the high-yielding breeding lines evaluated in the present study was variable,but a few genotypes combined yield stability with high yield,indicating that genetic improvement has been made in both yield and stability performances in wheat breeding lines in rainfed cold areas of Iran.
This work was part of the bread wheat project of the Dryland Agricultural Research Institute (DARI) and was supported by the Agricultural Research and Education Organization (AREO)of Iran.We thank all members of the project who contributed to the implementation of the field work.
[1] A.R.Hallauer,J.B.Miranda,Quantitative Genetics in Maize Breeding,Iowa State Univ.Press,Ames,IA,1983.
[2] R.W.Allard,A.D.Bradshaw,Implication of genotype–environmental interaction in applied plant breeding,Crop Sci.5(1964) 503–506.
[3] F.Yates,W.G.Cochran,The analysis of groups of experiments,J.Agric.Sci.(Camb.) 28(1938) 556–580.
[4] K.W.Finlay,G.N.Wilkinson,The analysis of adaptation in a plant breeding program,Aust.J.Agric.Res.14 (1963)742–754.
[5] S.A.Eberhart,W.A.Russell,Stability parameters for comparing varieties,Crop Sci.6(1966) 36–40.
[6] R.W.Zobel,M.J.Wright,H.G.Gauch,Statistical analysis of a yield trial,Agron.J.80 (1988) 388–393.
[7] H.G.Gauch,Statistical Analysis of Regional Yield Trials:AMMI Analysis of Factorial Designs,Elsevier Science Publishers,Amsterdam,The Netherlands,1992.
[8] W.Yan,L.A.Hunt,Q.Sheng,Z.Szlavnics,Cultivar evaluation and mega-environment investigation based on the GGE biplot,Crop Sci.40(2000) 597–605.
[9] W.Yan,M.S.Kang,GGE Biplot Analysis: A Graphical Tool for Breeders,Geneticists,and Agronomists,CRC Press,Boca Raton,FL,2003.213.
[10] H.G.Gauch,Statistical analysis of yield trials by AMMI and GGE,Crop Sci.46(2006) 1488–1500.
[11] W.Yan,M.S.Kang,B.Ma,S.Woods,P.L.Cornelius,GGE Biplot vs.AMMI analysis of genotype-by-environment data,Crop Sci.47(2007) 643–655.
[12] H.G.Gauch,H.P.Piepho,P.Annicchiarico,Statistical analysis of yield trials by AMMI and GGE:further considerations,Crop Sci.48(2008) 866–889.
[13] M.S.Kang,V.D.Aggarwal,R.M.Chirwa,Adaptability and stability of bean cultivars as determined via yield–stability statistic and GGE Biplot analysis,J.Crop Improv.15(2006)97–120.
[14] X.M.Fan,M.S.Kang,H.Chen,Y.Zhang,J.Tan,C.Xu,Yield stability of maize hybrids evaluated in multi-environment trials in Yunnan,China,Agron.J.99(2007) 220–228.
[15] R.Mohammadi,R.Haghparast,A.Amri,S.Ceccarelli,Yield stability of rainfed durum wheat and GGE biplot analysis of multi-environment trials,Crop Pas.Sci.61(2010)92–101.
[16] S.Alwala,T.Kwolek,M.McPherson,J.Pellow,D.A.Meyer,Comprehensive comparison between Eberhart and Russell joint regression and GGE biplot analyses to identify stable and high yielding maize hybrids,Field Crop Res.119 (2010)225–230.
[17] A.Goyal,B.L.Beres,H.S.Randhawa,A.Navabi,D.F.Salmon,F.Eudes,Yield stability analysis of broadly adaptive triticale germplasm in southern and central Alberta,Canada,for industrial end-use suitability,Can.J.Plant Sci.91(2011)125–135.
[18] P.Annicchiarico,Joint regression vs AMMI analysis of genotype–environment interactions for cereals in Italy,Euphytica 94 (1997) 53–62.
[19] M.S.Kang,Simultaneous selection for yield and stability in crop performance trials: consequences for growers,Agron.J.85(1993) 754–757.
[20] IRRI,IRRISTAT Software 5.0 for Windows,International Rice Research Institute,Manila,Philippines,2005.
[21] Z.Zhang,C.Lu,Z.H.Xiang,Stability analysis for varieties by AMMI model,Acta Agron.Sin.24(1998) 304–309 (in Chinese with English abstract).
[22] W.Yan,GGE biplot–a Windows application for graphical analysis of multi-environment trial data and other types of two-way data,Agron.J.93(2001) 1111–1118.
[23] H.G.Gauch,R.W.Zobel,Identifying mega-environment and targeting genotypes,Crop Sci.37(1997) 381–385.
[24] G.K.Shukla,Some statistical aspects of partitioning genotype-environmental components of variability,Heredity 29 (1972) 237–245.
[25] Y.Zhang,Z.He,A.Zhang,M.van Ginkel,G.Ye,Pattern analysis on grain yield performance of Chinese and CIMMYT spring wheat cultivars sown in China and CIMMYT,Euphytica 147 (2006) 409–420.
[26] H.C.Becker,J.Leon,Stability analysis in plant breeding,Plant Breed.101 (1988) 1–23.
[27] I.Romagosa,P.N.Fox,Genotype by environment interaction and adaptation,in: M.D.Hayward,N.O.Bosemark,I.Romagosa (Eds.),Plant Breeding:Principles and Prospects Chapman &Hall,London,1993,pp.373–390.
[28] B.Westcott,Some methods of analysing genotype–environment interaction,Heredity 56 (1986)243–253.
[29] J.Crossa,Statistical analyses of multilocation trials,Adv.Agron.44 (1990) 55–85.
[30] F.Mekbib,Simultaneous selection for high yield and stability in common bean (Phaseolus vulgaris) genotypes,J.Agric.Sci.(Camb.) 138 (2002) 249–253.
[31] R.Mohammadi,M.Roostaei,Y.Ansari,M.Aghaee,A.Amri,Relationships of phenotypic stability measures for genotypes of three cereal crops,Can.J.Plant Sci.90(2010)819–830.
[32] T.C.Helms,Selection for yield and stability among oat lines,Crop Sci.33(1993) 423–426.
[33] M.D.Jalaluddin,S.A.Harrison,Repeatability of stability statistics for grain yield in wheat,Crop Sci.33(1993)720–725.
[34] F.Flores,M.T.Moreno,J.I.Cubero,A comparison of univariate and multivariate methods to analyze environments,Field Crop Res.56(1998) 271–286.
[35] C.H.Sneller,L.Kilgore-Norquest,D.Dombek,Repeatability of yield stability statistics in soybean,Crop Sci.37(1997)383–390.
[36] R.Mohammadi,S.S.Pourdad,A.Amri,Grain yield stability of spring safflower(Carthamus tinctorius L.),Aust.J.Agric.Res.59(2008) 546–553.
[37] D.Baxevanos,C.Goulas,S.Tzortzios,A.Mavromatis,Interrelationship among and repeatability of seven stability indices estimated from commercial cotton (Gossypium hirsutum L.) variety evaluation trials in three Mediterranean countries,Euphytica 161 (2008)371–382.
- The Crop Journal的其它文章
- Genome-wide analysis of the WRKY transcription factor gene family in Gossypium raimondii and the expression of orthologs in cultivated tetraploid cotton
- Development of highly glyphosate-tolerant tobacco by coexpression of glyphosate acetyltransferase gat and EPSPS G2-aroA genes
- SSR genetic linkage map construction of pea (Pisum sativum L.) based on Chinese native varieties
- Effects of exogenous ABA application on post-anthesis dry matter redistribution and grain starch accumulation of winter wheat with different staygreen characteristics
- Genetic characterization and linkage disequilibrium mapping of resistance to gray leaf spot in maize(Zea mays L.)
- Overexpression of GmDREB1 improves salt tolerance in transgenic wheat and leaf protein response to high salinity