
Numerical simulation of the natural fragmentation of explosively loaded thick walled cylinders
2014-02-09 10:07:03CULLISDUNSMOREHARRISONILEWTASRTOWNSLEY
Defence Technology 2014年2期
I.G.CULLIS*,P.DUNSMORE,A.HARRISONI.LEWTASR.TOWNSLEY
aQinetiQ,Fort Halstead,Sevenoaks,TN14 7BP Kent,UK
bRaytheon UK,The Pinnacles,Harlow,CM19 5BB Essex,UK
1.Introduction
The natural fragmentation of a shell,projectile or munition under the dynamic loading regimes of impact and detonation waves is of considerable interest to the warhead designer,the system designer and the ultimate end user who has to deploy it.Knowledge of the physics and dynamic material properties as drivers of the fragmentation process allows for their effective exploitation in a weapon design.The fragmentation is an important element in defining the Critical Effects Radius(CER)of a system,its potential for collateral damage,and hence its possible deployment roles in different theatres of operation.
The Weapons Science&Technology Centre(WSTC)meets the needs of the MOD and Industry in the provision of complex weapons research and technology.It delivers an appropriate balance of timely exploitable technology,innovation and the sustainment of UK sovereign capability and expert advice to support future procurements.
The WSTC was set up and established during 2008 and has been a successful change programme delivering a partnering approach to the management of complex weapons research in the UK.It has over 41 partners that comprise a mix of industrial primes,technology and sub-system providers,subject matter experts,consultants and academia.
The WSTC recognised that the ability to predict natural fragmentation using numerical simulation would represent a significant cost effective design capability.It therefore defined a research requirement to understand the ability of a number of different numerical simulation methodologies to describe the fragmentation of explosively loaded steel cylinders and predict the number of fragments generated including their masses and angular distributions.The numerical methods studied in the programme included,Euler,Euler-Lagrange and Smoothed Particle Hydrodynamics(SPH).The programme was led by Raytheon Systems Limited(RSL).This paper is concerned with the Euler element of the programme performed by QinetiQ.It describes the ability of the in-house Eulerian hydrocode GRIM to predict the experimentally observed fragmentation pattern,the issues identified and the work to understand them.The secondary objective of the study was to determine the effectiveness of the current experimental methods to characterise the fragmentation process and fragment distributions as a method for validating numerical simulations.
2.Background
The primary requirement of the study was to investigate the ability of different numerical schemes to reproduce the experimentally observed fragmentation pattern of a simple explosively loaded steel cylinder.This included the number and masses of the fragments and their angular distribution.The ability of the experimental method to provide an accurate measurement of the fragmentation process was also a factor in the study.
An additional objective was to understand the behaviour of the different material and fracture models used in the simulations and the material testing required to characterise them.In the case of the fracture algorithm,this includes the initiation of the fracture process,post fracture development and identification of fragments.
There has been some significant work to develop models to predict the natural fragmentation process of metals since the seminal work by Mott[1].Grady[2,3]developed an energy based approach to predict the size of fragments based on strain rate and a fragmentation toughness constant for the material.This methodology has also been applied to brittle materials with some success[4].
The work of Brannon[5]on ceramics has made a significant contribution to the numerical simulation of fragmentation.In a brittle material,the concept of a critical fl aw that acts to initiate fracture is well established.It implies that there is therefore a volume of material associated with this critical fl aw size and that the failure is size dependent.The standard approach to characterising the critical fl aw size from material tests therefore is to apply Weibull statistics to assign a probability of failure of the material.Brannon,in simulating the impact of a projectile with a ceramic target,used the numerical cell volume as the control volume and Weibull statistics to seed the cell with a failure probability,which was initiated using a random number generator.The method led to a significant improvement in the ability of the simulation to describe the experimental results.This approach has been extended to ductile metal fragmentation,with the numerical mesh seeded with failure sites which are initiated using a probability function[6,7].Variations of this approach were used in the other numerical methods investigated in this study.As they were not employed in the QinetiQ study,they will not be discussed here.
The experimental study of the natural fragmentation of metal cased explosive charges and shells has also been reported in Refs.[8-10].The work by Hiro et al.[10].is very useful in understanding the roles of cylinder wall thickness and defined crack initiation sites on fragment size and distribution.The work of Chhabildas et al.[8]on an AERMET?100 steel cylinder with similar dimensions to the charges in this study is also particularly relevant.
3.Experiments
The experimental programme was performed at QinetiQ Shoeburyness,UK,and consisted of three firings.The fragment spatial distribution,fragment mass distribution and fragment velocity spatial distribution were measured for each firing.
The experimental layout is shown in Fig.1.The cylinder was located at the centre of the arena mounted on a polystyrene block.The centre of the cylinder was at a height of 1.5 m above the ground.The charge was initiated by an electrical bridge wire detonator fitted to the top of the cylinder.A velocity foil on the cylinder captured the start of case rupture.
Strawboards to capture fragments were located at a distance of 3 m from the centre of the cylinder.The strawboard array was 3048 mm high by 2032 mm wide and spanned 37.4 in azimuth and 53.9 in elevation.The strawboard was fitted with velocity foils residing in 11 5 angular(polar)zones.The coordinate system and ITOP angular zones for recording fragmentation data are shown in Fig.2.The origin of the coordinate system is at the centre of the cylinder.The centre of the strawboard is aligned with the centre of the cylinder.The ITOP angular zones that coincide with the strawboard(Angular Zones 14 to 24 inclusive)are shown in Fig.3.
The ITOP protocol[11]is a NATO standard that has been established to provide a standardised methodology for characterising and measuring naturally fragmenting weapons.
A soft fragment recovery system and additional instrumentation,including blast gauges and high speed cameras,were included in the arena to recover undamaged fragments and to provide additional information on the early time expansion of the cylinders,fragment formation and motion for velocity determination.
4.Fragmentation cylinders
Fig.1.Experimental layout.
Fig.2.Angular zones.
The cylinders for the experiments were manufactured by QinetiQ Fort Halstead,UK,and were made from EN24W steel(representative of a warhead case steel)with a QRX293 explosive fill.QRX293 is a simulant for PBXN-109.The cylinder is shown schematically in Fig.4.The small circle indicates the detonator.The cylinder has a total length of 404 mm,including the end caps,an outer diameter of 170 mm and a wall thickness of 10 mm.The mass of the steel is 39.187 kg,the mass of the explosive is 8.038 kg and the all up mass of the cylinder is 47.225 kg.

Fig.3.Angular zones that coincide with strawboard.
Fig.4.Schematic diagram of cylinder.
5.Experiment analysis
After each firing,the strawboards were recovered for manual fragment‘picking’.The mass and the point of impact of each fragment on the strawboard were recorded.The‘ first strike’fragment velocity for each foil was determined using the Velocity Acquisition System(VAS).The VAS computes the average velocity of the ‘ first strike’fragment from the time of rupture of the case,time of arrival at the strawboard and distance from case to strawboard.
The fragment data from the experiments were collated and put into a standard format to facilitate analysis and comparison with the numerical simulation.Data for fragments recovered from the strawboards were tabulated as follows:fragment number,fragment mass,co-ordinates of fragment impact point(North,East,Elevation).The nominal North/East/Elevation co-ordinate system has an origin at the centre of the cylinder with the North axis passing through the centre of the strawboard.Velocity data were tabulated as follows.The maximum first strike velocity from the VAS is listed against each angular zone in the range Angular Zone 14-24 inclusive.Where there were two velocity foils in a given angular zone,and more than one strike was recorded,the higher of the two velocities was taken.
The fragment data from the experiments were processed against various assumptions before comparison with the predictions from the numerical simulation.These assumptions were as follows: ‘same hole,same fragment’;fragment mass greater than or equal to 0.13 g;drag negligible on fragments travelling over short(3 m)trajectories;three firings are collectively approximately equivalent to single quarter symmetry numerical simulation;strawboard array was part of a spherical surface enclosing the cylinder.For the fragments with a common impact point,it was assumed that the fragment broke up upon impact.Such fragments were aggregated and treated as a single fragment.Whilst this is a reasonable assumption,it does present issues for the numerical simulations,as will be discussed later.Fragments with a mass less than 0.13 g were excluded from the comparison.This cutoff mass of 0.13 g is something of a benchmark boundary based on reliability of recovery,historical precedent and minimum lethality.The numerical simulation provides the velocity of each fragment at the end of the simulation.At this point,the detonation is complete and the fragment has stopped accelerating.The analysis assumes that,in the short distance from the cylinder to the strawboard,the effects of drag are negligible so that a velocity from the VAS can be validly compared with a velocity from the numerical simulation.Each strawboard array collects data over 37.4 in azimuth.The three experiments in total therefore could be considered to correspond to fragment collection over 112.2 in azimuth.This means that the experiments taken collectively have approximately the same opportunity for statistical variation as the quarter symmetry numerical simulation.The strawboard array is treated as to be spherical to simplify the analysis.This simplification was judged to have a relatively small effect on angular zone boundaries.
The experiments employed conventional arena trial techniques with strawboard packs to collect the fragments and foils for fragment velocity measurement.The use of strawboard is well established,since it provides data on the strike coordinates of each fragment.If these fragments are preformed(cubes,spheres),the depth of penetration can be used to determine their impact velocities.For natural fragments,penetration depth as a measure of velocity can only provide a relative measure.The limitations of such techniques are well known.Strawboard packs are relatively hard and may cause fragment break-up on impact.With velocity foils,it is not possible to associate a strike with a particular fragment.In these experiments,multi-strike velocity foils were used;however,to increase the robustness of the data,only the first strike timings were taken.A major limitation of the experimental technique is therefore that it yields only the‘first strike’velocity in each angular zone and not the distribution of fragment velocities.New techniques for fragment data collection based on imagery and radar are starting to become available.Such techniques hold the promise of greater precision and integrity,and two such photographic techniques were deployed in the experimental study,as shown in Fig.1.This data and their analysis will not be discussed in this paper.
In order to establish a common comparison framework,both the experimental results and the numerical simulation results were placed in a ‘spider table’format.This format is commonly used by weapon effects authorities to succinctly characterise the fragmentation of a device.The ‘spider table’is a matrix where the rows correspond to angular zones and the columns correspond to mass bins.Each cell in the matrix gives the number of fragments in that particular angular zone and that particular mass band.Whilst the choice of mass bins can be subjective,the mass bins used are normally the ITOP mass bins.The fragment velocity in each angular zone is added at the end of each row.For this work,a limit of an ITOP mass band is given by K=10nZ,where K is the limit in grams,Z is the ITOP mass band value(an integer in the range from 1 to 31)and n=0.125.The first mass band is 0-1.33 g,the second 1.33-1.78 g and so on.The 32nd and final mass band is 7499 g and over.Initially,the results of each experiment were placed in a separate ‘spider table’.A consolidated ‘spider table’was then formed by placing the average number of fragments across the three experiments in each cell.The consolidated velocity was taken as the maximum of the three values on offer.Finally,the number of fragments in each cell was scaled up to simulate all round coverage(360 in azimuth).The scaling factor was approximately 360/37.4(although the ITOP scaling factor for each angular zone was used in the analysis).The results of the quarter symmetry numerical simulation were first scaled up to full symmetry by replicating fragments,making due adjustments where a fragment lies on one or more symmetry planes.The numerical simulation provided the mass of each fragment,the original position of the fragment(before detonation),and the position and velocity of the fragment at the end of the simulation.The fragment was projected onto a spherical surface with a radius of 3 m centred on the centre of the cylinder(representing the strawboard array)and the angular zone determined.The scaled simulation results were then filtered to remove fragments with a mass less than 0.13 g and fragments outside the range Angular Zone 14-24 inclusive.A ‘spider table’was then populated from the scaled and filtered results.
The use of the ITOP standard for measuring the fragmentation of a warhead provides a method for recording and post processing the many hundreds of fragments that can be generated in an All UP Round experiment.The use of mass bins also facilitated the fitting to analytic fragmentation and lethality models,especially when computer resources were limited.However high speed photography,Doppler radar and other advances in trials instrumentation now offer better alternative approaches.Whilst some of these methods were deployed in these experiments,the analysis of the data and the identification of the potential benefits have yet to be fully assessed.
Given current computing power the ability exists to record and analyse the complete fragmentation experimental data to enable direct comparison with analytic models and numerical simulations.
6.Numerical simulations
Each of the numerical methods in the WSTC research programme has specific strengths and weaknesses.In the study reported in this paper,the numerical simulations were performed using the QinetiQ developed Eulerian hydrocode GRIM.The initial simulations were performed ‘blind’using existing material properties data for a generic EN24 steel and without any prior knowledge of the experimental data and the simulation data passed to RSL for comparison with the experiment.The EN24 steel in the condition used for manufacturing the cylinders was then re-characterised and the material models updated.These models were then employed in a second series of simulations for comparison with the experimental data.This second comparison is reported in this paper.
In an Eulerian framework,more than one material can occupy a numerical cell.The method therefore requires an advanced interface tracking algorithm to describe the evolution of material boundaries with time.In the case of fracture the identification of individual fragments and their motion,unless they are clearly spatially separated,requires an additional fragment identification algorithm.
One of the strengths of the Eulerian approach is its ability to treat the whole domain as a single entity.This allows,for example,the blast wave generated by a fragmenting warhead to be directly calculated and includes the local effects of the aerodynamics of fragments on the local pressure field.The domain of the simulation is therefore much larger than that in the Lagrange or SPH methods,since it has to include the surrounding air.Mesh resolution and the computational resources required therefore can be significantly greater.The effects of these aspects of the Euler method compared to the others were therefore a part of the overall programme.
The other requirements for the simulations are the material models:equation of state,constitutive and fracture models.
7.Material models
The Warhead Technology Group at QinetiQ have developed an integrated modelling-experiment strategy as part of a predictive modelling capability.This strategy requires physically-based material models and the considerable effort has been expended to develop equations of state that are based on proven materials science methods[12].In the case of constitutive models to describe metals,the physically-based constitutive model due to Armstrong and Zerilli and modified by Goldthorpe et al.[13],Eq.(1),is the preferred model used by QinetiQ.The equation distinguishes between the different behaviours of body centred cubic(BCC)metals such as iron and face centred cubic metals such as copper.Eq.(1)is for BCC materials of relevance to this programme.
where Y is the flow stress,T is temperature,?is the strain rate,and εPis the plastic strain,with C1through C5,n and a1and a2,which describe the temperature dependence of the shear modulus,constants derived from the characterisation tests.
The QRX293 explosive was described using the standard JWL equation of state,Eq.(2)is
where P is the pressure,V is the volume expansion,and E the energyρ0I,with I being the specific internal energy.The remaining constants data are given in Table 1.

Table 1JWL constants for QRX239.
8.Fracture
There are two aspects in the numerical treatment of fracture.The first is the identification of failure in the material determined by a material specific failure algorithm,and the second is the representation of the failure surface generated by the failure process and its evolution by the numerical scheme.
9.Failure algorithms
In the case of failure models,the numerical simulations use algorithms that are empirical,phenomenological or physically-based.The empirical models use tensile strain or principal stress or strain or other physically measureable behaviour.The phenomenological models assume functional forms that are fitted to experimental material tests.The algorithm due to Johnson and Cook[14]is an example of this class of algorithm that is widely used.Whilst these algorithms can describe failure processes to varying levels of accuracy when compared to experiment,they often struggle to reproduce the time dependent details of the failure process,in particular the path dependent nature of the ductile failure process.
As part of the drive to develop a system of physically based material models,Goldthorpe developed a path dependent ductile failure model[15].The algorithm used in the code is
where σnis the ratio of the hydrostatic stress to the flow stress,and γ is the maximum principle shear strain.The constant ASis determined from a torsion test.The parameter S represents the work done in nucleating and growing voids to the point of failure.The model therefore defines the ductile failure process with two material constants that can be readily measured.
In the code,the integral is replaced by a time summation of the damage increment.Failure occurs when S exceeds a measured value SF,obtained from the tensile test.The algorithm has been shown to be capable of predicting and describing a wide range of failure processes.It was therefore employed for this study.
Material characterisation tests have also shown that the measured fracture parameter,SF,can vary within a component or plate of the material.For high hard steels,this variation can be as great as a factor of 2.Thus a physically-based spatial variation of SFvalue in the cylinders in this programme could readily explain the experimentally observed statistical variation of the fragmentation process.
10.Material characterisation
The specimens of EN24 steel used to construct the fragmentation cylinders were subjected to material characterisation tests to fit the constitutive and failure models that reflected the actual material properties.
Six tensile specimens were machined from the EN24W steel cylinders,and the interrupted quasi-static tensile tests were performed at room temperature from which the isothermal stress-strain curves were determined.They were very consistent.
The value of the Goldthorpe path dependent failure parameter was calculated from the last measurement of plastic strain prior to fracture in each of the tensile tests.The characterisation data for the constitutive and fracture behaviour of EN24 steel is presented in Table 2.

Table 2EN24 Constitutive model data.
11.Numerical treatment of failure
As discussed above,it is observed experimentally that the fragmentation process is stochastic,with notionally identical experiments generating different numbers of fragments.
In GRIM,once a material is flagged as having failed,its volume is relaxed to ambient conditions,which creates a‘hole’in the cell.This hole is filled with a gas.This mimics the void nucleation and growth process associated with ductile fracture.At the same time,the stress field is relaxed by zeroing the stress deviators.
It is very important to understand the implications of this physically based fracture algorithm.The most important one is that the model does not require any artificial seeding of fracture sites within the material as part of the initial conditions of the problem.The statistics of the fragmentation process is naturally captured by the model through the stress field and the inherent numerical noise in the simulation.
12.Fragment identification
The problem of identifying individual fragments in an Eulerian mesh due to the presence of multi-material ‘mixed’cells is complex.In order to determine the fragment distribution within the mesh,a fragmentation recognition algorithm was developed.
A three-dimensional matrix representing the entire computational mesh was produced and any cell which contained the case material(EN24)was flagged in the matrix(using the integer?1).The algorithm then recursively examined adjacent cells to ascertain whether they also contained EN24.If any adjacent cell(but not on the diagonal)contained EN24,they were grouped into a single fragment.These cells then had their flag changed to a positive number representing their fragment number.
Although the algorithm is simple to implement,its search method can result in fragments being artificially joined together where negligible amounts of EN24 are found in mixed cells,effectively forming a ‘bridge’between fragments.In order to remove this ‘extraneous’material from the calculation of the fragment size,the algorithm only takes into account cells with a material mass above a user defined minimum.The algorithm calculates this minimum mass in the cell by employing a user defined material density,referred to as the ‘density cut-off’,and the cell volume.The mass limit in a cell therefore defines the surface of a fragment and hence its ultimate size and mass.Since the cell volume is used by the algorithm,the number of fragments identified within the mesh is a function of both the density cut-off and the cell size.This is illustrated below in Fig.5.
Fig.5.Predicted fragment number(?0.13 g)against mesh resolution and density cut-off.
The algorithm stores multiple variables for the material in the cells including mass,position,velocity vectors and energy.This data is summed and mass averaged to calculate the overall information for that fragment.This information,based on the centre of mass for the fragments,can then be compared to those from experiments,other modelling methods and analytic models.
Additionally,the algorithm can account for the fact that the GRIM simulation may have been conducted in quarter or half symmetry.In order to correctly predict the fragments that would have been projected from a full charge,the algorithm copies the data into the appropriate mirror images.This makes the assumption that the fragmentation pattern is symmetric and not driven by geometric flaws in the liner.As will be discussed later in the paper,this can result in a serious error when comparing simulations with experiment.
13.Numerical simulation-experiment comparisons
The ability of the GRIM Eulerian numerical scheme,using physically based material models,to predict natural fragmentation behaviour depends on mesh resolution,problem end time and density cut-off in the fragment identification algorithm.
Given the requirement for the mesh boundary to extend over the physical domain of interest,the numerical mesh size together with the extent of the computational domain defines the size of the problem and hence the run time for the simulation.The mesh size therefore is often a compromise that is defined by the computational resources and time available to complete the simulation.In the first phase of the modelling programme,a mesh size of 0.003 m had been used with a density cut-off of 500 kg m?3and a simulation end time of~600μs.These values were based on the available computational resource at the time and the subjective visual assessment of the separation of fragments and a minimum number of massive fragments,generated when fragments are linked together by the interface routine.
As discussed above,each strawboard array collects data over 37.4 in azimuth,and the three experiments could be considered to cover 112 in azimuth.This assumption and the computational resources available to the study resulted in only one quarter of the cylinder being included in the numerical domain.The introduction of two symmetry planes implies that the fragmentation pattern is also 4 fold symmetric,which in reality is not the case.
A series of simulations were therefore performed to understand the sensitivity of the number of predicted fragments(?0.13 g)as a function of mesh resolution and density cut-off.The results are presented graphically in Fig.5 scaled up to full symmetry and assuming the strawboard to be at the 45 orientation.The results show the quite marked sensitivity to density cut-off particularly for the larger resolution meshes,which can be as large as 2.5.However the 0.003 m mesh is relatively insensitive to density cut-off,justifying the choices made in the original modelling study.
14.Experimental data
The total number of fragments recovered from each experiment is listed in Table 3 together with the maximum fragment mass and the numerical predictions.
The total number of fragments(116,111 and 122)is surprisingly consistent between each experiment,although we are not dealing with a statistically significant number of experiments.
However,when we compare the angular distribution of fragments from the experiments,from Fig.6,we observe a much more marked difference between experiment,up to a factor of over two.This can be explained qualitatively by considering the fracture process as the cylinder expands and curves axially.Different fracture times will result in differentfragment numbers with associated launch angles.However the small number of experimental results does not permit a statistically accurate conclusion to be made.The use of ITOP angular zones may also exaggerate the differences and raises the suitability of using a pre-imposed characterisation methodology against which to compare and validate numerical simulations.
Table 3comparison of experimental fragment numbers with GRIM prediction.
Fig.6.Experimental angular zone distributions of fragments.
Finally the fragment mass distribution,defined by the ITOP mass bins,is presented in Fig.7.
Fig.7.Fragment mass(?0.13 g)distribution.
The mass distribution,as defined by the limited strawboard distribution,is dominated by small mass fragments in the first ITOP bin(1.33 g).
The early time motion of the cylinder and the onset of fragmentation were captured by the high speed video camera.The predicted motion of the cylinder and the onset of fragmentation is shown in Fig.8,where a major crack along the full length of the cylinder can be observed.
Fig.8.Early time motion of cylinder.
A more detailed investigation of the early time behaviour of the cylinder is currently underway to determine the ability of the simulation to reproduce the fracture pattern that drives fragmentation.
15.Simulation data
The simulation of the fragmentation of the cylinder was performed out to a time of 609μs after detonation when the fragment cloud had expanded out to about 1 m from the cylinder axis.The predicted fragment pattern at this time,reflected about both planes of symmetry to provide a 360 visualisation of the fragmentation field,is shown in Fig.9.The predicted break-up of the cylinder into strips is in good agreement with experiment.
Fig.9.Predicted fragment spatial distribution at 609μs.
The reflection of the fragment pattern about the symmetry planes highlights a distinct difference in the fragmentation pattern at the symmetry planes.The full 360 predicted fragment spatial distribution at 1 m stand-off is shown in Fig.10 and clearly shows the ‘dip’in the number of fragments formed at the symmetry planes.The figure also contains two positions of the 37.4 arc strawboard,at 0 and 45 ,employed in the experiment demonstrating that the predicted fragment strikes recorded by the simulation will vary with the position of the strawboard pack.Since there was some concern about the influence of the symmetry planes on the predicted fragment pattern,the fragment data from the strawboard at 45 was provided to RSL for comparison with experiment.
The fragment strike pattern in Fig.10 reflects a level of variation that would likely be observed in the experimental strawboard record placed in different angular positions around the charge.To investigate this variability,predicted by GRIM,the centre of the strawboard was placed in 1 intervals from 0 through to 90 .The resulting variation in the number of fragments recorded on the strawboard is shown in Fig.11.There is a marked variation with angle and the number of fragments varies between 128 at 0 rising to about 180 at about 45 and falling to 114 at 90 .It naturally raises the question: “Which one is correct?”It would be interesting to conduct additional experiments with a number of strawboard sectors deployed around the charge,at positions indicated by GRIM,to measure the size of this effect and confirm the simulation prediction.It does however identify the care required when planning fragmentation experiments and the number of firings required in establishing a statistically valid sample size.
Fig.10.Predicted strawboard fragment(?0.13 g)strike pattern.
Fig.11.Predicted number of fragments(?0.13 g)as a function of angular position.
An alternative strategy for comparing experiment and simulation would be to use the experimental early time cylinder motion to identify an initial major crack.The predicted initial crack in the simulation could then be ‘rotated’to align with the experiment.This would define a more rigorous comparison metric since other cracks should align with those in the experiment.
16.Comparison of simulation with experiment
The GRIM predictions of number and maximum fragment mass(?0.13 g)are compared with the experimental results in Table 3(Columns 2&3).Since the fragments in the simulation were at 1 m from the charge but the strawboard in the experiment was 3 m from the charge,the velocity vectors of each fragment were used to calculate the predicted strike points on the strawboard.This ignored drag and tumbling effects.The predicted number of total fragments using the 0 and 90 strawboard positions brackets the experimental data very well and the predicted maximum fragment mass is also in reasonable agreement with the experiment.The 45 strawboard position is in less good agreement with experiment,predicting a greater number of fragments.This may reflect the effect of the symmetry planes on the stress field generating stress waves that combine on the 45 line to enhance the stress field and the fragmentation process.Further research is underway to understand and resolve this.
The fragment recognition algorithm returns the characteristic length of each fragment.This length was used to define the diameter of the ‘hole’on the strawboard.Circles that intersected were then treated as ‘one-hole’.This is obviously an over estimate for the number of fragments in a ‘hole’as the fragments are most likely long and thin and will not intersect with as many other fragments as suggested by this analysis.It does,however,provide a maximum that can be used with the‘a(chǎn)ll impact’data to bound the predicted results.The mass for these fragments were then summed and the results are shown in Table 3(Columns 4&5).Although the differences between the number of fragments predicted in the simulation and those in the experiment for the one-hole-one-fragment assumption have been reduced,the analysis does illustrate that the effect assumptions have in influencing the result.Clearly,there is a lack of statistically significant experimental data and,in the case of the simulation,symmetry issues and strawboard positions can be selected to provide the best matches to each of the experiments.The symmetry issues will be discussed below.
The detailed comparison between the numerical simulation and the experiments showed some interesting trends.The predicted number of fragments(?0.13 g)as a function of angular zone for the 0 and 45 strawboard positions is compared with the experiments,as shown in Fig.12.The agreement is generally good although the simulation does not capture the fragments in zones 14,15 and 16.This might reflect the influence of the numerical interface routine on the end cap-case joint separation and its effect on case failure.Experimentally,it may also reflect ricochet of fragments from the ground.Although ricochet traps were deployed in the experiment,some fragments may have been deflected into the strawboard.An examination of the fragment tracks in the strawboard might be able to confirm this.These factors require further research and analysis.
Fig.12.Predicted and experimental number of fragments(?0.13 g)as a function of angular zone.
The usual process is to scale the data to full symmetry,as shown in Fig.13.The immediate effect is to significantly magnify the difference between the simulation and experiment of the angular distribution of fragments.In this experiment,the difference is of order 3.5.However it is clear that,whilst the simulation is correctly predicting the fragment beam angles,there is a much greater number of predicted fragments in angular zones 17 and 18,even accounting for the effect of the scale-up.This is confirmed by the fragment mass distribution comparison,in Fig.14,between the 37.4 experimental strawboard and the strawboards in the numerical simulation at 0 and 45 .
Fig.13.Angular zone distribution of fragments(?0.13 g).
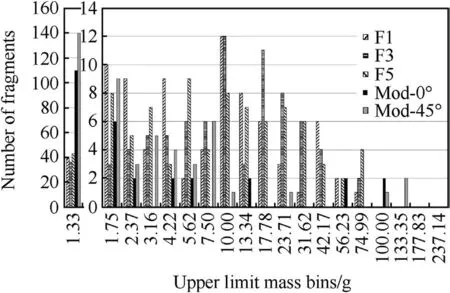
Fig.14.Number of fragments(?0.13 g)as a function of mass bin.
The comparison shows that generally the simulation predicts the aspects of mass distribution reasonably well within the experimental spread.There is however a much greater number of predicted fragments in the smallest mass bin as well as differences in the higher mass bins with fragments predicted to lie in higher mass bins compared to the experiment.Whilst the number of fragments in this region is small,their greater mass,if redistributed into the other bins,would improve the agreement with experiment.The creation of the smaller fragments has been identified as being due to the interaction of the mixed cell treatment with the fracture algorithm.Further research is addressing this effect.Fig.14 also demonstrates how the level of agreement could alter if the mass bins were defined differently.
The standard method of representing the fragment mass distribution also employs a cumulative plot,presented in Fig.15.The non-cumulative plot(histogram)is more sensitive to the scatter of the fragment data,and unlike the cumulative plot,does not skew the data.The agreement between simulation and experiment as represented by the cumulative plot is very poor.The simulation data is the quarter symmetry simulation result scaled by a factor of 4.The experimental data is the average of the strawboard data scaled by 9.6.It is based on the assumption that the scaled experimental data accurately represents the actual number of fragments that would be produced in the experiment.The influence of the larger number of predicted fragments in the smallest mass bin in skewing the data is readily apparent in Fig.15.The mass of the cylinder wall is 10.8 kg and so indicates the expected total fragment mass that potentially could be recovered experimentally by a 360 strawboard deployment.The experimentally recovered mass scaled to 360 is about 1 kg below this total mass.This is likely to be due to unrecovered fragments,limited strawboard pack elevation range and statistical variation.Whilst the use of cumulative mass and fragment number plots as a function of mass bin is a standard within the community,its usefulness as a method for comparing numerical simulations with experiment should be reviewed.
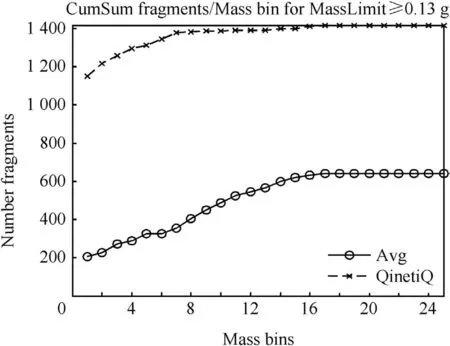
Fig.15.Cumulative number of predicted and experimental fragments versus all mass bins.
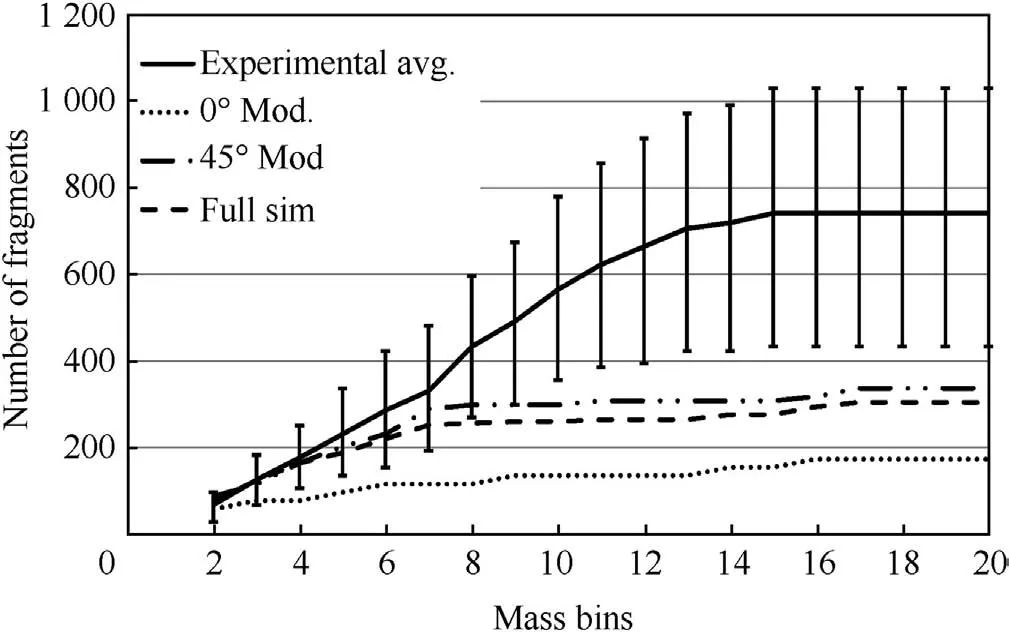
Fig.16.Cumulative fragment number against mass bins 2-20.
To illustrate the skewing effect of peaks in the data,the first mass bin in the simulation,which contains many more fragments than recovered in the experiments,was removed from the data in Fig.15 and the result is plotted in Fig.16 for the total number of fragments and in Fig.17 for the one-hole-onefragment representation of the experimental data.The experimental average in both figures includes the experimental variation.The full simulation curve is the number of fragments(?0.13 g)predicted in the quarter symmetry simulation scaled by 4 and accounting for fragments on the symmetry planes.The 0 and 45 lines are the fragments predicted in the strawboards centred at these angles and scaled by 9.6.
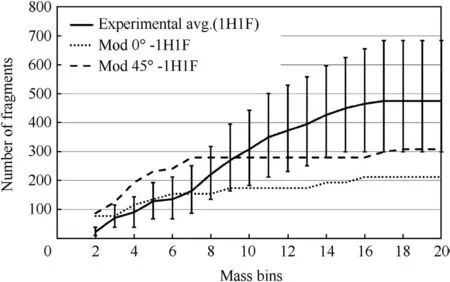
Fig.17.Cumulative one-hole-one-fragment number against mass bins 2-20.
Both Figs.16 and 17 show that,up to mass bin 7,the simulation reproduces the number of fragments and the rate of increase very well.The model then levels off whereas the experimental result continues to grow.Thus,a careful analysis of the cumulative plots can identify the areas of further development for the simulation.For this study,the simulation is generating many more small fragments.This is considered to be due to the mixed cell algorithm in GRIM.If the mass of these fragments were to be distributed amongst the larger fragments,the agreement with experiment would be improved.
Velocity:The maximum velocity,defined as the experimental ‘first foil strike’,was compared with the predicted maximum fragment velocity for each angle band at the experiment strawboard position.The agreement is generally very good with the simulation predicting fragment velocities that are generally greater than the experimental measurements by about 10%or less,as shown in Fig.18.
Fig.18.Comparison of the predicted and experimental maximum fragment velocities with angular zone.
This is not unexpected since the experimental velocities are average velocities based on an assumed origin.To improve the comparison,high speed photography based measurements should be used to determine the fragment velocities and their variability.
17.Effect of symmetry in the simulation
The analysis of the data from the quarter symmetry simulation suggested the symmetry planes had an influence on the fragmentation process.Three additional simulations were therefore performed with the charge represented in quarter,half and full symmetry,using a mesh resolution of 0.005 m.The fragmentation patterns for the half symmetry and full symmetry simulations at 400μs are shown in Figs.19 and 20,respectively.
Fig.19.Half symmetry prediction of the fragmentation process.
Fig.20.Full symmetry prediction of the fragmentation process.
Comparing Figs.19 and 20 with Fig.9,it becomes readily apparent how the assumptions of symmetry become imposed on the fragmentation process through the stress field.There is,however,still some evidence of the influence of the coordinate directions on the fragmentation particularly in the half symmetry simulation,where the fragments along the coordinate axes appear to be retarded producing a marked curvature.A final simulation therefore repeated the full symmetry simulation with the axis of the charge at 45 to the co-ordinate axes of the mesh.This was shown to eliminate this effect of the co-ordinate axes.The cause of this effect requires further study.
The number of fragments(?0.13 g)predicted in each of these simulations was determined,taking account of the symmetry.The dependency with density cut-off is presented in Fig.21,which shows that the quite marked effect assumptions about the symmetry of the problem can have on the predicted number of fragments.At a density cut-off of 500 kg m?3,there is a 25%reduction in the number of fragments changing from quarter to full symmetry.At a density cut-off of 300 kg m?3,the reduction is of order 10%(50 fragments).This is in addition to the angular variation of the number of fragments predicted to be recovered by the 37.4 strawboard.
Fig.21.Effect of simulation symmetry on predicted fragment numbers(?0.13 g).
At this resolution of 0.005 m,a rotated full symmetry simulation and a density cut-off of 200 kg m?3,the predicted number of fragments would be in excellent agreement with experiment,as shown in Fig.15.This demonstrates that there is a set of numerical parameters that can be selected to provide good agreement with experiment,depending on the parameter of interest (fragment number distribution or fragment mass distribution).A series of simplified experiments employing extensive instrumentation needs to be developed to investigate whether these numerical parameters can be defined as a problem independent set.
18.Conclusions
This paper has presented the results of experimental and numerical studies of the natural fragmentation of an explosively loaded steel cylinder.
The use of physically-based material constitutive and failure algorithms in an Eulerian numerical framework has been shown to be capable of reproducing the observed fragmentation processes without the need for a user defined statistical seeding of fracture sites in the numerical mesh at the start of the simulation.
The research has clearly demonstrated the sensitivity of the predicted fragment pattern to the symmetry of the problem and,as expected,the mesh resolution.For maximum accuracy,the full symmetry of the problem should be reproduced in the simulation.The identification of fragments within the Eulerian mesh has been highlighted as the most significant challenge in the ability to predict the natural fragmentation process.A set of parameters,mesh resolution and density cut-off,can be selected to provide a good fit to the experiment.Further highly instrumented experiments should be used to identify whether these parameters can be defined as a problem independent set.
The ability of numerical simulations to predict the early time motion of the cylinder and the onset of fracture should be explored as a more rigorous validation test of the material models and numerical scheme.
The extrapolation of a limited circumferential band of fragments recovered experimentally to a full 360 distribution does not provide an accurate reflection of the actual fragment distribution.The validation of the numerical simulations,therefore,should be restricted to comparison with the experimental record.Future experiments should be designed using the predicted spatial distribution of fragments to indicate the position of the straw boards around the cylinder most likely to generate a significant variation in the fragmentation pattern.This would provide a better method to validate the numerical simulations and material models.
Finally,consideration should be given to replacing the ITOP characterisation regime with a more relevant analysis method for comparing numerical simulations with experiment.
Acknowledgements
The authors wish to acknowledge the financial support of Dstl,UK MOD,under a Weapons Science and Technology Centre contract,SA/004011.
[1]Mott NF.Fragmentation of shell cases.Proc R Soc 1947;A189:300-8.
[2]Grady DE.Fragmentation of rings and shells.Springer;2006.
[3]Grady DE.Local inertial effects in dynamic fragmentation.J Appl Phys 1982;53(1):322-5.
[4]Grady DE.Fragment size distributions from the dynamic fragmentation of brittle solids.IJIE 2008;35(12):1557-62.
[5]Brannon RM,Wells JM,Strack OE.Validating theories for brittle damage.Metall Mater Trans 2007;38A:2061-8.
[6]Diep Quoc Bao,Moxnes JF,Nevstad G.Fragmentation of projectiles and steelrings using numerical3D simulations.Int Sym Ballist 2004;21:752-9.
[7]Prytz AK,Odergardstuen G.Fragmentation of 155mm artillery grenade,simulations and experiment.Int Sym Ballist 2011;26:241-52.
[8]Chhabildas L,Reinhart W,Wilson LT,Reedal DR,Grady DE,Black JW.Fragmentation properties of Aermet?100 steel in two material conditions.Int Sym Ballist 2001;19:663-9.
[9]Arnold W,Rottenkolber E.Fragment mass distribution of metal cased explosive charges.IJIE 2008;35(12):1393-8.
[10]Hiroe T,Fujiwara K,Hata H,Takahashi H.Deformation and fragmentation behaviour of exploded metal cylinders and the effects of wall materials,configuration,explosive energy and initiated locations.IJIE 2008;35(12):1578-86.
[11](ITOP)4-2-813 International test operations procedure30;March 1993.
[12]Porter D.Group interaction modelling of polymer properties.New York:Marcel Dekker;1995.
[13]Goldthorpe B,Butler A,Church P.Awide ranging constitutive model for BCC steels.J De Phys 1994:C8-471.
[14]Johnson GR,Cook WH.Fracture characteristics of three metals subjected to various strains,strain rates,temperatures and pressures.Eng Fract Mech 1985;21:31-48.
[15]Goldthorpe B.A path dependent model for ductile fracture.J De Phys 1997;7:C3-705.
- Defence Technology的其它文章
- Shock tube design for high intensity blast waves for laboratory testing of armor and combat materiel
- Long-rod penetration:the transition zone between rigid and hydrodynamic penetration modes
- Damage visualization and deformation measurement in glass laminates during projectile penetration
- Reduction of global effects on vehicles after IED detonations
- On the continued acceleration of bomb casing fragments following casing fracture
- Study of simple plane wave generator with an air-metal barrier