
Accurate quantitation standards of glutathione via traceable sulfur measurement by inductively coupled plasma optical emission spectrometry and ion chromatography
2013-12-23 06:15:00LoriRastogiKulamaniDashJayaramanArunachalam
Lori Rastogi,Kulamani Dash, JayaramanArunachalam
1. Introduction
The tripeptide glutathione (GSH) is widely studied in many research areas, such as biochemistry, food, medicine, dietary supplement and also in cosmetics[1-3].It has strong antioxidative effects and thus prevents cellular damage by scavenging hydrogen peroxide and hydroxyl radicals [4]. Further, GSH is used in the treatment of many types of intoxication of the human organs due to heavy metals, drugs and alcohol. It has also been used for the treatment of liver disorders,eczema,renal dysfunction and nephrotoxicity [5]. Some of these applications demand an accurate quantitation of GSH. Although, analytical techniques have greatly advanced over the last decade,accurate quantitation of this analyte is still a challenging task mainly because GSH do not have unique spectral characteristics for easy quantification[6].Therefore, the commonly used HPLC techniques require pre or post column derivatization with o-phthalaldehyde [7,8] or monobromobimane[9]and other reagents[6,10]with either fluorescence[11] or electrochemical detection [12] for the determination of this analyte. Bramanti et al. [13] have reported a cold vapor generation atomic fluorescence spectroscopy(CVGAFS)for GSH measurement in human whole blood. Recently a highly sensitive method based on capillary electrophoresis with laser induced fluorescence has been used for the determination of GSH[14-16].Although most commonly used HPLC-based methods with fluorescence measurements [9,11] provide high sensitivity for the determination of GSH in various matrices, they are not suitable for high-accuracy measurements required to characterize high caliber primary standards and certified reference materials(CRMs), where measurement uncertainty of <1% is required.Traceable reference material of GSH will aid in comparing results from different laboratories or between various methods and for quality control in routine analysis. The production of GSH CRM will require an accurate and traceable measurement with small uncertainty for the certification purpose. In order to boost the uncertainty budgets,the uncertainty of the CRM should be at least a factor of 2 smaller than the uncertainties of the measurement results obtained with the routine procedures [17].This requires analytical reference procedures preferably to have expanded uncertainty below 1%.
Recently, the quantitation of DNA [18,19] and protein[20,21] has been carried out via measurement of stoichiometrically existing phosphorus and sulfur content respectively.The use of sulfur measurement of purified GSH and calibration through an appropriate CRM for S would provide a traceable methodology for the certification of GSH quantity. A ‘‘high performance'' methodology [22,23]developed at National Institute of Standards Technology(NIST), USA has been used for the measurement of different analytes by ICP-OES [18,19,22-24] and anions by ion chromatography [25,26] for high-precision and highaccuracy quantitation with low measurement uncertainties.
The goal of the present work has been regarding the implementation of ICP-OES and IC for the precise quantitation of sulfur in order to quantify GSH with small measurement uncertainties using the ‘‘high performance''methodology so as to provide accurate and definitive ways for the quantitation of GSH for reference measurements.The ICP-OES technique do not require any sample digestion as the residence time in the high temperature plasma will decompose the molecule into elemental level. However,in IC, the sulfur content in GSH is quantitatively converted to sulfate by microwave (MW)-assisted UV oxidation.Based on experimental results, the proposed measurement methods may be used for the certification of pure GSH materials with relative expanded uncertainties of less than 1%.
2. Experimental
2.1. Instrumentation
Analysis of sulfate was carried out using an ICS-3000 ion chromatography system (Dionex, Sunnyvale, USA) equipped with a quaternary gradient pump; detector compartment containing a chromatography oven and a conductivity detector (ICS-3000 series). The chromatography oven was utilized to help prevent baseline drift caused by temperature variation.All columns used in this study were from Dionex. For the separation of anions an IonPac AG20 guard column(50 mm×4 mm)and IonPac AS20(50 mm×4 mm)analytical column were used.The eluent was sodium hydroxide(15 mM)at a flow rate of 1 mL/min. The injection volume for determination of sulfate was 25 μL. Anion self regenerating suppressor (ASRS-300) from Thermo Fisher was used in the IC analyses for suppressing the conductivity due to eluent.The instrument control, data acquisition and processing were performed with Chromeleon?software (version 6.80). ICPOES instrument used in this experiment is a Teledyne Leeman Labs Prodigy,a dual view ICP with a free running 40.68 MHz RF generator, solid state array detector, and an integrated autosampler. The emission lines used for sulfur and phosphorus (internal standard) were 180.731 nm and 213.617 nm respectively. A concentric nebulizer (Meinhard) in combination with cyclonic spray chamber was used for sample introduction. These parameters produced robust plasma giving Mg (II) 280.270 nm to Mg (I) 285.213 nm intensity ratios>8. All spectra were viewed in radial mode and quantified as peak areas with two-point background correction. Two hours before starting the measurements the ICP spectrometer was purged with 5N pure nitrogen.
A microwave digestion device (Multiwave-3000), equipped with quartz vessels (80 mL capacity) from Anton Paar GmbH was used for digestion. Cadmium low-pressure discharge microwave lamp (Part no.16846; Anton Paar GmbH,) was used as the UV source, the technical details of which are described in published literature [27]. The vessels and lamps were cleaned by soaking them in 5% Decon90 (Zinser Analytik GmbH, Frankfurt, Germany) overnight followed by careful rinsing with deionized water. Moisture content of GSH was carried out using a Karl Fisher titrator.The residual carbon content (RCC) of GSH digest was measured using a TOC analyzer (TOC-VCPN5000A, Shimadzu, Japan).
2.2. Reagents
Hydrogen peroxide (30%), Suprapur?grade was obtained from Merck(Darmstadt,Germany).All sample and calibrant preparations were performed using water with a minimum resistivity of 18 MΩ cm that was obtained from a Millipore water purification system.The CRM from which calibration solutions were prepared for IC/ICP-OES methods was TraceCERT?traceable certified reference material (Sulfate standard solution, lot no.BCBC2168,Sigma-Aldrich,Switzerland). The certified sulfate mass fraction is 1001 mg/kg with an expanded uncertainty of 4 mg/kg, which is traceable to SI unit kg and measured against a NIST SRM.A stock solution (1 mg/g) of bromide was prepared by dissolving highly pure grade salt of NaBr(Suprapur?,Merck,Germany)in deionized water.For internal standard in ICP-OES measurements,phosphorus standard solution (CertiPUR?Reference Material,Merck,lot no.HC934479)was used.The certified P mass fraction is 1.00 mg/g, which was traceable to NIST SRM?3139a, lot 060717. L-GSH reduced used in this study was from Sigma Life sciences (Sigma-Aldrich, Switzerland) and was used without any further purification.The moisture content in GSH was carried out using an automated Karl Fischer titrator(Metrohm,Switzerland).The density of the GSH stock solution (1000 μg of GSH g-1) in deionized (DI) water was found to be 0.9988 g/cm3. In order to prevent oxidation, the stock solution was prepared fresh daily and was kept at 4°C with protection from light. The purity of the GSH sample was examined by using an HPLC-MS and a bridged amide column (Xbridge amide, 250 mm×4.6 mm,Waters),where only a single peak was observed in the chromatogram.This suggested that the GSH was at least 99% pure(mass)and further the presence of cystine, the most likely impurity was not detected.
2.3. MW-UV digestion
All samples and calibrant preparations were performed gravimetrically on a four place analytical balance (Afcoset,ER-180 A). An appropriate amount of GSH sample(15-300 μg) and 2 mL of H2O2(30% v/v) and required amount of bromide stock standard were weighed into a PFA beaker(20 mL capacity,Cole Parmer,USA).The solutions were diluted gravimetrically to 10 g,mixed well and quantitatively transferred to the quartz digestion vessel equipped with an UV lamp. After sealing the vessels, the contents were digested in the microwave system with a pressure limit of 75 bar.The Multiwave-3000 was pre-programmed as follows: microwave power, 1000 W; digestion time,20 min with cooling fan at level 1;cooling time,15 min with cooling fan at level 3.
2.4. Analysis of sulfur
A ‘‘high performance'' methodology [18,19,22-25] has been used for the analysis of sulfate by IC and sulfur by ICP-OES in order to obtain relative expanded uncertainties on the order of 0.2% expressed at 95% confidence interval. Briefly, the‘‘high performance‘‘ methodology includes an internal standard, a drift correction technique and gravimetric solution preparation. To perform analyses using the ‘‘high performance'' methodology, a set of calibration standards (sulfur,sulfate)and a set of GSH solutions(ICP-OES)or its MW-UV digest (IC) are gravimetrically prepared, where the calibrants are prepared to mimic the expected characteristics of GSH or its digest with respect to analyte (sulfur, sulfate)and internal standard (phosphorus, bromide) mass fractions.The internal standard in each case is used to compensate for short-term noise and a drift correction procedure [28] to correct for low frequency noise. The amount fraction is determined as mass fraction, thus eliminating the uncertainty associated with density and its temperature dependence. All sample handling, i.e., dilutions and addition of internal standard was performed gravimetrically, with relative uncertainty from weighing of less than 0.1%. IC measures sulfate and ICP-OES measures sulfur. In the described work, an assumption is made in that the proportion of standard to unknown used to calculate mass fraction is equivalent whether sulfur or sulfate is measured.
Six preparations were typically made gravimetrically each for the IC calibration standard and the GSH MW-UV digest.The mass fraction for sulfate in these solutions ranged from 0.5-10 μg/g. These solutions were spiked with solution that contained bromide at a mass fraction 50 μg/g to obtain similar bromide mass fractions in the sample and calibrant solutions.Four blanks were prepared containing only the hydrogen peroxide.Similarly,for the ICP-OES measurement of sulfur,a set of six calibration standards and an equal number of GSH sample solutions were gravimetrically prepared so that all standards and samples are nominally the same with regard to the analyte (S) and the internal standard (P) mass fractions.The mass fraction of sulfur in these solutions ranged from 10 to 20 μg/g.These solutions were also diluted gravimetrically to 10 g. The respective sample solutions and calibration standards are run in the IC and ICP-OES instruments in a randomized complete block sequence [24,25,28] which is necessary for the implementation of drift-correction.
3. Results and discussion
3.1. Quantitation of sulfur by ICP-OES
As GSH is water soluble,direct aspiration of its aqueous solution into ICP plasma is practical with the technique provided that the residence time in the plasma is sufficient to completely dissociate GSH molecule. For validation of this approach, the sulfur mass fraction of aliquots of GSH after microwave-assisted digestion(1 mL HNO3+1 mL H2O2) was measured and compared against to those obtained from aliquots without digestion. For ICP-OES analysis of GSH,it was not necessary to digest the GSH solution as indicated by the results shown in Table 1. Agreement of the sulfur mass fraction results between the digested and undigested GSH aliquots by ICP-OES was observed in the range of GSH concentrations having sulfur mass fractions between 5 and 30 μg/g. However, to obtain metrologically sound analytical measurements through ‘‘high performance'' protocol, the level of sulfur [24] and internal standard (phosphorus) mass fraction introduced into the instrument were maintained between 10 and 20 μg/g. Mass fraction above 20 μg/g was avoided to minimize cross contamination and carryover.To facilitate close matching of the calibrant with the sample solution,the sulfur concentration in one aliquot of the GSH digest was obtained by a preliminary ICPOES experiment using external calibration.
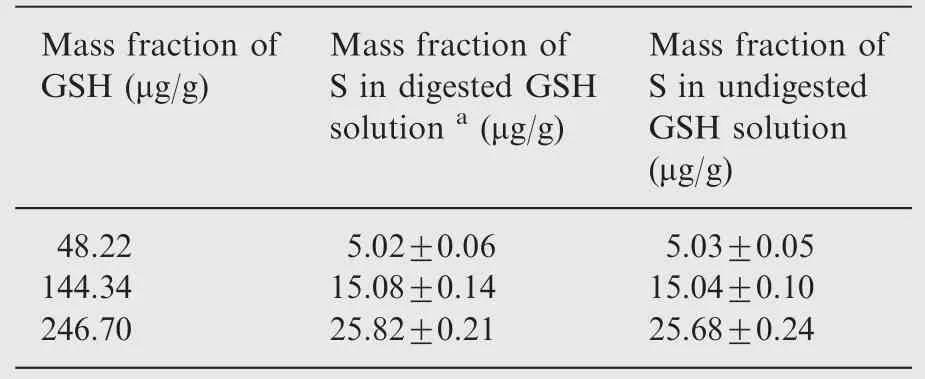
Table 1 Comparison of sulfur mass fractions obtained by ICP-OES from digested and undigested GSH solutions.
3.2. Optimization of MW-UV photolysis
For the determination of sulfur by IC, mineralization of GSH and conversion of sulfur to sulfate are required. Normally, in classical wet chemistry, nitric acid is used for the mineralization of organic matrix. However, the final digest containing large amount of nitrate ions creates interferences in the low capacity IC columns. As a better alternative, in the present experiment,the microwave (MW) assisted-UV photolysis [27] has been utilized for fast and efficient mineralization of GSH and simultaneous conversion of the sulfur content to sulfate in the presence of H2O2alone.The action of UV radiation on dissolved organics results in the formation of many intermediate compounds like excited states of hydrogen peroxide, singlet oxygen and hydroxyl radicals. Further, H2O2absorbs UV light and undergoes O-O bond cleavage from its electronically excited state, leading to hydroxyl radical (OH·) production and these hydroxyl radicals initiate the degradation of organics into carbon dioxide and water [29]. Multiple MW-UV experiments were carried out using varying amount of hydrogen peroxide(0.5 mL-2 mL,30%)for 15 min and the residual carbon content(%)[30]of the GSH digest (GSH mass fraction of 300 μg/g) was determined to evaluate the mineralization efficiency. The sulfur mass fraction measured by IC(as sulfate)was compared against the ICP-OES values to evaluate the extent of conversion efficiency(sulfur→sulfate)by the MW-UV procedure.A combination of 2 mL of H2O2with 10 min of MW assisted UV photolysis provided a residual carbon content (%) of 0.2.However, the sulfur mass fraction obtained by IC was at~80% of the ICP-OES values. The quantitative conversion was achieved by carrying out the UV photolysis for 20 min as the sulfur mass fraction of the digest obtained by IC(3.11±0.04 μg/g) was in close agreement to that obtained by ICP-OES(3.09±0.03 μg/g).Additionally,lowest residual carbon content of 0.03% was obtained under these conditions of MWUV photolysis (Fig.1). The quantitative mineralization of GSH may be attributed to high efficiency of UV photons due to 4π geometry and the attainment of temperature of 230°C.Further,the oxidizing power of hydrogen peroxide is enhanced in the presence of UV light [29] and most importantly the digest is amenable to suppressed-IC analysis as water is the main product,when the oxidizing strength of H2O2is spent.
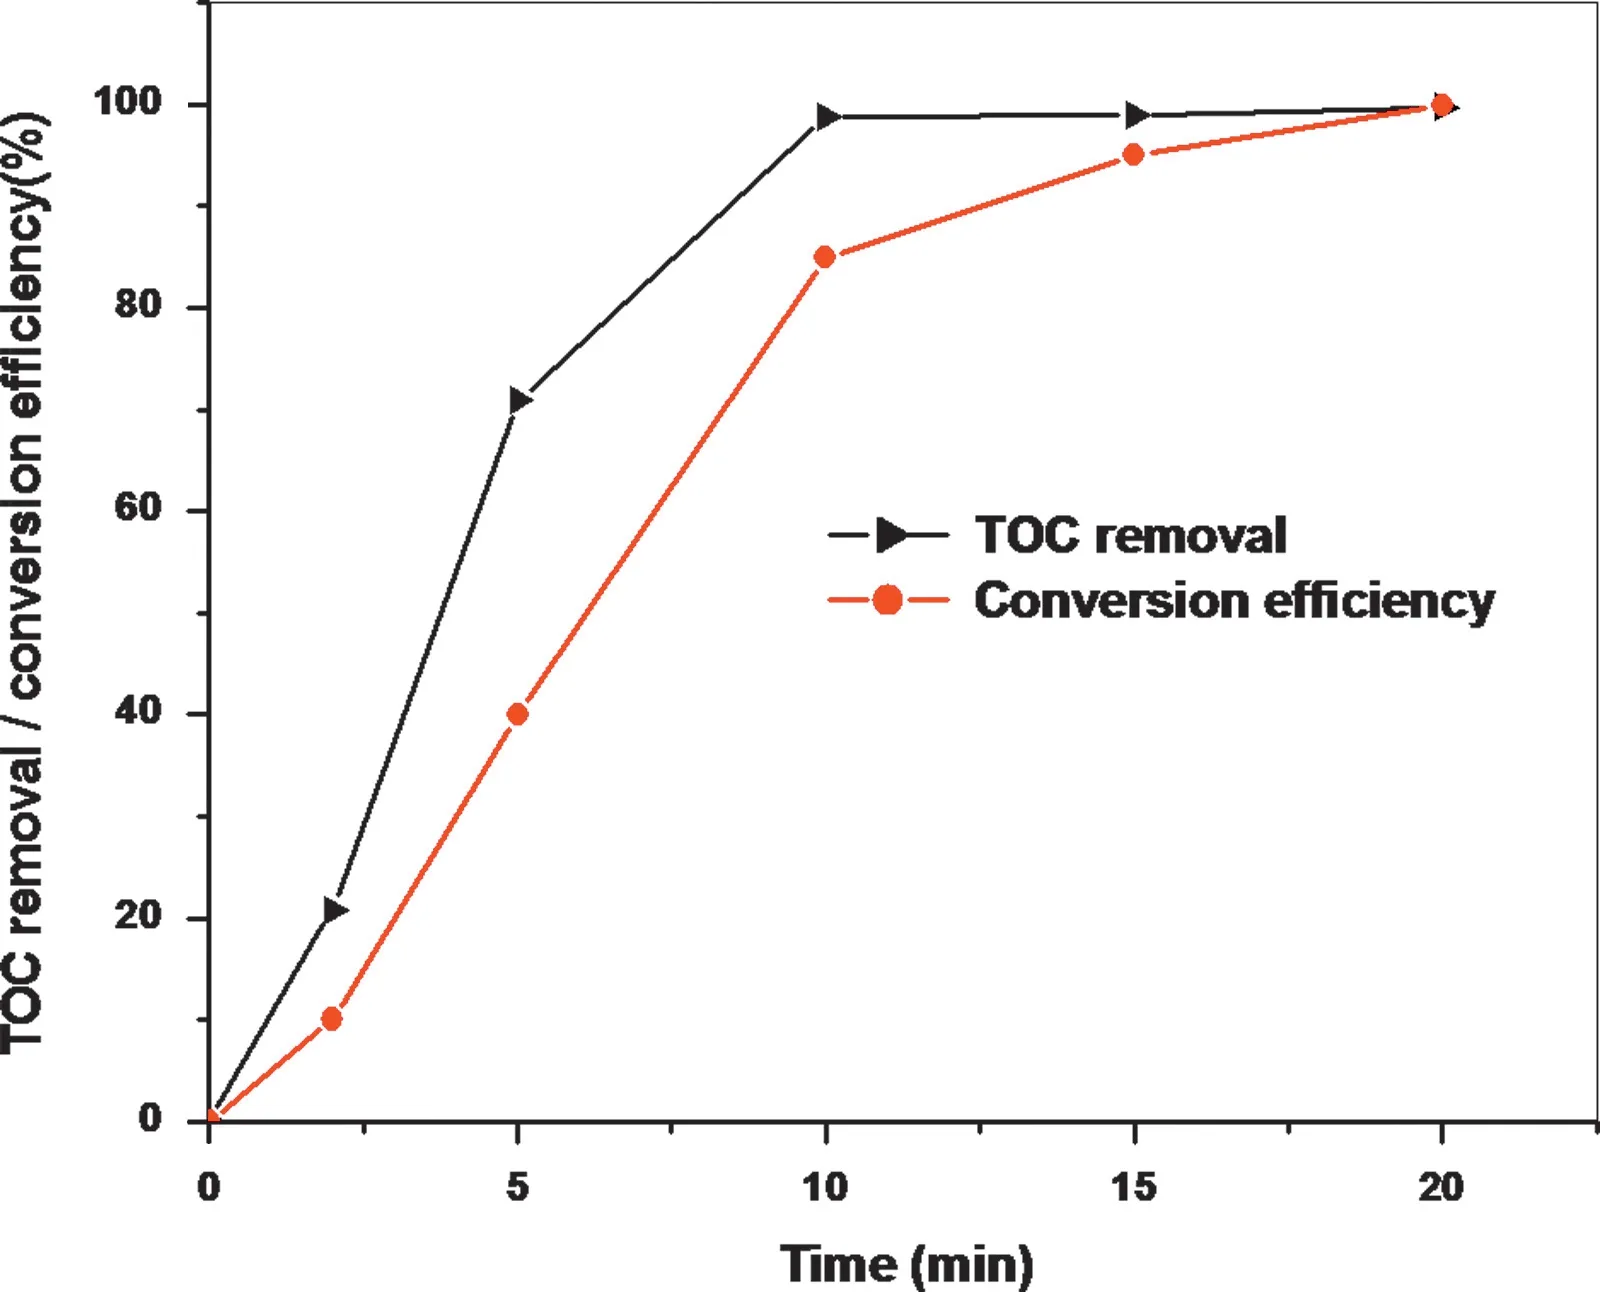
Fig.1 Extent of total organic carbon (TOC) removal and conversion (sulfur to sulfate) of GSH with time in the presence of hydrogen peroxide by MW-UV.
3.3. Quantitation of sulfur (as sulfate) by IC
The MW-UV digest of GSH was expected to contain nitrate ions as it contains three -NH2groups per molecule. As in the present experiment bromide is used as internal standard, the analytical column IonPac AS20 was used,which provides base line resolution between bromide and nitrate.The analyte peak(sulfate), internal standard (bromide) and nitrate peaks were completely resolved within a reasonable time of 10 min(Fig.2). In the GSH digest (mass fraction 30 μg/g); the calculated nitrate concentration will be 18 μg/g, assuming a quantitative conversion of nitrogen to nitrate. However,practically it was observed that only 20-25% of the nitrogen is converted to nitrate and this could be explained on the basis that quantitative conversion of nitrogen to nitrate requires an alkaline medium, whereas, the present MW-UV photolysis is carried out at neutral pH.Brennan et al.[25]had advised that quantitation of anions through ‘‘high performance'' methodology by IC containing significant anionic matrix requires indepth investigation relating to matrix matching of the calibrant to ensure that the analytical sensitivity is consistent throughout the analysis. Therefore, experiments were carried out to evaluate the effect of nitrate ions on the ratio of sulfate/bromide peak height. Set of solutions were prepared to contain identical sulfate and bromide mass fractions but with varying mass fractions of nitrate (up to 25 μg/g). These ratios of sulfate to bromide were compared with the results obtained when no nitrate was present. It was observed that the ratios were the same both in presence and absence of nitrate at the above mass fractions.So,the calibrants were prepared without matrix matching with respect to nitrate.
3.4. Process blank
In the ‘‘high performance'' methodology analytical process blanks were handled because sometimes commercially available Suprapur grade?hydrogen peroxide contains traces of sulfate as impurity.
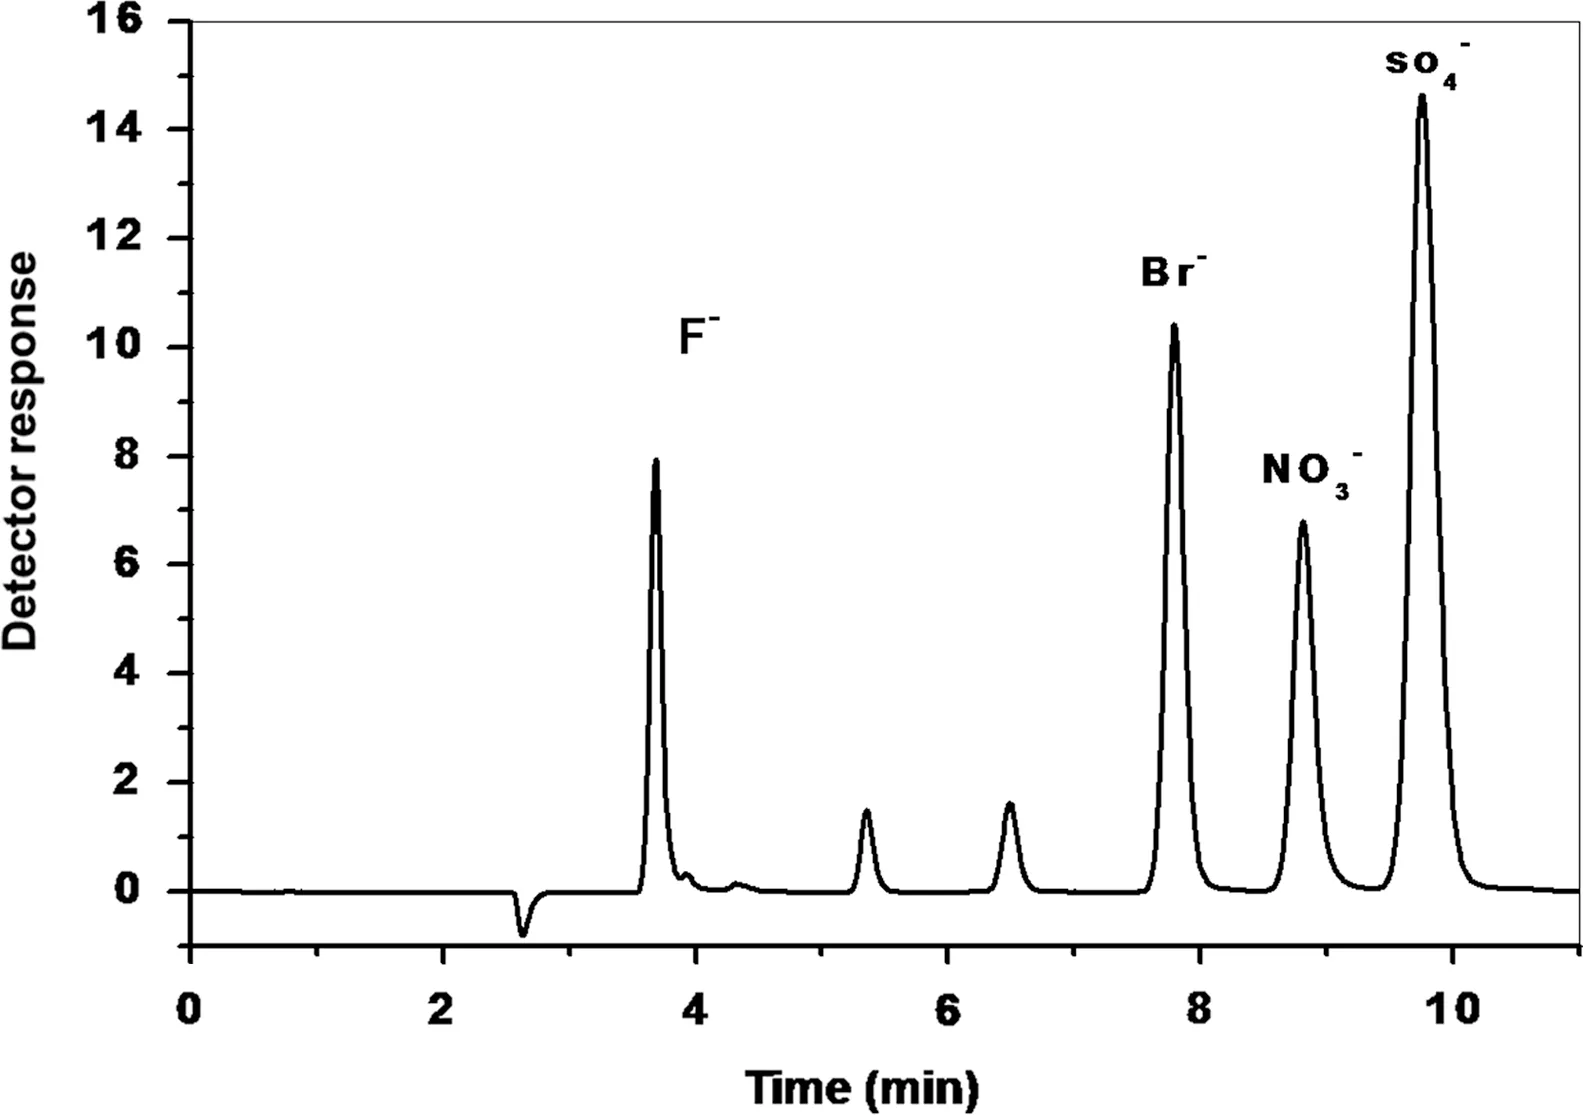
Fig.2 Chromatogram of MW-UV digested solution of GSH solution (mass fraction of 15 μg/g) after oxidation to sulfate.A fluoride peak appears as a result of leaching from the Teflon spacer and holder used for the microwave lamp.
3.5. Drift correction
The drift correction was carried out as described by Salit and Turk[28] for ICP-OES and further elucidated recently for IC by Brennan et al. [25]. In the present experiment, there are six preparations each for the calibrant and GSH solution or its digest.As per the ‘‘high performance'' methodology, the solutions are measured in a randomized sequence,until each solution has been measured once, then again in a randomized sequence, until each solution has been measured a second time,and so forth,until each preparation has been measured six times. So, in all there were 72 readings, 12 per block times 6 blocks. The observed sulfate to bromide peak height (IC) or the sulfur to phosphorus signal intensity ratios (ICP-OES) for all the readings (72) of the randomized block sequence is plotted against the solution run sequence. A polynomial is fitted to the plotted data in each case.The equations for the fitted polynomial are then used to correct the signal ratios for the drift of respective instrumental techniques.Fig.3 represents the instrumental drift for sulfur and sulfate measurement by ICP-OES and IC respectively. The fitted polynomials are also depicted in the respective figures.
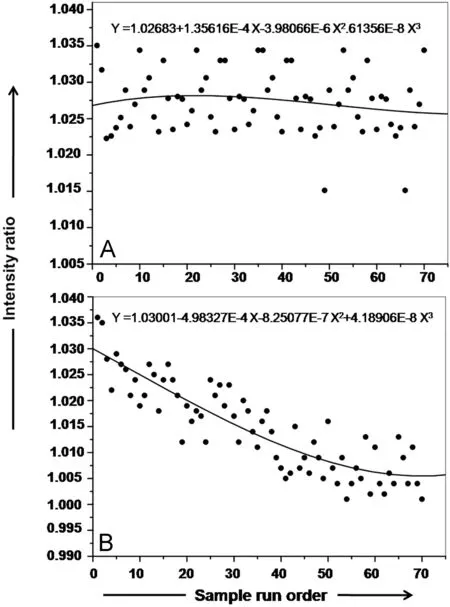
Fig.3 Instrumental drift pattern of: (A) ICP-OES for the analysis of sulfur with phosphorus as internal standard using peak area ratio; (B) IC for the analysis of sulfate with bromide as internal standard using peak height ratio. The polynomial depicted in each figure was used to correct the signal ratios for the drift. The drift is smaller in the case of ICP-OES than the IC.
The effectiveness of the drift correction was evident by comparing the RSD values of replicate measurements with and without drift correction applied for both the techniques.The RSD with drift correction for a sulfate mass fraction of 1 μg/g was smaller (1.1%) compared to an RSD value of 1.3,which was obtained without drift correction. Similarly, applying drift correction the RSD value for replicate measurements was reduced marginally by 0.04(sulfur mass fraction of 20 μg/g) by ICP-OES measurement.
3.6. Sulfur mass fraction
The ‘‘high performance'' methodology is a relative method that compares the analyte-to-internal standard intensity ratio measured in an unknown sample to those ratios measured in a calibrant whose amount ratio is well known. The differences between the analyte (S,SO42-)mass fraction of the calibration standard and GSH solution or its digest observed instrumentally are used to calculate the sulfur mass fraction of GSH sample.Eq.(1)[22]is used to calculate the sulfur mass fraction in GSH from the measured signal and mass ratios of the calibrant and GSH solution or its digest:
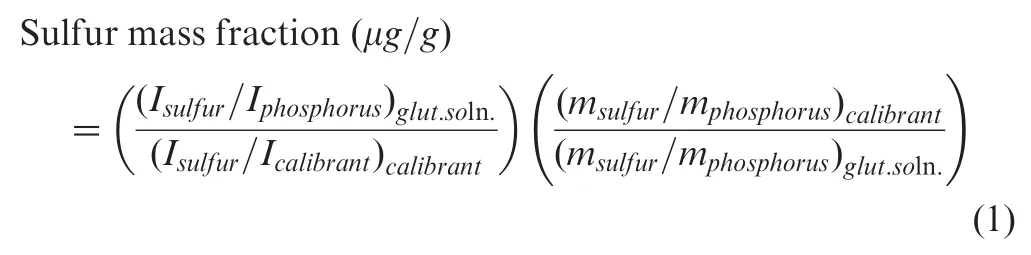
where I is the signal intensity (drift corrected) and m is the mass of sulfur or phosphorus (internal standard) in the calibrant and GSH solution for ICP-OES measurement.Similarly for the IC technique the same equation is used by measuring sulfate with bromide as internal standard. In the case of IC, from the measured signal, reagent blank signal for sulfate is subtracted prior to drift correction. In the case of ICP-OES, sulfur measurement was carried out directly from the aqueous GHS solution,without any sample digestion,andhence no analytically significant process blank for sulfur was observed.
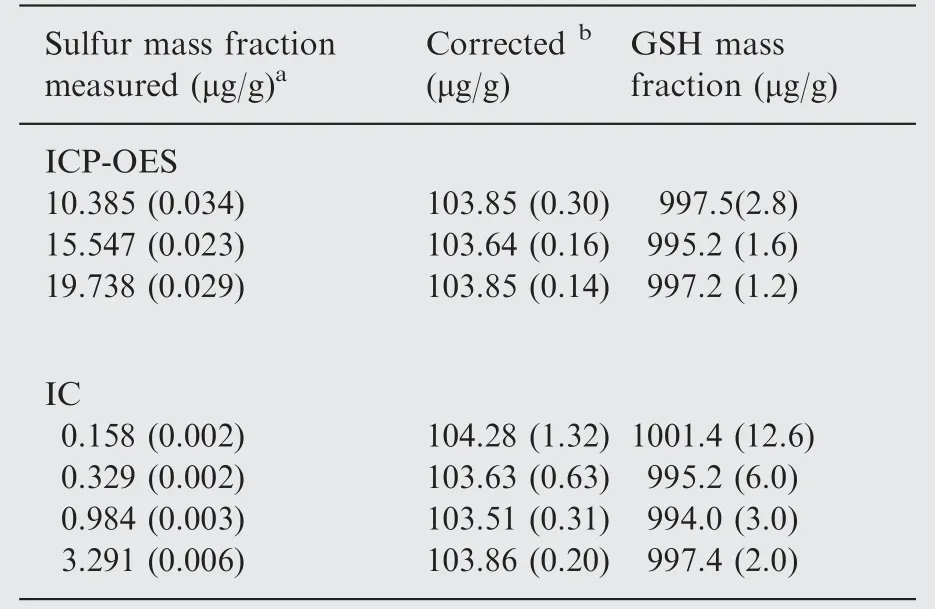
Table 2 Quantitation of the mass fraction of sulfur and GSH and comparison of the results between ICPOES and IC.
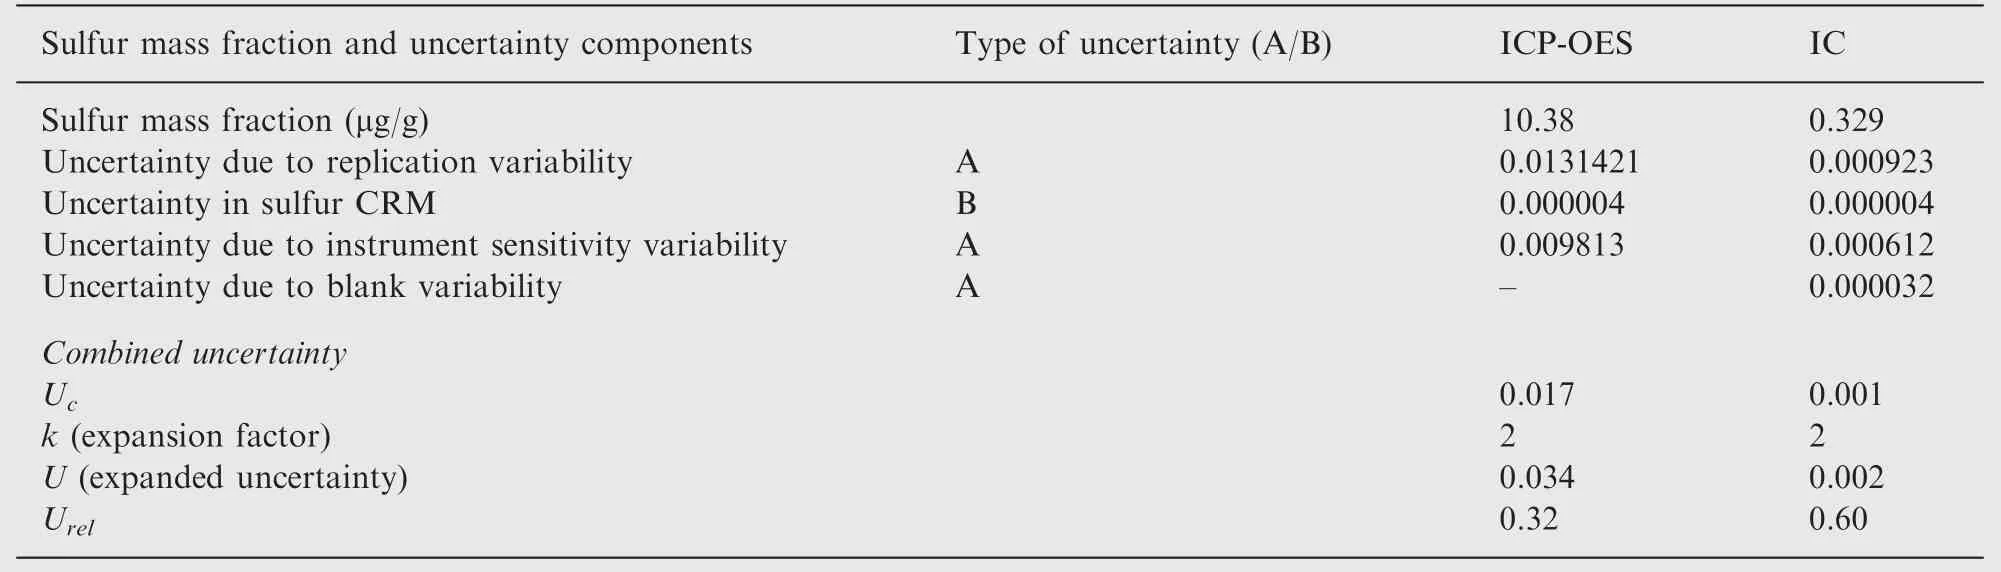
Table 3 Sulfur mass fraction and uncertainty components.
Different mass fraction levels of GSH were prepared by dilution of the original stock and analyzed for the sulfur mass fraction contents by ICP-OES and IC and the results are presented in Table 2. Consistent results were obtained with both the techniques over a range of starting mass fractions when back calculated to the original GHS stock mass fraction. There is statistically good agreement (t-paired test) between the IC and ICP-OES values for GSH mass fraction at 95% confidence interval.This agreement further confirms that microwave assisted UV-photolysis quantitatively oxidizes the sulfur content in GSH to sulfate. The calculated GSH mass showed relative expanded uncertainties that were in the range of 0.2-0.5% (ICP-OES) and between 0.3% and 1.4% for IC. The IC values had larger uncertainties than the ICP-OES.However,the minimum quantity of GSH mass required for the IC technique is much smaller(15 μg) compared to that of ≈1000 μg required for ICP-OES.
3.7. Uncertainty evaluation
The ‘‘high performance'' methodology [22] permits quantitative evaluation of the uncertainty from sample and calibrant preparation including sample manipulation.Eq.(1)is used to calculate the sulfur mass fraction from the measured signals from ICP-OES or IC. The standard uncertainties of the measured ratios (analyte/internal standard) were calculated as the standard deviation from the six replicate measurements.The variation of replicate analyses was estimated by using the standard deviation of the mean of the six replicate readings. Other sources of variability that would contribute to uncertainty were also considered. Variability in sample dilution/digestion is evaluated with replicate dilution/digestion; variability in calibrant preparation is quantified with replicate calibrant preparation. Uncertainty in the known value for the sulfur CRM standard was accounted for the calculation of the expanded uncertainty.All weighing were performed on a four figure analytical balance. The standard uncertainty on each mass was determined from the repeatability of calibrated weight measurements and the balance certificate. The recommendations from the ISO Guide to the Expression of Uncertainty in Measurement (GUM) [31] were used to estimate the expanded uncertainties expressed at the 95% confidence interval taking into consideration all systematic and random sources of uncertainty.In particular, expanded uncertainties were determined for sulfur measurements using the following equations:
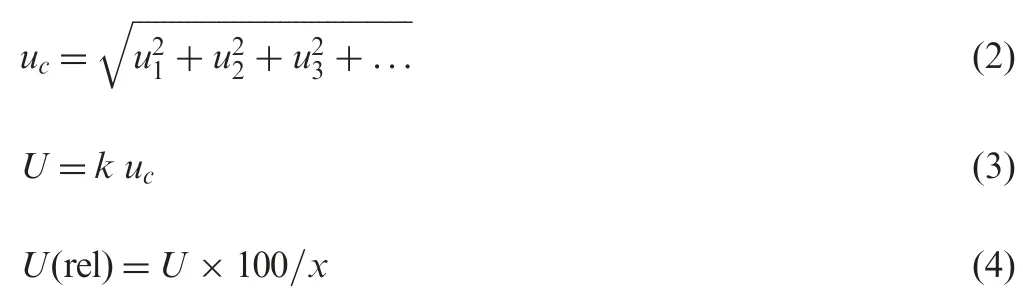
where ui(i=1, 2, 3..) represents the individual component of uncertainty, ucis the combined uncertainty, k is the coverage factor (2), U is the expanded uncertainty, and x is the observed measurement of sulfur mass. For IC data the uncertainty was calculated in a virtually identical way. Differing only in that variability in the values of process blank for sulfate was accounted as an additional component of uncertainty. The contribution of different uncertainty components of a particular S mass fraction measurement are presented in Table 3 for each technique. The uncertainty reported is the expanded uncertainty and is dominated by the standard deviation of replicate measurements.
4. Conclusions
The described method offers an approach for the quantitation of GSH through precise determination of stoichiometrically existing sulfur by ICP-OES and IC. Utilizing the metrologically sound‘‘high performance''methodology sulfur could be quantitated with very low measurement uncertainty of less than 1% with traceability provided by the use of a sulfur CRM. Measurement of sulfur requires that GSH be cleaned of other sulfur bearing impurities. It is intended that sulfur measurement by both the techniques will be very useful to produce high caliber reference standards that can be subsequently used to underpin the frequently used HPLC-UV and fluorescence based techniques.Compared to ICP-OES, the IC technique requires sample digestion, which in turn contributes as an additional component of uncertainty.However,ICP-OES requires relatively higher amount of GSH(1000-2000 μg),whereas analysis by IC can be done with a much smaller sample size(15-300 μg).Additionally,as the most sensitive emission line for sulfur is in the vacuum UV, it requires purging of the spectrometer and transfer optics with nitrogen.The described methods are more suitable for characterizing primary calibration standards and for validating and certifying reference materials of GSH, than for routine measurements.
Acknowledgment
Grateful acknowledgment is made to Dr. T. Mukherjee,Director, Chemistry Group, BARC, for his keen interest and encouragement throughout this work. We sincerely thank the authorities of EPTRI, Hyderabad, India for generously allowing us to perform ICP-OES experiments at their facility.
[1] G.I. Giles, K.M. Tasker, C. Jacob, Hypothesis: the role of reactive sulfur species in oxidative stress, Free Rad. Biol. Med.31 (2001) 1279-1283.
[2] I.Masneuf-Pomar`ede,C.Mansour,M.L.Murat,et al.,Influence of fermentation temperature on volatile thiols concentrations in Sauvignon blanc wines, Int. J. Food Microbiol. 108 (2006)385-390.
[3] R.Masella,R.Di Benedetto,R.Var`?,et al.,Novel mechanisms of natural antioxidant compounds in biological systems: involvement of glutathione and glutathione-related enzymes, J. Nutr.Biochem. 16 (2005) 577-586.
[4] J.A. Field, E.M. Thurman, Glutathione conjugatiobn and contaminant transformation, Environ. Sci. Technol. 30 (1996)1413-1418.
[5] B. Lomaestro, M. Malone, Glutathione in health and disease:pharmacotherapeutic issues, Ann. Pharmacother. 29 (1995)1263-1273.
[6] S. Marchand, G. de Revel, A HPLC fluorescence-based method for glutathione derivatives quantification in must and wine,Anal.Chim. Acta 660 (2010) 158-163.
[8] S.K.Park,R.B.Boulton,A.C.Noble,Automated HPLC analysis of glutathione and thiol-containing compounds in grape juice and wine using pre-column derivatization with fluorescence detection,Food Chem. 68 (2000) 475-480.
[9] J.L. Luo, F. Hammarqvist, I.A. Cotgreave, et al., Determination of intracellular glutathione in human skeletal muscle by reversedphase high-performance liquid chromatography, J. Chromatogr.B 670 (1995) 29-36.
[10] D. Fracassetti, N. Lawrence, A.G.J. Tredoux, et al., Quantification of glutathione, catechin and caffeic acid in grape juice and wine by a novel ultra-performance liquid chromatography method, Food Chem. 128 (2011) 1136-1142.
[11] D. Tang, M.M. Shafer, K. Vang, et al., Determination of dissolved thiols using solid-phase extraction and liquid chromatographic determination of fluorescently derivatized thiolic compounds, J. Chromatogr. A 998 (2003) 31-40.
[12] B.J. Mills, C.T. Stinson, M.C. Liu, et al., Glutathione and cyst(e)ine profiles of vegetables using high performance liquid chromatography with dual electrochemical detection, J. Food Comp. Anal. 10 (1997) 90-101.
[13] E. Bramanti, C. Vecoli, D. Neglia, et al., Speciation and quantification of thiols by reversed-phase chromatography coupled with on-line chemical vapor generation and atomic fluorescence spectrometric detection: method validation and preliminary application for glutathione measurements in human whole blood, Clin. Chem. 51 (2005) 1007-1013.
[14] J. Zhang, Z. Hu, X. Chen, Quantification of glutathione and glutathione disulfide in human plasma and tobacco leaves by capillary electrophoresis with laser-induced fluorescence detection, Talanta 65 (2005) 986-990.

[16] A. Zinellu, C. Carru, F. Galistu, et al., N-Methyl-D-glucamine improves the laser-induced fluorescence capillary electrophoresis performance in the total plasma thiols measurement, Electrophoresis 24 (2003) 2796-2804.
[17] J. Vogl, M. Koenig, W. Pritzkow, et al., Development of reference procedures for the quantification of toxic metals and S in plastics, J. Anal. Atom. Spectrom. 25 (2010) 1633-1642.
[18] M.J. Holden, S.A. Rabb, Y.B. Tewari, et al., Traceable phosphorus measurements by ICP-OES and HPLC for the quantitation of DNA, Anal. Chem. 79 (2007) 1536-1541.
[19] R.G.Brennan,S.A. Rabb,M.J.Holden,et al.,Potential primary measurement tool for the quantification of DNA,Anal.Chem.81(2009) 3414-3420.
[20] M. Mertens, C. Rittmeyer, B.O. Kolbesen, Evaluation of the protein concentration in enzymes via determination of sulfur by total reflection X-ray fluorescence spectrometry—limitations of the method, Spectrochim. Acta B 56 (2001) 2157-2164.
[21] S. Steinmeyer, B.O. Kolbesen, Capability and limitations of the determination of sulfur in inorganic and biological matrices by total reflection X-ray fluorescence spectrometry, Spectrochim.Acta B 56 (2001) 2165-2173.
[22] M.L. Salit, G.C. Turk, A.P. Lindstrom, et al., Single-element solution comparisons with a high-performance inductively coupled plasma optical emission spectrometric method, Anal.Chem. 73 (2001) 4821-4829.
[23] M.L. Salit, R.D. Vocke, W.R. Kelly, An ICP-OES method with 0.2% expanded uncertainties for the characterization of LiAlO2,Anal. Chem. 72 (2000) 3504-3511.
[24] M.R. Winchester, T.A. Butler, G.C. Turk, Improving the highperformance inductively coupled plasma optical emission spectrometry through exact matching,Anal.Chem.82(2010)7675-7683.
[25] R.G. Brennan, T.A. Butler, M.R. Winchester, Achieving 0.2%relative expanded uncertainty in ion chromatography analysis using a high-performance methodology, Anal. Chem. 83 (2011)3801-3807.
[26] K. Dash, L. Rastogi, J. Arunachalam, DNA quantification via traceable phosphorus measurement through microwave-assisted UV digestion-ion chromatography, Analyst 137 (2012) 668-674.
[27] D.Florian,G.Knapp,High temperature microwave-assisted UV digestion: a promosing sample preparation technique for trace element analysis, Anal. Chem. 73 (2001) 1515-1520.
[28] M.L.Salit,G.C.Turk,A drift correction procedure,Anal.Chem.70 (1998) 3184-3190.
[29] J. Golimowski, K. Golimowska, UV-photooxidation as pretreatment step in inorganic analysis of environmental samples, Anal.Chim. Acta 325 (1996) 111-133.
[30] H. Matusiewicz, E. Stanisz, Characteristics of a novel UV-TiO2-microwave integrated irradiation device in decomposition processes, Microchem. J. 86 (2007) 9-16.
[31] Guide to the Expression of Uncertainity in Measurement,International Organization for Standardization (ISO), Geneva,Switzerland, 1st edn., 1993.
 Journal of Pharmaceutical Analysis2013年3期
- Journal of Pharmaceutical Analysis的其它文章
- Development of a validated UPLC-qTOF-MS/MS method for determination of bioactive constituent from Glycyrrhiza glabra
- Determination of sildenafil by preconcentration on surfactant coated polymeric resin followed by spectrofluorimetry
- Development and validation of a rapid chromatographic method for the analysis of flunarizine and its main production impurities
- Volatile components of Rhizoma Alpiniae Officinarum using three different extraction methods combined with gas chromatography-mass spectrometry
- Thermally decarboxylated sodium bicarbonate: Interactions with water vapour, calorimetric study
- Determination and stress studies on YK-1101,a potential histone deacetylase, by HPLC-UV and HPLC-TOF/MS methods