
Dynamic Method for Evaluating the Environmental Carrying Capacity of a Chinese Industrial Park
2013-06-15 17:33:07LinyuXuPengKangBingYuXiaodongXie
Linyu Xu, Peng Kang, Bing Yu , Xiaodong Xie
State Key Joint Laboratory of Water Environment Simulation, School of Environment, Beijing Normal University, Beijing 100875, China
Dynamic Method for Evaluating the Environmental Carrying Capacity of a Chinese Industrial Park
Linyu Xu?, Peng Kang, Bing Yu , Xiaodong Xie
State Key Joint Laboratory of Water Environment Simulation, School of Environment, Beijing Normal University, Beijing 100875, China
Submission Info
Communicated by Zhifeng Yang
Environmental carrying capacity
Coupling coordination degree
Price scissors method
Industrial park
Increased industrialization has heightened the environmental pressure on complex ecosystems in industrial parks and even hindered sustainable development in some regions. Thus, we present an evaluation method for calculating the environmental carrying capacity of an industrial park, which provides a comprehensive evaluation index system for the environmental carrying capacity and environmental pressure. We used this method to conduct a dynamic evaluation of the coupling coordination for the environmental carrying capacity of Fushan Industrial Park in Zhuhai, China. We also simulated the environmental trends based on industrial park planning. The evaluation results showed that the coupling coordination degree exhibited a rapid upward trend from the early stage (2009-2015) of planning to the midstage of planning (2015-2020). In the mid-stage of the planning, the industrial park development was at the mid-level coordination degree. In the mid-late stage of industrial park planning, the coupling coordination degree exhibited a moderate decline, but it still remained at the intermediate coordinated development stage. The price scissors method was used to study the relative change between these stages and the results showed that the relative trend difference degree increased from 0.25 in the early stage of planning to 1.43 in the late stage of planning, which demonstrated that fluctuations occurred in the final stage of planning (2020-2030).
? 2013 L&H Scientific Publishing, LLC. All rights reserved.
1 Introduction
An Industrial Park is designed to facilitate the rapid and stable development of the economy in a limited area, where the resources and the environment must withstand a certain degree of development pressure due to constraints on coordinated regional development [1]. Thus, the heavy industry-intensive industrial parks need to assess the overall carrying capacity of the environment based on the external support system and the internal development system. It is also necessary to explore changing trends in the environmental carrying capacity (ECC) and the corresponding industrial park development pressure on the overall level of the industrial park, which is very important for the sustainable development of the industrial park [2-3].
1.1 Overview of ECC research
The ECC is the extent to which a certain environmental state and structure can withstand the effects of human society without harmful effects on human survival and development [4-6]. Environmental impact assessments based on the ECC aim to analyze changing trends of the ECC during a development from the perspective of sustainability, which provides a scientific basis for optimizing the planning program by decision-makers [7]. The ECC assessment in heavy industry-intensive industrial parks would play a crucial role on promoting its sustainable development.
Many researchers have applied the ECC to the analysis of regional planning by establishing the relationship between the development variables and constraint variables in combination with the Nemerow Index [8-9]. This method suggests possible improvements to planning and provides a scientific basis for the coordinated development of a region. The ECC index system played an important role in ECC evaluation. Based on the index contents, the environmental impact analysis, prediction and assessment during regional planning years can be conduct accordingly. Thereby, the suggesting measures could be provided for negative environmental impacts prevention and mitigation. [10]. Thus, ECC analysis forms the core of environmental impact assessments of regional development planning, so the establishment of a systematic, scientific, reasonable ECC quantification system and a comprehensive evaluation method is crucial for grasping the environmental impact of planning. ECC analysis is also an indispensable foundation for environmental planning and environmental management, and the vigorous promotion of ECC study is important for the sustainable development of the region.
Few previous studies have applied ECC to the developmental planning of industrial parks. Thus, the guidance and role of ECC in the sustainable development of industrial parks and other smaller regions has yet to be considered in detail [11]. Theoretical studies of the complexity and openness of industrial parks have used the ECC rarely to consider the strong interaction between the regional system and relatively simple interchanges with external bodies. Thus, the specific application of ECC to industrial parks needs further study. Therefore, we established an ECC evaluation index system and dynamic evaluation model for industrial parks. We also investigated the coupling relationships between industrial park resources, the environment subsystem, and the socio-economic subsystem using Fushan Industrial Park, Zhuhai as an example. We developed a coupling coordination degree evaluation method for the ECC and the pressures on industrial parks.
1.2 Study area
Fushan Industrial Park is located in Zhuhai City, Guangdong Province, China (Figure 1), and it is one of the four largest industrial parks in Zhuhai City, with an area of 151.59 km2. Its planning objective is to produce electronic information and machinery manufacturing via competitive industrial clusters, initially by building a harbor frontage industrial cluster focused on marine engineering, vehicle manufacturing, etc., and an advancedmanufacturing industrial cluster dominated by new energy, new technologies, and new materials. It would be formed an ecologically safe environmental pattern, which will gradually improve the circular economy system to establish an advanced eco-industrial park and a novel eco-industrial town with local characteristics through its regional plan. The long-term population size of Fushan Industrial Park is 0.35 million and the land available for construction is 62.7 km2, according to the “Zoning Plan of Zhuhai Fushan (2009–2030).” In this paper, we used the planning data in 2008 as background analysis and the target years for scenario analysis and forecasting by 3 stages, namely an early plan from 2009 to 2015, a mid-late plan from 2015 to 2020, and a late stage plan from 2020 to 2030. The size of the industrial sector will expand greatly and these developments will require vast amounts of resources, which will lead to environmental pressure on the industrial park and the surrounding area [12]. Thus, the ECC evaluation results can be used as objective values for the sustainable development of the industrial park.
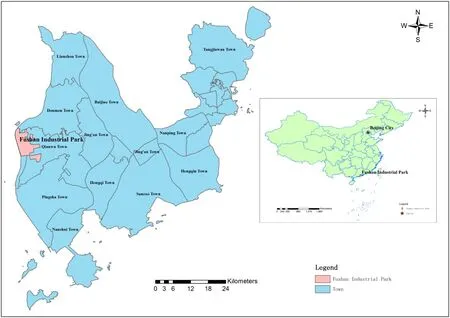
Fig. 1 Location of Fushan Industrial Park in Zhuhai, China.
2 Methodology
2.1 The conceptual model
We define the ECC of an industrial park (ECCIP) as the capacity of the overall industrial park to withstand socio-economic pressure during a certain period of time, in the context of the rational use of available resources and the environmental capacity of the industrial park, a stable ecological environment structure, and normal functionality. This can be characterized directly as the maximum socio-economic scalethat can be supported by the ecosystem of the industrial park, including the resource and environment, and indirectly by the mutual coupling effect relationship between ECC and environmental pressure.
Thus, the ECCIP comprises a series of developmental variables and constraints. The growth of the population and the expansion of economies of scale will consume large amounts of resources and cause pollution in the natural environment, thereby increasing the pressure on the ecological environment. However, more investment in environmental protection will enhance economic development, while strict policy management and cleaner production technologies will control the overall discharge of pollutants, which can alleviate the adverse effects of economic development on the ecological environment to some extent. Thus, this mechanism conforms to the principle of “coupling.”
2.2 ECCIP index and forecasting methods
2.2.1 Index system
Given the complexity and diversity of the regional socio-economic and environmental systems, the existing metrics/indicator system used to measure the ECC is difficult to apply to all activities in the region [13], because it is not possible to limit all indexes uniformly. Therefore, representative and easily quantifiable indexes are selected to facilitate qualitative and quantitative combined analyses of each subsystem.
Given the resources and environmental situation of Fushan Industrial Park, a comprehensive index system for ECCIP was established based on the possible impact of the industrial park planning and development on the natural environment and quality of life in the existing economic and technological development conditions of the industrial park. The ECC comprised the natural environment carrying capacity and human ECC, as well as the environmental pressure (EPS) caused by the development of the industrial park. The natural environment carrying capacity comprises the levels of the overall natural resources, environmental capacity index, and the manmade ECC with respect to the pollution control investment and industrial park ecological environment construction (Table 1) due to economic development. This analysis showed that the human ECC must consider the industrial park pollution monitoring and the investment situation, as well as the construction situation in the industrial park ecological environment. Therefore, the established indexes include the rate of solid waste treatment and the green building index, as well as other factors.
2.2.2 Dynamic model for forecasting the indicators
The analysis of the overall industrial park comprises the population, economy, resources, environment, and other subsystems, and the mutual impacts and interactions among these subsystems. According to the analysis of the interactions among the various subsystems, the population subsystem and economic subsystem are the powers that drive the system for the development of the industrial park. The pressure on the industrial park’s sub-environment is reflected mainly in environmental pollution during the development process, including exhaust gas, sewage, and solid waste.
The industrial park ECC-pressure index system can be used to establish a system dynamics model of the industrial park ECC. In this paper, the STELLA software was utilized to realize the dynamic forecasting for the water, environment components, atmospheric environment components and solid waste components of the environmental subsystem for Fushan Industrial Park, as well as its population and economic development.
The ECC comprises the natural environment carrying capacity and the industrial park human ECC, so the environmental system is the support system and the constraint system of the industrial park, which can be used as an evaluation subsystem for the economic subsystem, population subsystem, and social coordination development. To determine the ECC, this model collects the data before and after the treatment of the three types of waste emissions based on the major resource consumption rates in various industrial sectors in the industrial park. Depending on the waterborne, airborne, and solid waste, and other aspects of the ecological environment of the industrial park, this model analyzes the sources of waster production, the means and intensities of major pollutants, and the treatment processes for contaminants, before focusing on the treatment ratio of various contaminants and the volume of contaminant processing to predict the emissions of contaminants in the industrial park, thereby calculating the remaining ECC.

Table 1 Comprehensive index system for the environmental-carrying capacity
The waterborne ECC focuses on the water demand per 10,000 Yuan industrial output value of the industrial park and derives the wastewater output of the industrial park in combination with the water production coefficient, as well as deriving the concentration of COD and ammonia-nitrogen in the wastewater from various industrial sectors. For the atmospheric ECC, it focuses on the exhaust gas generations per 10,000 Yuan industrial output value and the generations of SO2, NOx, and smoke dust,and the ratios of SO2, NOx, and smoke dust in the industrial exhaust gases. For solid waste, it focuses on the industrial solid waste generations per 10,000 Yuan industrial output value and derives the outputs of various industrial sectors based on the solid waste statistics for the industrial park, while considering the capacity of the industrial park's solid waste treatment facility.
The environmental subsystem comprises a large number of composite parameters and relational expressions. Taking the generation and treatment of the water environmental pollutants as an example, the impact of the industrial park’s water supply/demand and the industrial activities on the water environment is mainly embodied in the water demand per 10,000 Yuan of different industries, the wastewater generation rate, and the COD and ammonia-nitrogen generated by the wastewater. In addition, the environmental protection measures are reflected in the wastewater treatment rate and the rates of pollutant decline in the wastewater. Their quantitative relationship is as follows.
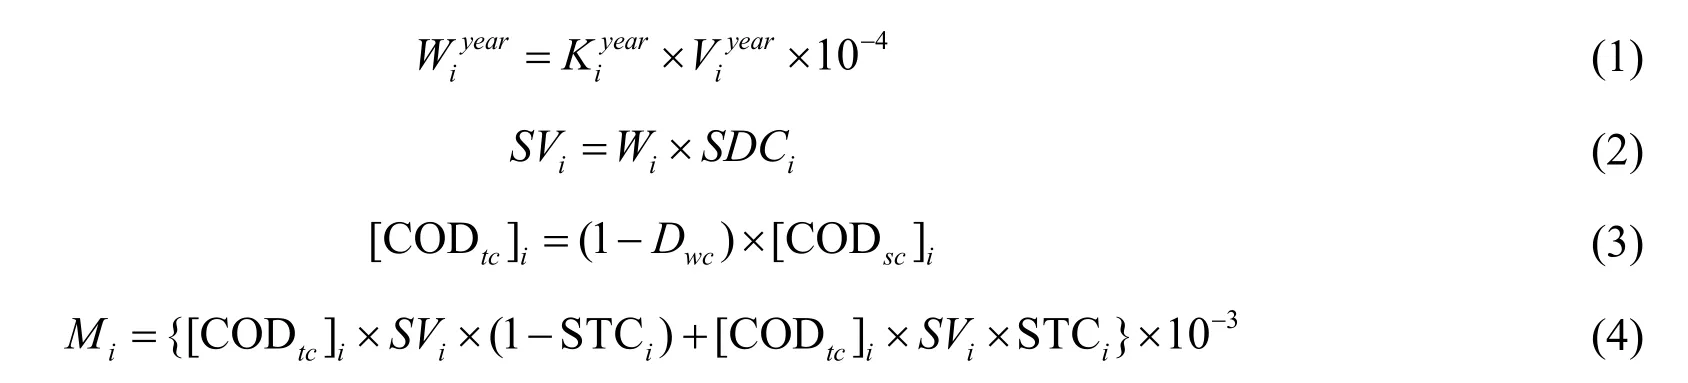
whereis the total water consumption of a certain industrial sector (10,000 t);is the per 10,000 Yuan water consumption of a certain industrial sector (t 10,000 Yuan-1);is the total output value of a certain industrial sector (10,000 Yuan);SViis the wastewater generations of a certain industrial sector (10,000 t);SDCiis the wastewater generation proportion of a certain industrial sector; STCiis the wastewater treatment rate of a certain industrial sector; [CODtc]iis the COD value (kg·m-3) in the wastewater after treatment for a certain industrial sector;wcDis the decline rate of the COD in wastewater[CODsc]iis the COD value (kg·m-3) in the wastewater before treatment for a certain industrial sector; andMiis the COD emission (t) of a certain industrial sector. According to the statistical analysis of water pollutants in the industrial park, the specific parameters for water treatment can be derived for all of the industries in the industrial park.
In general, the generation of atmospheric pollutants and the generation of atmospheric emissions in the industrial park are correlated with the concentration of various pollutants in the exhaust gases. However, the environmental protection measures for atmospheric pollutants are related primarily to exhaust gas treatment and the decline of pollutants in the exhaust gas treatment. This study selected the conventional pollutants including SO2, NOx, and smoke dust as the study objectives, and the specific relationships were as follows:
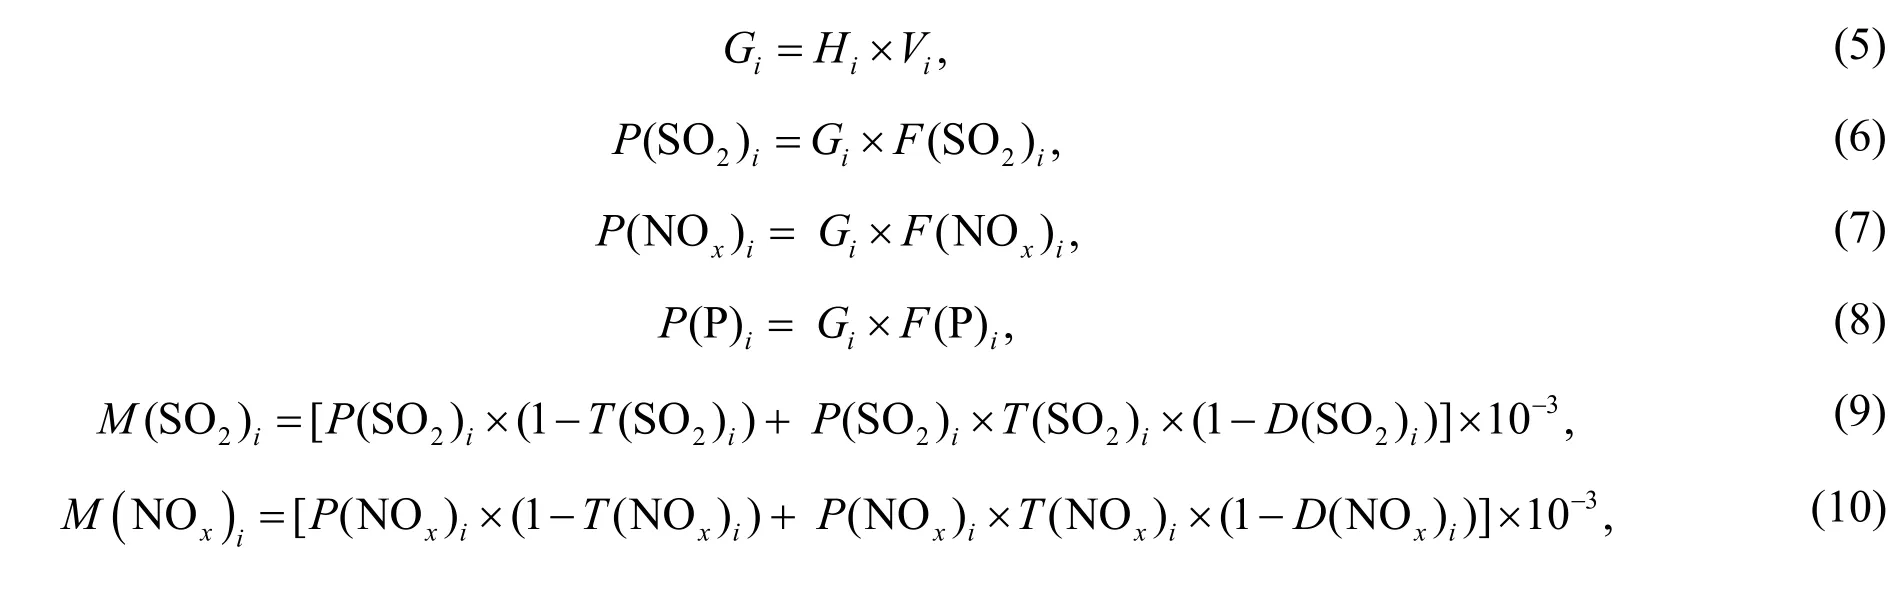

whereGiis the exhaust gas generation (m3) of a certain industrial sector;Hiis the per unit generation of a certain industrial exhaust gas (m3·10,000 Yuan-1),P(SO2)iis the generation (t) of SO2for a certain industrial sector;F(SO2)iis the concentration (kg·m-3) of SO2in the exhaust gas for a certain industrial sector;M(SO2)iis the emission of SO2(t) for a certain industrial sector;T(SO2)iis the treatment rate of SO2for a certain industrial sector;D(SO2)iis the rate of decline for SO2due to treatment for a certain industrial sector;P(NOx)iis the generation of NOxby a certain industrial sector;F(NOx)iis the concentration of NOx(kg·m-3) in the exhaust gas for a certain industrial sector;M(NOx)iis the emission of NOx(t) for a certain industrial sector;T(NOx)iis the treatment rate for NOxby a certain industrial sector;D(NOx)iis the rate of decline in NOxdue to treatment by a certain industrial sector;P(P)iis the generation of smoke dust (t) by a certain industrial sector;F(P)iis the concentration (kg·m-3) of smoke dust in the exhaust gas for a certain industrial sector;M(P)iis the emission of smoke dust (t) for a certain industrial sector;T(P)iis the treatment rate for dust by a certain industrial sector; andD(P)iis the rate of decline for smoke dust due to treatment by a certain industrial sector. Similar to the atmosphere and water environment system, the solid waste treatment system also considers the emission characteristics of the industry when building the simulation relationships.
The industrial park development system mainly comprises the population subsystem and the industrial park economic industry subsystem. The economic subsystem is subordinate to the power subsystem. The development of the industrial park consume a considerable amount of energy and water, and the production process will generate a large amount of exhaust gas, waste water, and solid waste emissions, which will have a great impact on the industrial park and its surrounding environment. In general, an industrial park comprises different industries and enterprises, but it is particularly important to ensure the quantitative management of an industrial park because of the diversity and complexity of its resource requirements during the economic development of different industries. The economic subsystem aims to advance the construction of an environmental protection investment system via its own development, while it performs the management and regulation of the overall environmental system in the industrial park to ensure the coordinated development of the environmental system and the economic system. The population subsystem, which is another development system in the industrial park, will directly affect the economic development, resource utilization, and ecological environment improvement due to increases in the population, productivity, and living activities. The population and resources are involved directly with regional economic development because of the basic resource requirements for production and living activities. The population and environment are involved directly with the evolution of the regional ecological environment via the waste generated by daily living. Therefore, it is particularly important to simulate the complex relationship between the development subsystem and the environment subsystem of the industrial park.
According to the characteristics of the industrial sectors in Fushan Industrial Park, the types of industries were divided into electronic information industry, machinery manufacturing industry, building material and home furnishing industry, textile processing industry, and other industries. The parameters of the economic subsystem include the industrial output value of various industries in the starting year, the development growth rate of various industries, and water resources and energy demands. This subsystem uses the industrial output value of the industrial park as a state variable, while the growth rates of various industries in different industrial parks refer mainly to the planning and development of industrial sectors in Guangdong Province. The per unit demand of water environment and energy was predicted and analyzed using the grey relational degree GM(1.1) model. The forecasting results are used as forecast parameters or models, which are inputted into the industrial park economic development subsystem of the system dynamics. For the industrial park population subsystem, the regional population is used as the state variable, while the annual newly-born population, the annual death population, and the annual net immigration population of the industrial park are used as the rate variables. In addition, we established the relationships between the industrial park resources environment subsystem via the consumption of resources,such as the per capita water consumption and pollution emissions, i.e., the sewage generation coefficient, COD, and ammonia-nitrogen content of sewage. The relationships among these parameters are as follows:
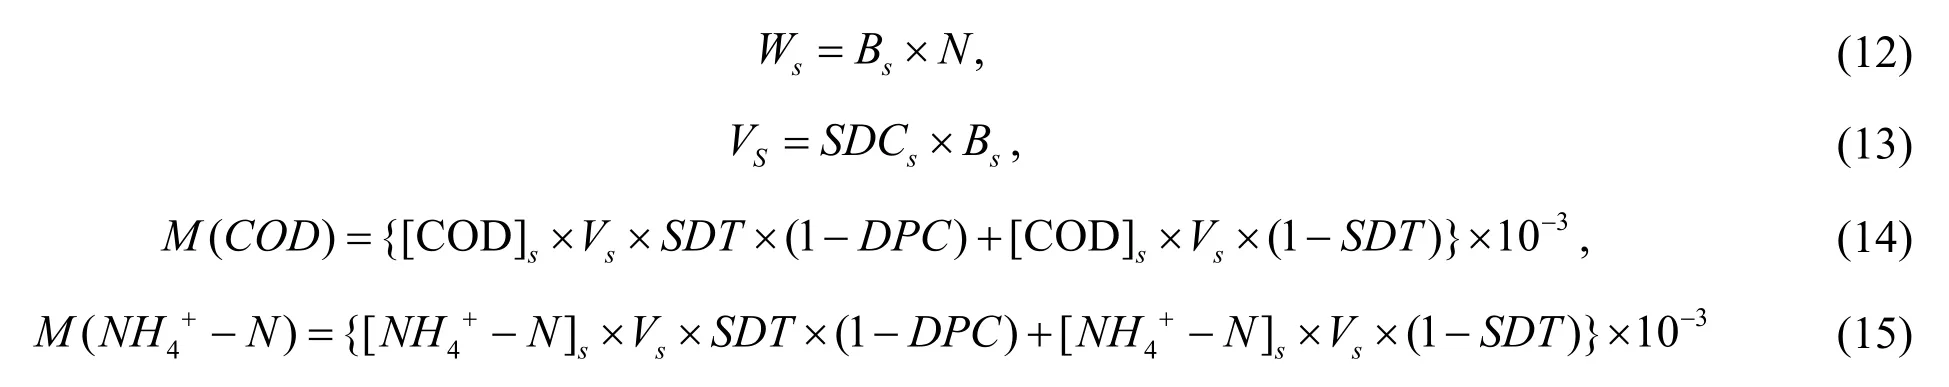
whereWsis the total amount of water required by the population in the industrial park (t);Bsis the per capita domestic water consumption (t· person-1);Vsis the generation of sewage (t);Nis the industrial park's total population;SDCsis the generation rate of sewage for domestic water;M(COD) is the total discharge of COD by the population (t); [COD]sis the concentration of COD in the domestic sewage (kg·m-3);M(NH4+-N)is the total emission of ammonia-nitrogen by the population (t); [NH4+-N] is the concentration of ammonia-nitrogen in the domestic sewage (kg·m-3);SDTis the sewage treatment rate; andDPCis the rate of decline of pollutants due to the treatment process.
The resource supply and demand also considers the water demand and supply capacity of the industrial park, the simulated energy supply and demand, the construction of solid waste processing facilities and related infrastructure. This section mainly considers the planning of the related infrastructure in Zhuhai City and its industrial park development and construction planning.
2.3 Evaluation methods for coupling coordination of ECC - pressure
2.3.1 Coupling mechanism analysis of ECC and pressure
Coupling is a physics concept, which refers to interactions that occur via various mutual effects between two or more systems. The coupling degree is used to describe the extent of the mutual interactions between systems or elements. From the point of view of synergetics, the coupling effects and the degree of coordination determines the sequence and structure when moving through a system after reaching a critical area, i.e., determining the trend in the system from disorder to order. The resources of the environmental subsystem and the socio-economic subsystem jointly constitute the overall ecosystem of the industrial park, and the matrix of the environmental pressure and the ECC overlaps, i.e., the socialeconomic system means that environmental pressure is an integral part of the industrial park’s composite ecosystem, whereas the capacity of the socio-economic system to improve the resource environment is also a part of the ECC. Thus, the environmental system and the socio-economic system contribute to the ECC. The relationship between these two is extremely close, so the coupling mechanism is significant. The essence of the ECC can be characterized indirectly as the interaction of the industrial park resources environment and economic activities, which also demonstrates the synergy among various order parameters in the various subsystems of the industrial park, thereby taking the system from disorder to order, which determines the characteristics and laws of phase transformations for the overall system. Thus, it is useful to employ the coupling coordination degree to characterize the ECC of the industrial park.
In this section, the disorder of the industrial park system may be understood as the uncoordinated state of the industrial park environmental pressure and the industrial park ECC, i.e., the industrial park environmental pressure exceeds the industrial park ECC, which may be the difference in the harmonious development due to the industrial park development pressure rarely utilizing the space of the ECC. This largely affects the sustainable development of the industrial park. By contrast, the ordered industrial park system may be considered as the industrial park development pressure, which is at a perfectly acceptable level, while the ECC of the industrial park is in a moderate state. For a disordered system, it is necessaryto take effective economic and environmental measures to adjust the development relationship to achieve the desired orderly state. For an orderly system, it is necessary to maintain the state and reduce the possibility of entering a disordered state. The critical state transformation may be identified and distinguished by referring to the coupling coordination degree standard.
2.3.2 Coupling coordination degree of ECC and pressure evaluation
The scale and trend of the regional ECC is the combined effect due to the coupling of the coordinated development state and the evolution rate attributable to the environmental pressure against the development of the industrial park. According to the coupling theory of the ecological-economic system, the coupling relationship of ECC and environmental pressure is the objective when characterizing the interactive stress, i.e., the interactive dependencies between the resource environment system and the socio-economic system, and among the elements of the various systems. Due to the combined effects of various factors, the ECC ()f xand environmental pressure ()f yare nonlinear processes with continuous gradients over time, and their respective evolutionary equation can be expressed as follows:
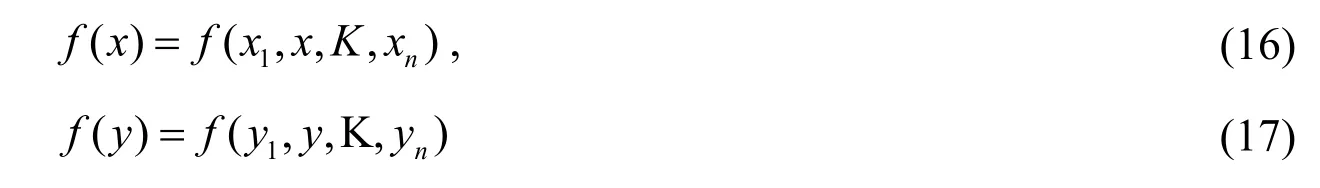
wherex, yare the combined element of the ECC and the environmental pressure, respectively. The coupling relationship of the ECC and environmental pressure can be evaluated using the coordinated development model, the formula of which is as follows [14]:
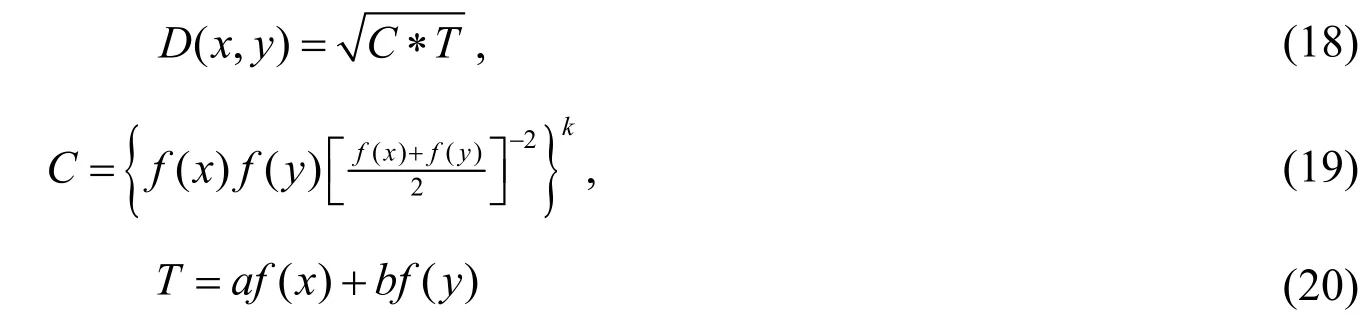
whereCis the coordination index of the ECC and environmental pressure;kis the coordination coefficient, which isk=2 because this study only considered the relationship between the ECC and environmental pressure; T is the comprehensive change index of the ECC and environmental pressure;a+b=1 in this study,a=b=0.5 because the ECC and the industrial park development are equally important factors for the sustainable development of a region. The value of the coupling coordination degreeD(x,y) is a constant between 0 and 1, which indicates the interaction between the ECC and environmental pressure (sum of [f(x) andf(y)]). Under certain conditions, for the sake of maximum combined benefits (plot off(x) andf(y)), the quantitative degree of the combined coordination of these two can be used as an important index to reflect regional sustainable development.
2.3.3 Evaluation criteria for the coupling coordination degree
To evaluate the changing trends in sustainable development for the industrial park, the following evaluation criteria were set based on the division level of the coupling coordination degree (Table 2).
2.4 Trend analysis method for coupling relations of ECC and pressure
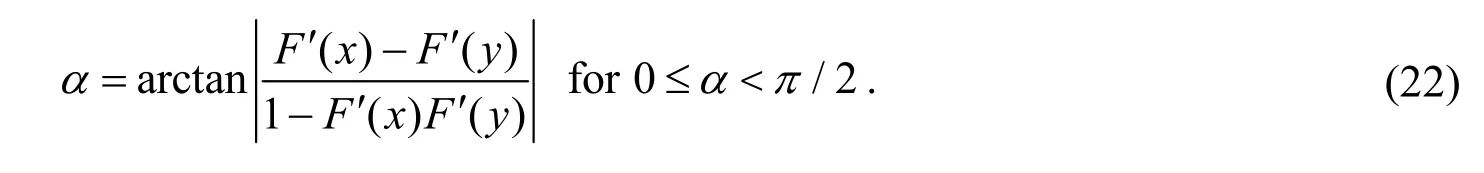
The price scissors method is used to detect the differences between two changing trends, so the coupling relationship between the ECC and environmental pressure can be described using the price scissors method. The rates of evolution of the ECC and environmental pressure, respectively, are as follows:
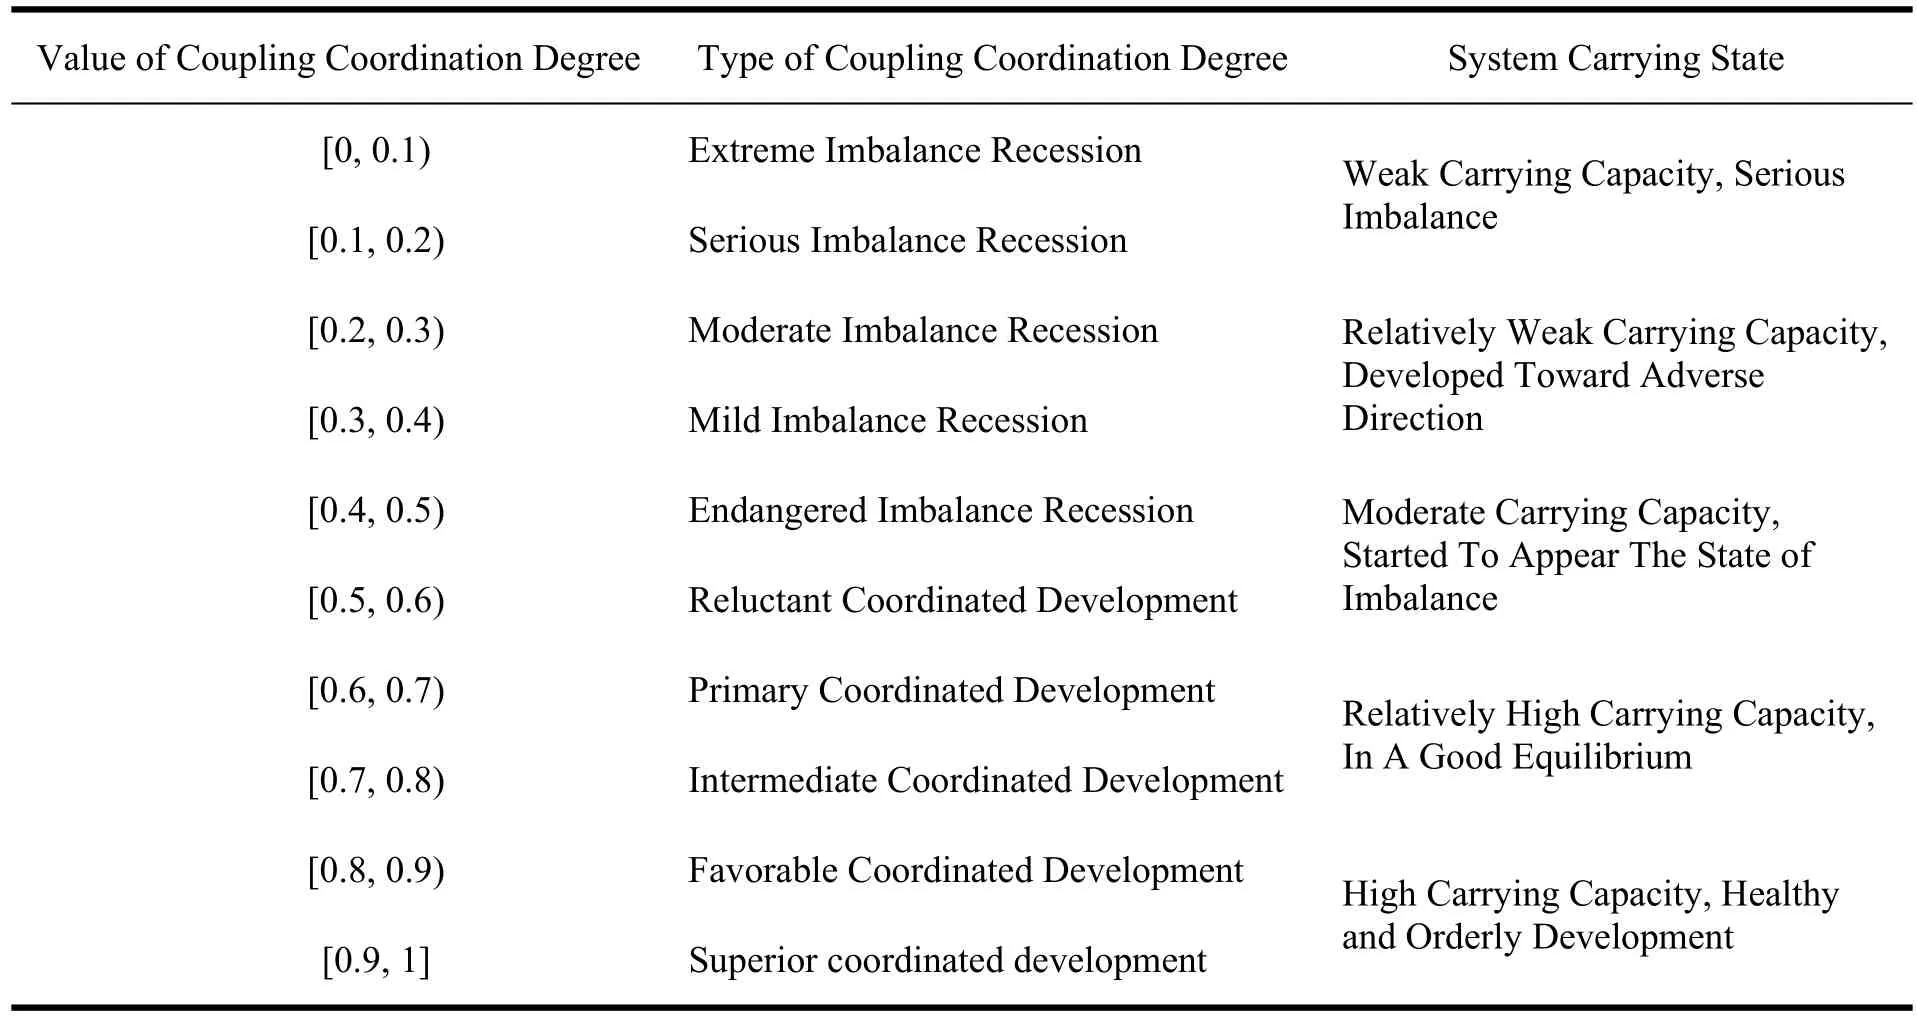
Table 2 Evaluation criteria for the coupling coordination degree

The price scissors values of the rates of change for these two systems were calculated as follows.
3 Results and discussion
3.1 Data acquisition and forecasting
Based on the resource consumption of various industrial sectors, i.e., three types of waste discharge and the treatment data for the industrial park, we focused on the following. For the atmospheric environment, we considered the exhaust gas generations per 10,000 Yuan industrial output value and the generations of SO2, NOx, and smoke dust, and the ratios of the generation of SO2, NOx, and smoke dust in the industrial exhaust gas. For the water environment, we focused on the water demand per 10,000 Yuan industrial output value, and derived the wastewater production of the industrial park combined with the coefficient of water production, i.e., the concentration of COD and ammonia-nitrogen in the wastewater from various industries combined with the water pollutant levels of COD, ammonia-nitrogen and other relevant environmental statistics for the industrial park. For the solid waste, we focused on the generation of industrial solid waste per 10,000 Yuan industrial output value, and derive the outputs of various industrial sectors in combination with the statistics for solid waste in the industrial park. Thus, we only considered the manner of production, the means, and the intensity of the pollutants discharged by industrial production and living activities. The treatment process paid special attention to the treatment rates for various pollutants in the pollutant treatment process and we identified the relationships based on the final emissions of the three pollutant types in the industrial park. In addition, the resource supply and demandincluded the supply and demand capacities of water bodies, and the energy supply and demand capacity of the industrial park, where the main data came from the planned scale of infrastructure construction for the industrial park. Based on the system dynamics model, we derived the simulation values for the ECC and the industrial park development pressure at different times for each index, as shown in Table 3 and Table 4.
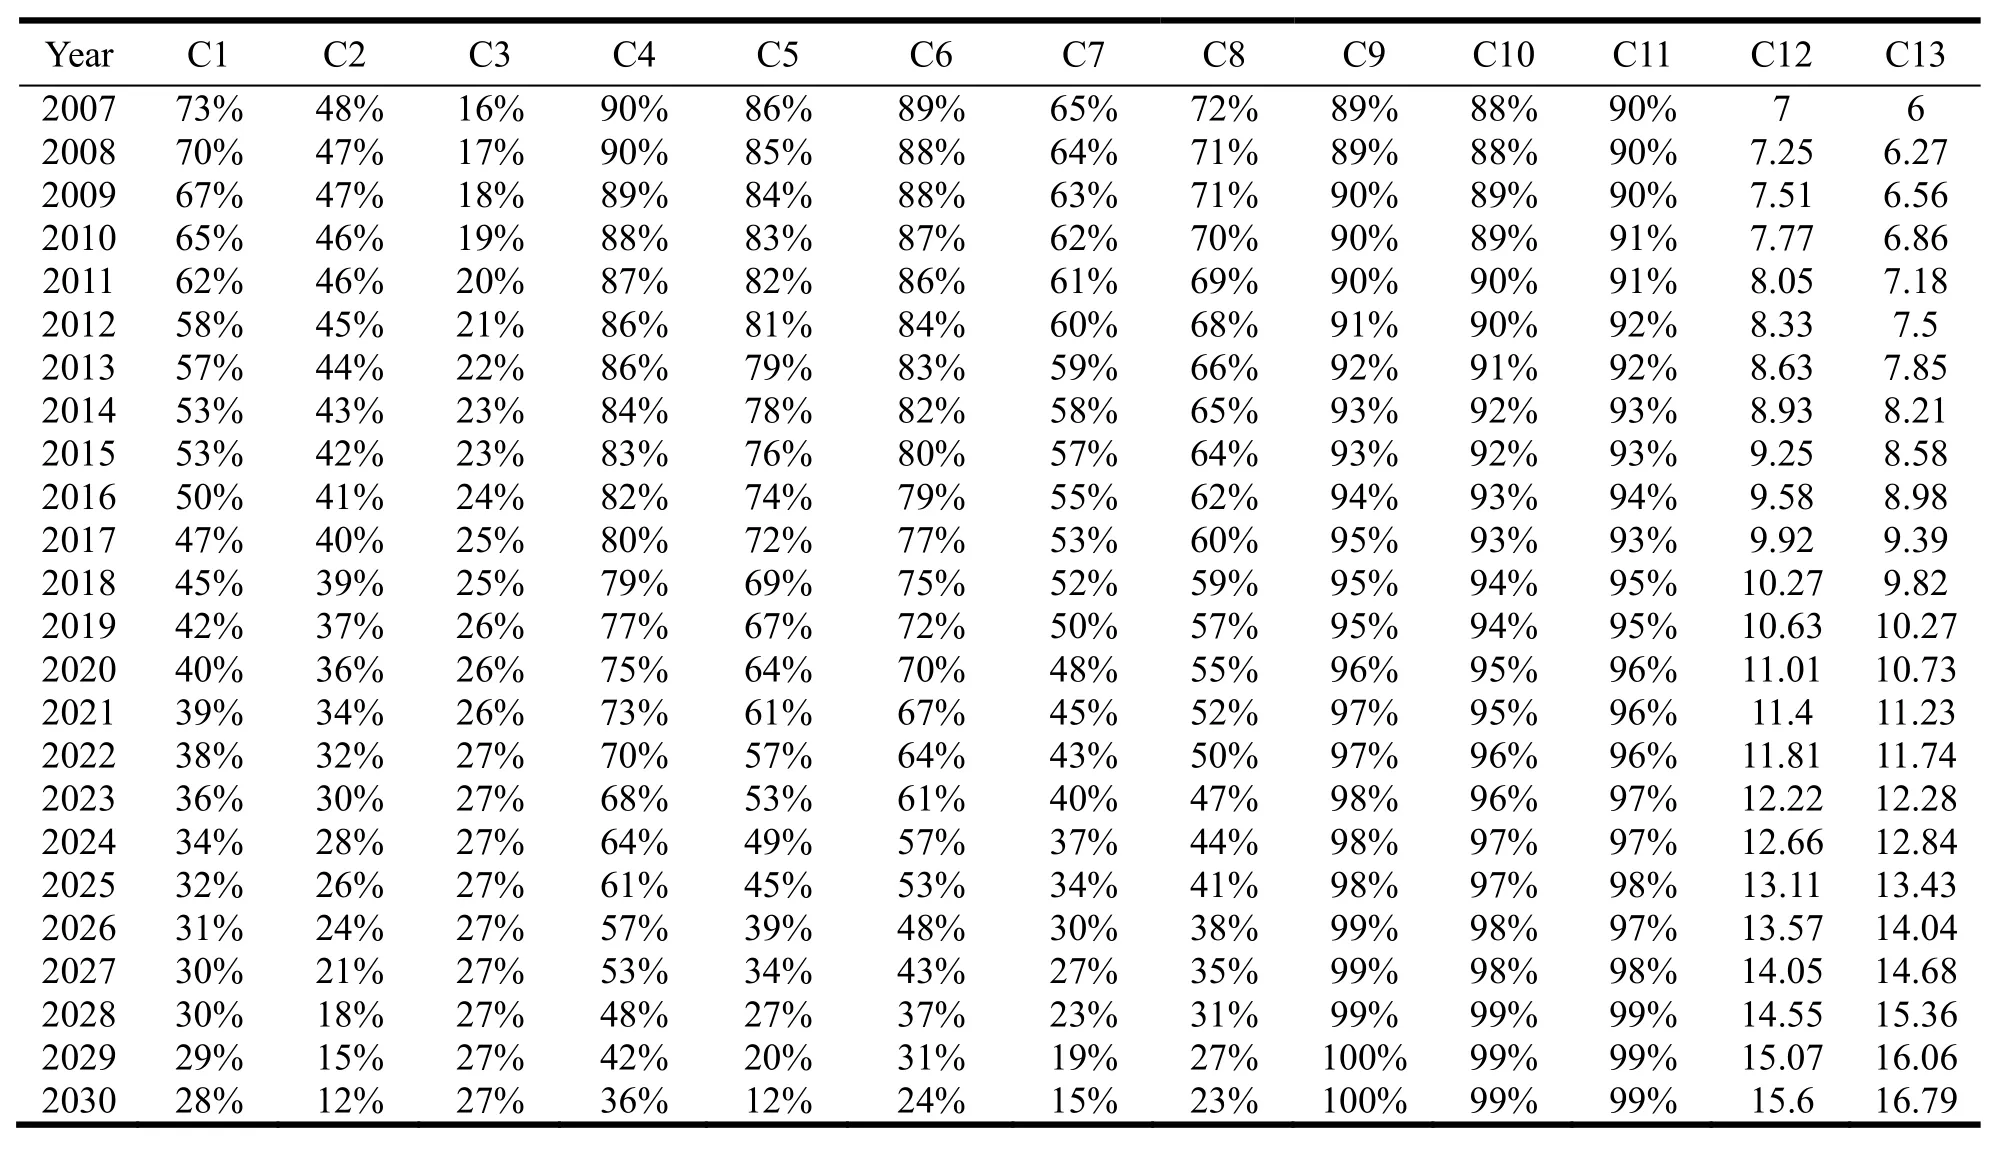
Table 3 Simulated values for the environmental carrying capacity index
3.2 Analysis of the ECC - pressure coupling coordination degree
SPSS16 was used to analyze the coupling coordination degree for the ECC and environmental pressure according to the following steps. We used principal components analysis to quantify the evolution of the industrial park’s ECC and the industrial park’s development.
According to the contents of ECC-Pressure indicators in Table 1, we consider the ECC indictors are positive indicators, while EPC’s were negative. For indicator standardizing process, the specific steps were as follows: we used Eqs.(23), (24) to conduct standardized processing for each index, Eq. (23) as a positive index, and Eq. (24) as a negative index. We calculated the correlation coefficients between the sample variables and calculated the eigenvalues of the variance and the cumulative variance of the contribution rate for the sample correlation matrix, before determining the principal components according to the 85% variance cumulative contribution rate. We also derived the factor loadings and factor scores of the principal components.
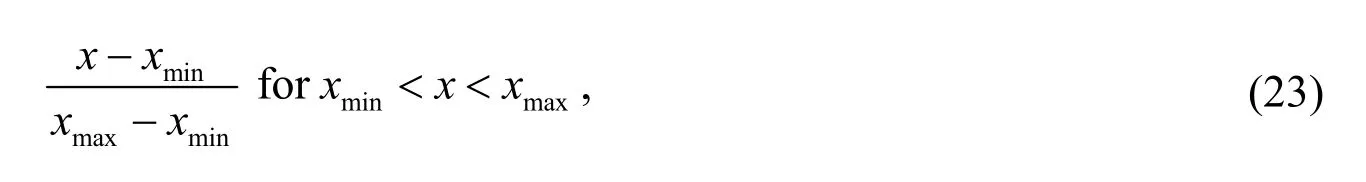
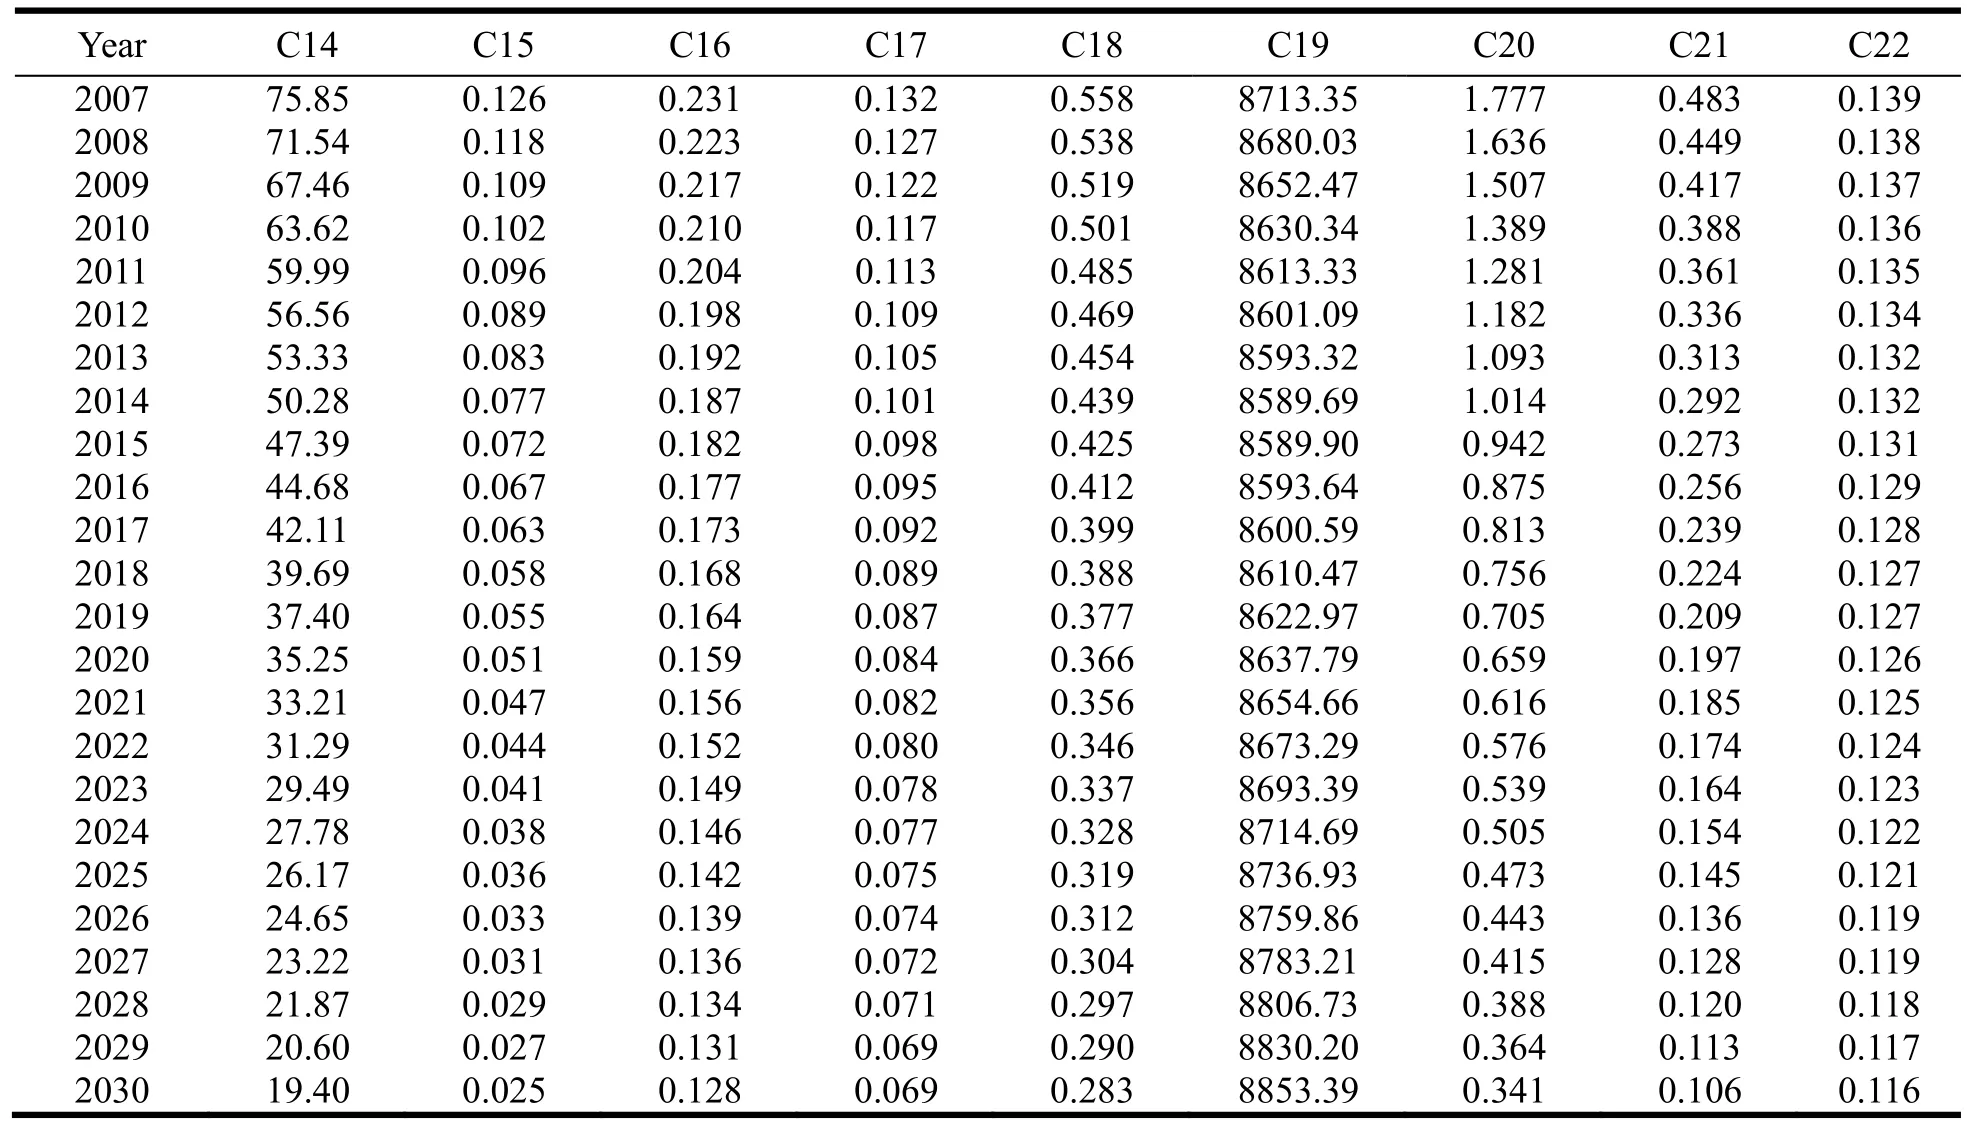
Table 4 Simulated values for the industrial park development pressure
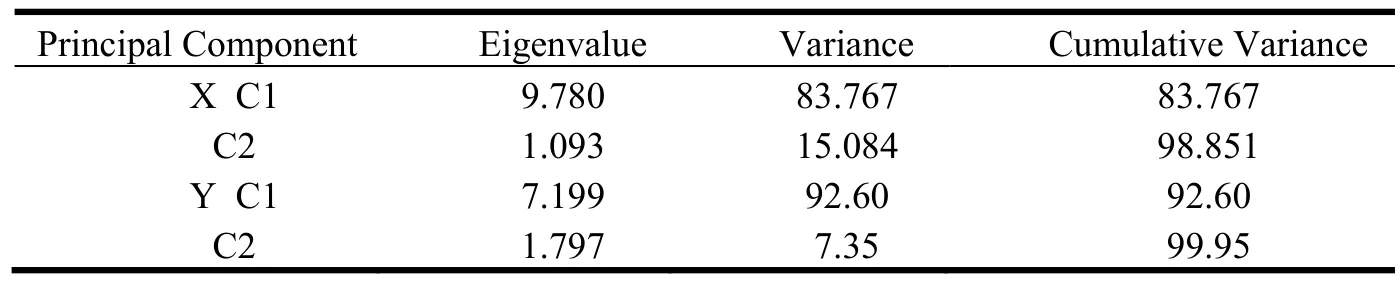
Table 5 Eigenvalues and cumulative contribution rates of the principal components
The principal components analysis obtained the first two principal components. We expressedF(x) and used the first two principal components to expressF(y), as well as the variance contribution rate of various principal components as the weight. We utilized the scores of the principal components to create an expression to quantify the state equation of the industrial park ECC and development pressure.

Table 6 shows that the state equation value of ECCF(x) declined year-on-year from 0.887 in 2007 to 0.104 in 2030, which suggests that the ECC will decline with the development of the industrial park, where the declining trend will slow at the mid-stage of planning. By contrast, the state equation values of the industrial park development pressureF(y) increased year-on-year from 0.398 in 2007 to 0.818 in 2030, which suggests that the industrial park development pressure will decline further with the development of the industrial park, where the declining trend was relatively significant at the mid-stage of plan-ning. It should be noted that the state equation results are trend values rather than evaluation values in the traditional sense. In this study, the state equation results were used mainly in the intermediate process during coupling coordination degree evaluation.
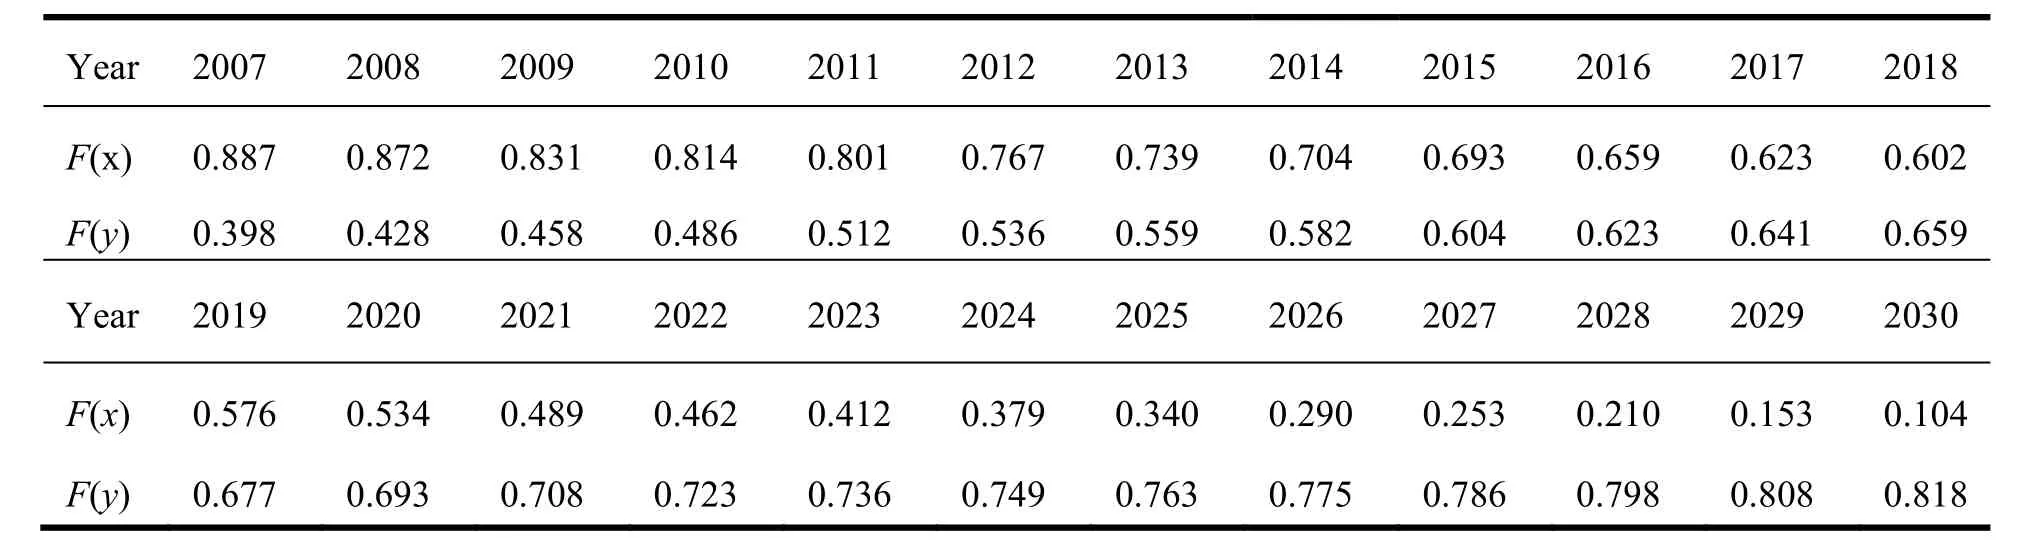
Table 6 Composite score of ()F xand (y)F
3.3 Analysis of the changing trend in the coupling coordination degree
The coupling coordination degree [D(x, y)] of the industrial park’s ECC and environmental pressure increases from 0.55 in 2007 to 0.73 in 2030. As shown in Figure 2 for the changing trend, the evaluation value of coupling coordination degree during the study period has an upward trend, which continues until the early-mid-stage of planning, where the maximum value is at the mid-stage of planning. However, with the further development of the industrial park, the industrial park coupling coordination degree exhibits a moderate downward trend. According to the division criteria in Table 1, the industrial park coupling coordination degree at the initial stage changes from the originally reluctant coordinated development to primarily coordinated development, and it even reaches an intermediate coordinated development at the end of the early stage of planning. After the further expansion of the industrial scale and population size of the industrial park, there is a greater impact on the ECC. Nevertheless, owing to the increasingly improved infrastructure and progress of science and technology in the industrial park, the coupling coordination degree exhibits a moderate decline, and remains at the intermediate coordinated development in the mid-late stage of planning, where its carrying capacity is in a moderate state. Considering the two main factors that affect the coupling coordination degree, i.e., the comprehensive development trend of the industrial park ECC and environmental pressure, the ECC and environmental pressure remains at a level of about 0.6 from the beginning of planning to the mid-late stage of planning. By contrast, its comprehensive development degree leads a certain decline in the late stage of planning, but it still remains at about 0.6. The change in the coordination index (C) ofF(x) andF(y) can be divided into two stages: the rising stage lasts from the early stage of planning to the mid-stage of planning, whereas the decline stage lasts from the mid-stage of planning to the late stage of planning, where the rate of decline is relatively gentle. Figure 2 shows that these three trends are fairly consistent, i.e., an upward trend in the early and midstage of planning, followed by a relatively moderate decline in the late stage of planning.
3.4 Analysis of the Relative Changes in ECC and Pressure
In our study of the coupling coordination degree, we used an expression of the negative polarity of the environmental pressure caused by the development of the industrial park, i.e., a higher value indicated less pressure on the environment, which was the opposite of the ECC. To facilitate an in-depth analysis of the change in the industrial park’s ECC and pressure, and to determine the various factors involved withthe industrial park’s ECC and pressure, we used the price scissors method to analyze the polarity change in the index of the environmental pressure size, i.e., a lower value indicated less pressure on the environment. Thus, the polarity conversion at the higher levels of industrial park development aimed to detect a consistent trend in the ECC for analysis.
The recalculated values for the industrial park’s development level are summarized in Table 7. A larger value of a indicated a greater difference between the two changing trends. Curve Expert was used to fit the integrated scores of ()F xand (y)Fas follows.
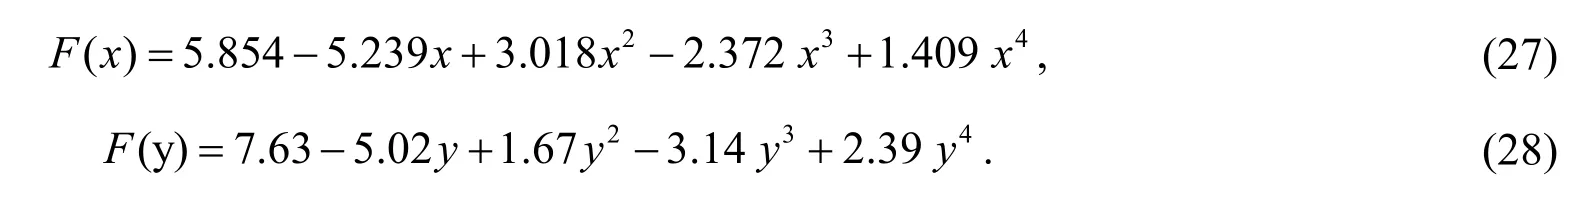
The price scissors formula was used to calculate the price scissors tangent value.
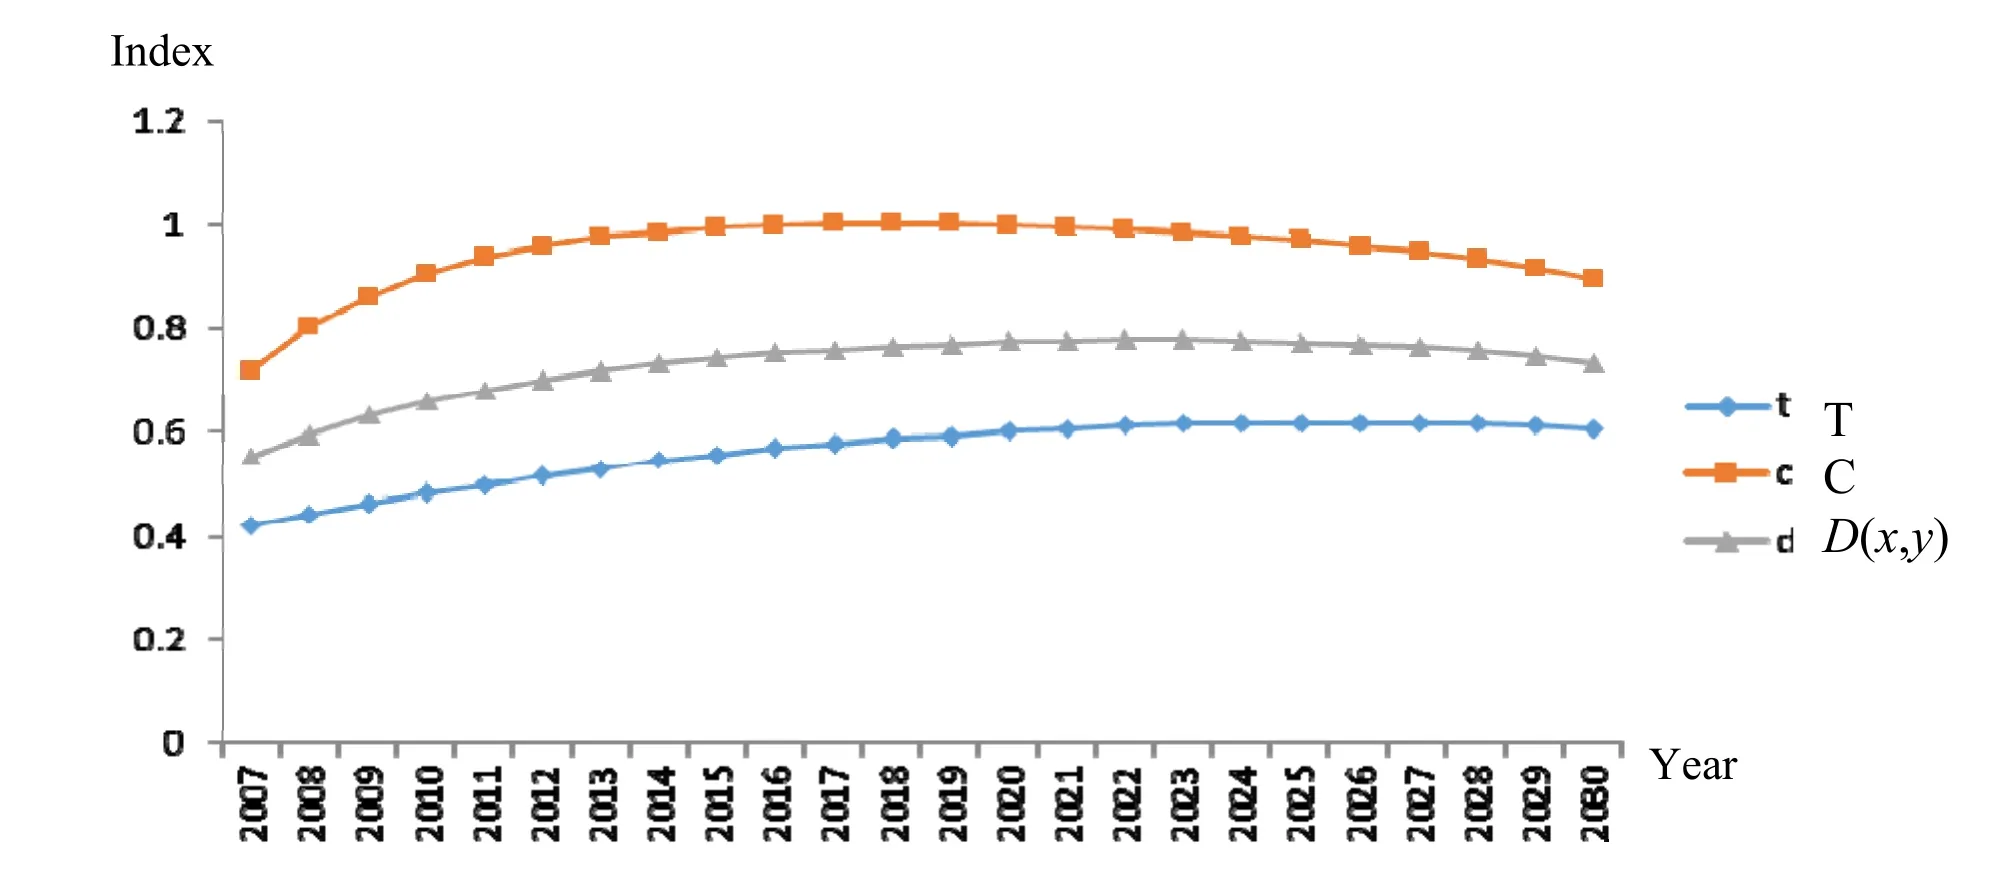
Fig. 2 Coupling coordination degree [D(x, y)], comprehensive development index (T), and coordination index (C) for the environmental carrying capacity and pressure in Fushan Industrial Park.
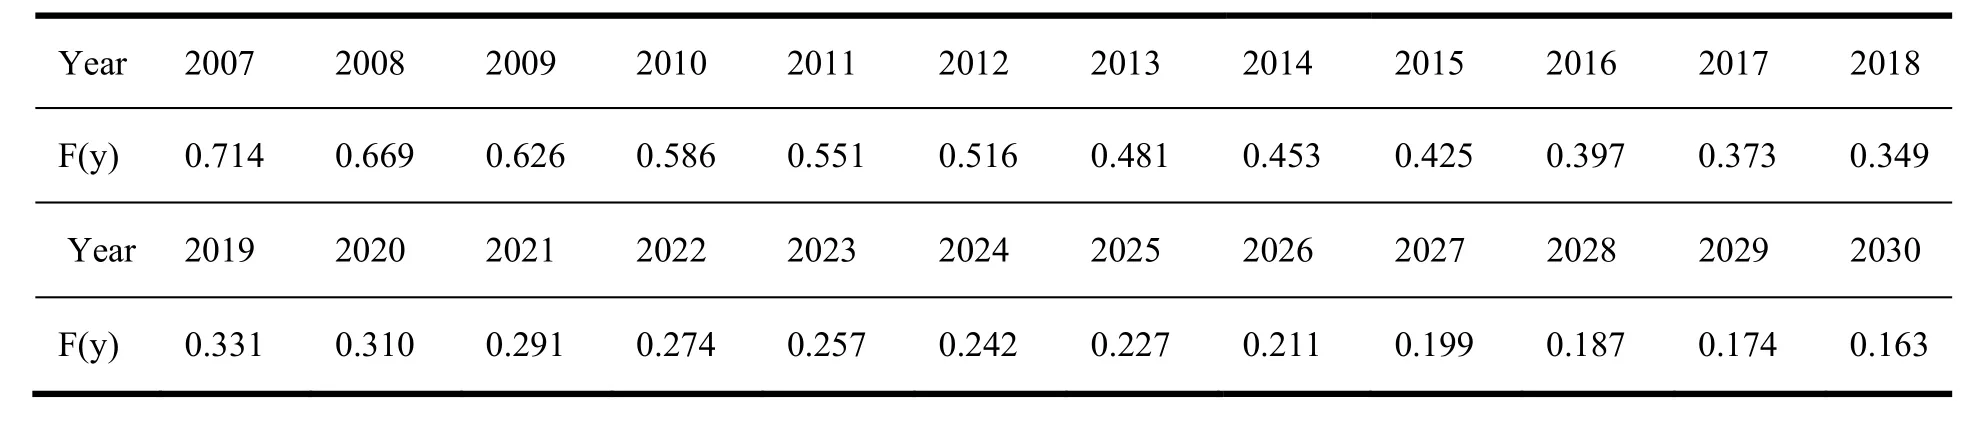
Table 7 Evaluation values for the ()F ydiversity factor
Thus, the price scissors and the change rate represent the overall evolutionary trend ofF(x) andF(y). As shown in Figures 3 and 4, the price scissors can be roughly divided into two stages, where the evaluation value rose from 0.25 in the early stage of planning to 1.43 in the mid-late stage of planning, with fluctuations in the terminal stage of planning. This demonstrates that there were opposite trendsF(x) andF(y). In the early stage of planning, the resource environment is in a relatively good condition whereas the socio-economic level is relatively undeveloped. Thus, the pressure of the social economy on the resource environment is relatively low while the constraints of the resource environment on the socialeconomy are relatively weak. By contrast, in the mid-late stage of planning,F(x) declines significantly andF(y) declines rapidly, which indicates that the socio-economic development of the industrial park occurs at the cost of damage to the resources and environment support capabilities to some extent. Nevertheless, the industrial park has taken effective measures to ensure environmental protection during its rapid development. However, the continued pressure of the industrial park’s economy and society results in a fluctuation in the price scissors, where the volatility of the underlying trend and the coordinating index is largely consistent, thereby revealing that there is potential space to reduce the pressure on the development of the industrial park.
In general, the planning of industrial park is reasonable through its planning period. However, more attention is needed in its late-stage when the coupling coordination degree of the ECC and Pressure. It is advanced for the industrial park to establish regulatory system for industrial park’s planning and development. Moreover, the economic development still largely depends on the supporting of its environmental capacity in present, the goals of environment and economy in each planning should be adjusted scientifically due to their coupling coordination conditions.
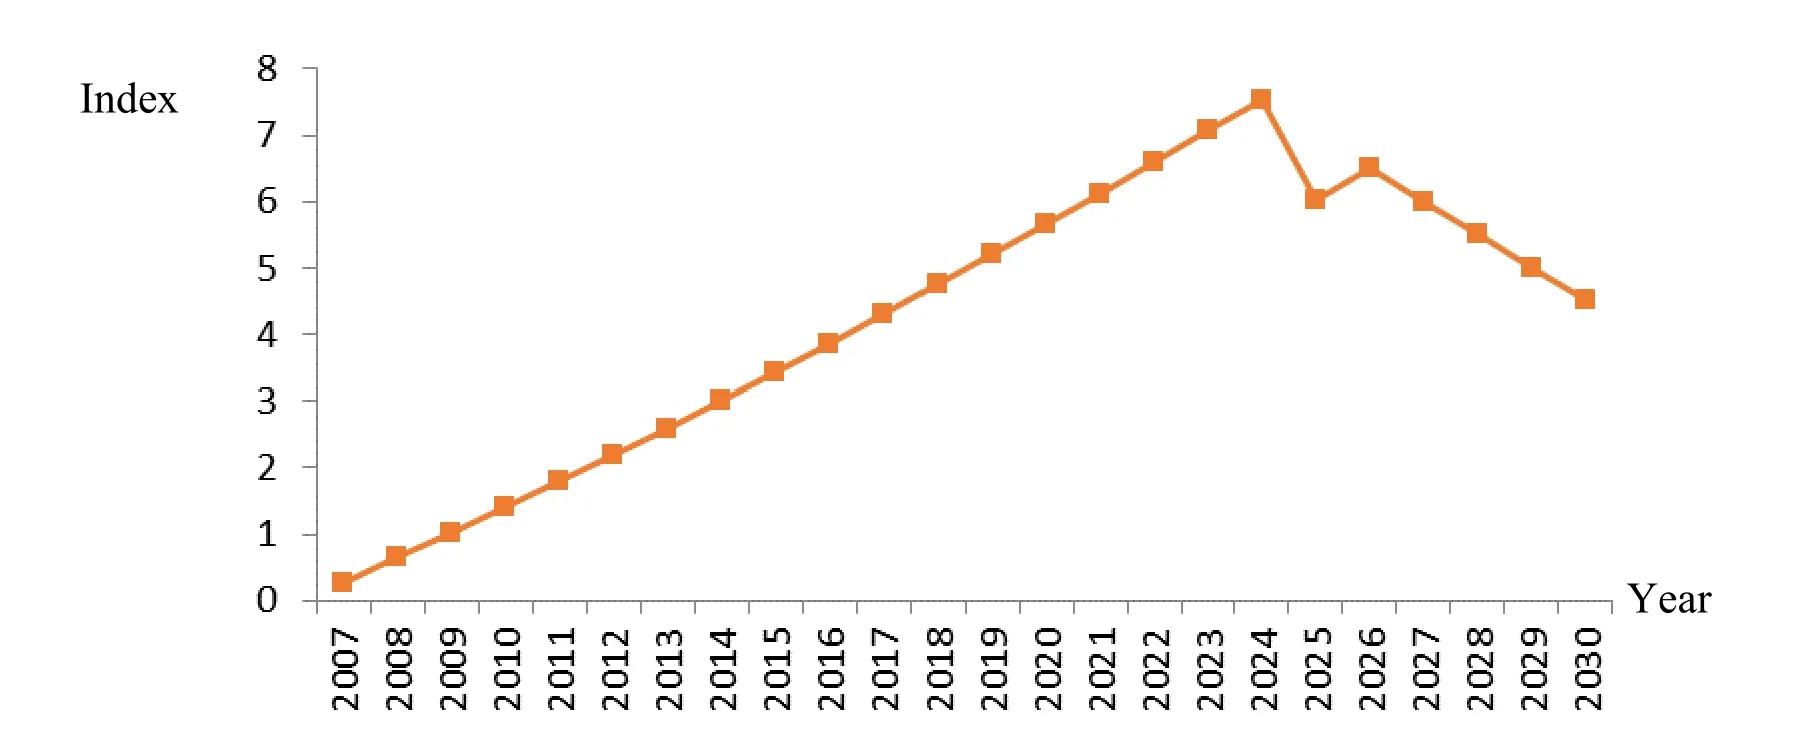
Fig. 3 Price scissors tangent value for the rates of evolution of the environmental carrying capacity and environmental pressure.

Fig. 4 Diversity factor evaluation values for the rates of evolution of the environmental carrying capacity and environmental pressure.
4 Conclusion
In this study, we established an analytical method for the industrial park ECC-pressure coupling coordination degree based on coupling coordination theory given the complexity of the industrial park. The application of this method facilitates the assessment of environmental pollution risk during the process of rapid development in an industrial park to support industrial park planning. Our evaluation results based on Fushan Industrial Park, Zhuhai showed that the coordination coupling degree exhibited a rapid upward trend from the early stage of planning until the mid-stage of planning, followed by a midlevel coordination degree of development at the mid-stage of planning, and a decline in the mid-late stage of planning, which was still maintained in the mid-level stage of coordination development. The price scissors method was used in this study to determine the ECC and pressure coupling relationship based on their respective evolutionary rates to identify the differences in their changes in direction. Compared with traditional coupling models, these two complementary methods provide a more comprehensive evaluation of the coupling relationship.
Acknowledgments
This work was financially supported by the National Ministry of Science and Technology (No. 2012BAC05B02) and the National Natural Science Foundation of China (No. 41271105).
[1] Graymore, M.L.M., Sipe, N.G., and Rickson, R.E. (2010), Sustaining Human Carrying Capacity: A tool for regional sustainability assessment,Ecological Economics,69(3), 459-468.
[2] Park, H.S., Rene, E.R., Choi, S.M., and Chiu, A.S.F. (2008), Strategies for sustainable development of industrial park in Ulsan, South Korea—From spontaneous evolution to systematic expansion of industrial symbiosis,Journal of Environmental Management, 87(1), 1-13.
[3] Kim, S.H., Yoon, S. G., Chae, S.H., and Park, S. (2010), Economic and environmental optimization of a multi-site utility network for an industrial complex,Journal of Environmental Management, 91(3), 690-705.
[4] Zhu, Y.H., Drake, S., Lü, H.S., and Xia, J. (2010), Analysis of Temporal and Spatial Differences in Eco-environmental Carrying Capacity Related to Water in the Haihe River Basins, China,Water Resources Management, 24(6), 1089-1105.
[5] Tehrani, N.A. and Makhdoum, M.F. (2013), implementing a spatial model of Urban Carrying Capacity Load Number (UCCLN) to monitor the environmental loads of urban ecosystems. Case study: Tehran metropolis,Ecological Indicators, 32, 197-211.
[6] Gong, L. and Jin, C.L. (2009), Fuzzy Comprehensive Evaluation for Carrying Capacity of Regional Water Resources,Water Resource Management, 23, 2505-2513.
[7] Arce, R. and Gullon, N. (2000). The application of strategic environmental assessment to sustainability assessment of infrastructure development,Environment Impact Assessment Review, 20, 393-402.
[8] Liu, X. Z., Helig, G.K., Chen, J.M., and Heino, M. (2007), Interactions between economic growth and environmental quality in Shenzhen, China's first special economic zone,Ecological Economics, 62, 559-570.
[9] Wang, Q., Wang, R.Q., Tian, C.Y., Yu, Y., Zhang, Y.L., and Dai, J.L. (2012), Using microbial community functioning as the complementary environmental condition indicator: A case study of an iron deposit tailing area,European Journal of Soil Biology, 51, 22-29.
[10] Xu, L.Y., Kang, P., and Wei, J.J. (2010), Evaluation of urban ecological carrying capacity: a case study of Beijing, China,International Society for Environmental Information Sciences 2010 Annual Conference (ISEIS).1762-1770.
[11] Jin, W., Xu, L.Y., and Yang, Z.F. (2009). Modeling a policy making framework for urban sustainability: Incorporating system dynamics into the Ecological Footprint,Ecological Economics, 68, 2938-2949.
[12] Xu, L.Y. and Kang, P. (2013), Evaluation of environment carrying capacity on development planning of an industrial park,Acta Scientiae Circumstantiae, 33 (3), 918-930 (in Chinese with English Abstract).
[13] Stigebrandt, A., (2011). Carrying capacity: general principles of model construction,Aquaculture Research, 42, 41-50.
[14] Li,Y.F., Li, Y., Zhou, Y., Shi, Y. l., and Zhu, X.D.(2012). Investigation of a coupling model of coordination between urbanization and the environment,Journal of Environmental Management, 98, 127-133.
2 September 2013
?Corresponding author.
Email address: xly@bnu.edu.cn (L.Y. Xu).
ISSN 2325-6192, eISSN 2325-6206/$- see front materials ? 2013 L&H Scientific Publishing, LLC. All rights reserved.
10.5890/JEAM.2013.11.004
Accepted 8 November 2013
Available online 1 January 2014
 Journal of Environmental Accounting and Management2013年4期
- Journal of Environmental Accounting and Management的其它文章
- Integrating Environmental Accounting, Life Cycle and Ecosystem Services Assessment
- Assessing the Environmental Performance and Sustainability of National Agricultural Systems
- Emergy Analysis of a Biomass Direct-fired Power Plant in Inner Mongolia of China
- Spatial Accounting of Environmental Pressure and Resource Consumption Using Night-light Satellite Imagery
- SWOC Analysis on CCS: A Case for Oxy-fuel Combustion CO2Capture System